Report


A Real Estate Update for Pooler, Savannah, Richmond Hill, and Tybee Island.
MID-YEAR 2023
Market
#1
BROKERAGE IN THE LOWCOUNTRY
for closed sales volume and transactions since 2000.
#1
LUXURY BROKERAGE IN THE LOWCOUNTRY
for closed sales volume and transactions of $1 Million plus properties.
#2 BROKERAGE IN SOUTH CAROLINA for closed sales volume.
500 TOP RANKED IN THE TOP 500 BROKERAGES IN THE U.S. by sales volume and transaction sides.
$1.6B
2022 COMPANY SALES VOLUME YTD
2 CHARTERONEREALTY.COM
2022 Accolades

3 CHARTERONEREALTY.COM
10 Office Locations Across the Coastal Empire and Lowcountry Over 150 Sales Associates And More Than 50 Service Professionals Several Years in a Row Voted Best Real Estate Company
Office Locations
SAVANNAH MULTI-LIST CORPORATION
Market Overview
MID-YEAR 2023 RECAP
Temperatures are heating up, yet the U.S. housing market remains cooler than usual for this time of year due to a combination of low inventory and higher borrowing costs, which have restricted market activity going into the summer homebuying season. According to the latest data from the National Association of REALTORS® (NAR), national existing-home sales climbed 0.2% from the previous month but were down 20.4% compared to the same time last year, as fluctuating mortgage rates and a near all-time low level of inventory continue to influence home sales.
New Listings in the Savannah Area REALTORS® service area decreased 12.7 percent to 1,007. Pending Sales decreased 8.0 percent to 872. Inventory decreased 6.3
percent to 1,503. Median Sales Price increased 6.3 percent from $315,000 to $335,000. Days on Market increased 40.6 percent to 45. Months Supply of Inventory increased 11.8 percent to 1.9.
Nationwide, total housing inventory increased 3.8% from the previous month, for a 3-month’s supply at the current sales pace. The shortage of homes for sale has kept prices high for remaining buyers, with a national median sales price of $396,100 as of last measure, a 3.1% decline from the same time last year and the largest annual decrease since December 2011, according to NAR. As demand continues to outpace supply, are selling quickly, with the majority of homes listed for sale on the market for less than a month.
4 CHARTERONEREALTY.COM
Current as of July 5, 2023. All data from the Savannah Multi-List Corporation | Report © 2023 ShowingTime
Quick Facts -16.2% +15.3% +11.3% +33.8% Change in Closed Sales 12-Month Average Change in Days on Market 12-Month Average Change in Median Sales Price 12-Month Average Change in Months Supply of Inventory 12-Month Average

MULTI-LIST CORPORATION
Market Overview
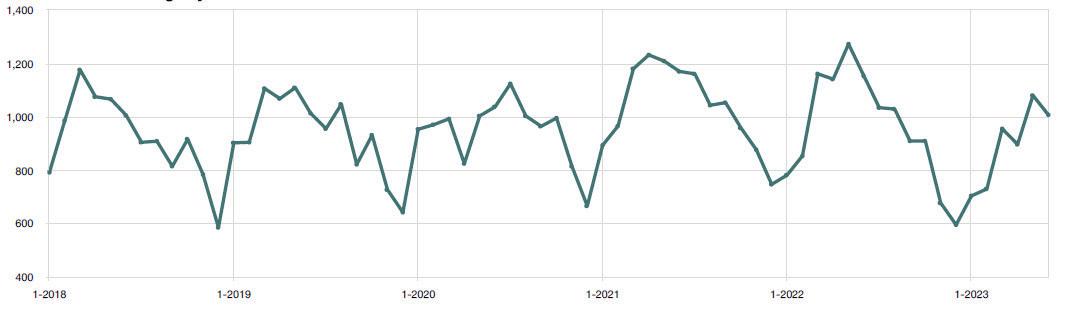
New Listings
Historical New Listings by Month
6 CHARTERONEREALTY.COM
Month # of New Listings # of New Listings Prior Year % Change July 2022 1,034 1,161 -10.9% August 2022 1,029 1,043 -1.3% September 2022 909 1,053 -13.7% October 2022 909 958 -5.1% November 2022 676 876 -22.8% December 2022 594 746 -20.4% January 2023 703 781 -10.0% February 2023 729 853 -14.5% March 2023 955 1,161 -17.7% April 2023 896 1,141 -21.5% May 2023 1,080 1,273 -15.2% June 2023 1,007 1,153 -12.7% 12-Month Avg 877 1,017 -13.8%
SAVANNAH
Current as of July 5, 2023. All data from the Savannah Multi-List Corporation | Report © 2023 ShowingTime
SAVANNAH MULTI-LIST CORPORATION
Pending Sales
Historical Pending Sales by Month
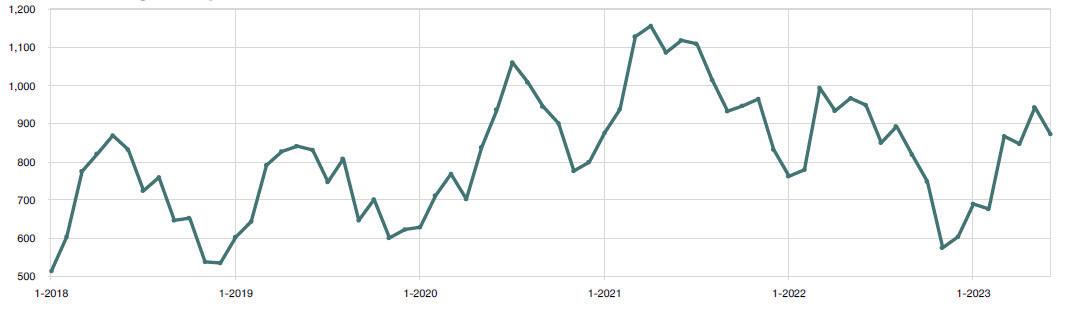
7 CHARTERONEREALTY.COM Month # of Pending Sales # of Pending Sales Prior Year % Change July 2022 849 1,109 -23.4% August 2022 892 1,014 -12.0% September 2022 818 932 -12.2% October 2022 747 946 -21.0% November 2022 573 964 -40.6% December 2022 602 831 -27.6% January 2023 688 761 -9.6% February 2023 675 778 -13.2% March 2023 866 993 -12.8% April 2023 846 933 -9.3% May 2023 942 966 -2.5% June 2023 872 948 -8.0% 12-Month Avg 781 931 -16.1%
Market Overview
Current as of July 5, 2023. All data from the Savannah Multi-List Corporation | Report © 2023 ShowingTime
Market Overview
Closed Sales
Historical Closed Sales by Month
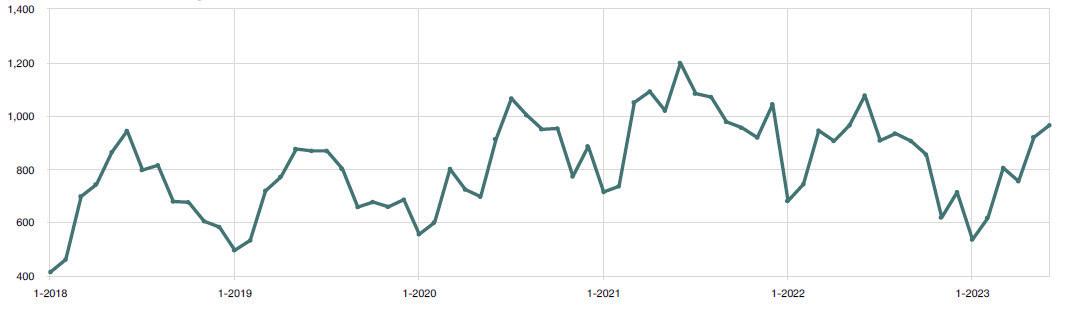
8 CHARTERONEREALTY.COM Month # of Closed Sales # of Closed Sales Prior Year % Change July 2022 907 1,083 -16.3% August 2022 933 1,070 -12.8% September 2022 905 977 -7.4% October 2022 854 955 -10.6% November 2022 618 918 -32.7% December 2022 713 1,043 -31.6% January 2023 535 680 -21.3% February 2023 616 743 -17.1% March 2023 804 944 -14.8% April 2023 754 905 -16.7% May 2023 919 964 -4.7% June 2023 964 1,076 -10.4 12-Month Avg 794 947 -16.2%
Current as of July 5, 2023. All data from the Savannah Multi-List Corporation | Report © 2023 ShowingTime
SAVANNAH MULTI-LIST CORPORATION
Days on Market Until Sale
Historical Days on Market Until Sale by Month
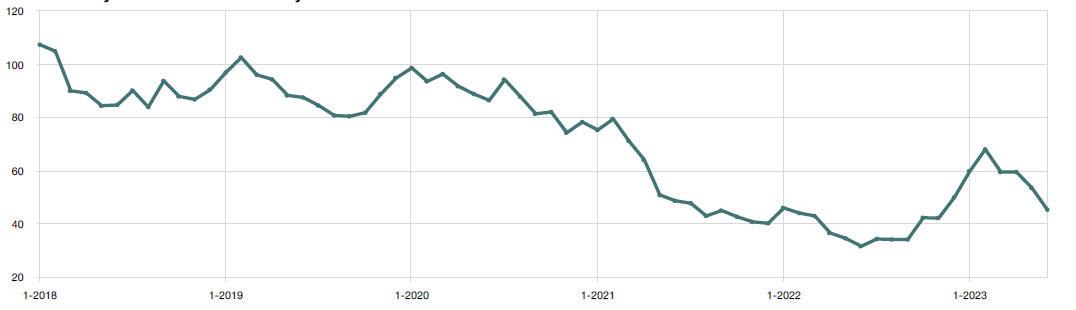
9 CHARTERONEREALTY.COM Market Overview SAVANNAH MULTI-LIST CORPORATION Month Days on Market Days on Market Prior Year % Change July 2022 34 48 -29.2% August 2022 34 43 -20.9% September 2022 34 45 -24.4% October 2022 42 43 -2.3% November 2022 42 41 2.4% December 2022 50 40 25.0% January 2023 60 46 30.4% February 2023 68 44 54.5% March 2023 59 43 37.2% April 2023 59 37 59.5% May 2023 54 35 54.3% June 2023 45 32 40.6% 12-Month Avg 47 41 15.3%
Current as of July 5, 2023. All data from the Savannah Multi-List Corporation | Report © 2023 ShowingTime
Market Overview
Median Sales Price
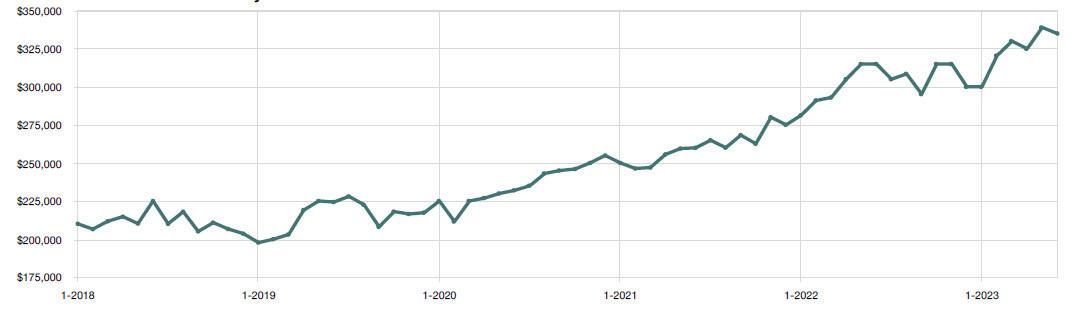
Historical Median Sales Price by Month
10 CHARTERONEREALTY.COM Month Median Sales Price Median Sales Price Prior Year % Change July 2022 $304,990 $264,900 15.1% August 2022 $308,500 $260,000 18.7% September 2022 $295,200 $268,245 10.0% October 2022 $315,000 $262,590 20.0% November 2022 $315,000 $280,000 12.5% December 2022 $300,000 $275,000 9.1% January 2023 $300,000 $281,288 6.7% February 2023 $320,495 $291,000 10.1% March 2023 $330,000 $292.990 12.6% April 2023 $325,000 $305,000 6.6% May 2023 $339,000 $315,000 7.6% June 2023 $335,000 $315,000 6.3% 12-Month Avg $315,000 $283,110 11.3%
SAVANNAH MULTI-LIST CORPORATION Current as of July 5, 2023. All data from the Savannah Multi-List Corporation | Report © 2023 ShowingTime
Average Sales Price
Historical Average Sales Price by Month
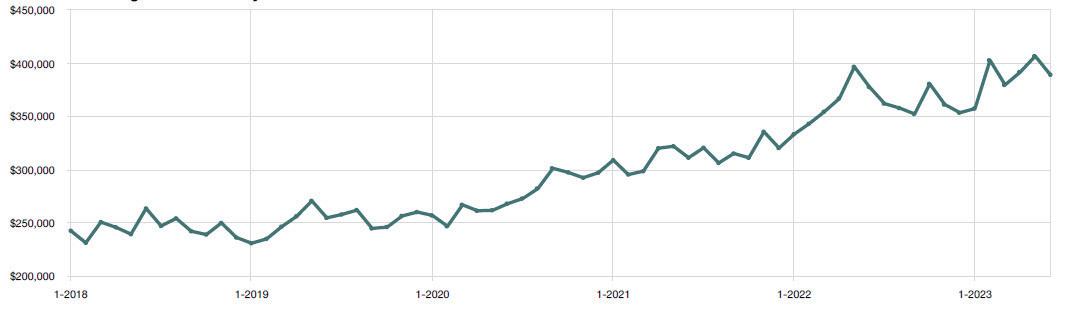
11 CHARTERONEREALTY.COM Market Overview SAVANNAH MULTI-LIST CORPORATION Month Average Sales Price Average Sales Price Prior Year % Change July 2022 $361,875 $320,440 12.9% August 2022 $357,676 $306,169 16.8% September 2022 $352,158 $315,073 11.8% October 2022 $380,377 $311,041 22.3% November 2022 $361,003 $335,426 7.6% December 2022 $353,339 $320,132 10.4% January 2023 $357,187 $333,078 7.2% February 2023 $402,486 $343,015 17.3% March 2023 $379,448 $354,155 7.1% April 2023 $391,397 $366,578 6.8% May 2023 $406,411 $396,384 2.5% June 2023 $388,925 $377,472 3.0% 12-Month Avg $374,726 $339,590 10.3%
Current as of July 5, 2023. All data from the Savannah Multi-List Corporation | Report © 2023 ShowingTime
Percent of List Price Received

Historical
Percent of List Price Received by Month
12 CHARTERONEREALTY.COM Month % of List Price Received % of List Price Received Prior Year % Change July 2022 100.5% 100.5% 0.0% August 2022 99.6% 100.0% -0.4% September 2022 99.6% 99.9% -0.3% October 2022 98.8% 100.0% -1.2% November 2022 98.4% 99.6% -1.2% December 2022 98.3% 100.3% -2.0% January 2023 97.7% 100.1% -2.4% February 2023 98.1% 100.6% -2.5% March 2023 98.5% 101.2% -2.7% April 2023 99.3% 102.3% -2.9% May 2023 99.6% 102.3% -2.6% June 2023 99.6% 101.8% -2.2% 12-Month Avg 99.1% 100.7% -1.6%
SAVANNAH MULTI-LIST CORPORATION Current as of July 5, 2023. All data from the Savannah Multi-List Corporation | Report © 2023 ShowingTime
Market Overview
Inventory of Homes for Sale
Historical Inventory of Homes for Sale by Month
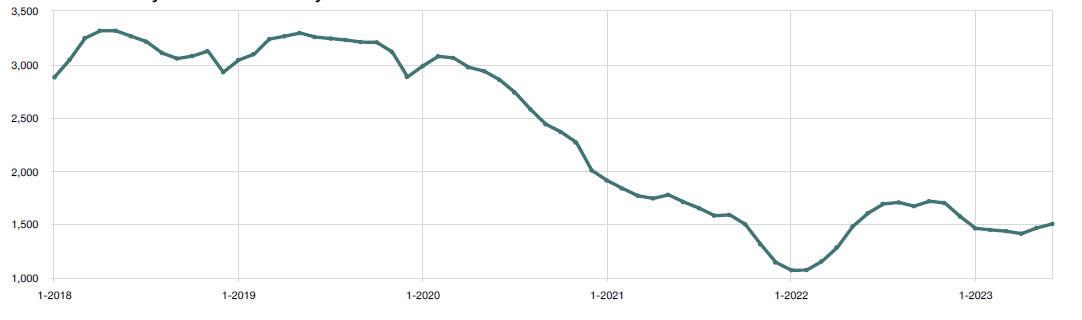
13 CHARTERONEREALTY.COM Market Overview SAVANNAH MULTI-LIST CORPORATION Month # of Homes For Sale # of Homes For Sale Prior Year % Change July 2022 1,691 1,651 2.4% August 2022 1,705 1,581 7.8% September 2022 1,670 1,588 5.2% October 2022 1,716 1,500 14.4% November 2022 1,700 1,313 29.5% December 2022 1,573 1,142 37.7% January 2023 1,462 1,069 36.8% February 2023 1,447 1,070 35.2% March 2023 1,435 1,152 24.6% April 2023 1,412 1,283 10.1% May 2023 1,466 1,479 -0.9% June 2023 1,503 1,604 -6.3% 12-Month Avg 1,565 1,369 14.3%
Current as of July 5, 2023. All data from the Savannah Multi-List Corporation | Report © 2023 ShowingTime
Market
Overview
Months Supply of Inventory
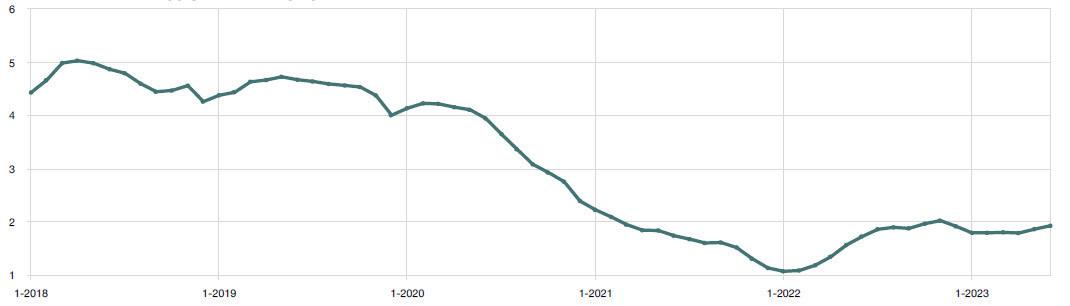
14 CHARTERONEREALTY.COM Month Months Supply of Inventory Months Supply of Inventory Prior Year % Change July 2022 1.9 1.7 11.8% August 2022 1.9 1.6 18.8% September 2022 1.9 1.6 18.8% October 2022 2.0 1.5 33.3% November 2022 2.0 1.3 53.8% December 2022 1.9 1.1 72.7% January 2023 1.8 1.1 63.6% February 2023 1.8 1.1 63.6% March 2023 1.8 1.2 50.0% April 2023 1.8 1.3 38.5% May 2023 1.9 1.6 18.8% June 2023 1.9 1.7 11.8% 12-Month Avg 1.9 1.4 33.8%
Historical Months Supply of Inventory by Month THE LOWCOUNTRY Current as of July 5, 2023. All data from the Savannah Multi-List Corporation | Report © 2023 ShowingTime
Key Metrics - Single Family Home

Pooler
Key Metrics - Condo/Townhouse
Current as of July 5, 2023. All data from the Savannah Multi-List Corporation | Report © 2023 ShowingTime
15 CHARTERONEREALTY.COM
Mid-Year 2022 Mid-Year 2023 Percent Change New Listings 446 398 -10.8% Pending Sales 355 413 16.3% Closed Sales 349 368 5.4% Days on Market 36 67 86.1% Median Sales Price $341,000 $387,990 13.8% Average Sales Price $377,499 $416,185 10.2% % of List Price Received 102.3% 99.1% -3.1%
Mid-Year 2022 Mid-Year 2023 Percent Change New Listings 95 80 -15.8% Pending Sales 67 91 35.8% Closed Sales 64 79 23.4% Days on Market 36 89 147.2% Median Sales Price $262,490 $299,990 14.3% Average Sales Price $305,232 $324,073 6.2% % of List Price Received 102.6% 98.9% -3.6%
Richmond Hill

Key Metrics - Single Family Home
Key Metrics - Condo/Townhouse
16 CHARTERONEREALTY.COM
Mid-Year 2022 Mid-Year 2023 Percent Change New Listings 733 536 -26.9% Pending Sales 631 496 -21.4% Closed Sales 613 484 -21.0% Days on Market 44 70 59.1% Median Sales Price $375,00 $408,740 9.0% Average Sales Price $427,566 $466,231 9.0% % of List Price Received 102.1% 98.6% -3.4%
Mid-Year 2022 Mid-Year 2023 Percent Change New Listings 75 44 -41.3% Pending Sales 59 45 -23.7% Closed Sales 73 45 -38.4% Days on Market 24 40 66.7% Median Sales Price $243,948 $289,053 18.5% Average Sales Price $259,440 $294,073 13.3% % of List Price Received 103.9% 102.1% -1.7%
Current as of July 5, 2023. All data from the Savannah Multi-List Corporation | Report © 2023 ShowingTime
Key Metrics - Single Family Home Savannah
Key Metrics - Condo/Townhouse

17 CHARTERONEREALTY.COM Current as of July 5, 2023. All data from the Savannah Multi-List Corporation | Report © 2023 ShowingTime
Mid-Year 2022 Mid-Year 2023 Percent Change New Listings 428 399 -6.8% Pending Sales 351 367 +4.6% Closed Sales 330 359 +8.8% Days on Market 33 43 +30.3% Median Sales Price $220,000 $280,000 +27.3% Average Sales Price $325,061 $416,921 +28.3% % of List Price Received 101.2% 99.0% -2.2% Mid-Year 2022 Mid-Year 2023 Percent Change New Listings 2,263 1,737 -23.2% Pending Sales 1,973 1,483 -24.8% Closed Sales 2,001 1,445 -27.8% Days on Market 39 47 +20.5% Median Sales Price $315,000 $348,000 +10.5% Average Sales Price $404,073 $433,700 +7.3% % of List Price Received 101.4% 98.9% -2.5%
Key Metrics - Single Family Home
Tybee Island
Key Metrics - Condo/Townhouse

18 CHARTERONEREALTY.COM
Mid-Year 2022 Mid-Year 2023 Percent Change New Listings 154 157 1.9% Pending Sales 148 103 -30.4% Closed Sales 149 103 -30.9% Days on Market 114 69 -39.5% Median Sales Price $650,000 $813,650 25.2% Average Sales Price $803,139 $925,060 15.2% % of List Price Received 96.1% 94.7% -1.5%
Mid-Year 2022 Mid-Year 2023 Percent Change New Listings 118 80 -32.2% Pending Sales 129 71 -45.0% Closed Sales 129 72 -44.2% Days on Market 99 49 -50.5% Median Sales Price $413,000 $482,500 16.8% Average Sales Price $448,484 $561,256 25.1% % of List Price Received 98.4% 98.6% 0.2%
Current as of July 5, 2023. All data from the Savannah Multi-List Corporation | Report © 2023 ShowingTime

#1 Real Estate Brokerage in the Lowcountry


We Sell A Property Every 5 Hours*
*This information is based on data provided by Resides MLS. Resides MLS does not guarantee and is not in any way responsible for its accuracy. Data provided by Resides MLS may not reflect all real estate activity in the market. Based on Charter One Realty’s 2023 YTD Closed transactions.
20 CHARTERONEREALTY.COM
VOLUME BY COMPANY FOR ALL HILTON HEAD ISLAND & MAINLAND AREAS CLOSED BETWEEN 01/01/2023 & 06/30/2023
SALES
COMPANY #2 COMPANY #3 COMPANY #4 COMPANY #5 COMPANY #6 COMPANY #7 COMPANY #8 COMPANY #9 COMPANY #10 $808 Million ($808,920,804) $183M $147M $144M $144M $131M $129M $115M $98M $335M
21 CHARTERONEREALTY.COM Shown in Number of Buyer Purchases January 2023 - June 2023 Representing More $1 Million Plus Buyers Than Any Other Brokerage In The Lowcountry COMPANY #2 COMPANY #3 COMPANY #4 COMPANY #5 49 23 22 20 102 Shown in Number of Seller Transactions January 2023 - June 2023 Representing More $1 Million Plus Sellers Than Any Other Brokerage In The Lowcountry BROKERAGE IN THE LOWCOUNTRY COMPANY #2 COMPANY #3 COMPANY #4 COMPANY #5 31 21 19 17 147

22 CHARTERONEREALTY.COM REAL ESTATE WEBSITEVisited#1 IN THE LOWCOUNTRY CharterOneRealty.com
IS NOT ABOUT BEING ONLINE - IT IS ABOUT BEING FOUND ONLINE.
We continue to push boundaries and learn new techniques to drive the most relevant buyers to CharterOneRealty.com maximizing the potential for your property to be found quickly on the web. Our innovative online marketing campaigns place us in top positions on all search engines, which means that when your property is listed with Charter One Realty, it will receive maximum exposure ensuring your listing is seen by engaged and qualified buyers. *This information is based on data provided by SimilarWeb from January 1, 2021 - December 31, 2022. The content, data, and other information contained and provided on or through the product is for informational purposes only. Such information is believed to be reliable; however, SimilarWeb does not warrant its accuracy, timeliness, or completeness.

23 CHARTERONEREALTY.COM
IT
VISITOR TRAFFIC FROM JANUARY - DECEMBER 2022 Top 10 local brokerage websites as ranked by visitors.* Our Effective Print & Digital Techniques Produce 0 CharterOneRealty.com CollinsGroupRealty.com HiltonHeadRealEstateS.com EraEvergreen.com HomesonHiltonHead.com LowcountryRealEstate.com TheAllianceGroupRealty.com Weichertcp.com HiltonHeadHomes.com NUMBER OF WEBSITE VISITORS TheHomesFinder.com 250,000 350,000 450,000 550,000 650,000 750,000 Found on Page #1 of Search Engines
Website Visitors in 2022
Pageviews in 2022
WEBSITE
Nearly 1 Million
1.8 Million+
UNRIVALED CONNECTIONS
Charter One Realty is the ONLY brokerage in the Lowcountry with three Luxury Affiliations.
LEADING REAL ESTATE COMPANIES OF THE WORLD *
Selling more homes than any other national real estate organization, the brokers that make up this network excel because of their ability to make referrals to one another with ease and frequency. Leading Real Estate Companies of the World brokers are ranked #1 in more top US markets than any franchise and represent properties in ALL price ranges.
Charter One Realty residential listings are promoted on LeadingRE.com, found from 550 affiliate websites throughout 73 countries, and showcased to more than 136,000 associates worldwide.

LUXURY PORTFOLIO INTERNATIONAL **
The unified collection of the world’s most experienced, respected and well-known experts in luxury real estate, this powerful network participates in more transactions than any other national franchise or global real estate organization. 200 luxury affiliates | 55 countries | LuxuryPortfolio.com | For listings $1 Million and up

Charter One Realty's $1M+ residential listings are posted on LuxuryPortfolio.com and displayed on key websites worldwide, including The Wall Street Journal, Mansion Global, MarketWatch, Barron’s, Penta online, Juwai, YouTube, WeChat, Country Life, JamesEdition, Expansion, and Bloomberg Property Listings.
WHO’S WHO IN LUXURY REAL ESTATE *
For over 36 years, Who’s Who in Luxury Real Estate has represented the world’s top high-end real estate professionals from both independent and franchised companies and provided them with the best possible marketing tools and connections to the best luxury real estate professionals around the world. For listings $500,000 and up.
Charter One Realty residential listings ($500K+) are promoted on LuxuryRealEstate. com and found from 450+ affiliate websites throughout 50 countries and showcased to more than 130,000 associates worldwide.
* Reserved for properties listed at $500,000 and above. ** Reserved for properties listed at $1,000,000 and above.
24 CHARTERONEREALTY.COM


25 CHARTERONEREALTY.COM And Displayed on Key Websites Around The World When Your Property is Listed with Charter One Realty it is Posted on LuxuryPortfolio.com** More than 3 million affluent consumers visit the flagship website, LuxuryPortfolio.com, every year to browse in a setting dedicated solely to significant properties and a discerning lifestyle. LUXURY PORTFOLIO INTERNATIONAL MEDIA KIT 2023 | 24 Syndications & Websites promotion properties automatically additional your listing and marketing plan seller. luxuryportfolio.com to sync websites; see pricing wsj.com marketwatch.com juwai.com leadingre.com WeChat mansionglobal.com jamesedition.com expansion.mx barrons.com and Penta online countrylife.co.uk propertylistings.ft.com
CHARTER ONE REALTY
11 & 5 Park Lane, Hilton Head 843-785-4460
CHARTER ONE REALTY BEACH MARKET
2 N Forest Beach Drive, Suite 119, Hilton Head 843-785-1115
CHARTER ONE REALTY NORTH
200 Merchant Street, Hilton Head 843-681-3307
CHARTER ONE REALTY PROMENADE
1 Promenade Street, Suite 101, Bluffton 843-815-0055
CHARTER ONE REALTY COMMERCIAL
1 Promenade Street, Suite 101, Bluffton 843-815-0055
CHARTER ONE REALTY BELFAIR

2 Belfair Oaks Boulevard, Bluffton 843-757-7710
CHARTER ONE REALTY BERKELEY HALL
1024 Berkeley Hall Boulevard, Bluffton 843-815-8400
CHARTER ONE REALTY SUN CITY
10 William Pope Drive, Bluffton 843-705-2830
CHARTER ONE REALTY BEAUFORT
203A Carteret Street, Beaufort 843-379-4460
CHARTER ONE REALTY SAVANNAH QUARTERS
100 Blue Moon Xing #114, Pooler, GA 31322 912-450-2300
charteronerealty.com
RANKED AMONG THE TOP 500 BROKERAGES IN THE U.S.

