
MARKET
REPORT 2023 MID-YEAR #1 Ranked Real Estate Company in The Lowcountry CHARTER ONE REALT Y
BEAUFORT | HILTON HEAD ISLAND | MAINLAND | THE ISLANDS
#1
BROKERAGE IN THE LOWCOUNTRY
for closed sales volume and transactions since 2000.
#1
LUXURY BROKERAGE IN THE LOWCOUNTRY
for closed sales volume and transactions of $1 Million plus properties.
#2 BROKERAGE IN SOUTH CAROLINA for closed sales volume.
500 TOP RANKED IN THE TOP 500 BROKERAGES IN THE U.S. by sales volume and transaction sides.
$1.5B
2022 COMPANY SALES VOLUME
2 CHARTERONEREALTY.COM
2022 Accolades

10 Office Locations Across the Coastal Empire and Lowcountry Over 170 Sales Associates And More Than 40 Service Professionals Several Years in a Row Voted Best Real Estate Company
Office Locations
Market Overview
Key Metrics
Quick Facts
-9.0% +50% +6.2% +35.3%
4 CHARTERONEREALTY.COM
THE LOWCOUNTRY Mid-Year 2022 Mid-Year 2023 Percent Change New Listings 3,998 3,328 - 16.8% Pending Sales 3,378 2,927 - 13.4% Closed Sales 3,132 2,653 - 15.3% Days on Market 98 147 + 50.0% Median Sales Price $475,960 $505,038 + 6.1% Average Sales Price $697,303 $700,433 + 0.4% % of List Price Received 100.4% 98.1% - 2.3%
Change in Closed Sales 12-Month Average Change in Days on Market 12-Month Average
This information is based on data provided by Resides MLS. Resides MLS does not guarantee and is not in any way responsible for its accuracy. Data provided by Resides MLS may not reflect all real estate activity in the market.
Change in Median Sales Price 12-Month Average Change in Months Supply of Inventory 12-Month Average
New Listings
New Listings


5 CHARTERONEREALTY.COM Month # of New Listings # of New Listings Prior Year % Change July 2022 593 632 -6.2% August 2022 524 666 -21.3% September 2022 492 615 -20.0% October 2022 531 553 -4.0% November 2022 473 474 December 2022 338 402 -15.9% January 2023 462 471 -1.9% February 2023 471 574 -17.9% March 2023 665 820 -18.9% April 2023 517 691 -25.2% May 2023 613 775 -20.9% June 2023 600 667 -10.0% 12-Month Avg 523 612 -14.5%
Prior YearPercent Change July 2022 593632-6.2% August 2022 524666-21.3% September 2022 492615-20.0% October 2022 531553-4.0% November 2022 473474-0.2% December 2022 338402-15.9% January 2023 462471-1.9% February 2023 471574-17.9% March 2023 665820-18.9% April 2023 517691-25.2% May 2023 613775-20.9% June 2023 600667-10.0% 12-Month Avg 523612-14.5% Historical New Listings by Month Current as of July 10, 2023. Data © 2023 REsides, INC. All Rights Reserved. | Sponsored by South Carolina REALTORS®. Report © 2023 ShowingTime. 3 A count of the properties that have been newly listed on the market in a given month. New Listings 695 667 600 2021 2022 2023 June 200 400 600 800 1,000 01-200801-200901-201001-201101-201201-201301-201401-201501-201601-201701-201801-201901-202001-202101-202201-2023 4,336 3,998 3,328 2021 2022 2023 Year to Date -16.8% -4.0%-10.0% -7.8% -6.6% + 15.9% Historical
Listings
Market Overview THE LOWCOUNTRY This information is based on data provided by Resides MLS. Resides MLS does not guarantee and is not in any way responsible for its accuracy. Data provided by Resides MLS may not reflect all real estate activity in the market.
New
by Month
Pending Sales
Historical Pending Sales by Month
6 CHARTERONEREALTY.COM Month # of Pending Sales # of Pending Sales Prior Year % Change July 2022 410 525 -21.9% August 2022 521 603 -13.6% September 2022 404 582 -30.6% October 2022 379 561 -32.4% November 2022 370 549 -32.6% December 2022 291 422 -31.0% January 2023 427 509 -16.1% February 2023 468 529 -11.5% March 2023 524 675 -22.4% April 2023 496 557 -11.0% May 2023 535 630 -15.1% June 2023 477 478 -0.2% 12-Month Avg 442 552 -19.9%
Pending Sales
Market Overview THE LOWCOUNTRY This information is based on data provided by Resides MLS. Resides MLS does not guarantee and is not in any way responsible for its accuracy. Data provided by Resides MLS may not reflect all real estate activity in the market.
Pending Sales Prior YearPercent Change July 2022 410525-21.9% August 2022 521603-13.6% September 2022 404582-30.6% October 2022 379561-32.4% November 2022 370549-32.6% December 2022 291422-31.0% January 2023 427509-16.1% February 2023 468529-11.5% March 2023 524675-22.4%
2023 496557-11.0%
2023 535630-15.1% June 2023 477478-0.2% 12-Month Avg 442552-19.9% Historical Pending Sales by Month Current as of July 10, 2023. Data © 2023 REsides, INC. All Rights Reserved. | Sponsored by South Carolina REALTORS®. | Report © 2023 ShowingTime. | 4 A count of the properties on which offers have been accepted in a given month. 623 478 477 2021 2022 2023 June 0 200 400 600 800 1,000 01-200801-200901-201001-201101-201201-201301-201401-201501-201601-201701-201801-201901-202001-202101-202201-2023 4,317 3,378 2,927 2021 2022 2023 Year to Date -13.4% -23.3%-0.2% -21.8% -28.2% + 36.4%
April
May
Closed Sales
Historical Closed Sales by Month
7 CHARTERONEREALTY.COM Month # of Closed Sales # of Closed Sales Prior Year % Change July 2022 480 636 -24.5% August 2022 482 560 -13.9% September 2022 482 538 -10.4% October 2022 451 561 -19.6% November 2022 371 555 -33.2% December 2022 445 628 -29.1% January 2023 278 448 -37.9% February 2023 320 406 -21.2% March 2023 475 568 -16.4% April 2023 451 526 -14.3% May 2023 563 562 +0.2% June 2023 566 622 -9.0% 12-Month Avg 447 551 -18.9%
Closed Sales
Market Overview THE LOWCOUNTRY This information is based on data provided by Resides MLS. Resides MLS does not guarantee and is not in any way responsible for its accuracy. Data provided by Resides MLS may not reflect all real estate activity in the market.
Prior YearPercent Change July 2022 480636-24.5% August 2022 482560-13.9% September 2022 482538-10.4% October 2022 451561-19.6% November 2022 371555-33.2% December 2022 445628-29.1% January 2023 278448-37.9% February 2023 320406-21.2% March 2023 475568-16.4% April 2023 451526-14.3% May 2023 563562+0.2% June 2023 566622-9.0% 12-Month Avg 447551-18.9% Historical Closed Sales by Month A count of the actual sales that closed in a given month. Closed Sales Current as of July 10, 2023. Data © 2023 REsides, INC. All Rights Reserved. Sponsored by South Carolina REALTORS®. | Report © 2023 ShowingTime. | 5 0 200 400 600 800 01-200801-200901-201001-201101-201201-201301-201401-201501-201601-201701-201801-201901-202001-202101-202201-2023 711 622 566 2021 2022 2023 June 3,956 3,132 2,653 2021 2022 2023 Year to Date -12.5% -9.0% -20.8%-15.3% + 27.0% + 57.3%
Days on Market Until Sale
Days on Market Until Sale
Historical Days on Market Until Sale by Month
8 CHARTERONEREALTY.COM Month Days on Market Days on Market Prior Year % Change July 2022 101 92 +9.8% August 2022 111 91 +22.0% September 2022 125 95 +31.6% October 2022 131 88 +48.9% November 2022 134 100 +34.0% December 2022 170 113 +50.4% January 2023 139 102 +36.3% February 2023 160 114 +40.4% March 2023 145 102 +42.2% April 2023 131 100 +31.0% May 2023 143 91 +57.1% June 2023 161 87 +85.1% 12-Month Avg 137 98 +39.8%
Market
THE LOWCOUNTRY This information is based on data provided by Resides MLS. Resides MLS does not guarantee and is not in any way responsible for its accuracy. Data provided by Resides MLS may not reflect all real estate activity in the market.
Overview
Prior YearPercent Change July 2022 10192+9.8% August 2022 11191+22.0% September 2022 12595+31.6% October 2022 13188+48.9% November 2022 134100+34.0% December 2022 170113+50.4% January 2023 139102+36.3% February 2023 160114+40.4% March 2023 145102+42.2% April 2023 131100+31.0% May 2023 14391+57.1% June 2023 16187+85.1% 12-Month Avg* 13798+39.8% Historical Days on Market Until Sale by Month Current as of July 10, 2023. Data © 2023 REsides, INC. All Rights Reserved. | Sponsored by South Carolina REALTORS®. | Report © 2023 ShowingTime. | 6 Average number of days between when a property is listed and when an offer is accepted in a given month. Days on Market * Average Days on Market of all properties from July 2022 through June 2023. This is not the average of the individual figures above. 93 87 161 2021 2022 2023 June 80 100 120 140 160 180 200 220 01-200801-200901-201001-201101-201201-201301-201401-201501-201601-201701-201801-201901-202001-202101-202201-2023 111 98 147 2021 2022 2023 Year to Date + 50.0% -6.5%+ 85.1% -11.7% -38.0% -22.9%
Median Sales Price
Median Sales Price
September 2022 $445,603$389,500+14.4%
October 2022 $495,860$450,000+10.2%
November 2022 $493,000$425,000+16.0%
December 2022 $501,600$450,408+11.4%
January 2023 $500,000$465,000+7.5%
February 2023 $472,260$450,000+4.9%
March 2023 $500,000$465,000+7.5%
April 2023 $526,041$484,500+8.6%
May 2023 $485,000$485,0000.0%
June 2023 $529,362$498,230+6.2%
12-Month Med* $490,000$450,000+8.9%
Historical Median Sales Price by Month
Historical Median Sales Price by Month
9 CHARTERONEREALTY.COM Month Median Sales Price Median Sales Price Prior Year % Change July 2022 $476,150 $435,000 +9.5% August 2022 $450,000 $400,000 +12.5% September 2022 $445,603 $389,500 +14.4% October 2022 $495,860 $450,000 +10.2% November 2022 $493,000 $425,000 +16.0% December 2022 $501,600 $450,408 +11.4% January 2023 $500,000 $465,000 +7.5% February 2023 $472,260 $450,000 +4.9% March 2023 $500,000 $465,000 +7.5% April 2023 $526,041 $484,500 +8.6% May 2023 $485,000 $485,000 0.0% June 2023 $529,362 $498,230 +6.2% 12-Month Avg $490,000 $450,000 +8.9%
Market Overview THE LOWCOUNTRY This information is based on data provided by Resides MLS. Resides MLS does not guarantee and is not in any way responsible for its accuracy. Data provided by Resides MLS may not reflect all real estate activity in the market.
Prior YearPercent Change July 2022 $476,150$435,000+9.5% August
2022 $450,000$400,000+12.5%
Current as of July 10, 2023. Data © 2023 REsides, INC. All Rights Reserved. | Sponsored by South Carolina REALTORS®. | Report © 2023 ShowingTime. | 7
Median
* Median Sales Price of all properties from July 2022 through June 2023. This is not the median of the individual figures above. $400,000 $498,230 $529,362 2021 2022 2023 June $100,000 $200,000 $300,000 $400,000 $500,000 $600,000 01-200801-200901-201001-201101-201201-201301-201401-201501-201601-201701-201801-201901-202001-202101-202201-2023 $390,000 $475,960 $505,038 2021 2022 2023 Year to Date + 6.1% + 24.6%+ 6.2% + 22.0% + 12.9% + 15.7%
Point at which half of the sales sold for more and half sold for less, not accounting for seller concessions, in a given month.
Sales Price
Average Sales Price
Average Sales Price
August 2022 $614,018$610,909+0.5%
September 2022 $692,064$595,158+16.3%
October 2022 $638,092$660,027-3.3%
November 2022 $697,970$603,256+15.7%
December 2022 $652,754$642,689+1.6%
January 2023 $715,274$672,155+6.4%
February 2023 $650,155$642,705+1.2%
March 2023 $664,900$672,978-1.2%
April 2023 $717,878$697,803+2.9%
May 2023 $727,502$721,659+0.8%
June 2023 $710,500$750,799-5.4%
12-Month Avg* $676,250$659,175+2.6%
Historical Average Sales Price by Month
Historical Average Sales Price by Month
10 CHARTERONEREALTY.COM Month Average Sales Price Average Sales Price Prior Year % Change July 2022 $633,891 $639,966 -0.9% August 2022 $614,018 $610,909 +0.5% September 2022 $692,064 $595,158 +16.3% October 2022 $638,092 $660,027 -3.3% November 2022 $697,970 $603,256 +15.7% December 2022 $652,754 $642,689 +1.6% January 2023 $715,274 $672,155 +6.4% February 2023 $650,155 $642,705 +1.2% March 2023 $664,900 $672,987 -1.2% April 2023 $717,878 $697,803 +2.9% May 2023 $727,502 $721,659 +0.8% June 2023 $710,500 $750,799 -5.4% 12-Month Avg $676,250 $659,175 +2.6%
THE LOWCOUNTRY This information is based on data provided by Resides MLS. Resides MLS does not guarantee and is not in any way responsible for its accuracy. Data provided by Resides MLS may not reflect all real estate activity in the market.
Market Overview
Prior YearPercent Change July 2022 $633,891$639,966-0.9%
Current as of July 10, 2023. Data © 2023 REsides, INC. All Rights Reserved. | Sponsored by South Carolina REALTORS®. | Report © 2023 ShowingTime. | 8 Average sales price for all closed sales, not accounting for seller concessions, in a given month. Avg. Sales Price * Avg. Sales Price of all properties from July 2022 through June 2023. This is not the average of the individual figures above. $642,610 $750,799 $710,500 2021 2022 2023 June $200,000 $300,000 $400,000 $500,000 $600,000 $700,000 $800,000 01-200801-200901-201001-201101-201201-201301-201401-201501-201601-201701-201801-201901-202001-202101-202201-2023 $571,516 $697,303 $700,433 2021 2022 2023 Year to Date + 0.4% + 16.8%-5.4% + 22.0% + 33.3% + 27.8%
Percent of List Price Received
Percent of List Price Received
June 2023 98.3%100.3%-2.0% 12-Month Avg* 98.2%99.8%-1.6%
Historical Percent of List Price Received by Month
Historical Percent of List Price Received by Month
11 CHARTERONEREALTY.COM Month % of List Price Received % of List Price Received Prior Year % Change July 2022 99.2% 99.5% -0.3% August 2022 98.6% 99.2% -0.6% September 2022 98.2% 99.1% -0.9% October 2022 98.2% 98.9% -0.7% November 2022 97.6% 99.1% December 2022 98.2% 99.6% January 2023 97.5% 98.9% -1.4% February 2023 98.0% 99.9% -1.9% March 2023 98.2% 100.8% -2.6% April 2023 98.0% 100.9% -2.9% May 2023 98.4% 101.0% -2.6% June 2023 98.3% 100.3% -2.0% 12-Month Avg 98.2% 99.8% -1.6%
Market Overview THE LOWCOUNTRY This information is based on data provided by Resides MLS. Resides MLS does not guarantee and is not in any way responsible for its accuracy. Data provided by Resides MLS may not reflect all real estate activity in the market.
Prior YearPercent Change July 2022 99.2%99.5%-0.3% August 2022 98.6%99.2%-0.6% September 2022 98.2%99.1%-0.9% October 2022 98.2%98.9%-0.7% November 2022 97.6%99.1%-1.5% December 2022 98.2%99.6%-1.4% January 2023 97.5%98.9%-1.4% February 2023 98.0%99.9%-1.9% March 2023 98.2%100.8%-2.6% April 2023 98.0%100.9%-2.9% May 2023 98.4%101.0%-2.6%
Current as of July 10, 2023. Data © 2023 REsides, INC. All Rights Reserved. | Sponsored by South Carolina REALTORS®. | Report © 2023 ShowingTime. | 9 Pct. of List Price Received * Average Pct. of List Price Received for all properties from July 2022 through June 2023. This is not the average of the individual figures above. 100.2% 100.3% 98.3% 2021 2022 2023 June 90.0% 92.0% 94.0% 96.0% 98.0% 100.0% 102.0% 01-200801-200901-201001-201101-201201-201301-201401-201501-201601-201701-201801-201901-202001-202101-202201-2023 98.9% 100.4% 98.1% 2021 2022 2023 Year to Date -2.3% +0.1%-2.0% + 1.5% +3.9% +2.1%
Percentage found when dividing a property’s sales price by its most recent list price, then taking the average for all properties sold in a given month, not accounting for seller concessions.
Inventory of Homes for Sale
Inventory of Homes for Sale
Historical Inventory of Homes for Sale by Month
12 CHARTERONEREALTY.COM Month # of Homes For Sale # of Homes For Sale Prior Year % Change July 2022 1,036 797 +30.0% August 2022 977 808 +20.9% September 2022 978 783 +24.9% October 2022 1,043 724 +44.1% November 2022 1,065 600 +77.5% December 2022 1,024 526 +94.7% January 2023 975 443 +120.1% February 2023 928 463 +100.4% March 2023 987 566 +74.4% April 2023 941 669 +40.7% May 2023 953 777 +22.7% June 2023 1,004 919 +9.2% 12-Month Avg 993 673 +47.5%
THE LOWCOUNTRY This information is based on data provided by Resides MLS. Resides MLS does not guarantee and is not in any way responsible for its accuracy. Data provided by Resides MLS may not reflect all real estate activity in the market.
Market Overview
Prior YearPercent Change July 2022 1,036797+30.0% August 2022 977808+20.9% September 2022 978783+24.9% October 2022 1,043724+44.1% November 2022 1,065600+77.5% December 2022 1,024526+94.7% January 2023 975443+120.1% February 2023 928463+100.4% March 2023 987566+74.4% April 2023 941669+40.7% May 2023 953777+22.7% June 2023 1,004919+9.2% 12-Month Avg* 993673+47.5% Historical Inventory of Homes for Sale by Month Current as of July 10, 2023. Data © 2023 REsides, INC. All Rights Reserved. Sponsored by South Carolina REALTORS®. | Report © 2023 ShowingTime. | 11 The number of properties available for sale in active status at the end of a given month. Homes for Sale * Homes for Sale for all properties from July 2022 through June 2023. This is not the average of the individual figures above. 0 1,000 2,000 3,000 4,000 5,000 01-200801-200901-201001-201101-201201-201301-201401-201501-201601-201701-201801-201901-202001-202101-202201-2023 + 9.2% -62.6% 745 919 1,004 2021 2022 2023 June + 9.2% + 23.4% -62.6%
Months Supply of Inventory
Months Supply of Inventory
Historical Months Supply of Inventory by Month
13 CHARTERONEREALTY.COM Month Months Supply of Inventory Months Supply of Inventory Prior Year % Change July 2022 1.9 1.1 +72.7% August 2022 1.8 1.2 +50.0% September 2022 1.9 1.2 +58.3% October 2022 2.1 1.1 +90.9% November 2022 2.2 0.9 +144.4% December 2022 2.1 0.8 +162.5% January 2023 2.1 0.7 +200.0% February 2023 2.0 0.8 +150.0% March 2023 2.2 1.0 +120.0% April 2023 2.1 1.2 +75.0% May 2023 2.2 1.4 +57.1% June 2023 2.3 1.7 +35.3% 12-Month Avg 2.1 1.1 +90.9%
Market Overview THE LOWCOUNTRY This information is based on data provided by Resides MLS. Resides MLS does not guarantee and is not in any way responsible for its accuracy. Data provided by Resides MLS may not reflect all real estate activity in the market.
Prior YearPercent Change July 2022 1.91.1+72.7% August 2022 1.81.2+50.0% September 2022 1.91.2+58.3% October 2022 2.11.1+90.9% November 2022 2.20.9+144.4% December 2022 2.10.8+162.5% January 2023 2.10.7+200.0% February 2023 2.00.8+150.0% March 2023 2.21.0+120.0% April 2023 2.11.2+75.0% May 2023 2.21.4+57.1% June 2023 2.31.7+35.3% 12-Month Avg* 2.11.1+90.9% Historical Months Supply of Inventory by Month The inventory
Current as of July 10, 2023. Data © 2023 REsides, INC. All Rights Reserved. | Sponsored by South Carolina REALTORS®. Report © 2023 ShowingTime. 12 Months Supply * Months Supply for all properties from July 2022 through June 2023. This is not the average of the individual figures above. 1.0 1.7 2.3 2021 2022 2023 June 0.0 5.0 10.0 15.0 20.0 25.0 30.0 01-200901-201001-201101-201201-201301-201401-201501-201601-201701-201801-201901-202001-202101-202201-2023 + 70.0% + 35.3% -76.2%
of homes for sale at the end of a given month, divided by the average monthly pending sales from the last 12 months.
HILTON HEAD ISLAND
Mid-Year Highlights
Hilton Head Island Villas
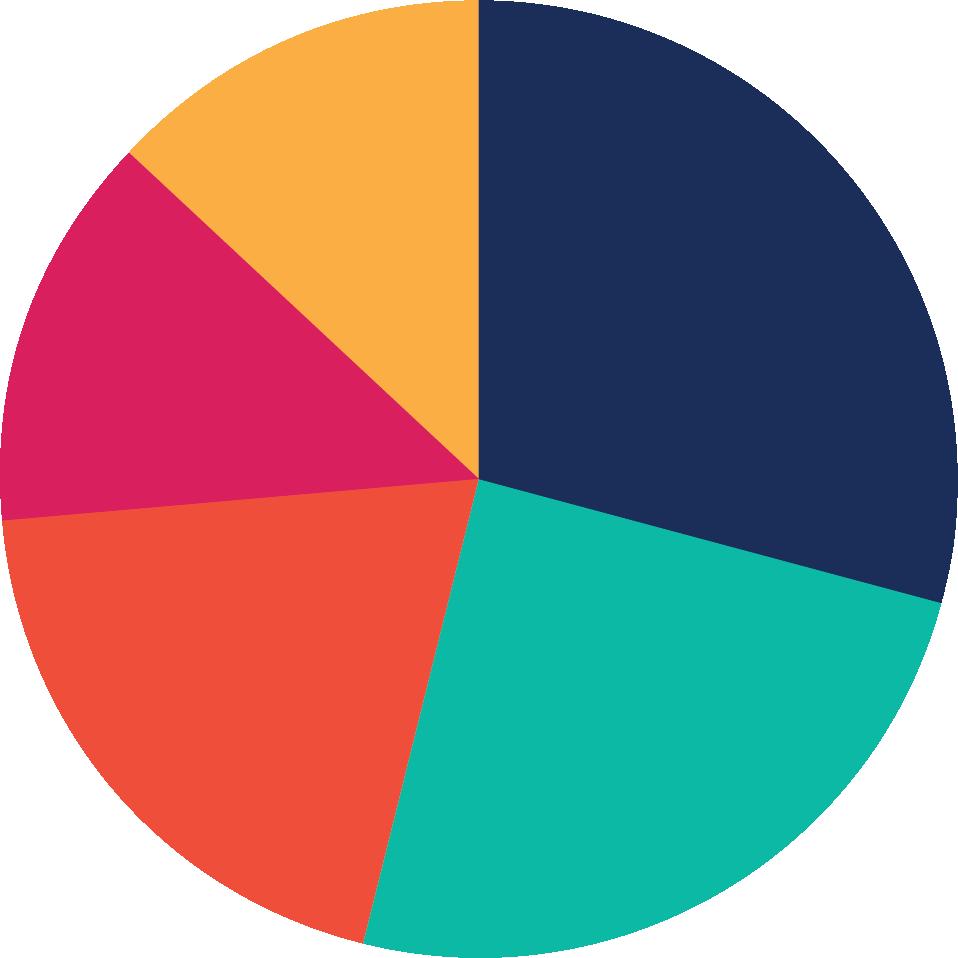
Number of Closed Sales at Various Price Points
Represents Homes, Villas, and Lots
14 CHARTERONEREALTY.COM
Mid-Year 2022 Mid-Year 2023 Percent Change New Listings 579 444 - 23.3% Closed Sales 451 321 - 28.8% Median Sales Price $995,000 $1,100,000 + 10.6% Days on Market 81 91 + 12.7% Hilton Head Island Homes Mid-Year 2022 Mid-Year 2023 Percent Change New Listings 830 661 - 20.4% Closed Sales 708 532 - 24.9% Median Sales Price $455,000 $520,000 + 14.3% Days on Market 69 103 + 49.6%
Under $500K 269 $500K - $750K 226 $750K - $1M 179 $1M - $1.5M 123 $1.5M & Above 117
This information is based on data provided by Resides MLS. Resides MLS does not guarantee and is not in any way responsible for its accuracy. Data provided by Resides MLS may not reflect all real estate activity in the market.
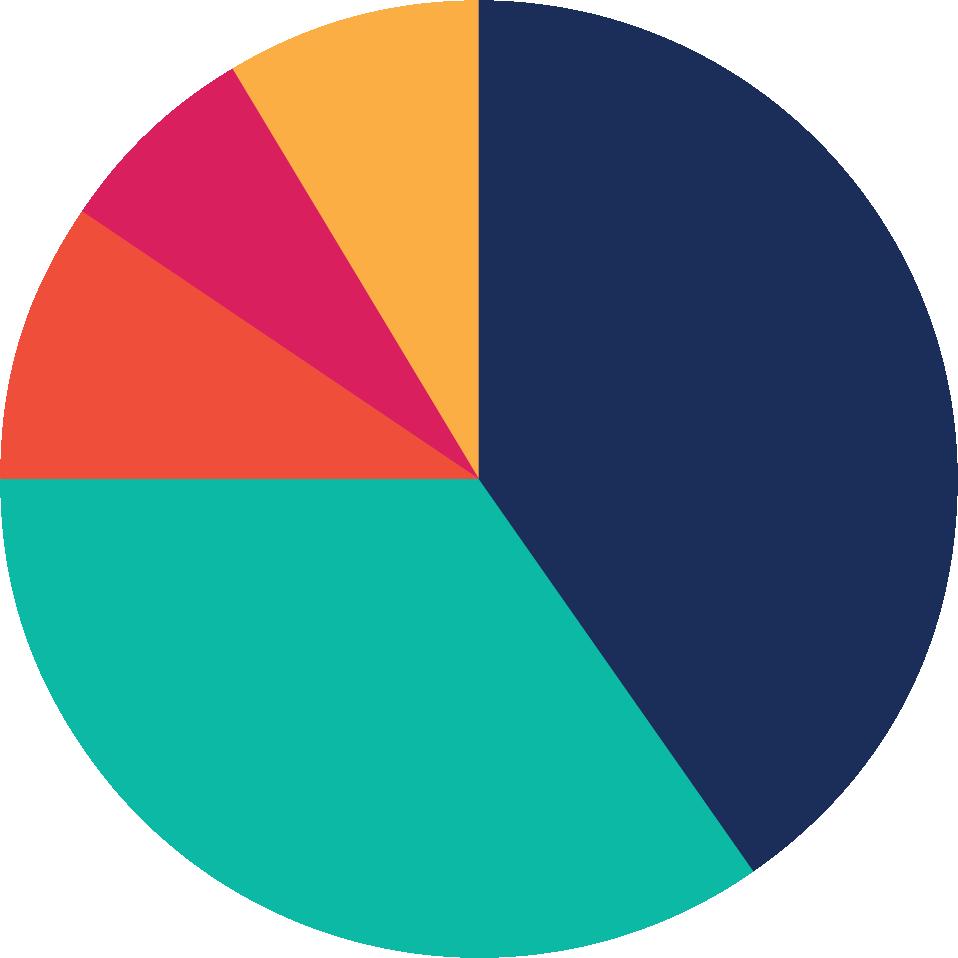
15 CHARTERONEREALTY.COM Mid-Year Highlights MAINLAND 29910 & 29909 Mid-Year 2022 Mid-Year 2023 Percent Change New Listings 1,573 1,197 - 23.9% Closed Sales 1,211 933 - 23.0% Median Sales Price $470,000 $539,000 + 14.7% Days on Market 87 113 + 29.9% Mainland Homes Number of Closed Sales at Various Price Points Under $500K 368 $500K - $750K 317 $750K - $1M 88 $1M - $1.5M 63 $1.5M & Above 77 Represents Homes, Villas, and Lots This information is based on data provided by Resides MLS. Resides MLS does not guarantee and is not in any way responsible for its accuracy. Data provided by Resides MLS may not reflect all real estate activity in the market.
Mid-Year Snapshot
By Community

16 CHARTERONEREALTY.COM MLS Area/Neighborhood Mid Year 2022 Closed Sales Mid Year 2023 Closed Sales Percent Change Daufuskie Island Homes 26 25 -3.85 % Villas 2 2 0.0 % Lots 50 23 -54 % Folly Field Homes 11 7 -36.36 % Villas 78 50 -35.9 % Lots 3 0 0.0 % Forest Beach Homes 16 15 -6.25 % Villas 137 97 -29.2 % Lots 1 0 0.0 % Hilton Head General Homes 106 47 -55.66 % Villas 189 123 -34.92 % Lots 54 35 -35.19 % Hilton Head Plantation Homes 109 76 -30.28 % Villas 11 30 +172.73 % Lots 8 2 -75 %
HEAD ISLAND AND DAUFUSKIE This information is based on data provided by Resides MLS. Resides MLS does not guarantee and is not in any way responsible for its accuracy. Data provided by Resides MLS may not reflect all real estate activity in the market.
HILTON
17 CHARTERONEREALTY.COM MLS Area/Neighborhood Mid Year 2022 Closed Sales Mid Year 2023 Closed Sales Percent Change Indigo Run Homes 12 21 +75 % Villas 0 1 0.0 % Lots 7 2 -71.43 % Long Cove Homes 25 9 -64 % Lots 7 2 -71.43 % Palmetto Dunes Homes 39 21 -46.15 % Villas 161 93 -42.24 % Lots 2 1 -50 % Palmetto Hall Homes 13 15 +15.38 % Lots 3 2 -33.33 % Port Royal Homes 24 20 -16.67 % Villas 15 6 -60 % Lots 2 3 +50 % Sea Pines Homes 126 102 -19.05 % Villas 78 59 -24.36 % Lots 2 2 0.0 % Shipyard Homes 12 16 +33.33 % Villas 49 37 -24.49 % Lots 0 0 0.0 % Spanish Wells Homes 5 3 -40 % Lots 1 0 0.0 % Wexford Homes 10 13 +30 % Lots 5 3 -40 % Windmill Harbour Homes 8 5 -37.5 % Villas 4 2 -50 % Lots 13 4 -69.23 %
Mid-Year Snapshot

18 CHARTERONEREALTY.COM MLS Area/Neighborhood Mid Year 2022 Closed Sales Mid Year 2023 Closed Sales Percent Change Belfair Homes 28 17 -39.29 % Lots 10 10 0.0 % Berkeley Hall Homes 21 15 -28.57 % Lots 10 6 -40 % Bluffton General Homes 523 382 -26.96 % Villas 72 50 -30.56 % Lots 36 20 -44.44 % Callawassie Island Homes 20 14 -30 % Lots 10 9 -10 % Colleton River Homes 21 16 -23.81 % Lots 17 21 +23.53 % Hampton Hall Homes 37 22 -40.54 % Lots 4 8 +100 %
This information is based on data provided by Resides MLS. Resides MLS does not guarantee and is not in any way responsible for its accuracy. Data provided by Resides MLS may not reflect all real estate activity in the market.
By Community MAINLAND 29909 & 29910

19 CHARTERONEREALTY.COM MLS Area/Neighborhood Mid Year 2022 Closed Sales Mid Year 2023 Closed Sales Percent Change Hampton Lake Homes 41 35 -14.63 % Villas 2 0 0.0 % Lots 6 3 -50 % Moss Creek Homes 25 28 +12 % Villas 4 2 -50 % Lots 6 1 -83.33 % Oldfield Homes 11 25 +127.27 % Lots 10 3 -70 % Palmetto Bluff Homes 52 41 -21.15 % Lots 58 20 -65.52 % Rose Hill Homes 26 30 +15.38 % Lots 14 3 -78.57 % Sun City/Riverbend Homes 332 280 -15.66 % Lots 1 6 +500 %
29909 & 29910 This information is based on data provided by Resides MLS. Resides MLS does not guarantee and is not in any way responsible for its accuracy. Data provided by Resides MLS may not reflect all real estate activity in the market.
Mid-Year Snapshot By Community MAINLAND
Mid-Year Snapshot
By Community
This information is based on data provided by Resides MLS. Resides MLS does not guarantee and is not in any way responsible for its accuracy. Data provided by Resides MLS may not reflect all real estate activity in the market.

20 CHARTERONEREALTY.COM
MLS Area/Neighborhood Mid Year 2022 Closed Sales Mid Year 2023 Closed Sales Percent Change Battery Point Homes 15 18 +20 % Lots 1 1 0.0 % Bull Point Homes 1 2 +100 % Lots 16 7 -56.25 % Cat Island Homes 17 7 -58.82 % Lots 12 6 -50 % Celadon Homes 5 11 +120 % Lots 2 1 -50 % City of Beaufort Homes 81 88 +8.64 % Lots 36 20 -44.44 % Coosaw Point Homes 16 8 -50 % Lots 4 1 -75 % Dataw Island Homes 31 29 -6.45 % Lots 13 2 -84.62 % Fripp Island Homes 55 56 +1.82 % Lots 41 14 -65.85 %
BEAUFORT
21 CHARTERONEREALTY.COM
Area/Neighborhood Mid Year 2022 Closed Sales Mid Year 2023 Closed Sales Percent Change Habersham Homes 30 29 -3.33 % Lots 20 9 -55 % Harbor Island Homes 42 27 -35.71 % Lots 20 16 -20 % Ladys Island Homes 261 203 -22.22 % Lots 70 58 -17.14 % Mossy Oaks Homes 70 44 -37.14 % Lots 1 2 +100 % New Point Homes 8 8 0.0 % Lots 2 1 -50 % Pigeon Point Homes 12 19 +58.33 % Lots 0 2 0.0 % Pleasant Point Homes 10 12 +20 % Lots 14 5 -64.29 % Port Royal Homes 113 98 -13.27 % Lots 9 5 -44.44 % Royal Pines Homes 40 26 -35 % Lots 4 3 -25 % Shell Point Homes 29 18 -37.93 % Lots 4 2 -50 % Spanish Point Homes 5 3 -40 % Lots 1 0 0.0 % St Helena Island Homes 38 43 +13.16 % Lots 56 53 -5.36 %
MLS
#1 Real Estate Brokerage in the Lowcountry


We Sell A Property Every 5 Hours*
*This information is based on data provided by Resides MLS. Resides MLS does not guarantee and is not in any way responsible for its accuracy. Data provided by Resides MLS may not reflect all real estate activity in the market. Based on Charter One Realty’s 2023 YTD Closed transactions.
22 CHARTERONEREALTY.COM
SALES VOLUME BY COMPANY FOR ALL HILTON HEAD ISLAND & MAINLAND AREAS CLOSED BETWEEN 01/01/2023 & 06/30/2023
COMPANY #2 COMPANY #3 COMPANY #4 COMPANY #5 COMPANY #6 COMPANY #7 COMPANY #8 COMPANY #9 COMPANY #10 $808 Million ($808,920,804) $183M $147M $144M $144M $131M $129M $115M $98M $335M
23 CHARTERONEREALTY.COM Shown in Number of Buyer Purchases January 2023 - June 2023 Representing More $1 Million Plus Buyers Than Any Other Brokerage In The Lowcountry COMPANY #2 COMPANY #3 COMPANY #4 COMPANY #5 49 23 22 20 102 Shown in Number of Seller Transactions January 2023 - June 2023 Representing More $1 Million Plus Sellers Than Any Other Brokerage In The Lowcountry BROKERAGE IN THE LOWCOUNTRY COMPANY #2 COMPANY #3 COMPANY #4 COMPANY #5 31 21 19 17 147

24 CHARTERONEREALTY.COM REAL ESTATE WEBSITEVisited#1 IN THE LOWCOUNTRY CharterOneRealty.com
IT IS NOT ABOUT BEING ONLINE - IT IS ABOUT BEING FOUND ONLINE.
We continue to push boundaries and learn new techniques to drive the most relevant buyers to CharterOneRealty.com maximizing the potential for your property to be found quickly on the web. Our innovative online marketing campaigns place us in top positions on all search engines, which means that when your property is listed with Charter One Realty, it will receive maximum exposure ensuring your listing is seen by engaged and qualified buyers. *This

25 CHARTERONEREALTY.COM
January 1,
December
informational purposes only.
information
to
its accuracy, timeliness, or completeness. WEBSITE VISITOR TRAFFIC FROM JANUARY - DECEMBER 2022 Top 10 local brokerage websites as ranked by visitors.* Our Effective Print & Digital Techniques Produce 0 CharterOneRealty.com CollinsGroupRealty.com HiltonHeadRealEstateS.com EraEvergreen.com HomesonHiltonHead.com LowcountryRealEstate.com TheAllianceGroupRealty.com Weichertcp.com HiltonHeadHomes.com NUMBER OF WEBSITE VISITORS TheHomesFinder.com 250,000 350,000 450,000 550,000 650,000 750,000 Found on Page #1 of Search Engines Nearly
Website Visitors in 2022 1.8
Pageviews in 2022
information is based on data provided by SimilarWeb from
2021 -
31, 2022. The content, data, and other information contained and provided on or through the product is for
Such
is believed
be reliable; however, SimilarWeb does not warrant
1 Million
Million+
UNRIVALED CONNECTIONS
Charter One Realty is the ONLY brokerage in the Lowcountry with three Luxury Affiliations.
LEADING REAL ESTATE COMPANIES OF THE WORLD
Selling more homes than any other national real estate organization, the brokers that make up this network excel because of their ability to make referrals to one another with ease and frequency. Leading Real Estate Companies of the World brokers are ranked #1 in more top US markets than any franchise and represent properties in ALL price ranges.
Charter One Realty residential listings are promoted on LeadingRE.com, found from 550 affiliate websites throughout 73 countries, and showcased to more than 136,000 associates worldwide.

LUXURY PORTFOLIO INTERNATIONAL
The unified collection of the world’s most experienced, respected and well-known experts in luxury real estate, this powerful network participates in more transactions than any other national franchise or global real estate organization. 200 luxury affiliates | 55 countries | LuxuryPortfolio.com | For listings $1 Million and up

Charter One Realty's $1M+ residential listings are posted on LuxuryPortfolio.com and displayed on key websites worldwide, including The Wall Street Journal, Mansion Global, MarketWatch, Barron’s, Penta online, Juwai, YouTube, WeChat, Country Life, JamesEdition, Expansion, and Bloomberg Property Listings.
WHO’S WHO IN LUXURY REAL ESTATE
For over 36 years, Who’s Who in Luxury Real Estate has represented the world’s top high-end real estate professionals from both independent and franchised companies and provided them with the best possible marketing tools and connections to the best luxury real estate professionals around the world. For listings $500,000 and up.
Charter One Realty residential listings ($500K+) are promoted on LuxuryRealEstate. com and found from 450+ affiliate websites throughout 50 countries and showcased to more than 130,000 associates worldwide.
* Reserved for properties listed at $1,000,000 and above. ** Reserved for properties listed at $500,000 and above.
26 CHARTERONEREALTY.COM


27 CHARTERONEREALTY.COM And Displayed on Key Websites Around The World When Your Property is Listed with Charter One Realty it is Posted on LuxuryPortfolio.com* More than 3 million affluent consumers visit the flagship website, LuxuryPortfolio.com, every year to browse in a setting dedicated solely to significant properties and a discerning lifestyle. LUXURY PORTFOLIO INTERNATIONAL® MEDIA KIT 2023 | 24 Syndications & Websites promotion properties automatically additional your listing and marketing plan seller. luxuryportfolio.com to sync websites; see pricing wsj.com marketwatch.com juwai.com leadingre.com WeChat mansionglobal.com jamesedition.com expansion.mx barrons.com and Penta online countrylife.co.uk propertylistings.ft.com *For qualifying properties.
CHARTER ONE REALTY
11 & 5 Park Lane, Hilton Head 843-785-4460
CHARTER ONE REALTY BEACH MARKET
2 N Forest Beach Drive, Suite 119, Hilton Head 843-785-1115
CHARTER ONE REALTY NORTH
200 Merchant Street, Hilton Head 843-681-3307
CHARTER ONE REALTY PROMENADE
1 Promenade Street, Suite 101, Bluffton 843-815-0055
CHARTER ONE REALTY COMMERCIAL
1 Promenade Street, Suite 101, Bluffton 843-815-0055
CHARTER ONE REALTY BELFAIR

2 Belfair Oaks Boulevard, Bluffton 843-757-7710
CHARTER ONE REALTY BERKELEY HALL
1024 Berkeley Hall Boulevard, Bluffton 843-815-8400
CHARTER ONE REALTY SUN CITY
10 William Pope Drive, Bluffton 843-705-2830
CHARTER ONE REALTY BEAUFORT
203A Carteret Street, Beaufort 843-379-4460
CHARTER ONE REALTY SAVANNAH QUARTERS
100 Blue Moon Xing #114, Pooler, GA 31322 912-450-2300
charteronerealty.com
RANKED AMONG THE TOP 500 BROKERAGES IN THE U.S.
