12 minute read
Danny Nowlan


Missing links
Why mathematical reasoning is more important than ever now for racecar engineers
By DANNY NOWLAN
The latest simulation software packages are incredibly powerful resources, but they shouldn’t be viewed as a replacement for hands-on learning, first principles and basic mathematical reasoning
Over the last couple of months, I have been working with a number of junior engineers at senior undergraduate level and junior post graduate level. While their enthusiasm has never been in question, I am shocked by the lack of basic skills I am seeing.
The two biggest areas of concerns are their inability to do hand calculations, and a complete lack of ability to reason mathematically. The first area of concern motivated an article I wrote a couple of months ago on the joy of hand calculations. The purpose of this article is to deal with the second concern.
If you are serious about being a capable engineer in any discipline, the ability to reason mathematically is a must-have skill. I am noting with increasing alarm how when junior engineers are given a problem, their fist instinct now is to plug the numbers into something like SolidWorks or ChassisSim and hit a button, hoping it solves their problem for them. Don’t get me wrong, these are very powerful pieces of software but, used blindly and with no idea of the underlying principles, they can easily lead you to the wrong conclusion very quickly.
I can give countless examples of engineering disasters that could well have been averted if the time had been taken to have a proper think about the problem in the first place.
Conversion rates
To illustrate this, let’s consider our first example, which is the conversion of anti-roll bar rates from moment per degree to a spring rate. At first, this might seem a little mundane, bordering on the trivial, but it serves as an excellent first example. The problem we need to solve here is how do we convert a bar rate quoted in Nm/deg to an equivalent spring rate in N/m? The answer is not as hard as you think.
Our first port of call is to calculate the moments generated by the bar for a given spring rate and a roll angle. The force given by the bar can be expressed as equation 1.
(1)
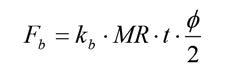
Where,
b = force on the anti-roll bar b = bar rate in N/m t = track width in m = roll angle in radians
M R = bar motion ratio (bar movement / wheel)
To keep this discussion simple, let’s assume the bar rate and motion ratios are linear. The next step is to calculate the moments being generated by the bar. We have two forces providing moments in equal and opposite directions so, assuming the c of g is in the middle of the car, we may write equation 2.
(2)
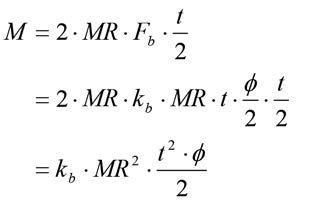
Where,
= rolling moment (N/m)
What we now need to do is to manipulate equation 2 to make it reveal what we need. Dividing equation 2 by the roll angle, we see equation 3.
(3)
Guess what? We’re almost there already. We now have our measure of roll moment per degree expressed as a function of bar rate. However, there is just one last trick. The supplied measure we have is in Nm/deg, while what we have in equation 2 is in Nm/ radian. This is easily fixed. The trick comes from recognising one degree is π/180 radians. Doing the maths, we see equation 4.
(4)

Subbing equation 4 into equation 3 and making kb the subject, we have equation 5.
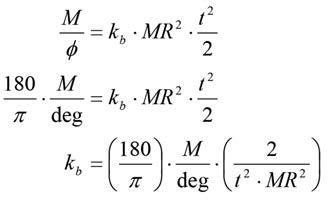
(5)
So there you have it, a sure fire way of calculating a bar rate given a bar rating in Nm/deg. Crunching the numbers in this example, assuming a bar moment of 2000Nm/deg, a motion ratio of one and a track width of 1.6m we have as follows:

The best thing about this example is it isn’t rocket science. We started off with a statement of the problem and, using some very simple manipulation, have come up with a very powerful tool.
Transient stability
The next example uses data analysis and our knowledge of calculus to nail down car transient stability. Often, when one mentions the dreaded c word, it sends people running for the hills, but really there’s nothing to worry about. Calculus at its core is all about measuring slopes and calculating areas. That’s all there is to it. The next discussion here then is about calculating slopes, so here goes.
Car transient stability can be articulated by a concept known as the stability index. Mathematically, this can be quantified as shown in equation 6.
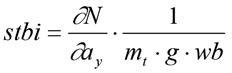
Where,
Stbi = the stability index
N = the sum of yaw moments acting on the car (Nm) ay = Lateral acceleration of the car (g) mt = total car mass in kg g = acceleration due to gravity (9.8m/s2) wb = car wheelbase in m
The stability index is a non-dimensional measure of the distance between the centre of the lateral forces and its moment arm from the c of g. It will return this as a percentage divided by 100. The idea is negative is stable and positive is unstable.
There are two ways you can measure this. The first is to have lateral accelerometers fitted on both ends of the car. In this case, the moment (N) being generated is given by equation 7.
(7) The term wdf is the front weight distribution of the car as a percentage divided by 100. The great thing about equation 7 is it is one of the most straightforward maths channels you’ll ever put together.
The next trip is to plot this against total lateral acceleration and take the slope. This is illustrated in Figure 1.
The great thing about this plot is it gives you the stability index. But also remember the sign of your lateral acceleration. If you have ay measured as positive for a left turn,
Fig 1: plot of lateral moment vs lateral acceleration

you have to multiply the slope by -1. However, this is the ultimate driver lie detector because you can instantly see what is going on.
At low lateral g, the car is quite stable. But as we push, the plot becomes more wavy, indicating we have some work to do at high speed. This is not surprising given this is a simulated plot.
The other way of doing this is to plot yaw rate as a function of total lateral g. From the equations of motion, it is seen that the time derivative of yaw rate is the total lateral moment. Consequently, we can infer lateral moment by taking the derivative of yaw rate and multiplying it by the z axis of the second moment of inertia. The trick here is to filter the yaw moment derivative.
The great thing about both these approaches is they give you a sure fire driver lie detector. Ignore a tool like this at your peril in the modern motorsport environment.
Aero-induced roll over
The last example I’d like to talk about was one of the most extraordinary technical discussions I have ever seen over the last two years. And for all the wrong reasons. It centred on the discussion of aerodynamicinduced roll over of a racecar, a problem that plagues modern Sports Prototypes.
The conversation to which I refer tried to apply the same thinking to an FSAE car, and you should have seen the encouragement from all parties involved to do detailed CFD studies of this scenario. I was so stunned at what I was hearing that I forwarded it on to colleagues of mine who were senior aerodynamicists in various race categories at the time, and they too were in disbelief at what they were reading.
To explain why this discussion was so off the mark, let’s make some rough approximations of the mechanisms involved in an aerodynamic-induced roll over. It occurs when a car goes sideways at speed, the aerodynamic downforce reduces and it hits a bump, exposing the car’s underbody to open airflow. It then cartwheels over.
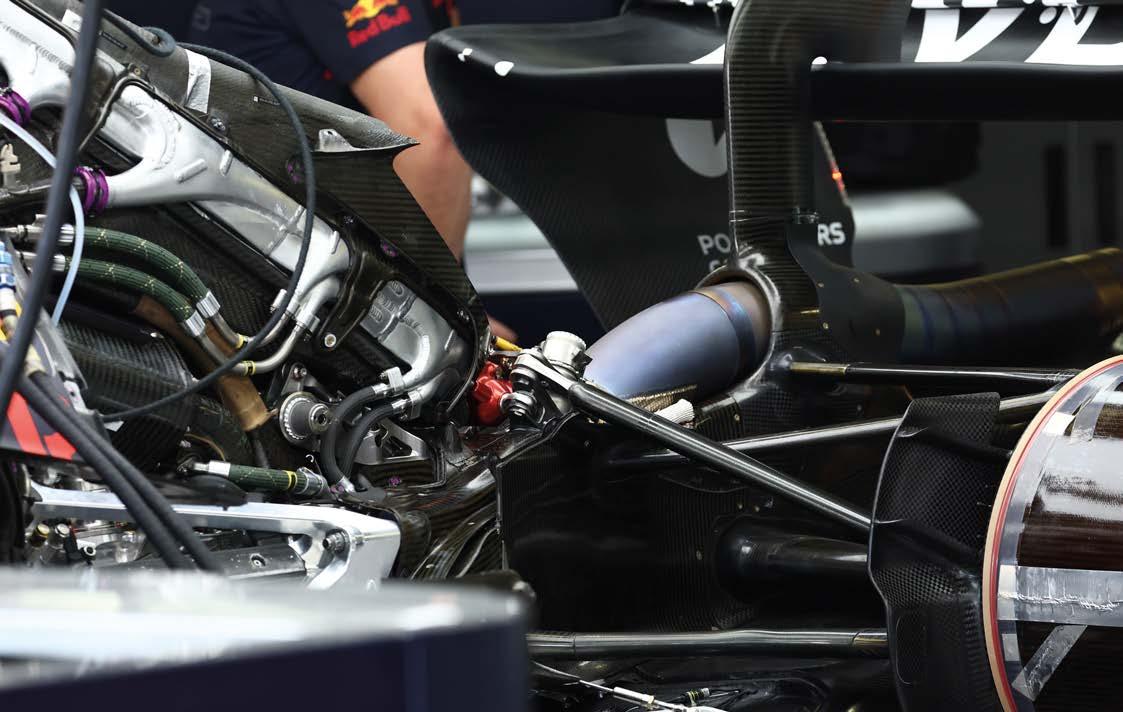
Believe it or not, we can actually put some basic numbers to this to see whether we actually have a problem or not. This situation is summarised in the free body diagram shown in Figure 2.
To keep this discussion simple, I will assume the car has gone sideways so isn’t producing any downforce. As we can see, we have two major forces in play. The first is the lift being produced by the underbody as a result of being exposed at an angle to the airflow. This will be applied at the quarter chord, or track point. This is what is going to roll us over. What is keeping the car in check is its weight.
What we need to do then is to take moments about the tyre still on the ground. If the aerodynamic moment exceeds the moment produced by the car’s weight, then it will flip over. Simple.
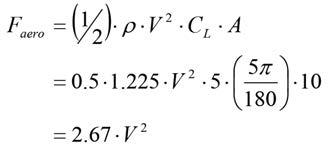
The trick here is to come up with an approximation for the aerodynamic forces, and even that is a lot easier than you might think. Our goal at the moment is not to try and predict the roll over moment, we just want to see whether we have a problem that needs to be dealt with.
To that end, we can look at some typical CL vs angle of attack plots of an aerofoil to get some ballpark numbers. As rough as this may seem, in this roll over situation this is pretty much what we are dealing with.
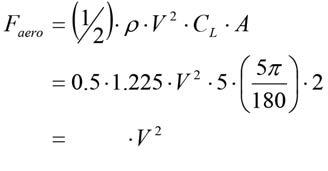
In terms of some simple dCL / dα numbers (α being in radians) 2π is an okay place to start from. Since this is a non-ideal aerofoil, let’s approximate dCL / dα at five. To go one step further, let’s then assume we’ve hit a bump and the angle of attack is, say, five degrees. Given a typical underbody area of a modern Sportscar of, let’s say, 10m2, the aerodynamic forces we are going to generate can be given by equation 8. Let’s then assume the car width is 2m and the car weight is 1000kg. Taking moments about the tyre, we see equation 9.
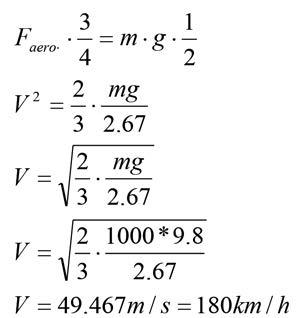
(9)
Fig 2: Roll over free body diagram analysis

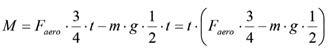
We know we are going to have problems when equation 9 is equal to zero. So, putting equation 8 into equation 9 and solving for the zero condition, we see what is shown in equation 10.
(10)
What all this tells us is that at 180km/h we are prone to aero-induced roll over (in reality, it’s usually a little bit more than that, say around 220-240km/h in most circumstances). However, as a ballpark figure, this indicates a situation we need to consider quite seriously.
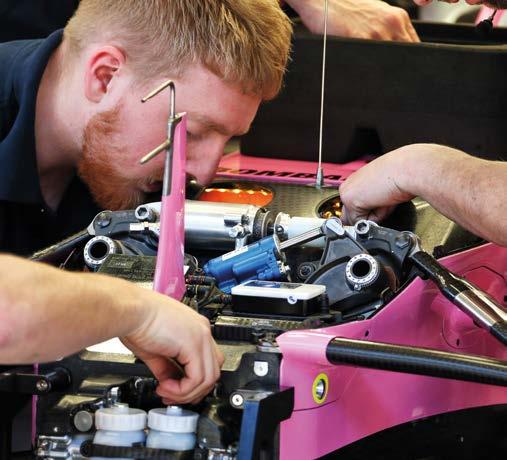
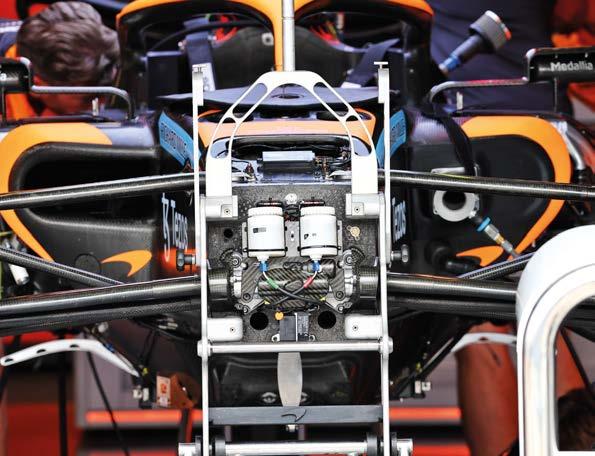
A sound understanding of mathematics is critical at all stages of racecar engineering, from design to manufacture to running a car, as well as for conversion of such as anti-roll bar rate to spring rate
Let’s now see how these numbers look like for an FSAE car. Using the same aero figures as the Sports Prototype (which, I might add, are already giving the aero roll over scenario considerable benefit of the doubt) we have the following numbers:
Table 1: FSAE car parameters
Parameter
Total mass Width Floor area
Qty
250kg 1.5m 2m2
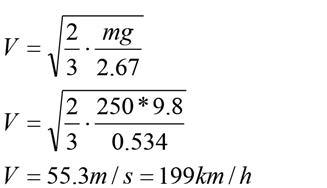
Using these figures to review equation 8 for the FSAE car, we have, Then plugging this into our analysis for equation10, we see…
…that we can indeed expect to see an aero-induced roll over situation with our FSAE car, but at approximately 200km/h! However, given that an FSAE car is limited to approximately 110km/h, it would never be going fast enough for this to happen.
I should also add that in sideways view an FSAE car has all the aerodynamic attributes of a brick so, if we really wanted to get aggressive with this analysis, the predicted roll over speed would go up quite significantly. However, for the sake of this discussion, by using first principles and some basic mathematical analysis, we’ve shown why the aforementioned conversation was so utterly ridiculous. And how much of a futile waste of resources a detailed CFD studies of this scenario would have been.
Problem solving
At this point it would be wise to give you some pointers about how I go about problem solving. As with hand calculations, start off by stating your known variables and unknown variables. Then think about what class of problem it is, and write down all the relevant equations. You then work the equations to solve for the unknowns. Write this down on a piece of paper, too. Computers are powerful tools, but nothing replaces pen, paper and a bit of common sense in problem solving.
In closing, here we have presented three separate, but quite pointed, examples of how to use mathematical reasoning to get on top of quite normal motorsport problems. The common thread in all three examples has been to take some basic first principles, put equations to them, and then plug in the numbers to quantify where we are at. That’s all there is to it.
It may not give you an exact answer, but it will sharpen your instincts so you know what you are looking for. Develop this skill and it will serve you well in your engineering career. Ignore this skill at your peril.


