GEOTHERMAL ENERGY SERIES O&G Expertise Unlocking the Earth’s Energy
Potential: Part 3
Tim Monachello, CFA, Analyst, Managing Director, ATB Capital Markets
Patrick Tang, CFA, CPA, Associate, ATB Capital Markets
This eJournal article is the third in a series on how Geothermal Energy can impact the energy industry and net-zero transition.

The next articles in the series will drill down further into Enhanced Geothermal, Opportunities for the Oil and Gas Service Sector, Economic and Strategic Factors, and the Regional Landscape for Geothermal Development.
CONVENTIONAL GEOTHERMAL – A NEEDLE IN A HAYSTACK
Today, conventional geothermal power generation systems (“conventional geothermal”) dominate current installed geothermal power capacity globally. While the economics of these projects is competitive with other forms of renewable power, offering significant advantages in terms of increased capacity factors and are a source of baseload continuous power, these developments have been constrained by limited availability of high-quality hydrothermal resource.
“[Conventional geothermal] developments have been constrained by limited availability of high-quality hydrothermal resource.”
About Conventional Geothermal Power Generation
Conventional geothermal power generation systems typically involve drilling wells into hightemperature hydrothermal reservoirs (often 250°C to >300°C) at relatively shallow depths. These reservoirs often are formed near tectonic plate boundaries or volcanically active areas where the Earth’s crust is relatively thin. Conventional geothermal power generation requires high enough temperatures at accessible depths to generate power (heat gradient), the presence of water (brine), and adequate flow rates to commercially produce high volumes of brine. Hot produced brine is flowed to surface from production wells, heat is harvested in a heat-to-power plant, and then cool water is reinjected using pumps into the reservoir through injection wells.
CHOA eJournal – 24 NOVEMBER 2022 | 1
High-Temperature Conventional Geothermal Developments in the US are Economic
We use the EIA’s estimates of the levelized cost of energy (LCOE) presented in its 2022 Annual Energy Outlook for our analysis. The LCOE represents the average revenue per unit of electricity generated to be breakeven with respect to capital and operating costs of a power plant (or storage facility in the case of levelized cost of storage). The EIA’s calculation of LCOE assumes a 6.2% weighted average cost of capital and a 30-year cost recovery period. We note that the AEO considers the US projects that it deems to be on the increment, which we believe would highlight the economics of projects where high-temperature resources are likely present, consistent with most conventional geothermal developments in the US. The EIA assumes capacity factors at the top end of each technology’s likely operating range. For geothermal, this is particularly impactful, as the EIA uses a 90% capacity factor vs. the 10-year range between 68.3% and 76.0%.
With this in mind, high-temperature conventional geothermal screens among the top three renewable electricity generation technologies (see Figure 8), with an LCOE at US$39.82/MWh, a US$3.33/MWh disadvantage to the first-place standalone solar, making it highly competitive with other renewable energy sources at face value without consideration that solar would require storage to be functionally equivalent to geothermal.
“… high-temperature conventional geothermal screens among the top three renewable electricity generation technologies …”
When performing economic analyses for new electricity generating capacity, avoided cost must be considered. Avoided cost is a measure of what it would cost the grid to meet the demand that is otherwise displaced by the new generation capacity; said another way, avoided cost is the cost that would be incurred to supply energy using the next alternative source. This accounts for variations in daily and seasonal electricity demand and the characteristics of the existing capacity to be replaced. Using the EIA-calculated lowest avoided cost of electricity (LACE) and dividing by LCOE, the value-cost ratio is derived. Value-cost ratios above one indicate that the technology’s value is higher than its cost, and the highest ratios offer the best value. Looking at this measure suggests that US conventional geothermal is among the most economical power generation technologies (see Figure 8). Again, we stress that this analysis is focused on incremental projects, which are likely focused on the highest temperature hydrothermal resources in the US and which are relatively scarce and concentrated in the western US, including California, Nevada, Utah, Idaho, Colorado, Oregon, and New Mexico.
CHOA eJournal – 24 NOVEMBER 2022 | 2
Levelized Cost of Electricity (US$/MWh) and Value-Cost Ratios for Various Technologies

*Non-dispatchable technologies cannot vary their output and generally have less value to a system relative to dispatchable sources.
Note: The levelized avoided cost of electricity represents the potential revenue available to the project owner from the sale of energy and generating capacity. It is essentially a measure of what it would cost the grid to meet the demand that is otherwise displaced by a new generation project.
Figure 8 – Levelized Cost of Electricity and Value-Cost Ratios for Various Technologies
Source: Energy Information Administration, ATB Capital Markets Inc.
As shown in Figure 8, geothermal plants, combined cycle designs (natural gas, other fuels), combustion turbines and batteries are considered dispatchable technologies that can vary their output in response to electricity demand. These generally have more value to a system/grid because of their adaptability, whereas non-dispatchable technologies can only produce as much as the natural variability in their inputs (wind and sun) allow.
Consistency and Scalability of Geothermal is Unmatched by Renewable Peers
One of the main advantages geothermal energy has over its renewable peers is that its output is relatively consistent and reliable, which is known as baseload. Geothermal wells generally output heat at a stable rate irrespective of weather conditions, unlike solar and wind installations, which cannot provide consistent electricity production without storage. Capacity factors, which represent the average electricity generated relative to nameplate capacity, suggest that geothermal is second in reliability to only nuclear, with a capacity factor between 70%-75%, well above both wind in the mid-30%s and solar between 20%-25% (see Figure 9).
“Capacity factors … suggest that geothermal is second in reliability to only nuclear … [and] well above both wind in the mid-30%s and solar between 20%-25% …
CHOA eJournal – 24 NOVEMBER 2022 | 3
Furthermore, within the span of a year, geothermal is relatively consistent, whereas solar suffers during the winter months and can be volatile in the summer, though ambient temperatures can affect geothermal power generation capacity to an extent.
Figure 9 – Capacity Factors for Utility-Scale Generators Primarily Using Non-Fossil Fuels
Source: Energy Information Administration, ATB Capital Markets Inc.

The Downside - Conventional Geothermal Resource is Scarce
As mentioned, most hydrothermal reservoirs are found near plate boundaries or in other areas where the Earth’s crust is thin. For commercial projects, this significantly limits the availability of commercial geothermal power developments. For context, commercial conventional geothermal developments today are generally limited to the onshore red and orange areas in Figure 10. This resource constraint has been a major limitation on the development of geothermal power capacity compared to other renewable resources that can be applied much more broadly. Since, 1990 just 1.4 GW of geothermal capacity has been added in the US, considerably below both solar and wind at approximately 121 GW and 134 GW, respectively. While resource characteristics remain a challenge, new technologies and configurations known as enhanced geothermal systems are being developed that could make geothermal power generation economically competitive with other power sources outside of just the historically active areas, and they could ultimately make geothermal readily accessible around the globe.
“… enhanced geothermal systems are being developed that could make geothermal power generation economically competitive … outside of just the historically active areas, and they could ultimately make geothermal readily accessible around the globe.”
CHOA eJournal – 24 NOVEMBER 2022 | 4
Global Geothermal Developments Have Been Confined to High-Temperature Resources
Figure 10 – Global Geothermal Developments Have Been Confined to High-Temperature Resources

Source: Clean Air Task Force, Davies 2013, ATB Capital Markets Inc.
Case Study
Ormat a Major Player in Conventional Geothermal
Founded in 1965, Ormat Technologies Inc. (“Ormat”) is a leading geothermal energy producer with operations in over 30 countries and 953 MW of geothermal generation capacity (gross of 42 MW Indonesia capacity, of which ORA owns just 12.75%), of which 667 MW were generated in the US and 285 MW were generated internationally (France, Guatemala, Honduras, Indonesia, and Kenya). Ormat’s principal revenue stream is through its Electricity Segment, which designs, builds, owns, and operates geothermal power plants, solar PV, and recovered energy generation (“REG”, using Organic Rankin Cycle (ORC) waste heat to power technologies) power plants, from which it generated 88% of its 2021 revenue. All of Ormat’s US geothermal projects are conventional in nature, using binary, flash steam, or combined cycle power plants with air and/or water-cooling systems to generate power. Ormat also has a Product Segment that designs, manufactures, and sells geothermal and REG equipment, and a US-focused Energy Storage segment that provides battery storage solutions to the grid.
Ormat’s Geothermal projects represent roughly 26% of total installed US geothermal capacity (EIA), and they highlight the commercial opportunity in conventional geothermal, including:
1) High Geothermal Capacity Factors: Ormat’s geothermal power plants ran with an average 86% capacity factor in 2021, well above wind and solar, which are generally in the 20%-30% range (according to Ormat).
2) Stable, Low Risk Nature of Commercial Conventional Geothermal Projects: Each of ORA’s geothermal projects sell substantially all of their electrical output pursuant to long-term, typically fixed price, power purchase agreements (PPAs), with a weighted-average term of more than 15 years across its portfolio (at year-end 2021). ORA’s US counterparties have low credit risk (rated A3 to Baa2 by Moody’s, BB- to A by S&P), and internationally, ORA contracts with state-owned entities in countries with below investment grade credit ratings.
3) Reasonable Return Potential for Conventional Geothermal: Since 2015, we calculate that ORA has generated average annual returns on capital employed (ROCE) of roughly 7.8%,
CHOA eJournal – 24 NOVEMBER 2022 | 5
which is reasonable considering the low-risk, recurring, and long-duration nature of geothermal cash flows. This calculation is after returns from the sale of tax benefits arising from the US Production Tax Credit for renewable energy projects, which helps fund capital outlays. This incentive structure improves returns for geothermal projects, and our calculations suggest that, without it, average annual ROCE would have been roughly 7.0% from 2015-2021.
4) Ormat Sees Reasonable Growth Opportunities in Conventional Geothermal:
By year-end 2023, Ormat expects to have nine new geothermal projects (including expansion) online that would add roughly 111-122 MW to its capacity from year-end 2021, representing 12%13% geothermal capacity growth over a two-year period. That said, Ormat’s project portfolio is centred on high-temperature resource areas. We believe the limited availability of these high-temperature resources has been a major governor of geothermal capacity development globally (see Figure 11).
– Ormat’s US Conventional Geothermal

Enriching Conventional Geothermal Systems
Another way to drive stronger economics from geothermal developments is through the addition of secondary revenue streams and/or cost reduction technologies to projects. These generally involve additional processing applications on conventional geothermal facilities in an effort to increase the yield of a geothermal well, or adding secondary power generation to offset the parasitic load of geothermal pumps. These value-add components are shown in Figure 12 and the section below.
“Another way to drive stronger economics from geothermal developments is through the addition of secondary revenue streams and/or cost reduction technologies …”
CHOA eJournal – 24 NOVEMBER 2022 | 6
Figure 11
Portfolio Shows Reliance on High-Temp Resources
Source: Ormat Technologies Inc., ATB Capital Markets Inc.
EGS Value-Additions to the Conventional Geothermal Value Chain

Figure 12 – EGS Value-Additions to the Conventional Geothermal Value Chain
Source:
Terrapin Geothermics
1) Hydrocarbon Recovery: One way to drive increased economics from geothermal wells is to add a hydrocarbon separation module to wells that can capture produced oil and gas from the reservoir, found in varying quantities depending on the resource area. While hydrocarbon separation can offer increased project economics, hydrocarbon production typically declines over time, is inconsistent across geothermal resources, somewhat increases the environmental impact of a geothermal well (Scope 3 emissions), and may require increased regulatory oversight and licensing requirements. Alternatively, a company can enhance an existing oil/gas well by adding geothermal equipment.
Case Study
FutEra Power – Showcasing Geothermal Co- Production with Natural Gas
FutEra Power, a subsidiary of Razor Energy Corp., has plans to develop a co-produced geothermal and natural gas power generation project by combining geothermal capacity with its existing natural gas production at its Swan Hills, AB operations. The Swan Hills formation is beneficially located in one of the highest temperature resource areas of the Western Canadian Sedimentary Basin, which provides geothermal temperatures at roughly 115°C while also being a world-class hydrocarbon resource.
The proposed $37 mn project contemplates the construction of a 5 MW geothermal power project combined with a natural gas turbine capable of boosting output to 21 MW by utilizing the natural gas separated from produced water. Viewed from another perspective, the produced water from hydrocarbon production will be used to generate power using an ORC configuration. The first phase of the project (geothermal + natural gas) is expected to offset 31,000 tCO2e/year. Then, the proposed second phase of the project contemplates the addition of a carbon sequestration module that would inject CO2 into the formation,
CHOA eJournal – 24 NOVEMBER 2022 | 7
potentially offsetting an additional 23,000 tCO2e/year and adding another revenue stream to the project (carbon offset credits).
FutEra Power Project Demonstrates Geothermal + Natural Gas Co-Generation Potential
Figure
13 – FutEra Power Project Demonstrates Geothermal + Natural Gas Co-Generation Potential
Source: Razor Energy Corp., FutEra Power, ATB Capital Markets Inc.
2) Supplementary Solar Arrays: Solar cells can be added to geothermal projects as a source of emission-free energy (aside from upstream Scope 3 emissions), which can be used to increase the efficiency of geothermal operations by offsetting the parasitic load of facility equipment – primarily pumps used to reinject water. Solar cells could also be a revenue source in jurisdictions with a carbon pricing scheme in place.
3) Direct Use: Low-grade or residual heat from produced brine can be utilized in a variety of applications, which can include green housing, fish farming, agricultural drying, heating & processing, cement and aggregate drying, and building heating and cooling. Overall, the temperatures found in most geothermal resources are too low for certain industrial applications such as hydrogen production or cement and aggregate drying applications, and we believe the previously mentioned low-grade applications are the most viable direct use applications for most geothermal projects. Direct use requires relatively close proximity to the application site and requires pipeline infrastructure to be built to transport and return water; we view this as the most significant limitation of direct use geothermal applications.
“… in scenarios where direct use applications are viable, they can represent a significant value-enhancing secondary opportunity when paired with primary geothermal power generation.”
That said, in scenarios where direct use applications are viable, they can represent a significant value-enhancing secondary opportunity when paired with primary geothermal power generation. In our view, the proposed Alberta No.1 project by Terrapin Geothermics is a good example of this – expected returns on the project are significantly enhanced by the addition of a direct use heating revenue stream. In Figure 17, we present an economic model for the Alberta No.1 project that illustrates the large proportion of revenue that can be derived from heat sales (roughly 20% at $3.65/GJ).

CHOA eJournal – 24 NOVEMBER 2022 | 8
Geothermal Temperature Gradients and Applications


Figure 14 – Geothermal Temperature Gradients and Applications
Source: U.S. Department of Energy
CHOA eJournal – 24 NOVEMBER 2022 | 9
Case Study
Latitude 53 – Direct Use for Aquaponics in Alberta
Novus Earth’s Latitude 53 project in Hinton, Alberta, is a project that proposes to combine a conduction-based closed loop geothermal power generation system with a direct use heat installation to pipe heat to an aquaponics facility configured to grow produce and seafood. We understand the project would cost roughly $100 mn-$150 mn, including roughly $15 mn-$20 mn for well costs, $10 mn-$15 mn for power generation equipment (ORC), and likely $80 mn$120 mn for a vertical farming/aquaponics facility. The project plans to use the majority of its 3.1 MW power capacity and the heat generated to run the aquaponics facility, with some excess power sales to the grid. The project is scoped to produce roughly 5.0 mn kg/year of produce (tomatoes, lettuce, bell peppers, swiss chard, wax beans, strawberries, and raspberries) and 500k kg of pacific white shrimp. Our understanding of initial projections suggests the project could generate upwards of $30 mn of EBITDA per year, primarily through sales of produce and shrimp, with upside based on an increasing price of carbon offsets. Novus Earth expects to drill an exploration well to roughly 4 km depth near Hinton in late 2022 to confirm the formation’s heat and other characteristics. Following this, Novus Earth plans to complete a funding round to finance the construction of the closed loop system, which would include two 4 km vertical well pairs and four horizontal sections. Heat at target depth is believed to be upward of 1500 C given a heat anomaly near Hinton, and the closed loop system could produce water to surface at roughly 1300 C, which would then be stepped down to roughly 700 C after being utilized for power generation. The project has secured $5 mn in federal funding through the Smart Renewable Energy and Electrical Pathways program, which will be used to fund ongoing front-end engineering and design (FEED) and technical feasibility studies for the project.
CHOA eJournal – 24 NOVEMBER 2022 | 10
Latitude 53 Project Combines Closed Loop with Direct Use in Northern Alberta
4) Lithium and Other Mineral Recovery: Depending on the minerals present in the reservoir, secondary mineral extraction may be value enhancing. According to a report by the California Energy Commission (CEC), lithium is often found in small but significant concentrations in geothermal brines (a few hundred ppm), and because of the high volumes of geothermal wells, geothermal brine can be a meaningful source of lithium production. A CEC report found that “the co-production of geothermal power and lithium carbonate will effectively lower the cost of geothermal power in California, making geothermal energy competitive with other sources of renewable energy”.
More specifically, the report estimates that the Salton Sea Known Geothermal Resource Area (KGRA) in California could produce over 600,000 tons/year (roughly 544,000 tonnes) of lithium carbonate with a value of roughly US$7.2bn at US$12,000/ton – which we calculate would represent over 500% of total global lithium carbonate production in 2021 (estimated to be roughly 100,000 tonnes). Secondary lithium extraction remains a relatively new concept for geothermal power projects, but increasing demand for lithium and increased R&D into costeffective lithium extraction techniques could accelerate its commercial application over the coming years and drive stronger economics for geothermal power projects. As an example, DEEP Earth Energy Production Corp. signed an agreement in October 2021 with Prairie Lithium Corporation to exchange subsurface mineral rights and establish an Area of Mutual Interest –the partnership will enable the two companies to work collaboratively to understand and potentially commercially produce lithium from DEEP’s geothermal brine in Saskatchewan. We

CHOA eJournal – 24 NOVEMBER 2022 | 11
Figure 15 – Latitude 53 Project Combines Closed Loop with Direct Use in Northern Alberta Source: Novus Earth
note that mineral extraction processes can not be used in closed loop geothermal systems, which would preclude this revenue stream from those economic analyses.
“Secondary lithium extraction remains a relatively new concept for geothermal power projects, but increasing demand for lithium and increased R&D into costeffective lithium extraction techniques could … drive stronger economics for geothermal power projects.”
5) Carbon Capture and Storage: While it is relatively early days, a significant opportunity likely exists in pairing carbon sequestration with geothermal power projects as 1) a value-enhancing opportunity and 2) to potentially increase the efficiency of enhanced geothermal systems. In its simplest form, there is potential for geothermal power projects to inject carbon dioxide into the geothermal reservoir, either with the brine or into a separate formation. In doing so, geothermal projects could benefit from incremental revenues through access to carbon offset credits. As an example, phase two of FutEra Power’s geothermal project contemplates the addition of carbon sequestration. In more complex applications, it may be possible to replace typical water-based working fluids with supercritical carbon dioxide (scCO2) in EGS systems. While there is some disagreement from scientists, scCO2 has potential benefits over water as a working fluid, including: 1) it may offer better net heat recovery and mass productivity than water; 2) it may offer better buoyancy than water, which can improve pump efficiency; 3) the use of scCO2 may decrease or eliminate scaling issues on equipment (though it may cause other issues); and 4) scCO2 may be a better alternative to accessing hot dry rock (HDR) geothermal resources where naturally occurring groundwater is not present.
“… geothermal projects could benefit from incremental revenues through access to carbon offset credits.”
Case Study
No. 1 Geothermal – Alberta’s First Conventional Geothermal Project No.1 Geothermal Limited Partnership (“No. 1”), led by Terrapin Geothermics, Inc. is developing Alberta’s first conventional geothermal project, located in the Municipal District of Greenview, Alberta, just south of Grande Prairie, and targeting a geothermal resource at just 1180 C – near the bottom end of the viable range for binary cycle power generation. The project is slated to produce 10 MW of baseload electricity, 985 TJ/year of direct use heat to nearby industrial users, and will also generate revenue from carbon credits with an anticipated carbon offset capacity of 96,000 t/year. The project is currently under development, with an anticipated completion date in Q2/25.
The project design includes three production wells and two injection wells connected to a binary cycle power plant at surface that would then flow into district heating infrastructure serving multiple light industrial facilities, including wood product manufacturing and sustainable agriculture in the region. Akita Drilling Ltd. was selected as the drilling provider for the project, and we understand the wellbores will vary in diameter, with the first injection well designed for a 7 1/2” production casing, while subsequent wells could be as wide as 9 5/8” or
CHOA eJournal – 24 NOVEMBER 2022 | 12
13 3/8”. Based on our understanding of the well design, these are similar to thermal wells in the oil sands and will utilize rigs with similar specs.
Alberta No. 1 signed an MoU with Annelida Casting Innovation in April 2021 to investigate the use of geothermal heat in a direct use capacity to heat a vermicomposting facility. Management also noted that Alberta No. 1 would also likely receive carbon credits from the Government given geothermal’s classification as a renewable. The credits would be calculated on the carbon mitigated relative to fossil fuel-based power plants.
We estimate the capital cost of the project at roughly $90 mn-$100 mn, with roughly two-thirds associated with finding and development costs for downhole infrastructure and the remainder for surface facilities and district heating infrastructure. We understand well development costs alone are expected to be $7 mn-$9 mn/well. To date, the project has received $25.4 mn in funding from Natural Resources Canada’s Emerging Renewable Power Program, which matched private sector dollars 1:1 on the condition that the geothermal project design was for at least 5 MW of power (net of parasitic load); funding under the Program excluded land acquisition costs, legal costs, and certain other costs.

Overall, we believe that, if the Terrapin No.1 Geothermal project is successfully executed and proves it can meet its revenue and return targets (see Figure 16 and our demonstration modeling in Figure 17), it would demonstrate the commercial viability of conventional geothermal projects in Alberta and could spur other projects in the province.
Project Economics
Terrapin disclosed its internal expectations for a 16% IRR based on $50/tCO2e, and an IRR of 22.6% based on a ramp to the Federal Government’s $170/tCO2 by 2030 (see Figure 16).
Expected Returns on No. 1 Geothermal Project
Figure 16 – Expected Returns on No. 1 Geothermal Project
Source: Terrapin Geothermics, Inc.
Conventional Geothermal Project Modeling
In Figure 17, we present a model for a conventional geothermal power plant based on Terrapin’s proposed Alberta No. 1 Geothermal project in Alberta that generates revenues from the sale of power, the sale of direct heat, and from carbon credits. Our model suggests that a
CHOA eJournal – 24 NOVEMBER 2022 | 13
project of this nature could expect to generate IRRs in the 13%-26% range depending on carbon, gas, and power pricing.
Return Model Based on Terrapin’s No. 1 Geothermal Project
Figure 17 – Return Model Based on Terrapin’s No. 1 Geothermal Project
Source: ATB Capital Markets
Key Assumptions
Nameplate Capacity: 10 MW, 78% uptime – consistent with our understanding of minimum geothermal power plant uptime and conservative relative to capacity factors for modern plants assumed to be in the 90%-95% range by the U.S. Department of Energy.
Capital Costs & Timeline: We assume a $90 mn capital cost for the project, allocated $5 mn in 2022, $15 mn in 2023, and $70 mn in 2024. We assume the project is commissioned January 1, 2025, and runs for 40 years.
Power Pricing: $100/MWh – in line with current ATB long-term assumption, plus premium for renewable baseload energy.

Gas Pricing (for Heating): $3.65/GJ–above long-term ATB estimate, assumes premium pricing or renewable energy and is inclusive of distribution costs; based on pricing assumption by Alberta-based developer.
Carbon Credit Pricing: $50/tCO2e flat rate for base case, with five scenarios (see Figure 18) ramping linearly to $210/tCO2e by 2030 in $40/tCO2e increments. Federal government carbon pricing proposal has carbon pricing ramping to $170/tCO2e by 2030.
Operating Costs: $2.0 mn per year, inclusive of sustaining capex based on discussions with developers.
Unlevered, No Grants: Our returns are on an unlevered basis with no government grants or funding.
Sensitivities to Gas and Power Pricing
We present two sensitivity analyses below, showing how the IRR of the project changes if 1) power pricing and carbon pricing are altered and 2) gas pricing (which influences the price available for direct use heat sales) and carbon pricing are altered.
CHOA eJournal – 24 NOVEMBER 2022 | 14
Power and Gas
Pricing
(District Heat) Sensitivity Analysis
Figure 18 – Power and Gas Pricing (District Heat) Sensitivity Analysis
Source: ATB Capital Markets Inc.
The base case, used in Figure 18, conservatively assumes that the current rate of federal carbon tax remains flat at $50/tCO2e, and assumes that power is priced at $100/MWh and district heat has a value of $3.65/GJ. In this scenario, our modeling suggests roughly a 14% IRR over a 40year period. Assuming carbon pricing increases to $170/tCO2e, our project modeling suggests roughly a 23% IRR. At $170/tCO2e, if power pricing is reduced to $80/MWh – in line with the ATB long-term assumption, then the return falls to 21.3%. On the other end, if carbon pricing reaches $170/tCO2e by 2030 and power is priced at $120/MWh – a possibility if energy demand rises at an accelerating pace – then our modeling suggests a plant similar to Alberta No.1 could generate a 23.8% IRR. At $50/tCO2e carbon pricing, each $10/MWh step in power pricing increases/decreases IRR by roughly 0.7%-0.8%; at $170/tCO2e, each $10/MWh step increases/decreases IRR by roughly 0.6%.
Gas pricing, on the other hand, is relatively less impactful to returns than power pricing – as is to be expected given that district heating represents the smallest proportion of our model’s baseline revenues (assuming $50/tCO2e carbon pricing). If carbon pricing increases to $170/tCO2e by 2030 and gas is priced at $3.05 – closer to the ATB long-term assumption – then return falls from 22.6% to 22.0%. If lower carbon pricing is compounded, then the worst-case return based on our model is 13.5% with $3.05/GJ gas pricing. On the other end, if carbon pricing reaches $170/tCO2e by 2030 and gas/district heat sales are priced at $4.25/GJ, then our modeling suggests the project could generate a 23.1% IRR. At $50/tCO2e carbon pricing, each $0.30/GJ-step increases/decreases IRR by roughly 0.3%; the intervals are similar at $170/tCO2e.

Case Study
Imperial Valley – Value Enhancements in California
The Imperial Valley geothermal complex located in California is made up of 11 geothermal power plants – one owned by EnergySource and 10 owned by CE Generation, LLC (subsidiary) and operated by CalEnergy Operating Corporation (subsidiary), which are both ultimately controlled by Berkshire Hathaway Energy (BHE Renewables), a subsidiary of Berkshire Hathaway Inc. The complex is situated within the Salton Sea KGRA, and the 11 plants together have a net generating capacity at nearly 400 MW, positioning it as the second-highest generating geothermal field in the US behind The Geysers. In the Imperial Valley, two additional geothermal power generation projects are currently being developed, each with a nontraditional feature.
CHOA eJournal – 24 NOVEMBER 2022 | 15
The first, put forth by Controlled Thermal Resources (“CTR”), is the Hell’s Kitchen Lithium and Power project, which is designed and planned to deliver 50 MW in geothermal electric power generation in 2023 and 20,000 tonnes of lithium hydroxide in 2024. Drilling commenced in Q4/21, and the target depth for the two wells was pegged at approximately 8,000 ft. Following the completion of drilling, brine testing must be conducted to prepare for power production and lithium extraction. Capital costs are not known at this time.
The second project, known as Project #501, is being spearheaded by GeoGenCo and is a closed loop EGS system, though technical specifications are scarce. The project is designed to deliver 18.5 MW (net) of geothermal electricity from an already drilled well. No capital costs were disclosed, and an expected commissioning date is not available, though GeoGenCo notes that the project is “shovel ready” and could be completed within 14 months of securing financing. If successful, Project# 501 could be among the first commercial, large-scale, closed loop systems that we are aware of. We note that, unlike other proposed closed loop designs, Project# 501 will access a high-temperature resource (roughly 370°C at roughly 3,500 m depth).
Beyond these two projects, BHE Renewables is currently constructing a demonstration project in the Salton Sea KGRA to recover lithium from geothermal brine to produce lithium chloride. Expected completion of this demonstration project is in 2022. Concurrently, BHE Renewables is developing a separate demonstration project to convert lithium chloride into battery-grade lithium carbonate with a 2024 completion date. Upon completion of both projects, the production process could be deployed on any of the Company’s 10 geothermal power plants at Imperial Valley as soon as 2024.
The next articles in this series will drill down further, into Enhanced Geothermal, Opportunities for the Oil and Gas Service Sector, Economic and Strategic Factors, and the Regional Landscape for Geothermal Development.
Watch for your upcoming weekly issues of the CHOA eJournal, most Thursdays!
CHOA eJournal – 24 NOVEMBER 2022 | 16


CHOA eJournal – 24 NOVEMBER 2022 | 17
Capital Costs
Power
Energy
Appendix A: Power Generation Technology Statistics Capital Costs and Emissions Statistics for Power Generation Technologies Figure 40 –
and Emissions Statistics for
Generation Technologies Source:
Information Administration, ATB Capital Markets Inc.
Appendix B: List of Geothermal Developers Geothermal Developers and Major Proposed Projects


Figure 41 – Geothermal Developers and Major Proposed Projects
Source: Company Reports, ATB Capital Markets Inc.

CHOA eJournal – 24 NOVEMBER 2022 | 18
Appendix C: List of Geothermal Technology Companies Geothermal Technologies and Strategic Investors


Figure 42 – Geothermal Technologies and Strategic Investors
Source: Company Reports, ATB Capital Markets Inc.
CHOA eJournal – 24 NOVEMBER 2022 | 19
Appendix D:
Upstream
Rig Activity and Market Sizing Scenario Analysis Key Assumptions
Capacity Growth Trajectory
We estimate the size of the global geothermal industry through 2050 based on the geothermal power generation growth trajectories laid out in the International Energy Agency’s (IEA) Net Zero by 2050 Scenario (2021), and the U.S. Department of Energy’s (DOE) GeoVision Report (2019). Scenario 1 – IEA Net Zero by 2050 – uses these development curves as prescribed by the IEA. Scenario 2 – ATB Progressive Growth Trajectory – uses only the 2050 capacity levels given by the IEA (126GW – global capacity) and the DOE (60GW – US capacity) as end points, and we assume a more progressive trajectory to these levels over time. Scenario 3 assumes a significant increase in global geothermal electrical capacity share from roughly 0.2% in 2022 to roughly 0.3% by 2030, roughly 0.6% by 2040, and 1.0% of the IEA’s total projected global electrical power generating capacity in 2050. For context, the IEA Net Zero by 2050 report forecasts total global electrical generation capacity to grow from roughly 7,800 GW in 2020 to roughly 14,900 GW by 2030, to 26,400 GW by 2040, and to 33,400 GW by 2050.
IEA Net Zero by 2050 Global Growth Trajectory: Within the IEA’s 2021 Net Zero by 2050 report, it outlines the capacity growth for geothermal electricity production required for the global energy supply to be net zero by 2050. The IEA estimates that, to achieve net zero by 2050, geothermal energy capacity will need to increase by roughly a 13% CAGR from 2021 to 2030 (roughly 3.4 GW/year), representing roughly a 250% increase in global geothermal capacity from roughly 15 GW in 2020 to roughly 52 GW by 2030. Longer term, the IEA’s modeling suggests geothermal capacity is required to grow to roughly 126 GW by 2050, representing roughly a 7% CAGR, in order to meet its net zero target. We note that the IEA characterizes the current pace of geothermal development as “not on track” to meet its net zero by 2050 target, meaning that the pace of geothermal capacity growth must increase from its current trajectory.
DOE GeoVision USA Growth Trajectory: The U.S. Department of Energy estimated that US geothermal electricity capacity alone could rise to roughly 60 GW by 2050, representing roughly a 10% CAGR from 2022 (roughly 4 GW capacity) to 2050. This growth trajectory is based on achieving three core objectives for the industry: 1) increased access to geothermal resources; 2) reduced costs and improved economics for geothermal projects; and 3) improved education and outreach about geothermal energy through stakeholder collaboration. Within Scenarios 1 and 3, we assume a 30% incremental market share for US geothermal capacity, which is slightly higher than the current share in the 25% range, given our belief that North American players are leading the world in terms of progressing geothermal innovation.
Within our modeling, we assume that conventional hydrothermal power generation capacity will continue to increase at its historical rate of roughly 3.5% per year. We then layer on “Next Gen Systems”, which include lower-temperature conventional developments, closed loop developments, and other innovations that increase the commercial viability of non-traditional high-temperature hydrothermal resources.
CHOA eJournal – 24 NOVEMBER 2022 | 20
Geothermal Innovation
Our modeling assumes that non-conventional geothermal developments are made increasingly commercial over time, which allows geothermal project development outside of the hightemperature hydrothermal resource bounds that have historically limited geothermal development growth. More specifically, our modeling assumes that ongoing investment in geothermal will advance efforts to 1) increase economic yields for conventional geothermal developments in the 100°-150°C temperature resource; 2) make closed-loop geothermal technology commercial, which would allow for non-hydrothermal resources to be tapped for geothermal power production; and 3) increase the commercial depth of geothermal drilling, which could increase the commercially available temperatures for geothermal wells. In essence, our modeling assumes that commercially viable geothermal resources will becoming increasingly viable around the globe as wells become cheaper and innovation increases the economic yield of medium- to low-temperature geothermal development. Aside from Scenario 3, we do not assume that breakthrough technologies, including deep closed loop and superhot geothermal technologies, will be widely commercialized.
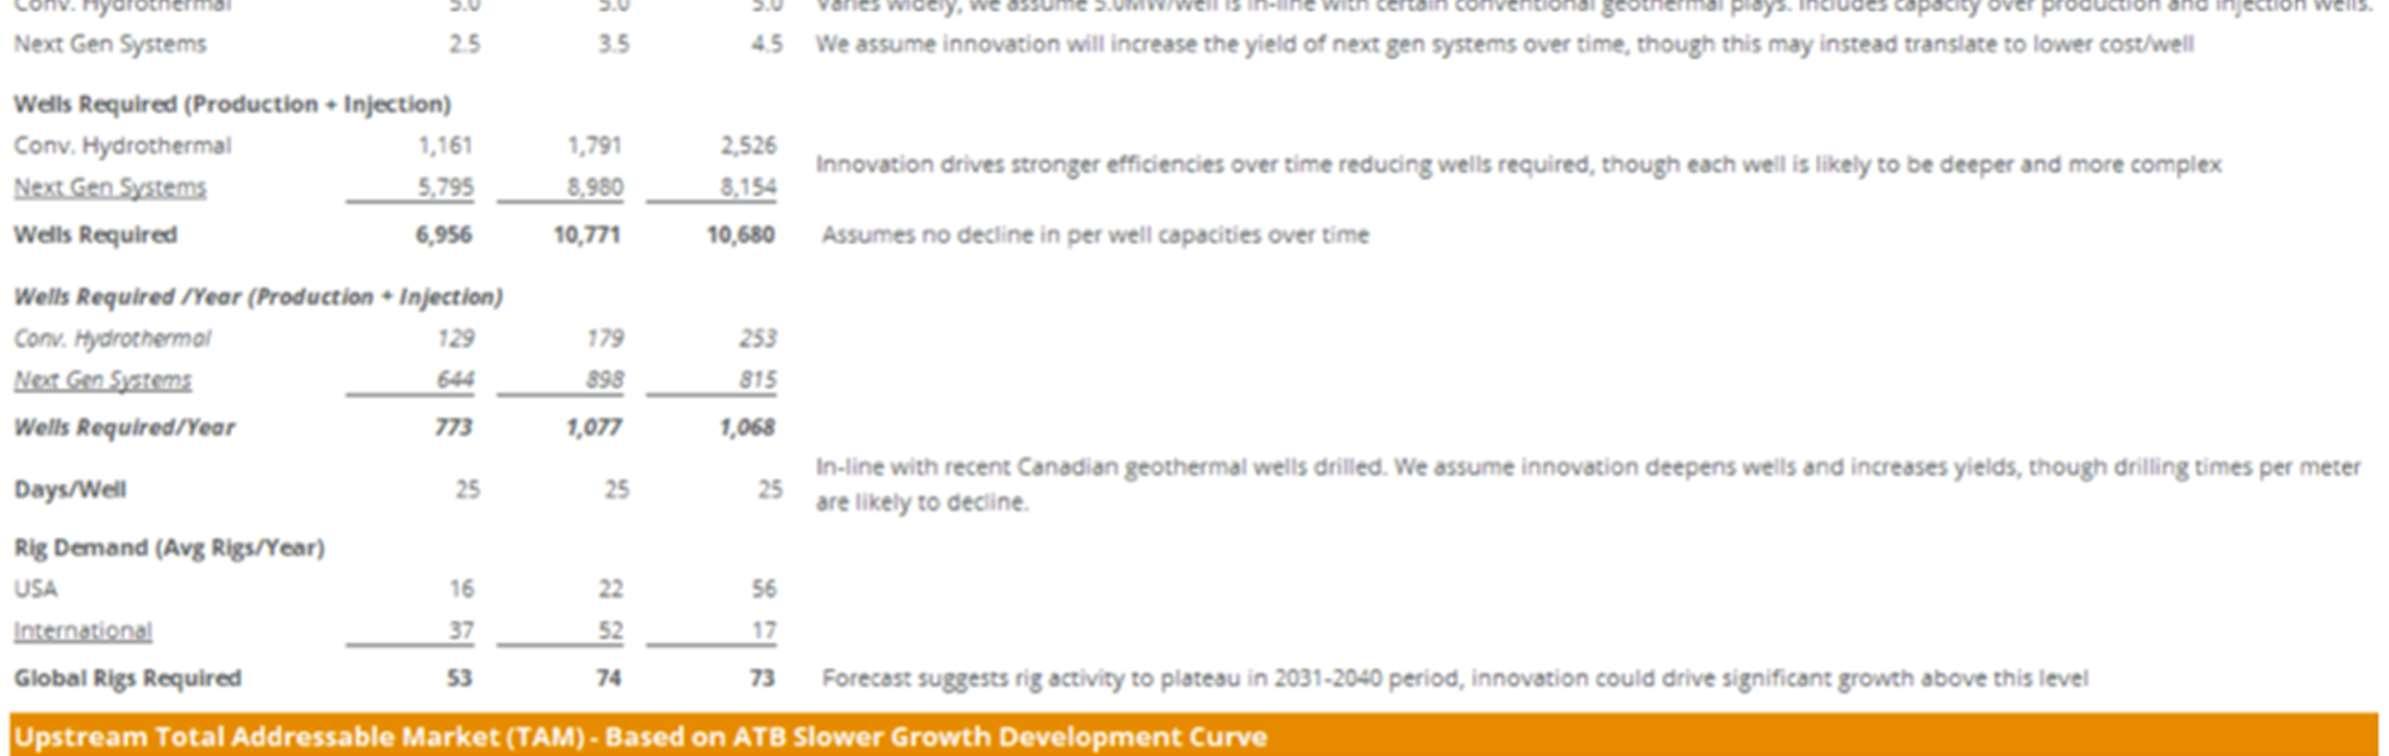
Higher Output, Flat Drill Times, and Costs per Well
Within our modeling, this assumption is reflected in increasing electrical generation capacity per well over time rather than a decrease in well cost or drilling days per well. Given our view that geothermal innovations are likely to drive increased economics, largely through access to deeper geothermal resources and through the commercial adoption of complex closed loop systems, we believe that total well cost is unlikely to materially decrease over time, though the cost per meter is likely to decrease and the energy capacity per well is likely to increase. Specifically, we estimate the energy capacity of non-conventional developments could begin to approach current high-temperature conventional generation capacity per well at roughly 5.0MW/well (ATBe) by 2050.
We note that generating capacity per well for geothermal developments varies widely and is largely dependent on the well type and the target formation heat. Data points are limited within our tracking of projects, and the range is large: higher-temperature conventional projects we track generate up to roughly 7.0 MW capacity per well, while lower-temperature projects we track are expected to generate on average roughly 1.5-2.0 MW/well. We do not include any electrical capacity declines on a per well basis in our analysis, though this is a factor that could have a marginally positive influence on activity and upstream market size.
Upstream Services Demand
We assume 25 drilling days per well on average for a geothermal well, in line with the average well times for known geothermal wells drilled in Canada since 2019. We assume that geothermal innovations are likely to increase drilling rates (rate of penetration), though this is likely to be offset by innovations to drill wells deeper.
CHOA eJournal – 24 NOVEMBER 2022 | 21
Upstream Addressable Market Sizing
Based on channel checks and our understanding of in-flight geothermal projects, we estimate roughly $5.0 mn - $9.0 mn in well development costs per geothermal well. We assume this range will be flat through 2050 given increased complexity and depth of wells as innovation accrues to increased output for “Next Gen Systems” in our analysis. We note that our market size estimates do not include the market for surface power generation equipment or upstream infrastructure, which we believe could represent 40%-60% of project costs. We note that our estimates suggest that the TAM for geothermal is likely to peak in the 2022-2030 period as innovation drives down the cost per MW over time.
Risks and Opportunities to our Upstream Geothermal Activity Forecasts
Geothermal Innovation is Both a Risk and an Opportunity
Our forecasts inherently rely on uncertainty related to the pace and level of innovation including 1) new value-add components to conventional systems; 2) lower-cost and better processes for deep drilling to access higher temperature resources; and 3) EGS system innovations such as closed loop geothermal becoming commercial to some degree. We believe these innovations are required for geothermal capacity to increase to the level required for the IEA’s net zero target by 2050 and in the DOE’s forecast for 60 GW of US geothermal capacity by 2050. That said, we believe that if the geothermal industry, with the backing of major energy companies, is able to drill SHR geothermal resources (10-20 km) and develop commercially viable deep closed loop systems, geothermal could become a globally ubiquitous and economically competitive power generation technology that would be long-life, baseload, and dispatchable – significantly advantaged over other renewable energy sources, in our view. We believe these preconditions are likely necessary to achieve 1.0% or more of the global energy capacity market, though 1.0% may prove conservative in this scenario.
Carbon Pricing Mechanisms are a Major Economic Factor
Carbon pricing mechanisms are a major source of economic value for geothermal projects, especially those targeting moderate-temperature resources. As such, we believe the pace of carbon pricing increases are fundamental to the viability and growth of geothermal projects globally. As geothermal innovation progresses, there is likely to be a time when lowertemperature geothermal plays and deeper geothermal projects may be viable on a standalone basis. For now, we believe jurisdictions with the most incentives for carbon reduction and the steepest inflation in carbon pricing mechanisms are likely to be among the strongest geothermal growth markets.
Oil Well Conversions and Direct Use Are Not Considered
Our modeling only includes activity associated with greenfield power generation projects and does not include capacity that may come from innovations that access oil and gas well conversions (not commercially viable at this stage), and it does not include projects for direct use. These types of projects could drive upside to our activity and spending forecasts.
CHOA eJournal – 24 NOVEMBER 2022 | 22
Scenario 1: IEA Net Zero by 2050 Trajectory


Figure 43 – Scenario 1: IEA Net Zero by 2050 Trajectory
Source: ATB Capital Markets Inc.
CHOA eJournal – 24 NOVEMBER 2022 | 23
Scenario 2: ATB Progressive Growth Trajectory


Figure
44 – Scenario 2: ATB Progressive Growth Trajectory
Source: ATB Capital Markets Inc.
CHOA eJournal – 24 NOVEMBER 2022 | 24
Scenario 3: ATB 1% of Global Capacity by 2050


Figure
45 – Scenario 3: ATB 1% of Global Capacity by 2050
Source: ATB Capital Markets Inc.

CHOA eJournal – 24 NOVEMBER 2022 | 25

