Aspen and Snowmass Fourth Quarter 2022 Market Report
 Report Written By: Elliot F. Eisenberg, Ph.D. Source: Aspen Board of Realtors Multiple Listing Service
Economic Overview
Nationally
By: Elliot F. Eisenberg, Ph.D.As we look back on 2022, it would be fair to tap classic literature and say that 2022 was a tale of two economies. In the first half of the year, the economy was somewhat terrible, with negative GDP growth in both quarters, while the last half of the year we saw very strong GDP. 22Q3 growth was about 3.2%, and while we don’t yet know what 22Q4 will look like, early estimates suggest 2.5%-3.0%. However, the important thing to remember is that the economy was not nearly as bad in the first half of the year as the numbers suggested, while similarly the second half of the year was not nearly as strong as the numbers may imply. When taken together, the picture is of an economy that is slowing somewhat, not disastrously, but certainly starting to moderate from the frenetic post-Covid pace. We see this in a number of measures; for example, job creation has steadily declined throughout the entire year, wage growth appears to be slowing and the manufacturing sector is slipping into recessionary territory.
It’s important to remember that this economic slowing is a feature and not a bug of Fed monetary policy. High interest rates are intended to slow inflation by decreasing consumption, and how long the Fed keeps rates at these higher levels will depend on how quickly and how much inflation declines. We’ve already seen some inflationary pressures start to ease. As fuel prices have come down, shipping and trucking costs have declined, and the percentage of household income spent on gasoline has eased. Generally, increases in the cost of goods have slowed, so, for example, new car prices and used car prices are both falling. Consumer electronics prices and availability have stabilized as the chip shortage ebbs, and food prices, with a few exceptions, are generally not rising. Goods prices are expected to contribute to deflation going forward. The larger problem now is services inflation, a majority of both GDP and consumer spending. The shortage of available workers continues to plague the service economy and push the cost of services up; everything from airline tickets to haircuts. To address continuing services inflation, the Fed is likely to increase rates further in the first quarter of 2023, and then keep them at that elevated level through all or most of the year and see how services inflation responds.
Given the current economic trajectory and the fact that interest rates will remain elevated well into 2023, it certainly seems likely that the economy will continue to weaken, the big questions are by how much and how quickly does that happen? Will we see a “soft landing” or a recession, and if we have a recession, will it be a mild one, or one that is relatively deep? While most economists expect a recession in 2023, some are predicting the hoped-for soft landing. That said, the difference between these two alternatives is likely to be small. Those expecting a recession anticipate a mild one, with unemployment rising two to maybe twoand-a-half percentage points and no calendar year 2023 GDP growth. Those forecasting a soft landing see unemployment rising by one percentage point and GDP growing anemically.

“High interest rates are intended to slow inflation by decreasing consumption, and how long the Fed keeps rates at these higher levels will depend on how quickly and how much inflation declines...”
Housing Market Overview
Nationally
To understand just how much the housing market changed over this past year, consider this: as recently as February 2022, month-over-month home prices appreciated 1.9%, and they rose by 2.1% in March 2022, the two strongest months on record. Then appreciation rates slowed to 1.7% in April, 1.3% in May, and 0.2% in June. Starting in July, prices fell 0.5%, in August they declined 0.9%, and in September they dipped 0.7%. The housing market went from scorching hot to stone cold in six months. We see the slowing in both new home construction and existing home sales. Of course, the overarching cause of the slowing is that thirty-year fixed mortgage rates literally doubled over the course of 2022, from roughly three percent in early 2022 to over six percent in late 2022, with a short period in late October and early November where rates were over seven percent.
The combination of high home prices and high interest rates have shifted many potential buyers from the ownership to the rental market. We’ve also seen slowing in the home improvement/home renovation market as rates on home equity lines of credit increase and home price appreciation slowed or started to decline, and the refinance market has ground to a virtual standstill. The multifamily and rental markets remain fairly strong but are also subject to some slowing as rates continue to rise, and in some areas new apartment construction may be reaching the saturation level. Again, it’s important to remember that this slowing is the goal of tighter Fed monetary policy, not some unintended consequence, and is intentionally designed to slow down inflation by dampening demand.
In terms of existing home prices, the most important story to watch is housing inventory. At the national level, we have a bit more than three months of inventory on the market, which is still well below the commonly accepted healthy level of about five to six months, and that is why prices have stayed at historically high levels. If inventory levels start to rise suddenly, that could be a sign of trouble, but most experts don’t see that as likely,
mainly because of the mortgage “lock-in” phenomenon. The vast majority of homeowners with a mortgage have a fixed-rate mortgage that is well below current market rates, making it highly unlikely that they will sell or upgrade by choice. Moreover, the job market remains surprisingly strong, and most homeowners are flush with equity that they accumulated over the last several years in the skyrocketing housing market, making a wave of foreclosures or forced sales unlikely. Finally, the top-to-bottom redesign of the home mortgage market resulting from Dodd-Frank and regulatory updates culminated in substantially tighter credit underwriting standards. It would now take a 40%-45% decline in home prices to cause damage comparable to the 2006-2009 Housing Bust, and even back then, the average price decline was 28%.
In terms of new home construction, on the single-family side, activity has already slowed significantly in response to higher rates and recession fears. A combination of higher borrowing costs for multifamily developers and declining rents will undoubtedly start to slow apartment and condo construction. In fact, the most recent quarterly survey of apartment market conditions done by the National Multi-Housing Council showed the index has declined from a spectacular 95 to just 20, one of the weakest readings in decades, over a 15-month period.
In summary, in terms of a forecast for the housing market in 2023, I think we will start to see improvement toward the end of 2023 if inflation continues to slow to the point where the Fed can begin signaling a true pivot to lower rates. Home prices may well decline for several more months, but it’s hard to see the declines going much longer and should be relatively shallow, perhaps an additional four to five percentage points.


“In terms of existing home prices, the most important story to watch is housing inventory...”
Economic Overview
Colorado

Unemployment in Colorado is 3.5% as of 11/22 after hitting a peak of 11.8% in 05/20 (for comparison, the prepandemic rate was 2.8%). Statewide continuing claims for unemployment hit a high of 265,499 for the week ended 5/16/20 (compared to a pre-pandemic level of 21,956) and are now at 21,211 for the week ended 12/17/22. In Pitkin County, the November unemployment rate was 5.2%, a year ago it was 5.3% (prior to Covid it was 5.4% in November 2019) and for comparison, in 08/19 it was 2.2%. Essentially, the labor markets are back to where they were pre-Covid. Although we anticipate a mild recession in 2023, bear in mind that Colorado has typically entered the recession later than the rest of the country and exited later, so we may not see recessionary impacts on the Colorado job market as quickly as we see them nationwide.
Statewide, the November 2022 (latest data available) median price of a single-family home of $545,000 was 2.8% higher than November 2021, while the average price of $717,642 was 5.2% higher. In the condo/ townhome market, the median price gained 6.3% to $420,000, while the average price was nearly flat at $556,764. Through November, closed sales across the state are down 41.8% while new listings have declined 25.4%. There are 17,466 active listings statewide at the end of November, a 61.6% increase over November of 2021, and that represents a 1.9 month’s supply of inventory, still well below the national level of 3.3 months. Across the state, the percentage of list price received at sale is 98.1% and days-on-market has increased to 46 days, up from 30 days in November 2021. As the Colorado real estate market continues to cool and inventories rise, buyers are finally seeing some relief as sellers offer price concessions.
In terms of overall demographics, Colorado is now seeing very mild population growth, and ranked 19th in 2022 population growth with net in-migration of 29,000. Colorado has slipped from the top tier of inmigration states largely because housing prices are so high, and there are more favorable tax environments in other states. Still, there are no indications of an oversized market correction in the Colorado housing market as it remains highly desirable in terms of lifestyle and job opportunities.
“As the Colorado real estate market continues to cool and inventories rise, buyers are finally seeing some relief as sellers offer price...”
Economic Overview
ASPEN SNOWMASS
The median sale price of a single-family home in Aspen in 2022 was $13.6 million, a gain of 36% over 2021, while the average price rose 43% to $18.6 million. Townhome and condo prices in Aspen gained more on a percentage basis, with a median sale price of just over $3.2 million (up 48% compared to last year), and an average price of nearly $4.7 million, up 47%.
In the single-family market in Snowmass Village, the median price rose 21% over last year to $6.3 million while the average price rose 34% to nearly $7.3 million. Townhomes and condos in Snowmass Village saw the highest year-over-year price appreciation, with the median price gaining 66% to nearly $1.6 million while the average price rose 48% to $2.1 million.
During 2022, there were 333 residential properties sold throughout the Aspen/Snowmass Village area, about half the level of a year ago, but rising prices helped sales volume, which only declined by about 31% compared to last year. At the end of the year, there were 85 single-family homes on the market throughout the entire Aspen/Snowmass Village area and 135 townhomes and condos, collectively up 69% from last year.
While prices in the Aspen/Snowmass Village area continue their rapid appreciation, especially in the townhome and condo market, we have seen some deterioration in sales activity. Inventories have increased slightly, but days on market is down and the percent of list price to sales price remains largely unchanged.
Since the Aspen/Snowmass Village market is more oriented toward high wealth buyers and cash purchases, the increase in mortgage interest rates has had a limited impact on prices. What could be more meaningful in 2023 is continued declines in the stock market, the tightening of private equity and venture capital markets, and the weakening in the tech sector. Still, as Dr. Eisenberg notes: “There are few indications that Aspen/ Snowmass Village area will see the type of price declines that we are beginning to see across the rest of the country.”

“Since the Aspen/Snowmass Village market is more oriented toward high wealth buyers and cash purchases, the increase in mortgage interest rates has had a limited impact on prices.”
The median price for single family homes in Aspen for 2022 rose to $13.60 million, gaining 36% over last year’s $10 million. The average sale price of $18.6 million was 43% higher than last year.
The number of closed sales fell by half which brought down overall dollar volume 29% to $1.3 billion. Average sold price per square foot gained 39% and rose from $2,198 in 2021 to $3,048 in 2022.
As of the end of December, there were 39 single-
family homes on the market, compared to 67 at the same point last year, a 72% increase.
The most expensive single-family home sold in Aspen during 2022 was for $60 million, compared to the record high of $72.5 million during 2021.
Days on market fell from 239 to 163, while percent of sold price to original listing price rose from 94% last year to 95% this year.

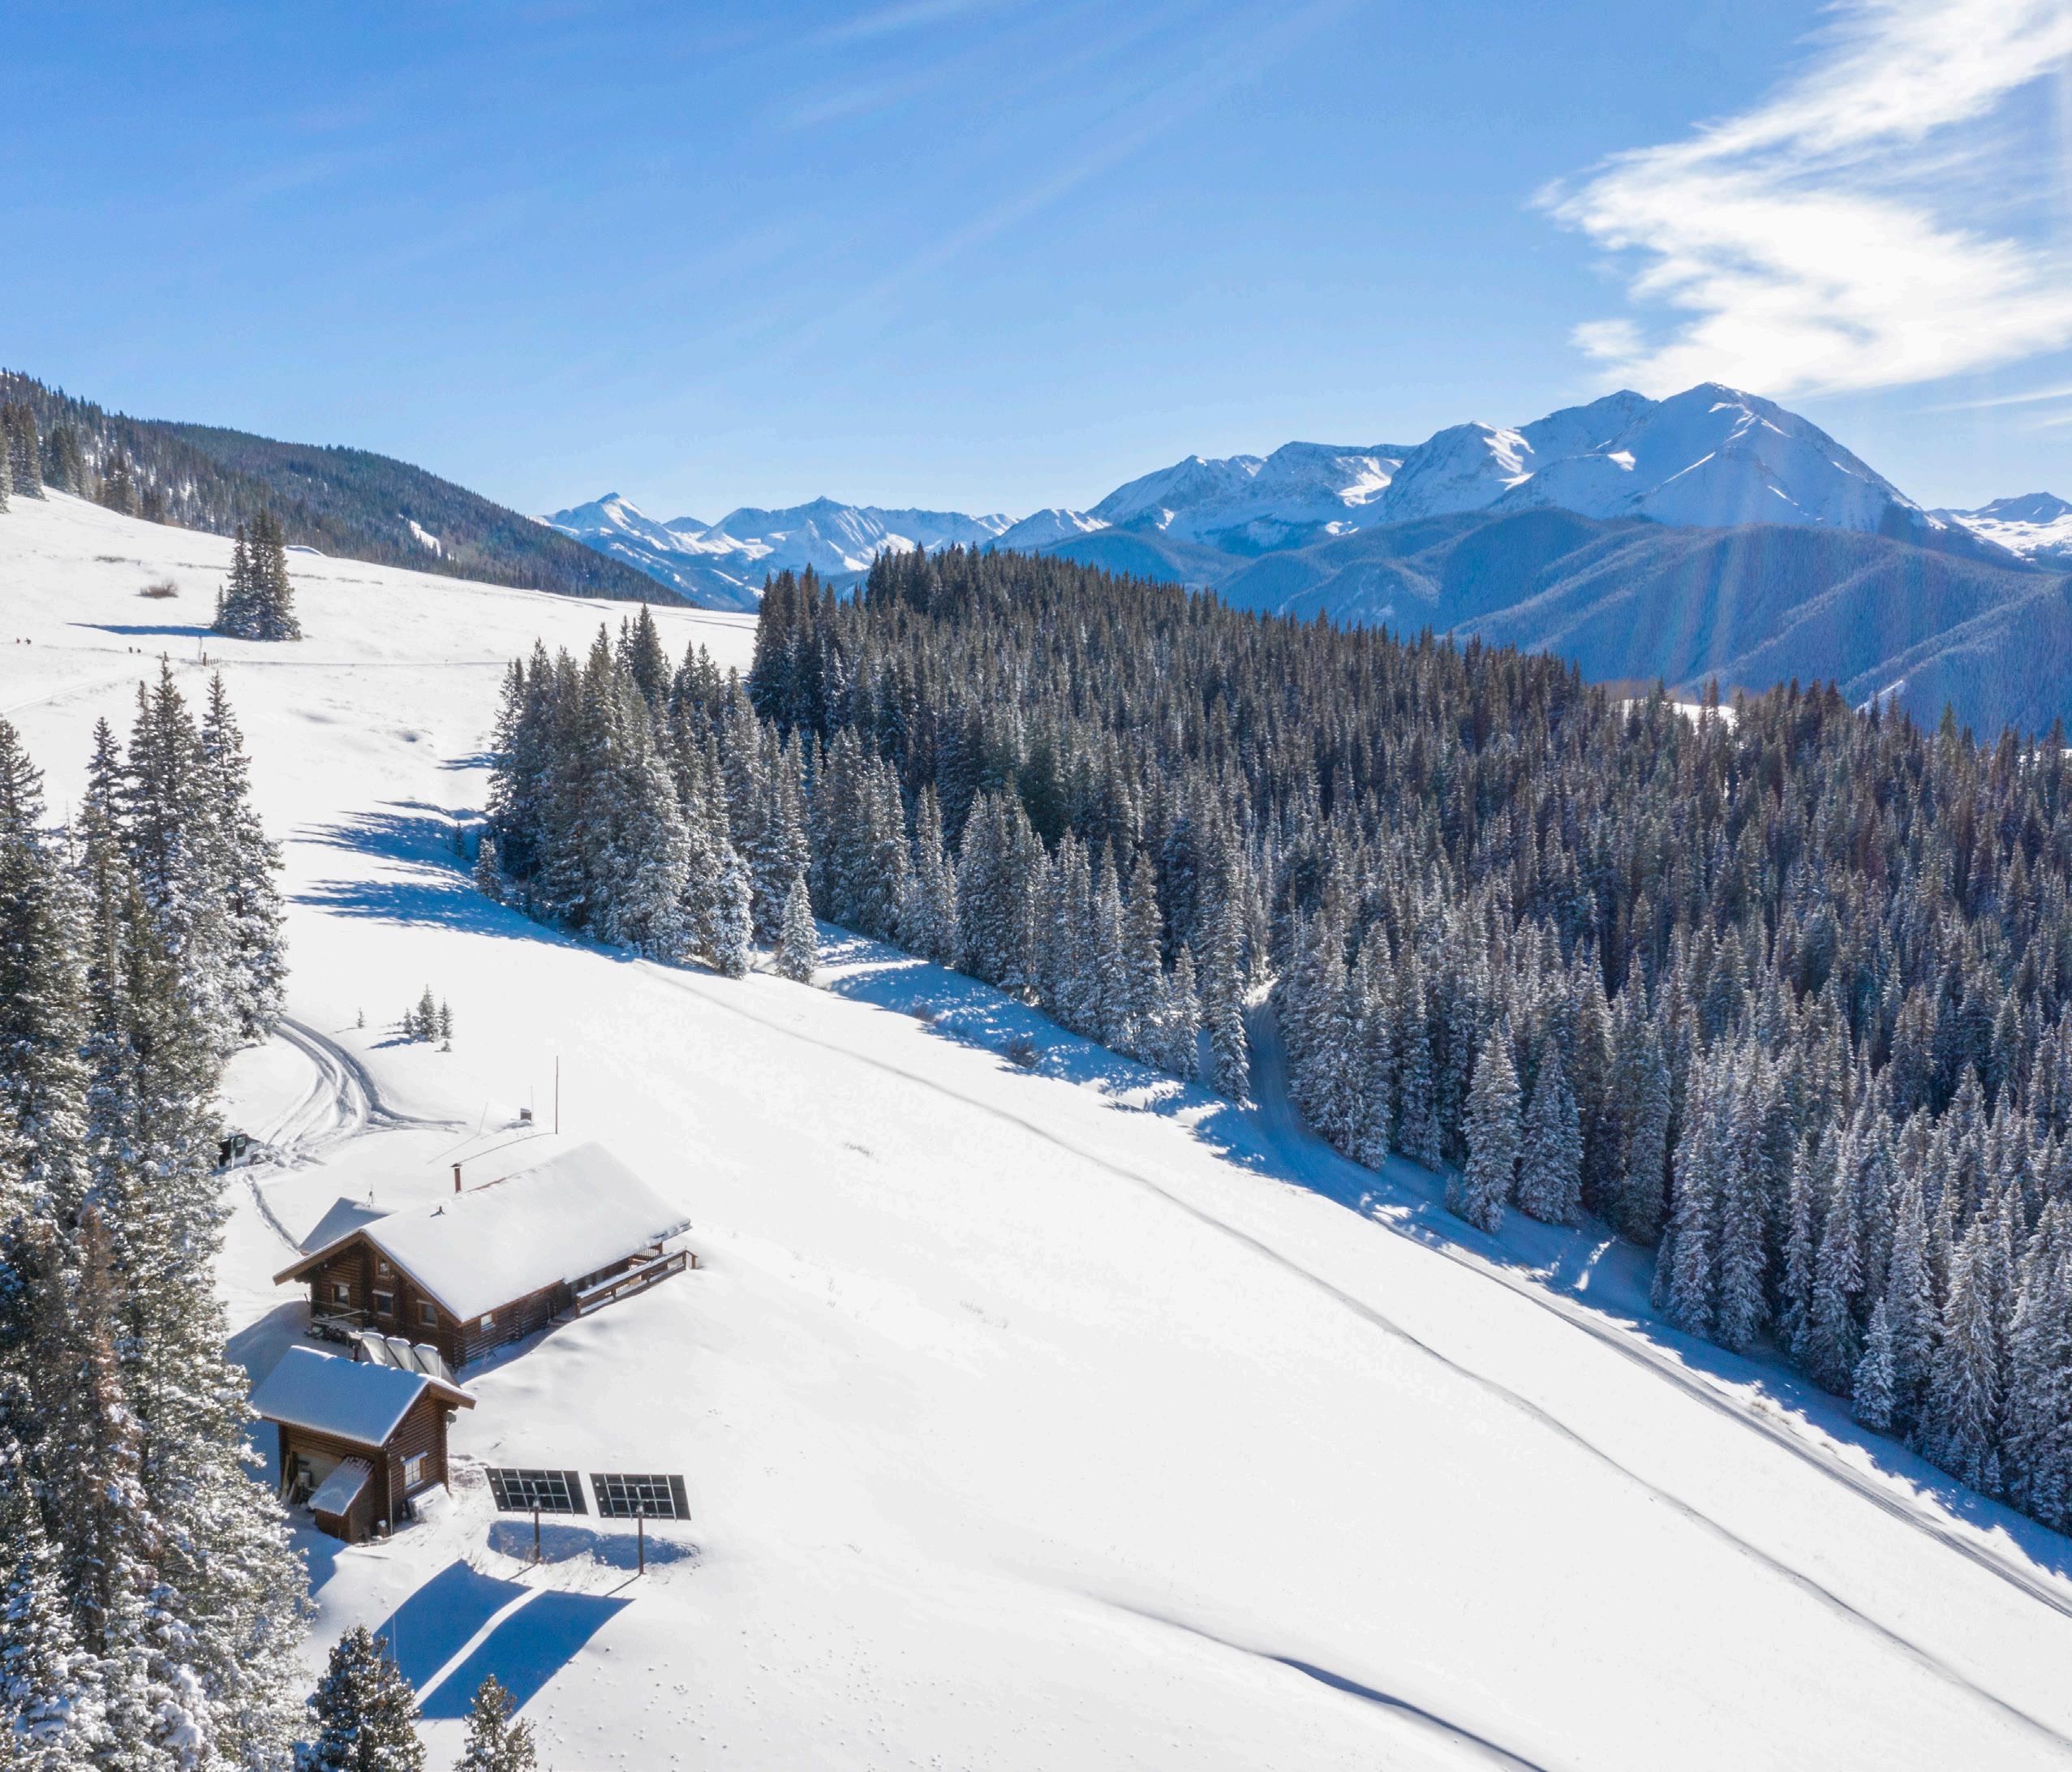
Townhome and condominium prices in Aspen saw larger percentage price gains than single family homes, with the median and average sale prices rising about 48% compared to last year, to $3.2 million and $4.7 million, respectively.
The number of properties sold decreased by more than 50%, with just 115 closed sales in 2022 compared to 245 in 2021. Resulting dollar volume declined by 31.0% to $539 million, although the average price per square foot rose to $2,880, a 36% gain over last year.
Condo and townhome inventories quadrupled compared to last year, with 52 units on the market.
In the Aspen condo/townhome market, the most expensive unit sold in 2022 was for nearly $26 million, compared to the $36.5 million peak in 2021.
Days on market for condos and townhomes during 2022 was 98 days compared to 153 days in 2021 and percent of sold price to original list price stayed consistent at 97%.

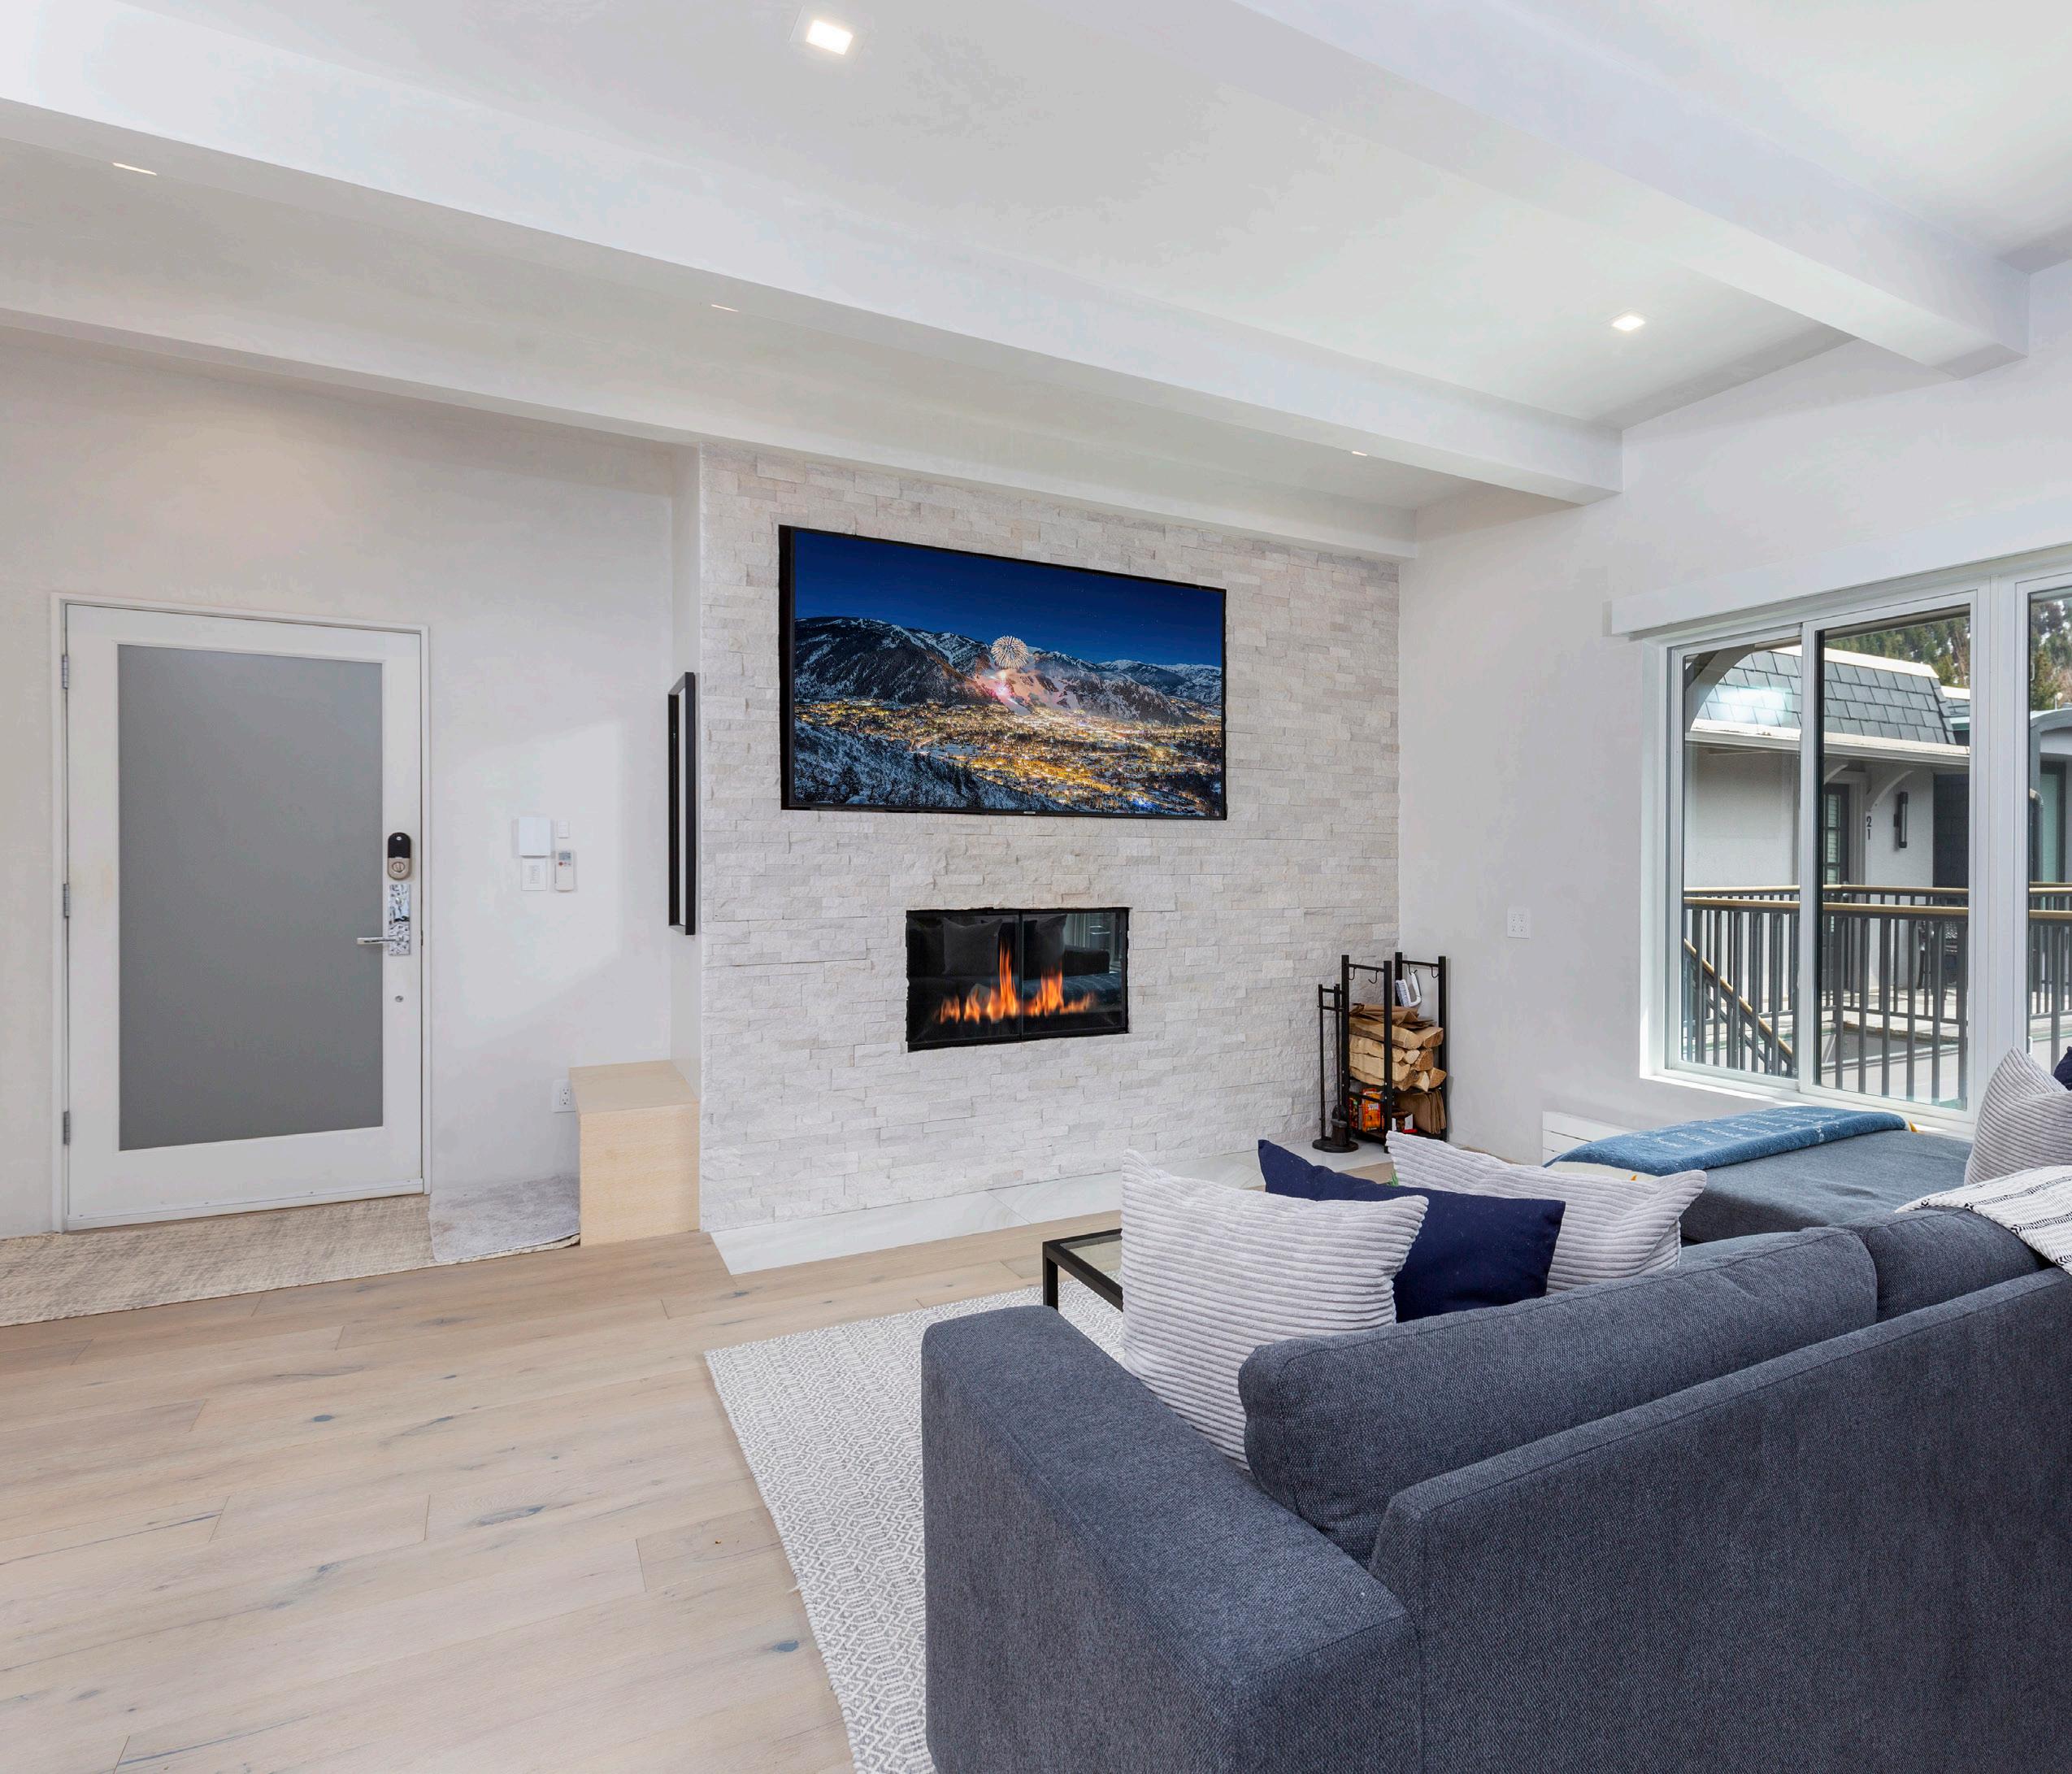
In Snowmass Village, the median sale price of a single-family home sold during 2022 rose to $6.3 million, a 21% increase over last year. Average price rose by 34% to just under $7.3 million. Average price per square foot increased by 28% to $1,598.
Closed sales declined by 55% to 33 and dollar volume was down 40.0% to nearly $240 million.
There were 18 single-family homes for sale in Snowmass Village at the end of the year, triple the
six homes that were on the market last December.
The most expensive single-family home sold during 2022 in Snowmass Village was for $18.3 million, while the highest price in 2021 was $12.5 million.
Days on market for single-family homes in Snowmass Village barely declined from 188 days last year to 180 days this year, while the percent of sold price to original list price stayed steady at 96%.


Condo and townhome median prices in Snowmass Village of $1.6 million rose by 66% compared to last year, the largest percentage gain across the market. The average price rose by 48% to just over $2.1 million. Closed sales during 2022 decreased by just over 53% to 114, and overall sales volume declined by 31% to nearly $242 million. Average price per square foot gained 50%, rising from $1,009 in 2021 to $1,509 in 2022.
At the end of the year there were 83 townhome or condo units on the market in Snowmass Village,
compared to just 11 last December.
In the Snowmass Village condo/townhome market, the most expensive property sold in 2022 was for $7.5 million, compared to last year’s record of $9.0 million.
Days on market for condos/townhomes in Snowmass Village declined from 136 days in 2021 to 91 days in 2022, while the percent of sold price to original list price declined just slight from 98.0% to 97.0%.





















LIFESTYLE. LUXURY. LEGACY.
520 E Durant Ave Suite 205, Aspen • 970.544.5800
Properties@ChristiesAspenRE.com • ChristiesAspenRE.com
