Report Written By: Elliot F. Eisenberg, Ph.D.
Source: Aspen Board of Realtors Multiple Listing Service

Aspen and Snowmass First Quarter 2023 Market Report
ASPEN | SNOW MA SS
Economic Overview Nationally
By: Elliot F. Eisenberg, Ph.D.
The first quarter of 2023 started off strong, with good job growth and declining inflation, but as growth slowed toward the end of the quarter, the preliminary forecast for 23Q1 slipped into the 1-2% range. In the largest economic news of the quarter, mid-March brought the failure of Silicon Valley Bank and several other large U.S. banks, followed by the Credit Suisse collapse.

These bank failures presented a new wrinkle in the Fed’s ongoing battle with inflation, as they must now simultaneously address inflation by raising interest rates while bearing in mind the possible impacts of additional duration risk to the banking system. As the markets watched to see what the Fed would do, in late March, they raised the Fed funds rate 25 basis points, but in a nod to current conditions, they removed the expected “ongoing increases in the target rate” in their normal presser and replaced it with the phrase “some additional policy firming may be necessary,” which is the strongest indication so far that this rateraising cycle may be nearing the end. However, this should not be construed as a pivot, and based on recent Fed announcements, we are likely to be into 2024 before we see rate cuts. The Fed will instead use other tools to help shore up the banking industry instead of lowering interest rates, since lowering rates could breathe new life into inflation, which would be much more detrimental in the long run.
Importantly, the stressors on the banking system make it more probable that credit standards will tighten, and bank financing will be harder to obtain. In the immediate aftermath of the SVB crisis, financial conditions and lending standards quickly tightened by as much as 150 basis points but have loosened substantially since. Fortunately, there are other sources of financing, such as capital markets and private funding. That said, if banks are more reluctant to lend, this will undoubtedly slow the economy. The key question now is how likely is the Fed to raise rates at their May and June meetings? Based on economic conditions in early April, a May increase seems highly probable, but one in June is quite unlikely as the Fed will probably want to assess the impacts of prior rate hikes to see how close to the peak of the cycle they are.
Overall, the economy remains hobbled by the fear of inflation, and with all the other factors at play, the odds of a mild recession are quite high. We are facing a significant number of headwinds at present. Manufacturing is in a recession and capital expenditures are down. Consumer sentiment is low and consumer spending is starting to slow as higher rates take their toll. The tech and financial sectors have taken a beating over the last several months. The yield curve is inverted, and most leading economic indicators are at levels traditionally associated with recessions. The key strength of the economy right now is in the labor market as job creation remains double trend growth. In the most recent jobs report, the labor force participation rate rose, and wage growth continues to decline.
“Overall, the economy remains hobbled by the fear of inflation, and with all the other factors at play, the odds of a mild recession are...”
Housing Market Overview
Nationally
In the national housing market, while high interest rates continue to stifle activity, prices remain relatively solid in most areas of the country, although nationwide year-over-year prices declined in February 2023 for the first time in more than ten years. The strongest housing markets are in the south and the weakest are in the west. In what is unambiguously good news for housing, the recent bank failures and increasing fears of recession have led to a “flight to quality” by investors, and as a result, bond prices are up and yields are down. Mortgage rates have eased slightly, leading to a mild uptick in new mortgage applications and hopes for some improvements in the re-fi market.

Nationwide, February sales picked up slightly on a seasonally adjusted basis as buyers took advantage of lower rates and more inventory to choose from. New pending sales improved dramatically in February, which promises a stronger start to the spring selling season. While inventories continue to rebuild, they remain at historically low levels, keeping something of a floor under prices. Builder confidence remains low but has improved slightly, and builders have generally been able to offer incentives and upgrades to move inventory rather than making drastic price cuts as was the case in the Housing Bust. Given the headwinds that the economy is facing, including high interest rates, mortgage lock-in, low inventory, high prices, and an overall weakening, the housing market remains relatively strong, and after the frenetic past several years, what we are seeing is a return to a more normal pace.
“Builder confidence remains low but has improved slightly, and builders have generally been able to offer incentives and upgrades to move inventory rather than making drastic... ”
Economic Overview
Unemployment in Colorado is 2.9% as of 02/23 after hitting a peak of 11.8% in 05/20 (for comparison, the pre-pandemic rate was 2.8%). Statewide continuing claims for unemployment hit a high of 265,499 for the week ended 5/16/20 (compared to a pre-pandemic level of 20,735) and are now at 23,416 for the week ended 04/01/23. In Pitkin County, the unemployment rate has been declining and the February unemployment rate was 2.6%, a year ago it was 3.5% and for comparison, pre-Covid in 02/20 it was 2.5%. Essentially, the labor markets are back to where they were before the pandemic. While all signs at the national level point to a mild recession, the Colorado economy may enter the recession slightly later and given the broad appeal of the Colorado market and relatively low tax burden, will likely recover more quickly.
Statewide, the March 2023 (latest data available) median price of a single-family home of $551,000 was 4.2% lower than March 2022, while the year-over-year average price also declined by 4.2% to $686,864. Prices were a bit stronger in the condo/townhome market, and while the median price declined 2.4% to $410,000, the average price rose a tiny 0.1% to $546,249. Through March, closed sales across the state are down 19.1% while new listings have declined 18.3%. There are 13,131 active listings statewide at the end of March, a 42.7% increase over March 2022, but that only represents a 1.6 month’s supply of inventory, still well below the national level of 2.6 months. Across the state, the percentage of list price received at sale fell to 99.1% (down from a staggering 104.2% at the end of March 2022) and days-on-market has increased to 55 days, up from 27 days last year.
Statewide, the November 2022 (latest data available) median price of a single-family home of $545,000 was 2.8% higher than November 2021, while the average price of $717,642 was 5.2% higher. In the condo/ townhome market, the median price gained 6.3% to $420,000, while the average price was nearly flat at $556,764. Through November, closed sales across the state are down 41.8% while new listings have declined 25.4%. There are 17,466 active listings statewide at the end of November, a 61.6% increase over November of 2021, and that represents a 1.9 month’s supply of inventory, still well below the national level of 3.3 months. Across the state, the percentage of list price received at sale is 98.1% and days-on-market has increased to 46 days, up from 30 days in November 2021. As the Colorado real estate market continues to cool and inventories rise, buyers are finally seeing some relief as sellers offer price concessions. In terms of overall demographics, Colorado is now seeing very mild population growth, and ranked 19th in 2022 population growth with net in-migration of 29,000. Colorado has slipped from the top tier of in-migration states largely because housing prices are so high, and there are more favorable tax environments in other states. Still, there are no indications of an oversized market correction in the Colorado housing market as it remains highly desirable in terms of lifestyle and job opportunities.

Colorado
“As the Colorado real estate market continues to cool and inventories rise, buyers are finally seeing some relief as sellers offer... ”
Economic Overview
ASPEN SNOWMASS
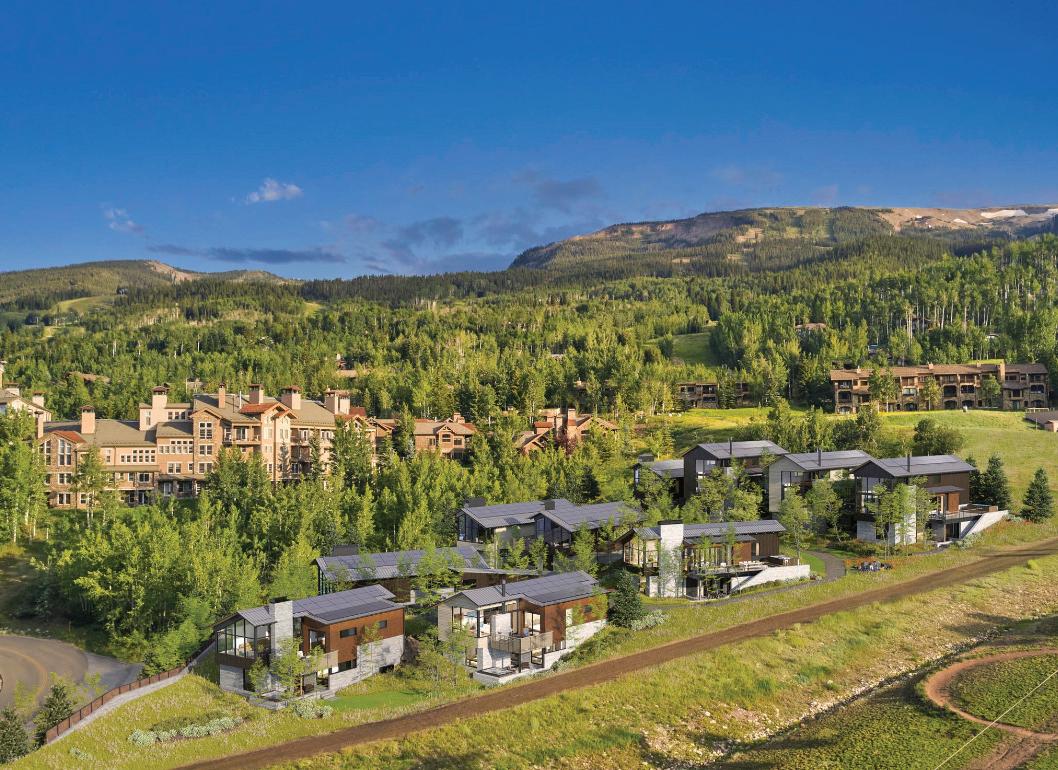
The median price of a single-family home in Aspen dipped this quarter to $11 million, a 28% decline compared to the first quarter of 2022, while the average price declined 32% to $12.4 million. The Aspen townhome and condo market remained strong, as the median price increased by 2% to $2.925 million, and the average price stayed level at almost $4.5 million. Single-family home prices in Snowmass Village fared similarly to the Aspen area, with the median price declining 25% to $4.9 million and the average price dropping 32% to $5.4 million. For Snowmass Village townhomes and condos, while the year-over-year median price declined 27% to $1.2 million, the average price rose 31% to $2.8 million, and the average price per square foot rose 12% to $1,573. For both types of properties across the Aspen/Snowmass Village area, closed sales were down 24% compared to last year and overall dollar volume declined by 30% to $436 million. Average days on market were up across the region except for single-family homes in Snowmass Village, where days on market declined slightly, and the percent of sold price to original listing price was down, on average 4% across the area.
While the increase in mortgage rates is likely having less of a direct impact on prices in the Aspen/Snowmass Village area, we may be starting to see some changes in the local market. This is probably due to the tightening of private equity and venture capital markets and the disruptions in the tech and banking sectors, along with overall recessionary fears for the U.S. and the wider global economy. While sales slowed again this quarter, inventories of available homes remain incredibly limited for this highly desirable area, keeping it generally a seller’s market. Dr. Eisenberg comments: “While the likelihood of a recession is rising, this is still likely to be a rather mild one, followed by a rapid recovery. As many firms start to pull back on work-fromhome flexibility, areas like San Francisco and the Silicon Valley have seen large drops in home prices. Those pressures are much less likely to impact Aspen and Snowmass Village given the type of buyers and high-level executive roles they most likely hold.”

“While sales slowed again this quarter, inventories of available homes remain incredibly limited for this highly desirable area, keeping it generally a seller’s...”
Aspen
SINGLE FAMILY HOMES
The median price for a single-family home in Aspen during the first quarter of 2023 was $11.0 million, 28% less than last year’s $15.225 million. The average sale price of $12.375 million declined 32% from last year.
The number of closed sales during the quarter increased by two to 20, and overall dollar volume was nearly $250 million, down about 25% from last year. Average sold price per square foot declined 13% from $3,258 in 22Q1 to $2,834 in 23Q1.
As of the end of March, there were 69 single-family homes on the market, compared to 61 at the same point last year, a 13% increase.
The most expensive single-family home sold in Aspen during the first quarter of 2023 was for $35 million, compared to a $50 million sale during 22Q1.
Days on market rose from 148 to 199, while percent of sold price to original listing price declined from 96% last year to 92% this year.
Average Sold Price Median Sold Price
32% 2022 vs 2023
28% 2022 vs 2023
25% 2022 vs 2023
Million $0 $50 $100 $150 $200 $250 $300 $350 Total Dollar Volume First Quarter of 2022 2020 2019 2023 2021 $150M $99M $330M $247M $275M
SOLD SOLD SOLD SOLD SOLD Number of Properties Sold First Quarter of 2022 2020 2019 2023 2021 21 10 27 18 20
% 2022
$5M $10M $12.5M $7.5M $15M $18.5M $20M Million 2022 2020 2019 2023 2021
11
vs 2023
First Quarter of
SINGLE FAMILY HOMES Single Family Homes Sold First Quarter YTD Number Sold Sold Price Range Median Sold Price Median % Off Asking Price Avg. Days On Market Studio - 1 Bedroom 2 - 3 Bedrooms 4 - 5 Bedrooms 6+ Bedrooms 1 3 15 1 $1,095,000 $1,175,000 - $6,400,000 $1,650,000 - $35,000,000 $18,500,000 $1,095,000 $1,385,000 $12,350,000 $18,500,000 0 8 9 21 70 128 228 97 30 Maroon Creek Court Aspen, Colorado 4 BEDS | 6 FULL & 2 HALF BATHS | 5,066 SF
What’s Selling?
% Sold Price to Original List Price
34% 2022 vs 2023 301 291 300 148 199 Average Days on Market First Quarter of 2022 2020 2019 2023 2021
First Quarter of 2022 vs 2023 4% 2022 2020 2019 2023 2021 90% 85% 94% 96% 92%
FAMILY
Average Price Per Square Foot $0 $500 $1,000 $1,500 $2,000 $2,500 $3,000 $3,500 First Quarter of 2022 2020 2019 2023 2021 $1,281 $1,522 $3,258 $2,834 $1,924 13% 2022 vs 2023
Aspen SINGLE
HOMES
What’s For Sale? SINGLE FAMILY HOMES Single Family Homes Active & Pending Active Pending Active Asking Price Range Median Asking Price Studio - 1 Bedroom 2 - 3 Bedrooms 4 - 5 Bedrooms 6+ Bedrooms10 42 163 5 2 $$3,900,000 - $45,000,000 $4,250,000 - $39,995,000 $9,900,000 - $100,000,000 $$9,150,000 $14,575,000 $26,397,500 804 Hunter Creek Road Aspen, Colorado 5 BEDS | 4 FULL, 1 HALF BATHS | 4,920 SF
Aspen CONDO / TOWNHOMES
Townhome and condominium prices in Aspen were surprisingly strong. The median price rose 2% over last year to $2.925 million while the average price was flat at $4.487 million.
The number of properties sold decreased by 42%, with 21 closed sales this quarter, compared to 36 in 2022. Dollar volume declined by 42% as well, to $94.2 million. The average price per square foot was flat at $2,745.
Condo and townhome inventories rose, with 42 units on the market, up from 23 at this point last year. In the Aspen condo/townhome market, the most expensive unit sold in 23Q1 was for $22 million, more than the $20 million high in 22Q1.
Days on market for condos and townhomes during 23Q1 was 136 days compared to 88 days in 22Q1. The percent of sold price to original list price dropped from 98% last year to 94% this year.
Average Sold Price Median Sold Price
2022 vs 2023
2% 2022 vs 2023
42% 2022 vs 2023
Number of Properties Sold
42% 2022 vs 2023
Million $0 $50M $100M $150M $200M Total Dollar Volume First Quarter of 2022 2020 2019 2023 2021 $78M $131M $94M $161M $130M
0%
SOLD SOLD SOLD SOLD SOLD
First Quarter of 2022 2020 2019 2023 2021 30 25 48 36 21
$2M $2.5M $3M $3.5M $4M $4.5M $5M $5.5M $6M Million 2022 2020 2019 2023 2021
First Quarter of
CONDOS AND
Condo / Townhomes Sold First Quarter YTD Number Sold Sold Price Range Median Sold Price Median % Off Asking Price Avg. Days On Market Studio - 1 Bedroom 2 - 3 Bedrooms 4 - 5 Bedrooms 6+ Bedrooms 3 16 2$830,000 - $1,025,000 $1,100,000 - $15,470,000 $6,000,000 - $22,000,000 $$900,000 $3,137,500 $14,000,000 $8 5 7105 153 51215 Midland Avenue, Unit B Aspen, Colorado 4 BEDS | 4 BATHS | 2,624 SF
What’s Selling?
TOWNHOMES
CONDOS / TOWNHOMES
% Sold Price to Original List Price
2022
2023 214 405 190 88 136 Average Days on Market First Quarter of 2022 2020 2019 2023 2021
55%
vs
First Quarter of 2022 2020 2019 2023 2021 95% 92% 96% 98% 94%
Aspen
Average Price Per Square Foot $0 $500 $1,000 $1,500 $2,000 $2,500 $3,000 First Quarter of 2022 2020 2019 2023 2021 $1,597 $2,126 $2,745 $2,735 $1,786 0% 2022 vs 2023
2022 vs 2023
4%
What’s For Sale?
CONDOS AND TOWNHOMES Condominiums / Townhomes Active & Pending Active Pending Asking Price Range Median Asking Price Studio - 1 Bedroom 2 - 3 Bedrooms 4 - 5 Bedrooms 6+ Bedrooms 9 24 9 1 1 5 4 0 $1,095,000 - $4,495,000 $2,350,000 - $7,995,000 $6,750,000 - $47,750,000 $24,950,000 $3,199,000 $3,672,500 $12,000,000 $24,950,000 718 S Mill Street 11 Aspen, Colorado 2 BEDS | 2 BATHS | 845 SF
Snowmass Village
SINGLE FAMILY HOMES
In Snowmass Village, the median sale price of a single-family home sold during 23Q1 was $4.9 million, a 25% decrease over last year. Average price declined by 32% to about $5.4 million. However, average price per square foot was only down by 5% to $1,518.
Closed sales during the quarter declined from nine homes last year to seven homes this year but overall dollar volume was down nearly 50% to $37.5 million.
There were 17 single-family homes for sale in Snowmass Village at the end of the quarter,
compared to 14 at the end of last March.
The most expensive single-family home sold during 23Q1 in Snowmass Village was for $10.75 million, while the highest price during 22Q1 was $14.625 million.
Days on market for single-family homes in Snowmass Village declined from 169 days last year to 159 days this year, while the percent of sold price to original list price declined from 95% last year to 92% this year.
Average Sold Price Median Sold Price
32% 2022 vs 2023
25% 2022 vs 2023
Total Dollar
47% 2022 vs 2023
22
vs 2023
Million $0 $10 $20 $30 $40 $50 $60 $70 $80
First Quarter of 2022 2020 2019 2023 2021 $44M $11M $37M $71M $50M
Volume
SOLD SOLD SOLD SOLD SOLD Number of Properties Sold First Quarter of 2022 2020 2019 2023 2021 7 3 11 9 7
%
$2,000 $3,000 $4,000 $5,000 $6,000 $7,000 $8,000 Million 2022 2020 2019 2023 2021
2022
First Quarter of
Single Family Homes Sold First Quarter YTD Number Sold Sold Price Range Median Sold Price Median % Off Asking Price Avg. Days On Market Studio - 1 Bedroom 2 - 3 Bedrooms 4 - 5 Bedrooms 6+ Bedrooms1 6$$4,550,000 $2,290,000 - $10,750,000 $$$4,550,000 $5,350,000 $-9 855 176660 Brush Creek Road Snowmass Village, Colorado 4 BEDS | 4 BATHS | 2,941 SF
What’s Selling? SINGLE FAMILY HOMES
Snowmass Village
SINGLE
%
6% 2022 vs 2023 3% 2022 vs 2023 175 251 284 169 159 Average Days on Market First Quarter of 2022 2020 2019 2023 2021
Price First Quarter of 2022 2020 2019 2023 2021 96% 94% 95% 95% 92%
Sold Price to Original List
FAMILY
Average Price Per Square Foot $0 $500 $1,000 $1,500 $2,000 First Quarter of 2022 2020 2019 2023 2021 $1,175 $913 $1,518 $1,604 $1,123 5% 2022 vs 2023
HOMES
Single Family Homes Active & Pending Active Pending Asking Price Range Median Asking Price Studio - 1 Bedroom 2 - 3 Bedrooms 4 - 5 Bedrooms 6+ Bedrooms2 18 10 2 0 $$3,195,000 - $3,900,000 $5,250,000 - $18,000,000 $16,900,000 $$3,547,500 $8,972,500 $16,900,000 411 Wood Road 8 Snowmass Village, Colorado 4 BEDS | 4 FULL, 1 HALF BATHS | 3,349 SF
What’s For Sale? SINGLE FAMILY HOMES
Snowmass Village CONDOS / TOWNHOMES
Condo and townhome median prices in Snowmass Village declined by 27% compared to last year, with a median price of $1,232,500. The average price, however, jumped 31% to $2,827,100, and the average price per square foot rose 12% from $1,399 to $1,573.
Closed sales during 23Q1 decreased by about 25% to 20, while overall sales volume declined by just 3% to $56.5 million.
At the end of the quarter there were 38 townhome or condo units on the market in Snowmass Village,
compared to just 21 last year.
In the Snowmass Village condo/townhome market, the most expensive property sold in 23Q1 was nearly $8.8 million, compared to the highest sale price in 22Q1 of $6.6 million.
Days on market for condos/townhomes in Snowmass Village jumped from 68 days in 22Q1 to 266 days in 2023, and the percent of sold price to original list price declined from 101% to 96.0%.
Average Sold Price Median Sold Price
31% 2022 vs 2023
27% 2022 vs 2023
Million $0 $20 $40 $60 $80 $100 Total Dollar Volume First Quarter of 2022 2020 2019 2023 2021 $28M $56M $57M $83M $58M
3% 2022 vs 2023
SOLD SOLD SOLD SOLD SOLD Number of Properties Sold First Quarter of 2022 2020 2019 2023 2021 25 41 61 27 20
% 2022
$500 $1M $1.5M $2M $2.5M $3M Thousands/Million 2022 2020 2019 2023 2021
26
vs 2023
First Quarter of
CONDOS AND
Condo / Townhomes Sold First Quarter YTD Number Sold Sold Price Range Median Sold Price Median % Off Asking Price Avg. Days On Market Studio - 1 Bedroom 2 - 3 Bedrooms 4 - 5 Bedrooms 6 11 3 $450,000 - $1,300,000 $960,000 - $6,400,000 $7,210,623 - $8,789,377 $763,500 $1,300,000 $7,500,000 3 6 0 75 242 736 Assay Hill Lodge - 130 Wood Road #733 Snowmass Village, Colorado 2 BEDS | 2 BATHS | 1,630 SF | SLEEPS 4
What’s Selling?
TOWNHOMES
Snowmass Village
CONDOS / TOWNHOMES
% Sold Price to Original List
291% 2022 vs 2023 5% 2022 vs 2023 223 336 159 68 266 Average Days on Market First Quarter of 2022 2020 2019 2023 2021
First Quarter of 2022 2020 2019 2023 2021 97% 94% 97% 101% 96%
Price
Average Price Per Square Foot $0 $500 $1,000 $1,500 $2,000 First Quarter of 2022 2020 2019 2023 2021 $805 $865 $1,573 $1,399 $898 12% 2022 vs 2023
CONDOS AND TOWNHOMES Condominiums / Townhomes Active & Pending Active Pending Asking Price Range Median Asking Price Studio - 1 Bedroom 2 - 3 Bedrooms 4 - 5 Bedrooms 8 18 14 2 88 10 $800,000 - $1,895,000 $1,395,000 - $7,750,000 $4,175,000 - $11,750,000 $937,500 $3,767,500 $9,025,000 Luxury Rental - 70 Gallun Lane 109 Snowmass Village, Colorado 2 BEDS | 2 BATHS | 926 SF
What’s For Sale?
Old Snowmass + Woody Creek
SINGLE FAMILY HOMES
Million $0 $10M $20M $30M $40M $50M $60M Total Dollar Volume First Quarter of 2022 2020 2019 2023 2021 $1M $25M $57M $20M $15M 65% 2022 vs 2023 59% 2022 vs 2023 1% 2022 vs 2023 Average Sold Price Median Sold Price SOLD SOLD SOLD SOLD SOLD Number of Properties Sold First Quarter of 2022 2020 2019 2023 2021 2 6 7 7 6 14% 2022 vs 2023 0 $2M $1M $4M $3M $6M $5M $8M $7M $10M $9M Million 2022 2020 2019 2023 2021
First Quarter of
Single Family Homes Sold First Quarter YTD Number Sold Sold Price Range Median Sold Price Median % Off Asking Price Avg. Days On Market Studio - 1 Bedroom 2 - 3 Bedrooms 4 - 5 Bedrooms 6+ Bedrooms 1 3 2$755,000 $660,000 - $5,074,070 $2,850,000 - $8,600,000 $$755,000 $1,800,000 $5,725,000 $0 6 658 107 111100 Woody Creek Lane Woody Creek, Colorado 6 BEDS | 6 FULL & 3 HALF BATHS | 10,198 SF
What’s Selling? SINGLE FAMILY HOMES
Old Snowmass + Woody Creek
% Sold Price to Original List
66% 2022 vs 2023 158 786 126 290 100 Average Days on Market First Quarter of 2022 2020 2019 2023 2021
Price First Quarter of 2022 vs 2023 2% 2022 2020 2019 2023 2021 101% 92% 95% 93% 95%
SINGLE FAMILY HOMES Average Price Per Square Foot $0 $200 $400 $600 $800 $1,000 $1,200 First Quarter of 2022 2020 2019 2023 2021 $318 $654 $1,090 $1,032 $545 6% 2022 vs 2023

Single Family Homes Active & Pending Active Pending Active Asking Price Range Median Asking Price Studio - 1 Bedroom 2 - 3 Bedrooms 4 - 5 Bedrooms 6+ Bedrooms2 5 32$$3,495,000 - $4,995,000 $1,275,000 - $8,950,000 $18,450,000 - $23,000,000 $$4,245,000 $5,000,000 $19,000,000
What’s For Sale? SINGLE FAMILY HOMES
Basalt
SINGLE FAMILY HOMES
Million $0 $10M $20M $30M $40M $50M Total Dollar Volume First Quarter of 2022 2020 2019 2023 2021 $20M $21M $41M $26M $22M 16% 2022 vs 2023 46% 2022 vs 2023 75% 2022 vs 2023 Average Sold Price Median Sold Price SOLD SOLD SOLD SOLD SOLD Number of Properties Sold First Quarter of 2022 2020 2019 2023 2021 21 19 22 15 12 20% 2022 vs 2023 $500K $1M $1.25M $2.25M $1.75M $750K $1.5M $2M $2.5M Million 2022 2020 2019 2023 2021
First Quarter of

Single Family Homes Sold First Quarter YTD Number Sold Sold Price Range Median Sold Price Median % Off Asking Price Avg. Days On Market Studio - 1 Bedroom 2 - 3 Bedrooms 4 - 5 Bedrooms 6+ Bedrooms4 8$$1,445,000 - $4,000,000 $1,025,000 - $3,390,000 $$$2,225,000 $1,854,000 $-4 3102 150 -
What’s Selling? SINGLE FAMILY HOMES
% Sold Price to Original List Price
2% 2022 vs 2023 220 160 243 132 134 Average Days on Market First Quarter of 2022 2020 2019 2023 2021
First Quarter of 2022 vs 2023 2% 2022 2020 2019 2023 2021 97% 97% 96% 99% 97%
FAMILY HOMES Average Price Per Square Foot $0 $100 $200 $300 $400 $500 $600 $700 $800 First Quarter of 2022 2020 2019 2023 2021 $480 $371 $792 $558 $474 42% 2022 vs 2023
Basalt SINGLE
What’s For Sale? SINGLE FAMILY HOMES

Single Family Homes Active & Pending Active Pending Active Asking Price Range Median Asking Price Studio - 1 Bedroom 2 - 3 Bedrooms 4 - 5 Bedrooms 6+ Bedrooms4 8 12$$1,295,000 - $4,999,000 $950,000 - $5,900,000 $4,250,000 $$2,247,000 $2,910,000 $4,250,000
Million 0 $5M $10M $15M $20M $25M Total Dollar Volume First Quarter of 2022 2020 2019 2023 2021 $10.8M $9.2M $11.7M $23.7M $10.4M 51% 2022 vs 2023 18% 2022 vs 2023 27% 2022 vs 2023 Average Sold Price Median Sold Price SOLD SOLD SOLD SOLD SOLD Number of Properties Sold First Quarter of 2022 2020 2019 2023 2021 14 13 15 20 12 40% 2022 vs 2023 $600 $700 $800 $900 $1M $1.1M $1.2M Thousands/Millions 2022 2020 2019 2023 2021
First Quarter of
Basalt CONDO / TOWNHOMES

CONDOS
Condo / Townhomes Sold First Quarter YTD Number Sold Sold Price Range Median Sold Price Median % Off Asking Price Avg. Days On Market Studio - 1 Bedroom 2 - 3 Bedrooms 4 - 5 Bedrooms 3 9$ 220,000 - $1,018,000 $685,000 - $2,225,000 $$430,000 $935,000 $0 349 76 -
What’s Selling?
AND TOWNHOMES
% Sold Price to Original List Price
2022
139 231 134 235 69 Average Days on Market First Quarter of 2022 2020 2019 2023 2021
71%
vs 2023
First Quarter of 2022 2020 2019 2023 2021 98% 97% 97% 101% 98%
CONDOS
TOWNHOMES Average Price Per Square Foot $0 $100 $200 $300 $400 $500 $600 $700 $800 First Quarter of 2022 2020 2019 2023 2021 $465 $455 $747 $738 $479
2022 vs 2023
Basalt
/
1%
3% 2022 vs 2023
What’s For Sale?

CONDOS
Condominiums / Townhomes Active & Pending Active Pending Asking Price Range Median Asking Price Studio - 1 Bedroom 2 - 3 Bedrooms 4 - 5 Bedrooms 4 19 2 0 22 1 $884,250 - $1,031,400 $799,000 - $5,500,000 $1,649,000 - $2,800,000 $973,350 $2,111,400 $2,224,500
AND TOWNHOMES
Million 0 $5M $10M $15M $20M $25M $30M $35M $40M Total Dollar Volume First Quarter of 2022 2020 2019 2023 2021 $7.1M $19.1M $37.5M $32.4M $17.6M 84% 2022 vs 2023 23% 2022 vs 2023 29% 2022 vs 2023 Average Sold Price Median Sold Price SOLD SOLD SOLD SOLD SOLD Number of Properties Sold First Quarter of 2022 2020 2019 2023 2021 10 17 25 10 15 50% 2022 vs 2023 $500 $750 $1M $1.25M $1.5M $1.75M $2M $2.25M $2.5M Million 2022 2020 2019 2023 2021 Carbondale
FAMILY HOMES First Quarter of
SINGLE
SINGLE FAMILY HOMES Single Family Homes Sold First Quarter YTD Number Sold Sold Price Range Median Sold Price Median % Off Asking Price Avg. Days On Market Studio - 1 Bedroom 2 - 3 Bedrooms 4 - 5 Bedrooms4 11$$1,072,500 - $2,000,000 $960,000 - $5,250,000 $$$1,590,500 $2,375,000 $-4 3105 1664104 Crystal Bridge Drive Carbondale, Colorado 5 BEDS | 4 FULL & 1 HALF BATHS | 4,690 SF
What’s Selling?
Carbondale
% Sold Price to Original List Price
1% 2022 vs 2023 133 214 107 151 150 Average Days on Market First Quarter of 2022 2020 2019 2023 2021
First Quarter of 2022 vs 2023 2% 2022 2020 2019 2023 2021 96% 95% 98% 98% 96%
SINGLE FAMILY HOMES Average Price Per Square Foot $0 $100 $200 $300 $400 $500 $600 $700 $800 First Quarter of 2022 2020 2019 2023 2021 $276 $320 $663 $575 $416 15% 2022 vs 2023
What’s For Sale?
SINGLE FAMILY HOMES

Single Family Homes Active & Pending Active Pending Active Asking Price Range Median Asking Price Studio - 1 Bedroom 2 - 3 Bedrooms 4 - 5 Bedrooms 6+ Bedrooms 1 5 18 3 0 6 12 0 $1,399,300 $1,300,000 - $ 3,995,000 $925,000 - $7,800,000 $2,200,000 - $3,400,000 $1,399,300 $2,999,000 $2,985,000 $2,450,000
Carbondale CONDO / TOWNHOMES
Million 0 $3M $6M $9M $12M $15M Total Dollar Volume First Quarter of 2022 2020 2019 2023 2021 $6.2M $9.6M $9.8M $14.3M $7.8M 27% 2022 vs 2023 1% 2022 vs 2023 27% 2022 vs 2023 Average Sold Price Median Sold Price SOLD SOLD SOLD SOLD SOLD Number of Properties Sold First Quarter of 2022 2020 2019 2023 2021 10 17 22 8 10 25% 2022 vs 2023 $400 $500 $600 $700 $800 $900 $1M Hundred Thousands 2022 2020 2019 2023 2021
First Quarter of
CONDOS
Condo / Townhomes Sold First Quarter YTD Number Sold Sold Price Range Median Sold Price Median % Off Asking Price Avg. Days On Market Studio - 1 Bedroom 2 - 3 Bedrooms 4 - 5 Bedrooms 1 8 1 $278,000 $500,000 - $1,900,500 $700,000 $278,000 $823,250 $700,000 0 5 5 39 100 198 681 F S 2nd Street Aspen, Colorado 2 BEDS | 1 FULL, & 1 HALF BATHS | 1,764 SF
What’s Selling?
AND TOWNHOMES
% Sold Price to Original List Price
2022
2023 141 170 207 281 104 Average Days on Market First Quarter of 2022 2020 2019 2023 2021
63%
vs
First Quarter of 2022 2020 2019 2023 2021 97% 98% 100% 100% 97%
/ TOWNHOMES Average Price Per Square Foot 0 $100 $200 $300 $400 $500 $600 First Quarter of 2022 2020 2019 2023 2021 $340 $317 $520 $459 $385
2022 vs 2023
Carbondale CONDOS
13%
2022
2023
3%
vs
What’s For Sale?

Condominiums / Townhomes Active & Pending Active Pending Asking Price Range Median Asking Price Studio - 1 Bedroom 2 - 3 Bedrooms 4 - 5 Bedrooms 1 7 4 0 4 0 $525,123 $690,000 - $2,572,990 $1,894,000 - $2,499,999 $525,123 $1,295,000 $2,272,500
CONDOS AND TOWNHOMES
Missouri Heights
SINGLE
*No Data for 2023, 0 Home Sales *No Data for 2023, 0 Home Sales
Million 0 $5M $10M $15M $20M $25M Total Dollar Volume First Quarter of 2022 2020 2019 2021 $11.4M $6.1M $21.5M $20.9M -% 2022 vs 2023 -% 2022 vs 2023 -% 2022 vs 2023 Average Sold Price Median Sold Price SOLD SOLD SOLD SOLD Number of Properties Sold First Quarter of 2022 2020 2019 2021 10 6 12 8 -
2022 vs 2023 $500 $750 $1M $1.25M $1.5M $1.75M $2M $2.25M $2.5M $2.75M $3M Million 2022 2020 2019 2021
%
FAMILY HOMES First Quarter of
Data for 2023, 0 Home Sales
*No
SINGLE FAMILY HOMES Single Family Homes Sold First Quarter YTD Number Sold Sold Price Range Median Sold Price Median % Off Asking Price Avg. Days On Market Studio - 1 Bedroom 2 - 3 Bedrooms 4 - 5 Bedrooms 6+ Bedrooms-$$$$$$$$----1230 Green Meadow Drive Carbondale, Colorado 5 BEDS | 4 FULL & 2 HALF BATHS | 5,719 SF
What’s Selling?
% Sold Price to Original List Price
-% 2022 vs 2023 206 402 100 228 Average Days on Market First Quarter of 2022 2020 2019 2021
First Quarter of 2022 vs 2023 -% 2022 2020 2019 2021 94% 94% 97% 97%
SINGLE FAMILY HOMES Average Price Per Square Foot 0 $100 $200 $300 $400 $500 $600 $700 $800 First Quarter of 2022 2020 2019 2021 $308 $302 $684 $440 -% 2022 vs 2023 *No Data for 2023, 0 Home Sales
Missouri Heights

Single Family Homes Active & Pending Active Pending Active Asking Price Range Median Asking Price Studio - 1 Bedroom 2 - 3 Bedrooms 4 - 5 Bedrooms 6+ Bedrooms5 8 23 5$$1,350,000 - $3,250,000 $1,475,000 - $6,700,000 $2,598,000 - $2,950,000 $$2,100,000 $2,772,500 $2,774,000
What’s For Sale? SINGLE FAMILY HOMES
Glenwood
Million 0 $5M $10M $15M $20M $25M $30M Total Dollar Volume First Quarter of 2022 2020 2019 2023 2021 $16M $20.1M $29.8M $19.7M $29.2M 33% 2022 vs 2023 11% 2022 vs 2023 6% 2022 vs 2023 Average Sold Price Median Sold Price SOLD SOLD SOLD SOLD SOLD Number of Properties Sold First Quarter of 2022 2020 2019 2023 2021 25 32 39 33 20 39% 2022 vs 2023 $600 $700 $800 $900 $1M Hundred Thousands 2022 2020 2019 2023 2021
FAMILY HOMES First Quarter of
Springs SINGLE
Single Family Homes Sold First Quarter YTD Number Sold Sold Price Range Median Sold Price Median % Off Asking Price Avg. Days On Market Studio - 1 Bedroom 2 - 3 Bedrooms 4 - 5 Bedrooms 6+ Bedrooms14 5 1 $$410,000 - $1,350,000 $395,000 - $1,800,000 $3,350,000 $$726,500 $825,000 $3,350,0004 7 0117 133 0
What’s Selling? SINGLE FAMILY HOMES
Glenwood Springs
% Sold Price to Original List Price
15% 2022 vs 2023 156 118 112 100 115 Average Days on Market First Quarter of 2022 2020 2019 2023 2021
First Quarter of 2022 vs 2023 5% 2022 2020 2019 2023 2021 98% 98% 97% 99% 94%
SINGLE FAMILY HOMES Average Price Per Square Foot 0 $100 $200 $300 $400 $500 First Quarter of 2022 2020 2019 2023 2021 $253 $247 $432 $399 $296 8% 2022 vs 2023
What’s For Sale?
SINGLE FAMILY HOMES

Single Family Homes Active & Pending Active Pending Active Asking Price Range Median Asking Price Studio - 1 Bedroom 2 - 3 Bedrooms 4 - 5 Bedrooms 6+ Bedrooms 1 18 714 8$699,000 $550,000 - $1,889,000 $1,195,000 - $2,400,000 $$699,000 $1,057,500 $1,400,000 $-
Glenwood
Million 0 $2M $4M $6M $8M $10M $12M Total Dollar Volume First Quarter of 2022 2020 2019 2023 2021 $6M $6.2M $7.4M $3.8M $11.4M 35% 2022 vs 2023 2% 2022 vs 2023 10% 2022 vs 2023 Average Sold Price Median Sold Price SOLD SOLD SOLD SOLD SOLD Number of Properties Sold First Quarter of 2022 2020 2019 2023 2021 19 20 9 22 14 36% 2022 vs 2023 $300 $350 $400 $450 $500 $550 $600 Hundred Thousands 2022 2020 2019 2023 2021
TOWNHOMES First Quarter of
Springs CONDO /
Selling?

Condo / Townhomes Sold First Quarter YTD Number Sold Sold Price Range Median Sold Price Median % Off Asking Price Avg. Days On Market Studio - 1 Bedroom 2 - 3 Bedrooms 4 - 5 Bedrooms 2 10 2 $195,000 - $300,000 $325,000 - $900,000 $700,000 - $802,500 $247,500 $497,500 $751,250 1 0 2 78 81 50
What’s
CONDOS AND TOWNHOMES
Glenwood Springs
% Sold Price to Original List
2022
130 90 40 158 78 Average Days on Market First Quarter of 2022 2020 2019 2023 2021
52%
vs 2023
First Quarter of 2022 2020 2019 2023 2021 97% 99% 99% 99% 99%
Price
CONDOS / TOWNHOMES Average Price Per Square Foot 0 $100 $200 $300 $400 $500 First Quarter of 2022 2020 2019 2023 2021 $251 $254 $445 $336 $294
2022 vs 2023
33%
0% 2022 vs 2023
What’s For Sale?

CONDOS
Condominiums / Townhomes Active & Pending Active Pending Asking Price Range Median Asking Price Studio - 1 Bedroom 2 - 3 Bedrooms 4 - 5 Bedrooms 2 47$185,000 - $385,000 $320,000 - $480,000 $$285,000 $412,500 $-
AND TOWNHOMES
$6,000,000 222 W
Avenue #6 $8,789,376 Havens 7
#1 #2 #3 $7,210,623 Havens 8
Hopkins
2023 Top Sales
Our Property Collection

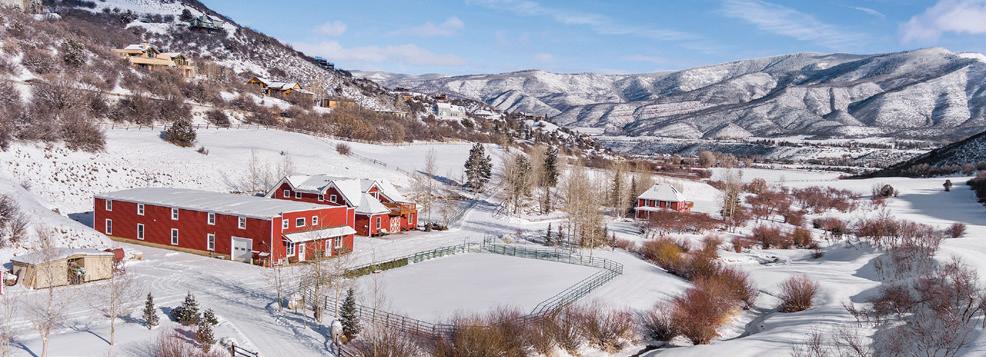 6 BD | 6 BA | 4,995 SF | 102+ ACRE RANCH 660 BRUSH CREEK ROAD, SNOWMASS VILLAGE
$29,000,000
Brush Creek Ranch
6 BD | 6 FULL, 3 HALF BA | 10,198 SF | 6 ACRES 100 WOODY CREEK LANE, WOODY CREEK
$18,450,000
River Front Oasis
5 BD | 5 BA | 3 CAR GARAGE 804 HUNTER CREEK ROAD, ASPEN
$23,000,000
Red Mountain Ranch
6 BD | 6 BA | 4,995 SF | 102+ ACRE RANCH 660 BRUSH CREEK ROAD, SNOWMASS VILLAGE
$29,000,000
Brush Creek Ranch
6 BD | 6 FULL, 3 HALF BA | 10,198 SF | 6 ACRES 100 WOODY CREEK LANE, WOODY CREEK
$18,450,000
River Front Oasis
5 BD | 5 BA | 3 CAR GARAGE 804 HUNTER CREEK ROAD, ASPEN
$23,000,000
Red Mountain Ranch
Havens 8
$17,600,000 SKI-IN/SKI-OUT
4 BEDS | 4F, 1H BATHS | 3,349 SF 411 WOOD ROAD 8, SNOWMASS VILLAGE
Aspen’s Coveted West End
$13,995,000 ASPEN RETREAT
4 BEDS | 6 BATHS | 3,759 SF 604 N EIGHTH STREET, ASPEN
Starwood in Aspen
$9,900,000 ULTIMATE ASPEN LOCATION
6 BEDS | 6 BATHS | 10,845 SF | 3+ AC 515 JOHNSON DRIVE, ASPEN
Close to Everything in Aspen
$7,250,000 ASPEN MOUNTAIN VIEWS
4 BEDS | 4 BATHS | 2,624 SF 215 MIDLAND AVENUE UNIT B, ASPEN
Majestic Maroon Court
$17,500,000 NEW CONSTRUCTION
5 BEDS | 8 BATHS | 5,066 SF 30 MAROON COURT, ASPEN 660
Beautiful West End Victorian
$10,000,000 WALK TO EVERYTHING
3 BEDS | 3F, 1H BATHS | 2,176 SF 131 W BLEEKER STREET, ASPEN
Mountains of Opportunity
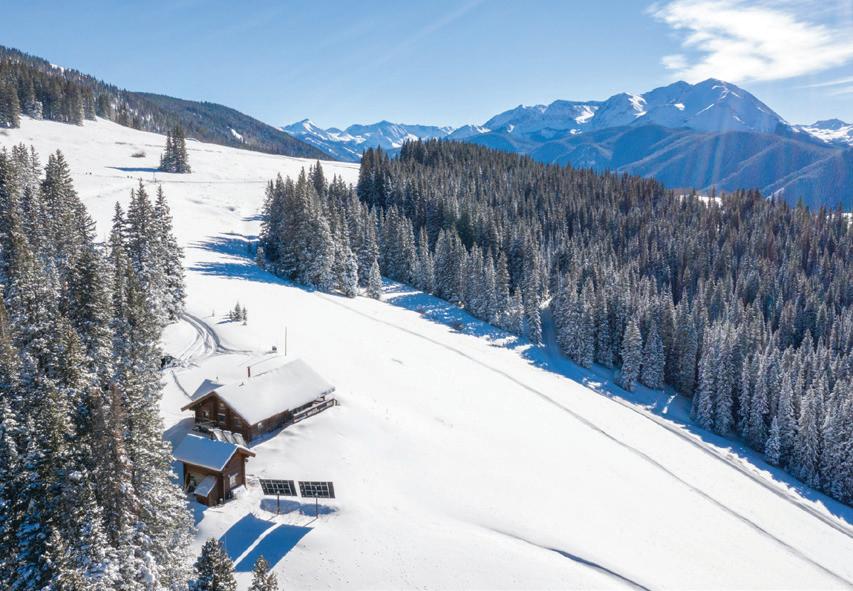
$8,300,000 LUXURIOUS RETREAT
2 BEDS | 1 BATHS | 999 SF + 71 ACRES 4300 MIDNIGHT MINE RD., ASPEN
Horse Ranch Home
$5,250,000 INCREDIBLE LOCATION, VIEWS
4 BEDS | 4 BATHS | 2,941 SF 37 STIRRUP CIRCLE, SNOWMASS VILLAGE
Chateau Dumont Refresh
$4,350,000 STEPS TO GONDOLA
2 BEDS | 2 BATHS | 1,022 SF 725 E DURANT AVENUE 18, ASPEN

Fasching Haus Aspen Core
$3,300,000 RARELY AVAILABLE
2 BEDS | 2 BATHS | 845 SF 718 S MILL STREET 11, ASPEN
Missouri Heights Home
$2,395,000 TURN-KEY
4 BD | 4F, 2H BA | 5,719 SF 1230 GREEN MEADOW DRIVE, CARBONDALE 60
Historic Herron Mansion
$2,195,000 WEST END PIED-À-TERRE
1 BED | 1 BATH | 616 SF 333 W MAIN STREET 1-A, ASPEN
Welcome Home in Snowmass
$3,900,000 MEADOW RANCH
3 BEDS | 2 FULL, 1 HALF BATH | 2,472 SF 350 LOHRS COURT, SMV
Timber Ridge Aspen Core
$3,250,000 PERFECTLY REMODELED
2 BD | 1F, 1H BA | 880 SF 100 E DEAN STREET 3D, ASPEN 60
River Valley Ranch
$2,300,000 CUSTOM BUILT HOME
5 BD | 4F, 1H BA | 3,884 SF 4104 CRYSTAL BRIDGE DRIVE, CARBONDALE 60
Assay Hill Lodge
$2,195,000 SKI-IN, SKI-OUT
2 BEDS | 2 BATHS | 898 SF 130 WOOD ROAD #733, SNOWMASS VILLAGE
Shadowrock Mountain Contemporary
$1,525,000 DELIVERY AUTUMN, 2023
3 BEDS | 2F, 1H BATHS | 1,927 SF
270 OVERLOOK, CARBONDALE
Sky Residences & Lodge
$825,000 SHARED OWNERSHIP
3 BEDS | 3F, 1H BATHS | 1,993 SF
550 S SPRING STREET F2-2, ASPEN

Sopris Park Convenience
$690,000 VALUE & LOCATION
2 BED | 1F, 1H BATH | 1,764 SF 681 F S 2ND STREET, CARBONDALE
Sweeping Panoramic Views
$300,000 BUILD YOUR DREAM HOME
10 ACRES WITH STUNNING VIEWS
152 RUSTY SPUR TRAIL, RIFLE
New Shadowrock
$1,500,000 DELIVERY AUTUMN, 2023
3 BEDS | 2F, 1H BATH | 1,927 SF
272 OVERLOOK, BASALT
Sky Residences & Lodge
$825,000 SHARED OWNERSHIP
3 BEDS | 3F, 1H BATHS | 1,993 SF
550 S SPRING STREET F2-9, ASPEN
Sweeping Panoramic Views
$500,000 BUILD YOUR DREAM HOME
20 ACRES WITH STUNNING VIEWS
152 RUSTY SPUR TRAIL, RIFLE

520 E Durant Ave Suite 205, Aspen • 970.544.5800 Properties@ChristiesAspenRE.com • ChristiesAspenRE.com LIFESTYLE. LUXURY. LEGACY.
