Aspen and Snowmass Second Quarter 2023 Market Report

Report Written By: Elliot F. Eisenberg, Ph.D.
Source: Aspen Board of Realtors Multiple Listing Service
ASPEN | SNOW MA SS Photo: Ellen Winter

Report Written By: Elliot F. Eisenberg, Ph.D.
Source: Aspen Board of Realtors Multiple Listing Service
ASPEN | SNOW MA SS Photo: Ellen Winter By: Elliot F. Eisenberg, Ph.D.
While many economists have been on recession watch for quite a while, the most recent upward adjustment of 23Q1 growth from 1.3% to 2% indicates that the U.S. economy, while not stellar, is most certainly very resilient. The most recent estimates for 23Q2 growth are around 2%. The much-anticipated onset of the recession has been slowed by a number of factors, the most important of which has been the excess savings amassed during Covid, which has allowed households to keep spending despite inflation and, for many families, declines in real income. In addition, there continues to be virtually unending pent-up demand for services. Households that were unable to travel and enjoy other services during the pandemic have been and continue to spend freely. A fitting example of this phenomenon is the high cost of attending live music and other events, with tickets in the hundreds to thousands of dollars. Similarly, hotel prices remain remarkably high, as do airline tickets, all because of continuing strong demand. A third reason the economy is outperforming expectations is the improving automobile sector. While new car sales plummeted in 2021 and 2022 due to a semiconductor shortage, now that supply chains have improved, auto sales are picking up quite profoundly, which is surprising given high and rising interest rates, yet another Covid-induced anomaly. There is also the incremental impact of the recent federal spending bills, including the Bipartisan Infrastructure Bill, the Inflation Reduction Act, and the Chips Bill. These already have and will continue to encourage a tremendous amount of spending and investment despite rising interest rates.
Driven by all the above and despite some weakening in 23Q2, job creation has been well above pre-pandemic levels. Some sectors, such as education and leisure/hospitality, are simply struggling to get employment back to pre-Covid levels, while in other areas, such as healthcare, although employment is back to pre-pandemic levels, it is still well below trend. While most labor economists believe that wage growth has peaked, an increasing number of employees seem to be convinced that the labor market will remain tight and that meaningful wage increases are still in their future, and they are spending accordingly. Finally, because hiring has been so difficult for so long, some employers are still hiring or postponing layoffs, even if they are currently overstaffed.
Regarding inflation, while it has fallen dramatically, from as high as 9.1% in mid-2022 to around 3% now, this decline has been the easiest part of the inflation puzzle to fix, and the remainder will be much tougher. The reduction in inflation so far has been primarily the result of declining energy prices and related transportation prices, accompanied by a decline in the price of goods as supply chains recovered and demand declined, and, finally, slowing food inflation. Over the last few months, we have seen declining rents and falling used car prices, and those should start being reflected in inflation data in the next few months. However, just as the increase in these areas was almost entirely pandemic-induced, so too have been the declines as Covid impacts fade. Unfortunately, it is the remaining inflationary pressures that are not Covid-related that the Fed must now battle and getting inflation down to 2% will continue to be a struggle.
Most of the key measures of inflation that the Fed looks at are all in the 5% range, and while they will fall over the rest of the year, the challenge of bringing them down to 2% will be difficult, and the Fed has made it very clear that they will not increase their inflation target above 2%. Other central bankers, with the exceptions of Japan and China, are similarly keeping the pressure on interest rates to quell inflation.
Historically, interest rate hikes of this magnitude have, more than three-quarters of the time, led to recessions, and when they did not, it has been luck that has intervened. Moreover, the yield curve has been highly inverted for over a year and the last eight times it has inverted dating back to 1970, there has been a recession. In terms of the scope of the probable upcoming recession, it should be similar in magnitude and duration to the recessions of 1970, 1990, and 2000; it will be a ‘garden-variety’ recession, not necessarily deep or painful, unlike the Housing Bust of 2008-2009 or the Double-Dip recession of 1980-1982.
“...inflation, while it has fallen dramatically, from as high as 9.1% in mid-2022 to around 3% now, this decline has been the easiest part of the inflation puzzle to fix, and the remainder will be much tougher... ”
The national housing market remains very constrained in terms of housing supply, and that has continued to prop up home prices despite high and rising interest rates. Although it depends upon how measured, year-over-year home prices are mostly stable, showing that this remains a very strong market and is nothing like the Housing Bust when home prices plummeted amidst a surplus of inventory.
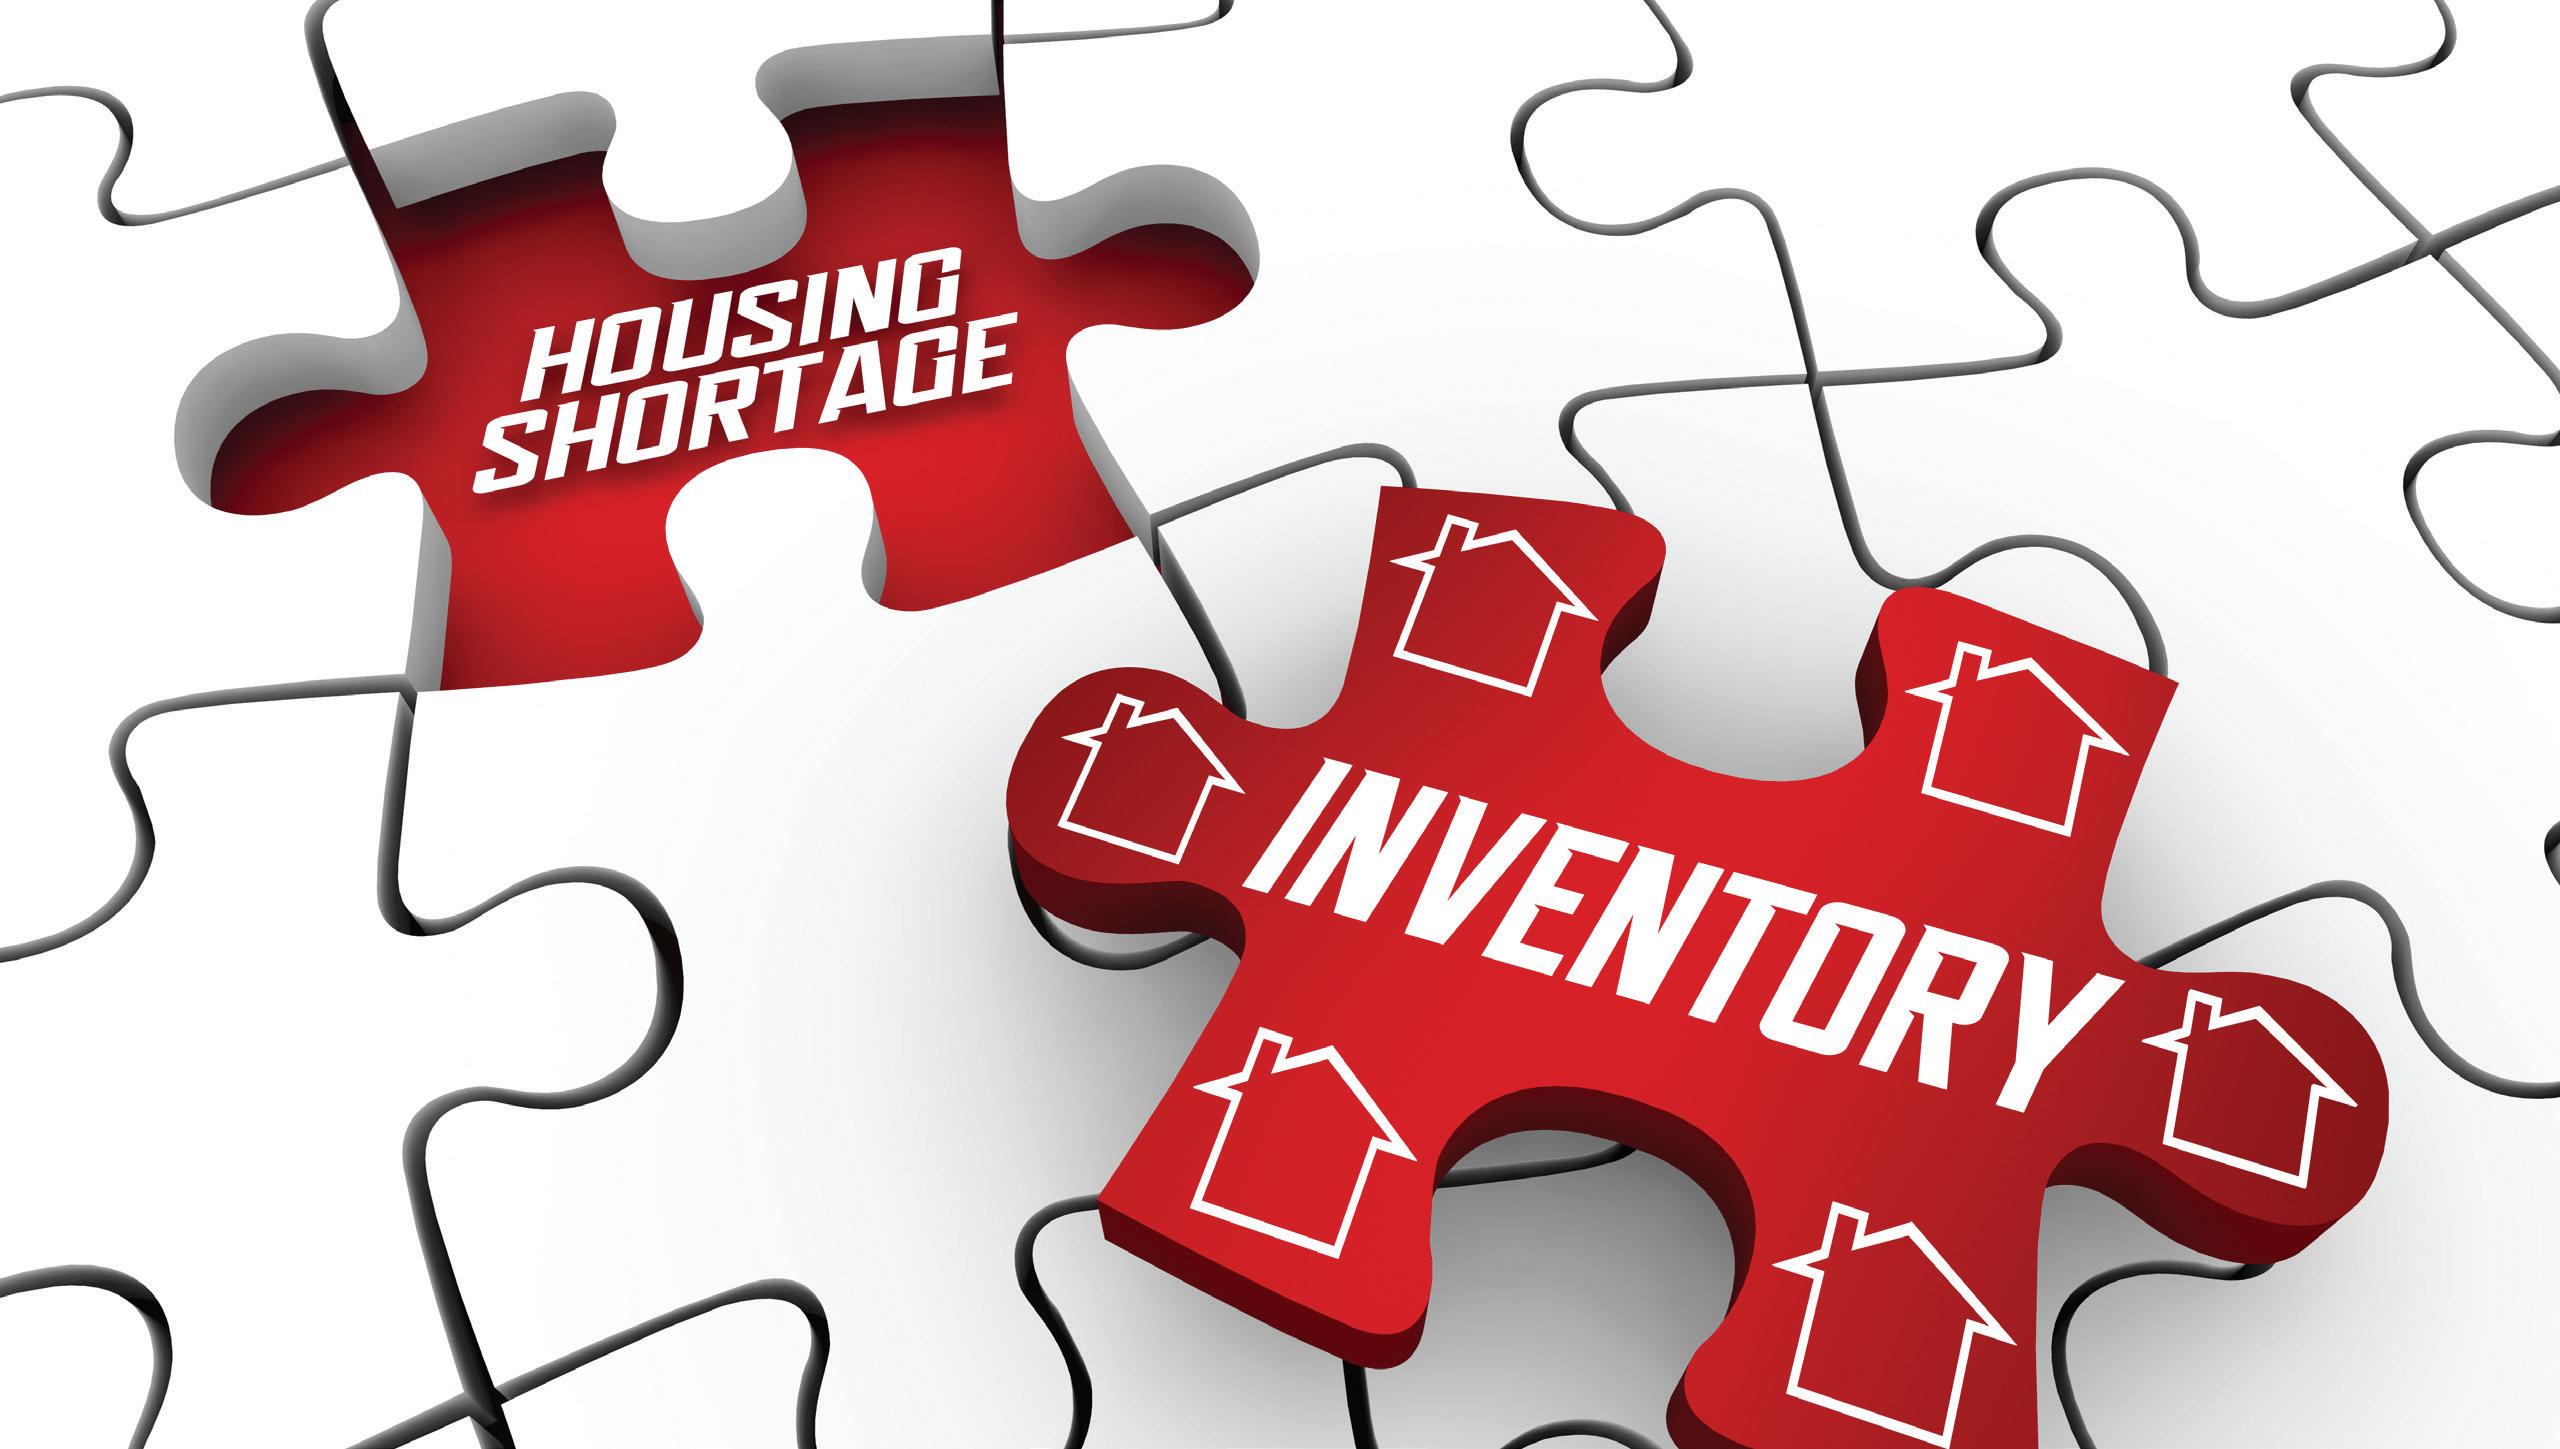
In this cycle, despite rapid and steep interest rate increases, prices have barely budged because of the lack of inventory. While many experts predicted that home prices would decline by much more than they have, now that seasonally adjusted year-over-year prices are starting to rise, it is likely that the worst is behind us.

The other surprise in the national housing market is that new single-family home construction is picking up despite high interest rates as builders try to fill the missing inventory gap.
Despite some predictions of a Fed pause or pivot toward lower rates in the near future, it is virtually assured that we will see at least one, and perhaps two quarter-point rate hikes this year, and that the Fed will leave rates at that terminal high rate unless and until we enter a recession or we see a pervasive decline in core inflation, and odds are that will happen no earlier than 2024.
“While many experts predicted that home prices would decline by much more than they have, now that seasonally adjusted year-overyear prices are starting to rise, it is likely that the worst is behind us...
Unemployment in Colorado is 2.8% as of 05/23, down just slightly from last year after hitting a peak of 11.6% in 05/20 (for comparison, the pre-pandemic rate was 2.8%). Statewide continuing claims for unemployment hit a high of 265,499 for the week ended 5/16/20 (compared to a pre-pandemic level of 20,735) and are now at 18,807 for the week ended 07/01/23. In Pitkin County, the unemployment rate has been declining and the May unemployment rate was 4.9%, a year ago, it was 4.5%, and for comparison, pre-Covid in 05/19, it was 5.8%.
Labor markets throughout the country continue to be surprisingly strong, and Colorado is no exception, although recent data suggests a slightly slowing job market nationwide and locally.


Still, the overall labor market remains solid, and this unexpected resilience is causing recessionary expectations to be pushed further forward. The chances for the proverbial “soft landing” are rising, and with some luck on the inflation front, may be achieved.
Statewide, the June 2023 (latest data available) median price of a single-family home of $583,125 was 1.1% lower than June 2022, while the year-over-year average price was nearly flat at $725,408.
In the condo/townhome market, the year-over-year median price declined 2.8% to $418,170, and the average price decreased a meaningful 8.0% to $509,421. Through June, closed sales across the state are down 23.6%, while new listings have declined 21.3%. There were 17,376 active listings statewide at the end of June, down 8.1% compared to June 2022, representing a 2.3 month’s supply of inventory. Across the state, the percentage of list price received at sale fell to 99.7% (down from 102.1% at the end of June 2022), and days-on-market has increased to 37 days, up from 23 days last year.
“The chances for the proverbial “soft landing” are rising, and with some luck on the inflation front, may be achieved... ”

The median price of a single-family home in Aspen for the first half of 2023 was $11.5 million, a 20% decline compared to the first half of 2022, while the average price declined 27% to $14.3 million. The Aspen townhome and condominium market remained relatively unchanged from last year, with a median price of $2.9 million and an average price of $4.6 million. In Snowmass Village, the single-family median price declined 11% to $5.4 million while the average price rose 4% to $7.4 million. Snowmass Village townhomes and condominiums saw the largest gains in the area, with the median price increasing 18% to nearly $1.8 million and the average price rising 12% to $2.3 million. Across the Aspen/Snowmass Village area, closed sales were down about 3% compared to last year but declining prices brought overall dollar volume down by 24% to $1.1 billion. The percentage of sold price to original listing price was down about 4% across the area and days on market generally declined compared to last year for single-family homes and rose for townhomes and condominiums.
As sales have slowed over recent months, it is likely that some potential Aspen buyers may be sitting on the sidelines in a “wait-and-see” mode to see if the Fed can achieve the much hoped-for soft landing. The most recent inflation data suggest that the actions of the Fed may be working, and while at least one more rate increase is inevitable, the likelihood of an additional hike this fall is up for debate. That means that the Fed may begin to consider when interest rates can come down. Once that happens, we may see activity pick up as interest rates decline and the number of listings improves. While the IPO market is certainly not as strong as it was in 2020 and 2021 when interest rates were incredibly low, it is meaningfully improved over 2022. The stock market has largely recovered about half of the losses of 2022, which should strengthen portfolios, especially for those with stock options. The lack of inventory continues to be the key challenge for the Aspen and Snowmass Village real estate market. Dr. Eisenberg comments: “We saw a huge run-up in housing demand across all markets and price ranges during the worst of Covid, and it is likely that demand will return to more normal levels going forward. While single-family home prices in Aspen have declined compared to 2022 levels, what I would concentrate on is cost per square foot, and the average sold price per square foot has remained steady in Aspen and has increased by 7-8% in Snowmass Village. This remains one of the tightest markets in the country.”
“The stock market has largely recovered about half of the losses of 2022, which should strengthen portfolios, especially for those with stock options. The lack of inventory continues to be the key...”
The median price for a single-family home in Aspen during the first half of 2023 was $11.5 million, 20% less than last year’s $14.4 million while the average sale price of $14.3 million declined 27% from last year.
The number of closed sales during the quarter increased by two to 44, but declining prices pushed overall dollar volume down about 24% from last year to $629 million. The average sold price per square foot declined just slightly to $3,153.
As of the end of June, there were 57 single-family homes on the market, compared to 56 at the same point last year.
The most expensive single-family home sold in Aspen during the first half of 2023 was $65 million, compared to a $60 million sale during 22H1.
Days on market declined from 187 to 153, while the percentage of sold price to original listing price declined from 97% last year to 93% this year.

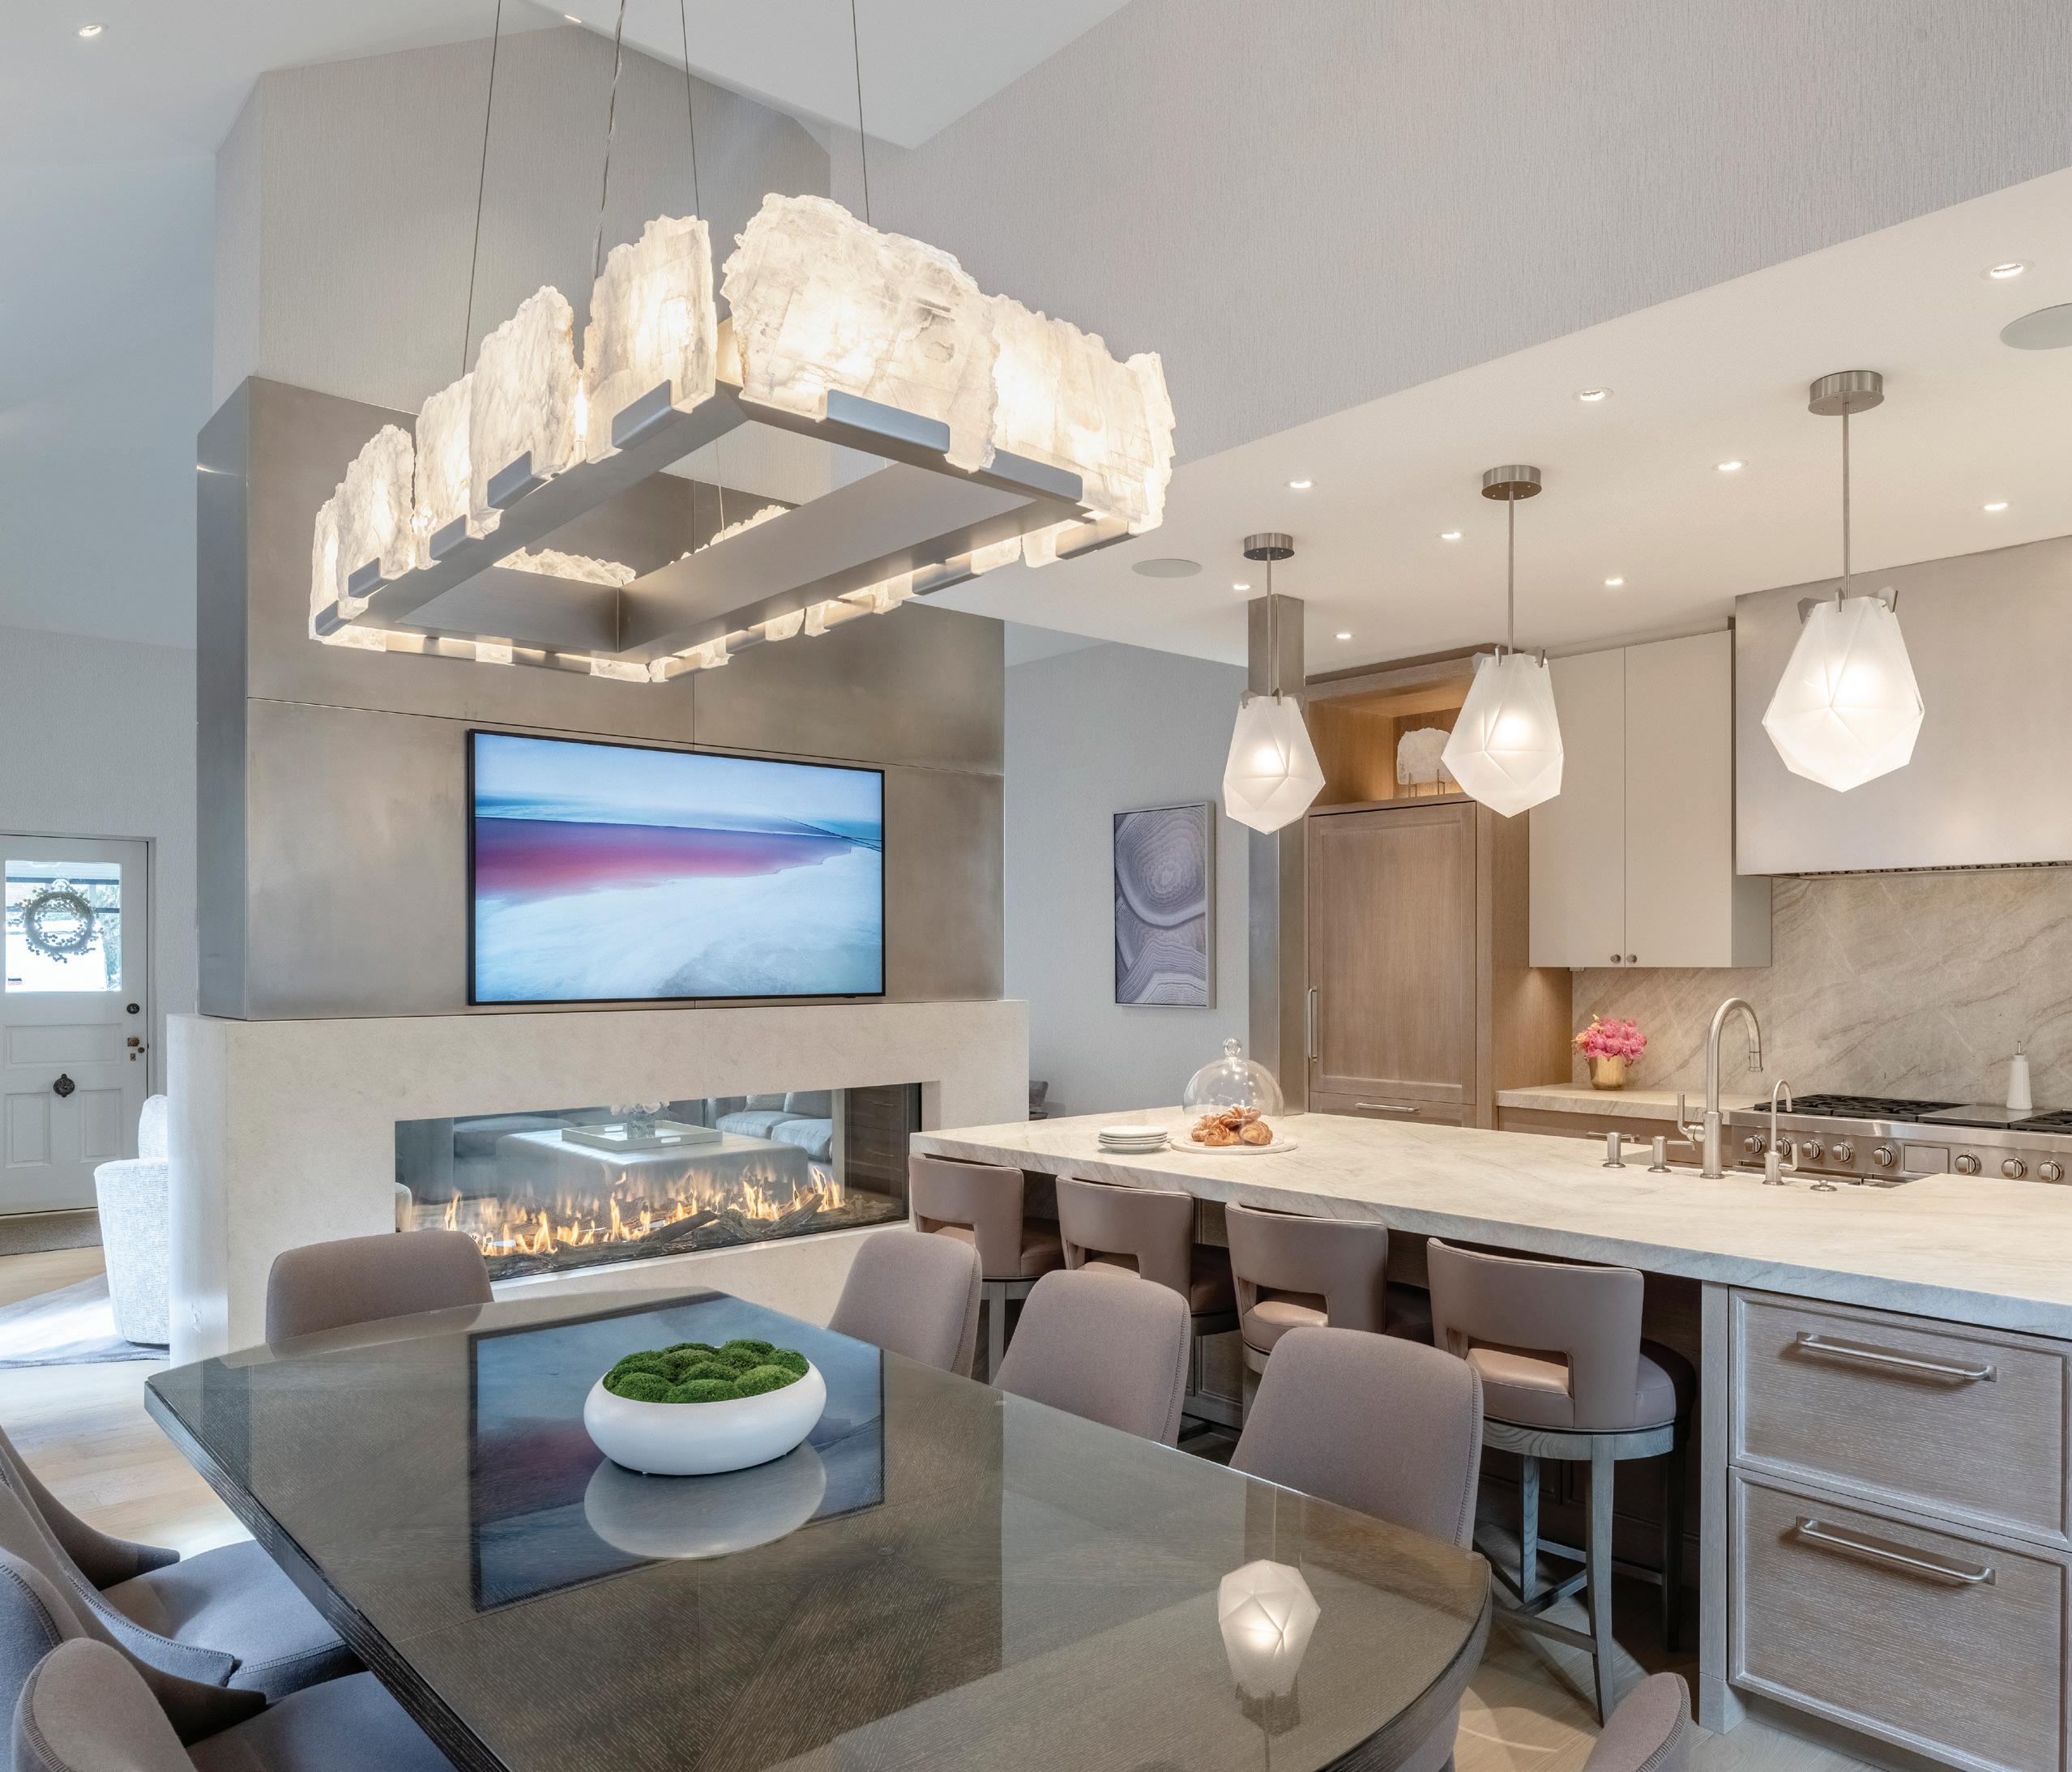
Townhome and condominium prices in Aspen were relatively unchanged in the first half of 2023 compared to the same period of 2022. The median price declined by just 1% to $2.9 million while the average price was down a slight 2% to just over $4.5 million.
The number of properties sold declined by almost half, with just 37 closed sales so far this year, compared to 66 through June of 2022. Dollar volume declined by nearly half as well, to $168 million although the average price per square foot was almost unchanged at $2,855 per square foot.
Condominium and townhome inventories rose, with 40 units on the market, up from 26 at this point last year.
In the Aspen condo/townhome market, the most expensive unit sold in 23H1 was $22 million, more than the $20 million of 22H1.
Days on market for condominiums and townhomes during the first half of 2023 were 134 days compared to 88 days for 2022. The percentage of sold price to original list price dropped from 98% last year to 94% this year.
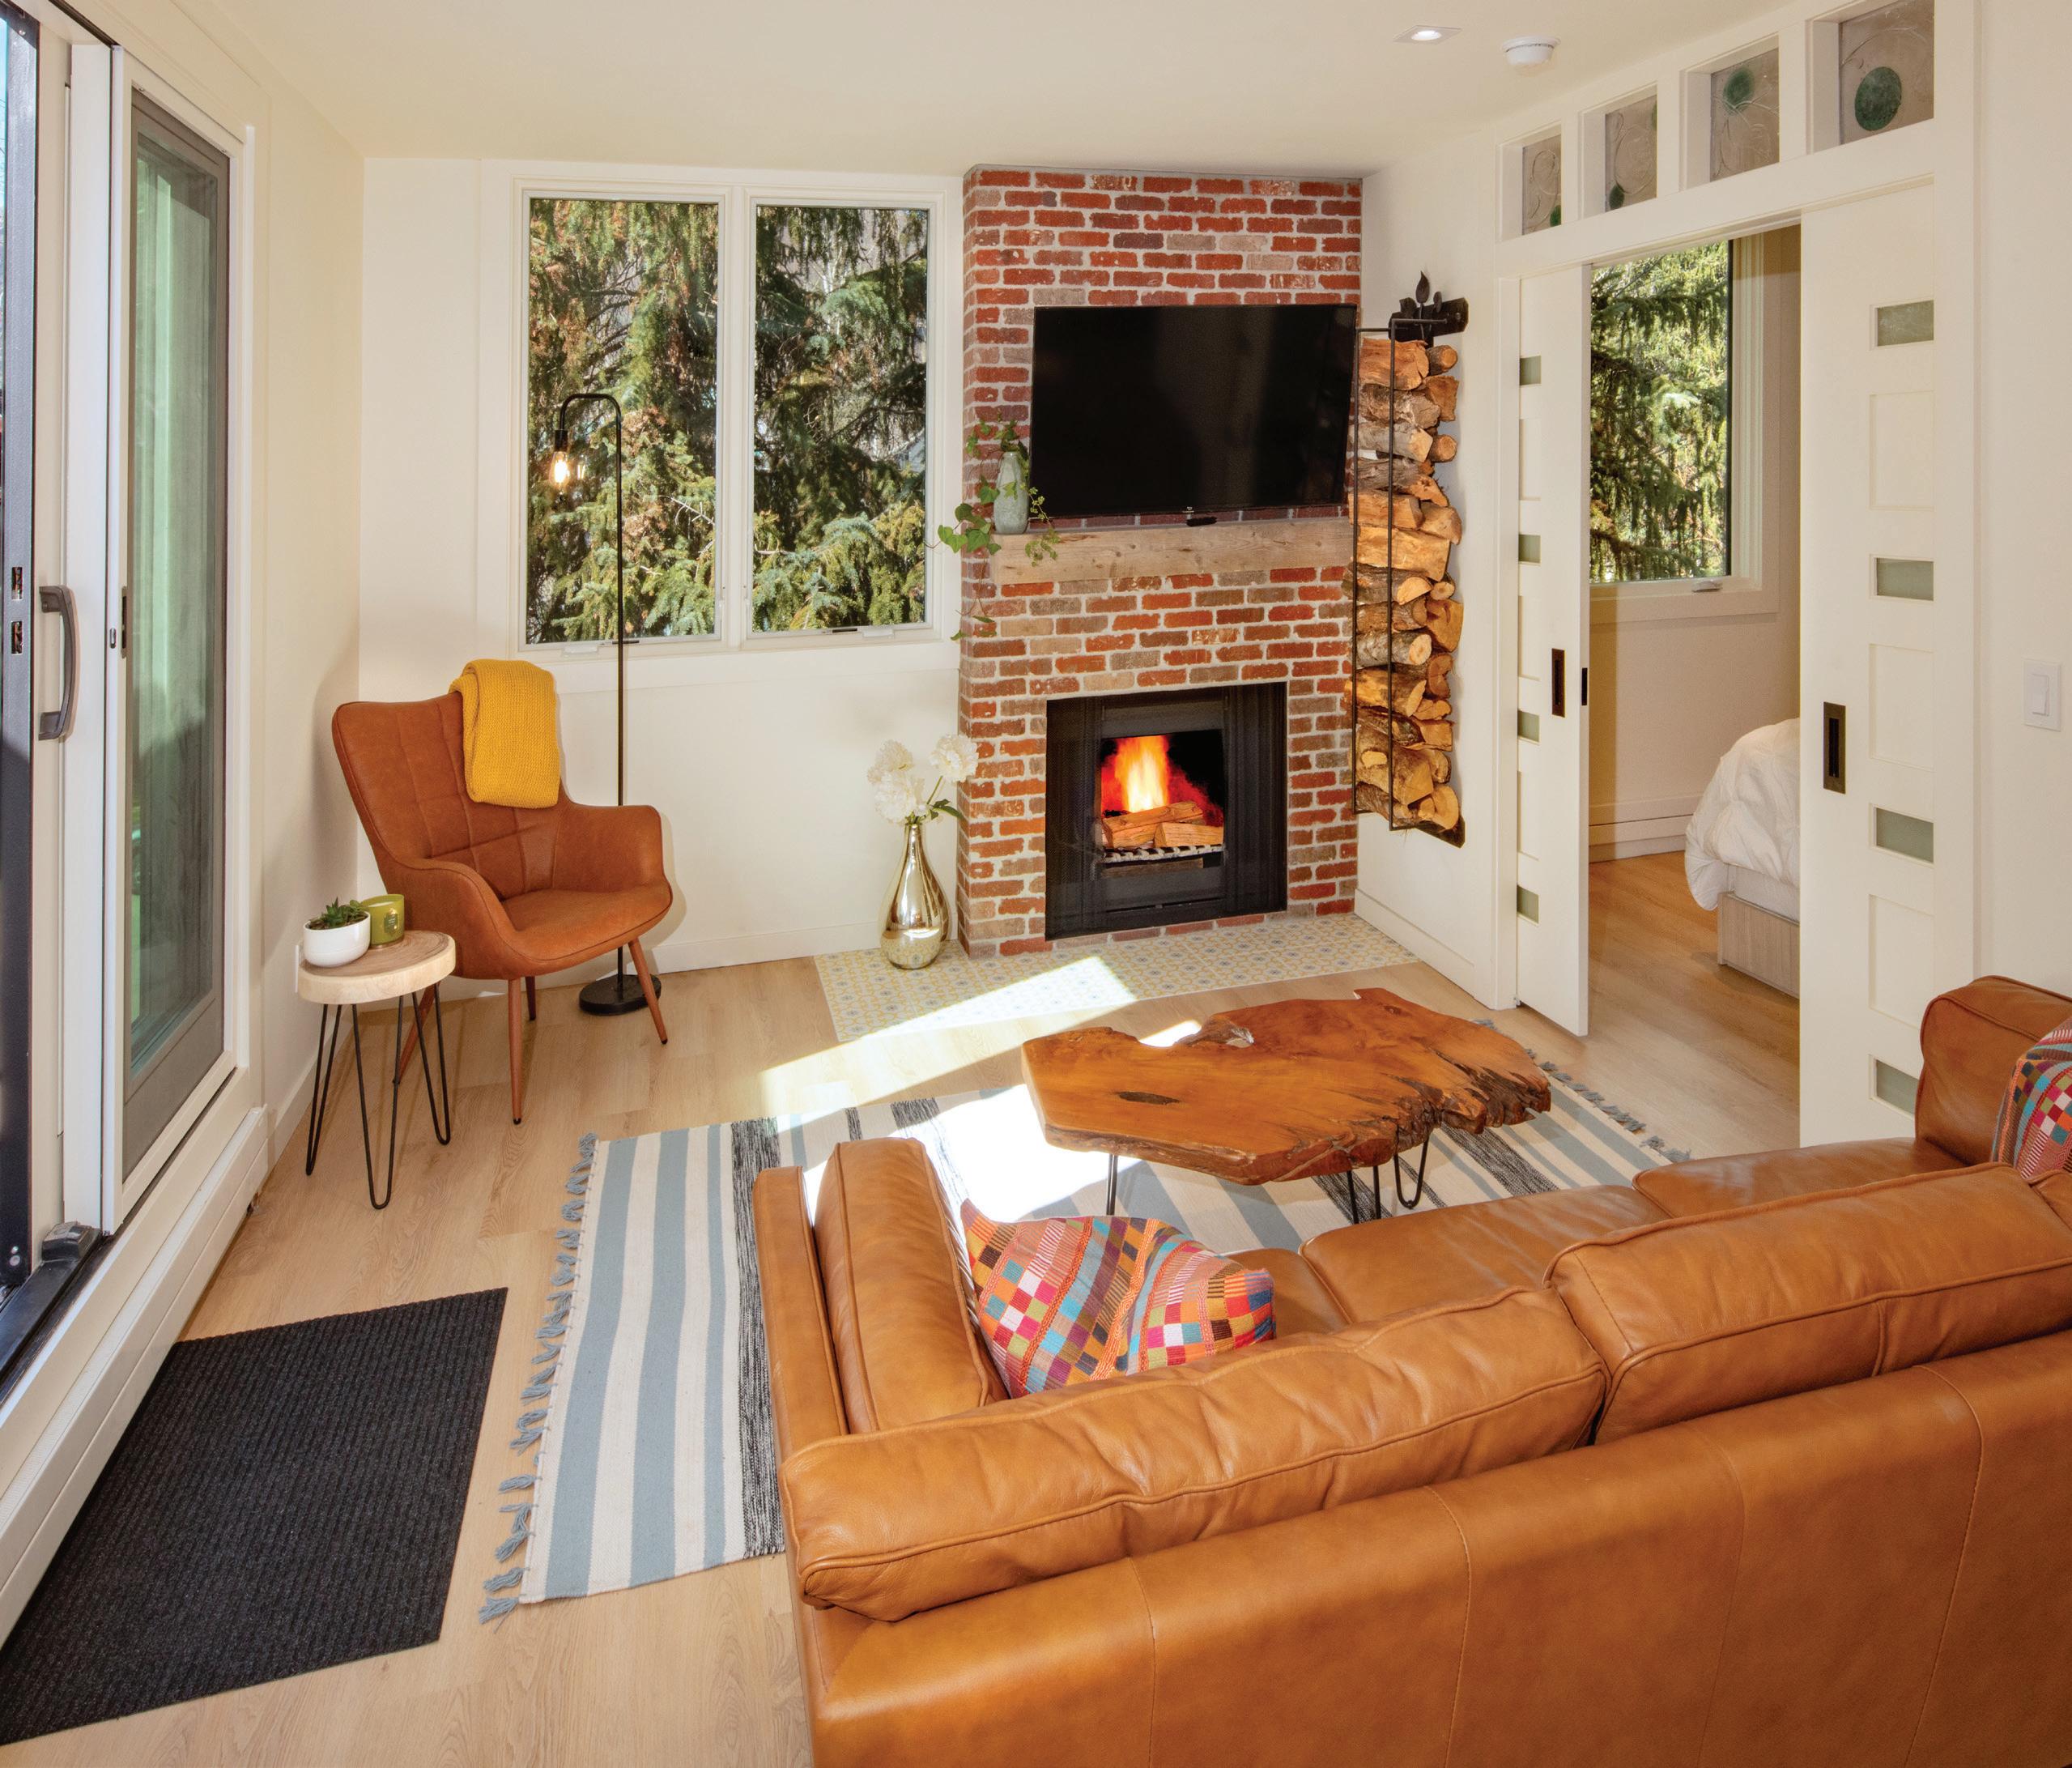
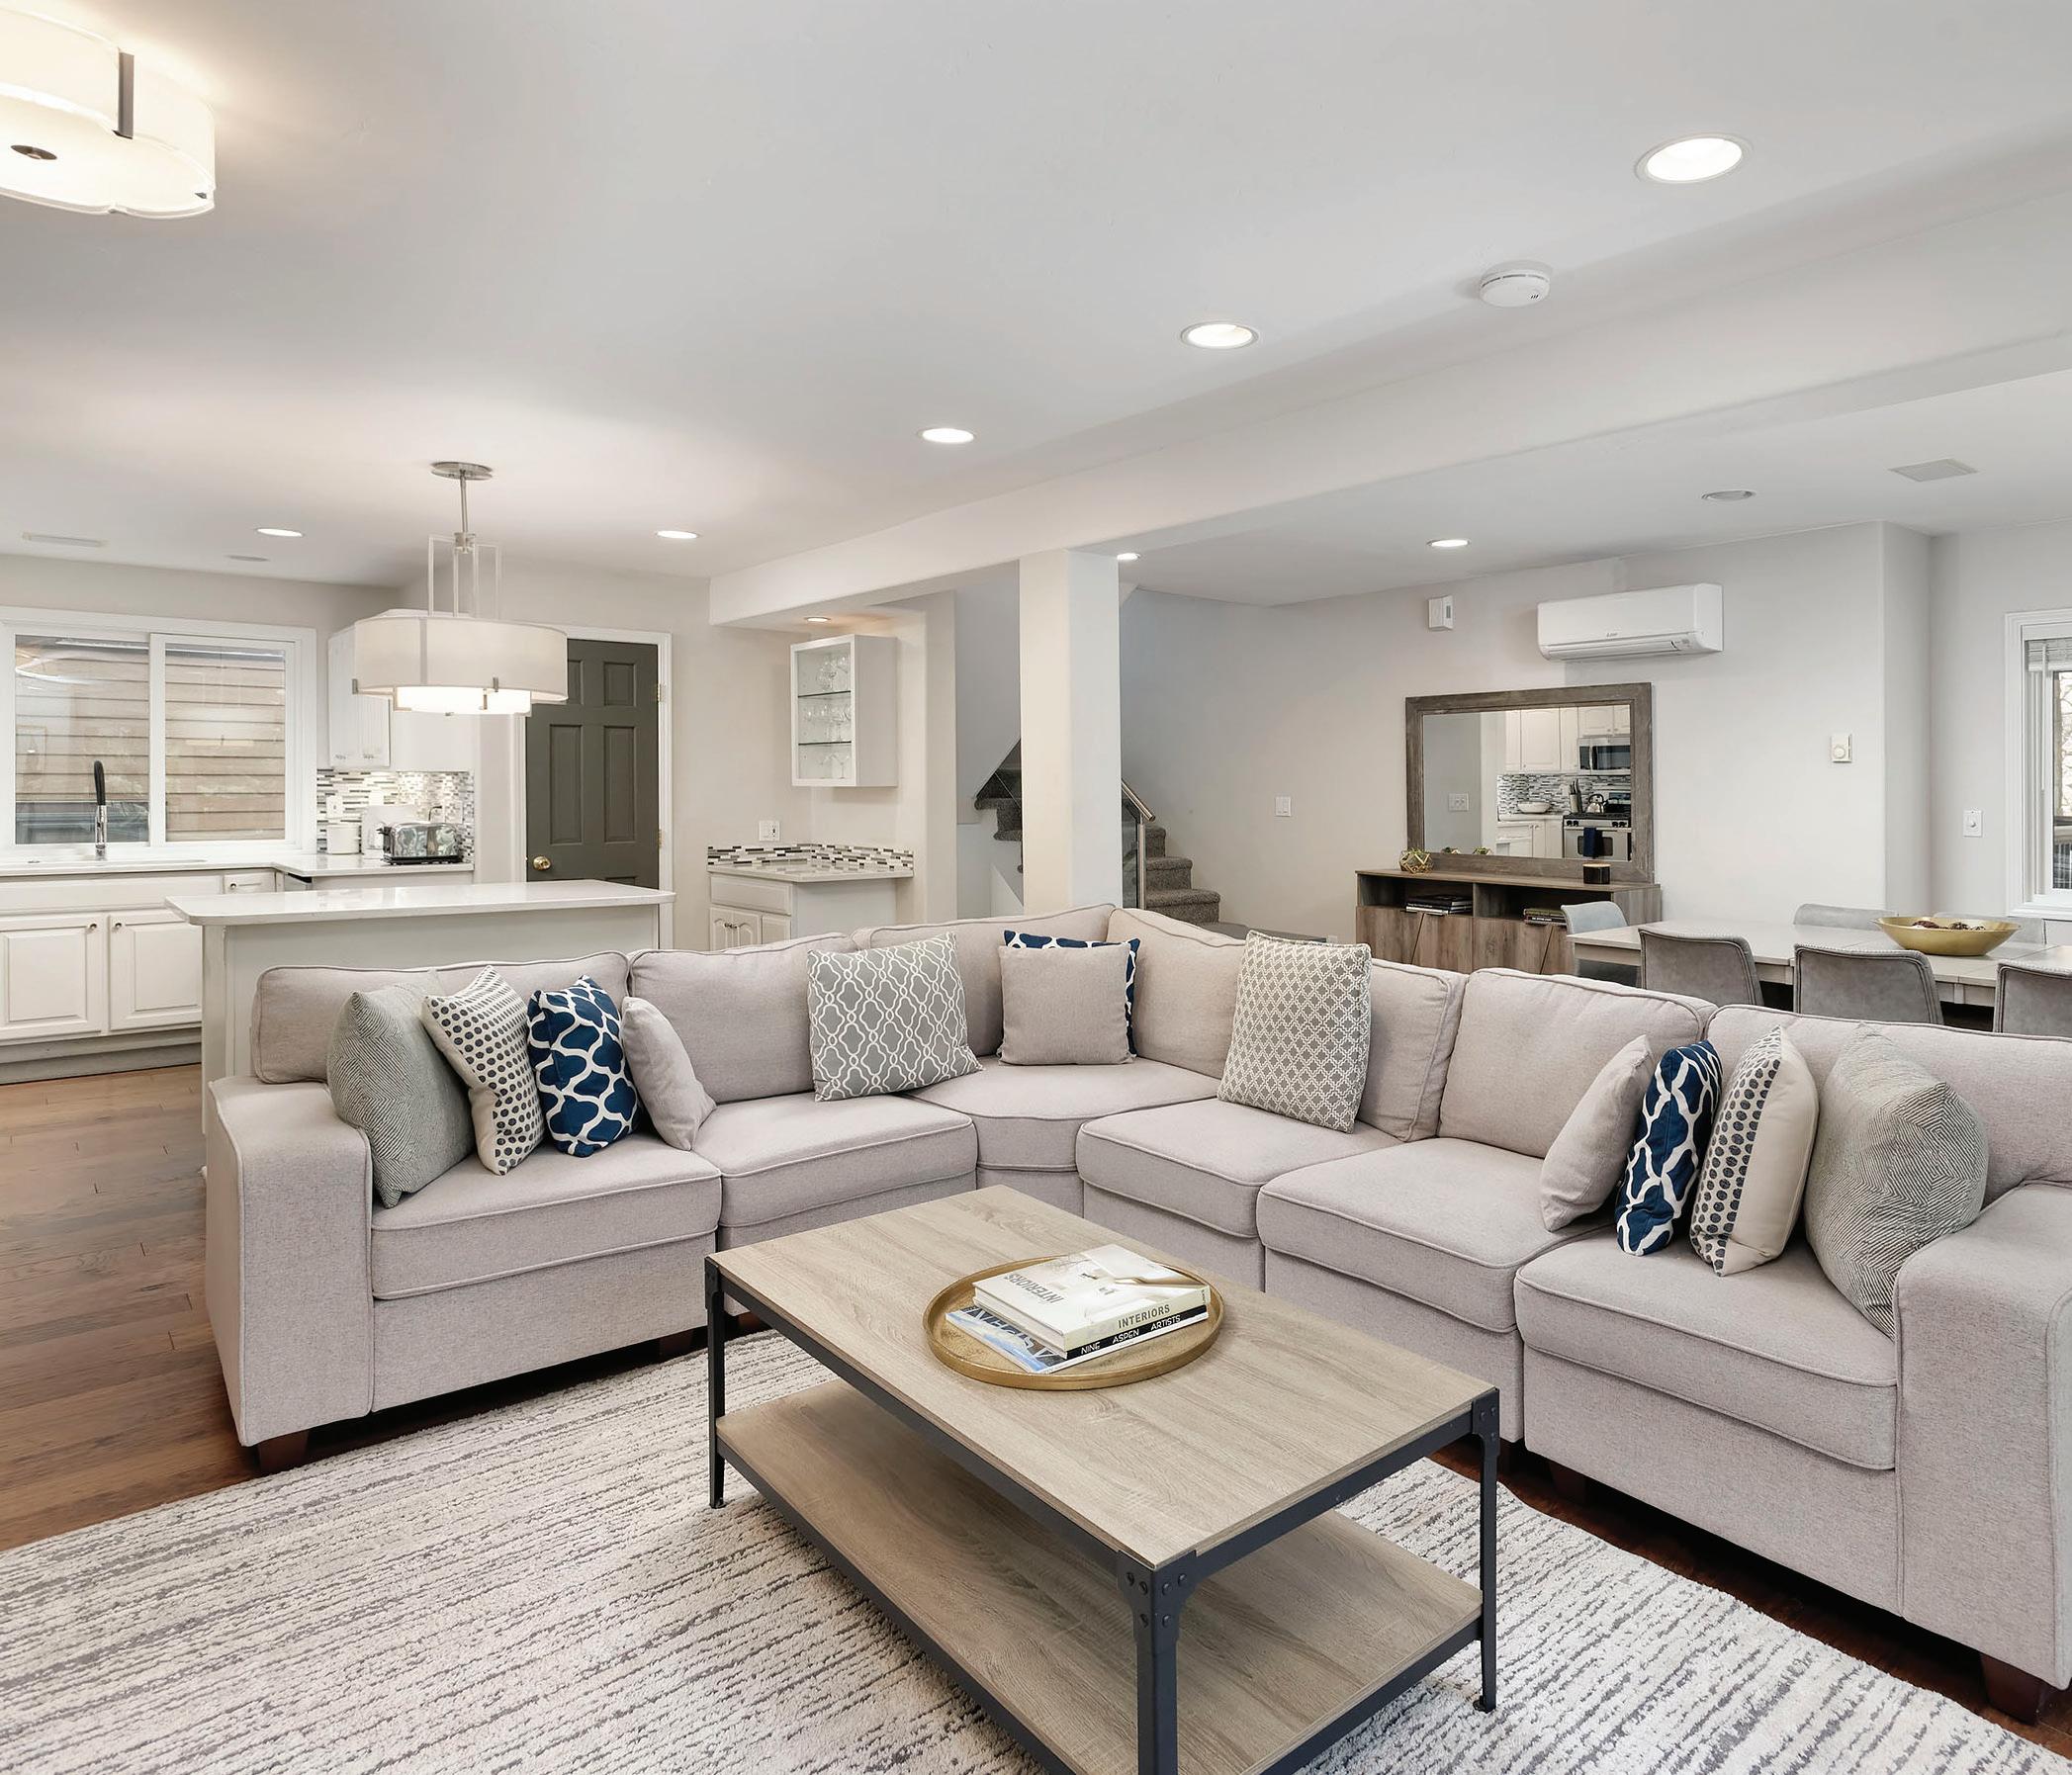
In Snowmass Village, the median sale price of a single-family home sold during the first half of 2023 declined 11% to $5.4 million although the average price increased by 4% to about $7.4 million. The average price per square foot increased 7% to $1,691.
Closed sales during the first half of 2023 declined from 27 last year to just 12 homes so far this year and overall dollar volume was down more than 50% to about $88.3 million.
There were 24 single-family homes for sale in
Snowmass Village at the end of June, compared to 17 at the end of last June.
The most expensive single-family home sold during the first half of 2023 in Snowmass Village was $17.8 million, while the highest price during the first half of 2022 was $18.3 million.
The number of days on market for single-family homes in Snowmass Village declined from 189 days last year to 149 days this year, while the percentage of sold price to original list price declined from 96% last year to 92% this year.
4% 2022 vs 2023 11% 2022 vs 2023
This data includes 61 sales from the new developments - Electric Pass Lodge or Havens
Condominium and townhome median prices in Snowmass Village saw significant gains compared to last year, with a median price of almost $1.8 million, up 18% from last year. The average price rose 12% to almost $2.3 million, and the average price per square foot rose 8% from $1,495 to $1,620.
Closed sales during the first half of 2023 compared to last year increased from 62 to 98, and overall sales volume rose 78% to $223 million.
At the end of the quarter there were 45 townhome or condominium units on the market in Snowmass Village, compared to 29 last year.
In the Snowmass Village condo/townhome market, the most expensive property sold in the first half of 2023 sold for nearly $8.8 million, compared to the highest sale price in 22H1 of $6.6 million.
The percentage of sold to original list price declined just slightly compared to last year from 99% to 98%, while the days on market meaningfully rose.

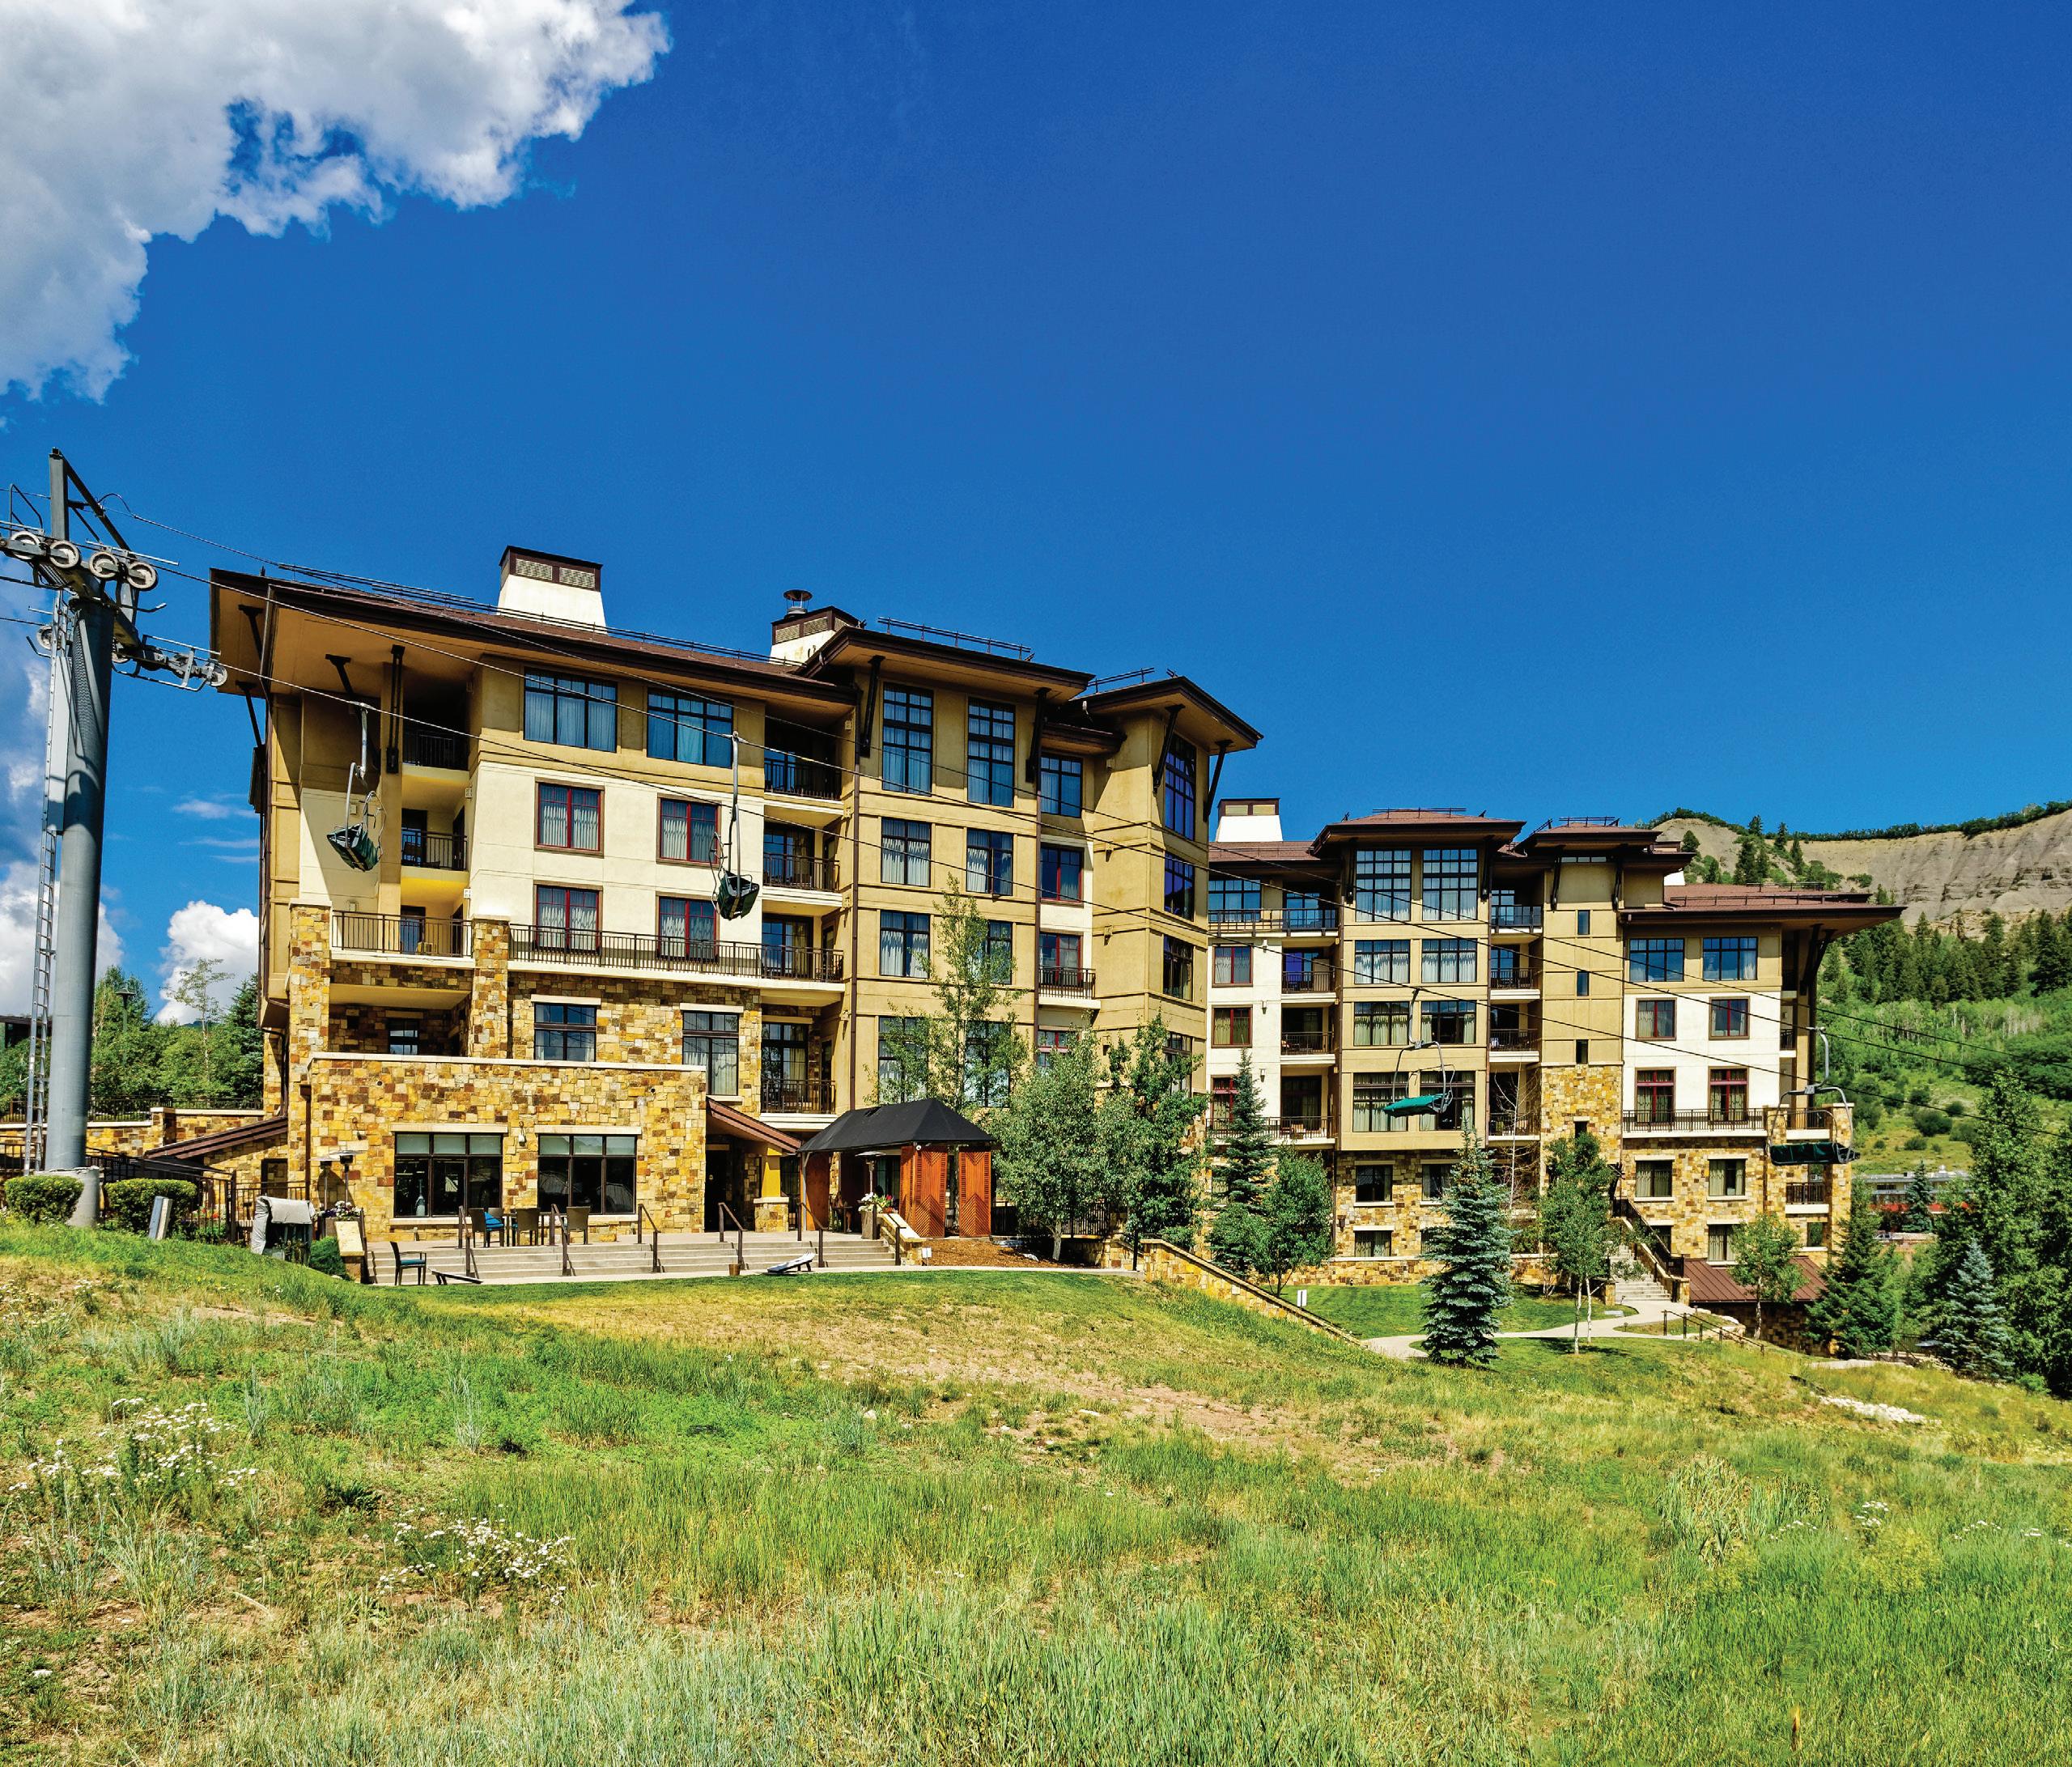

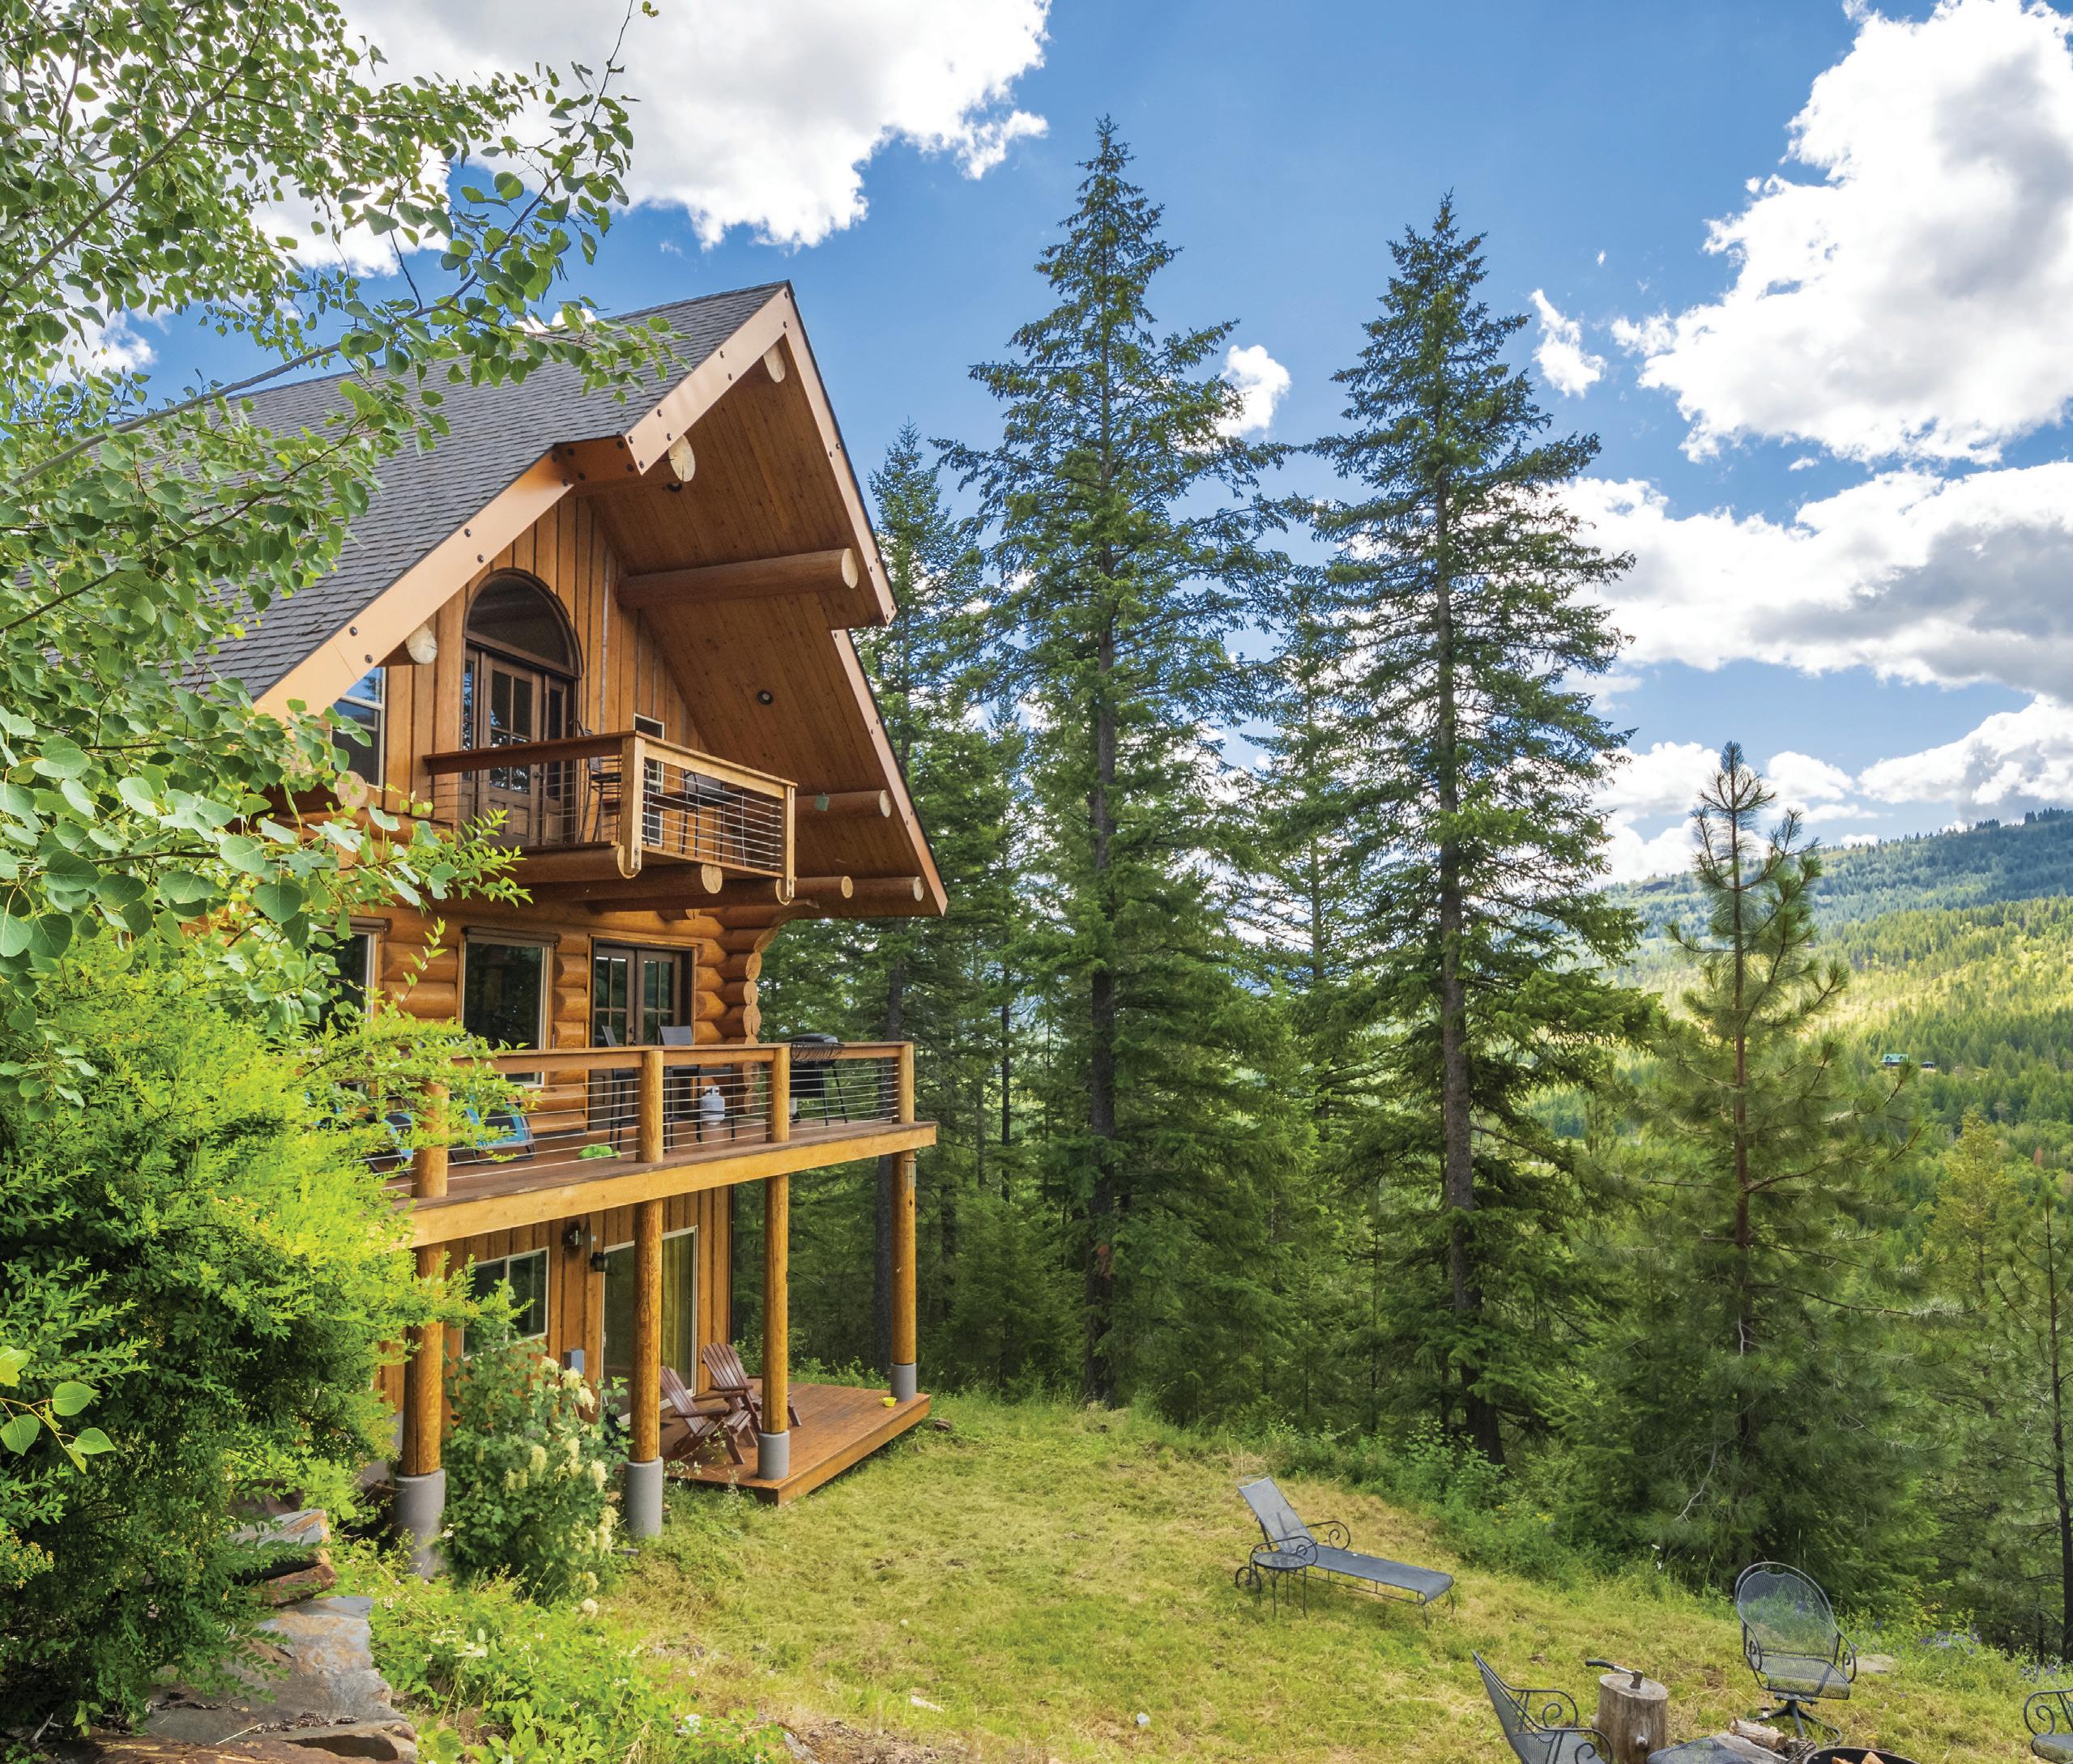

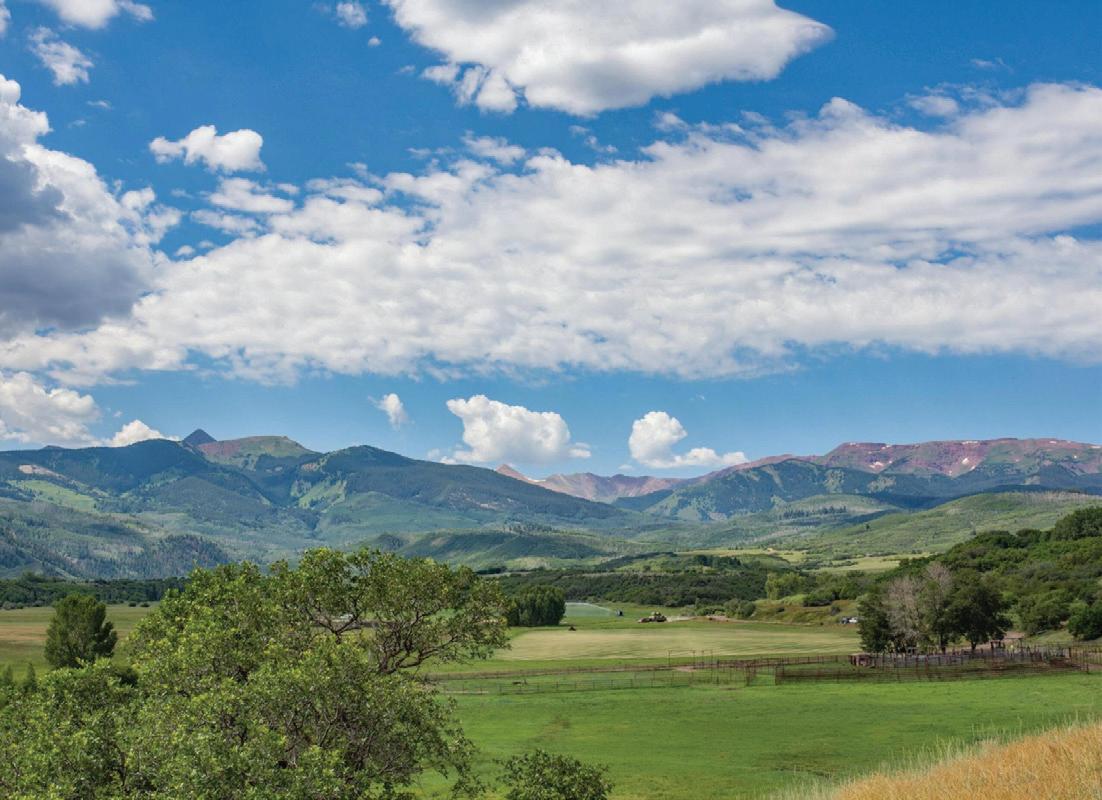
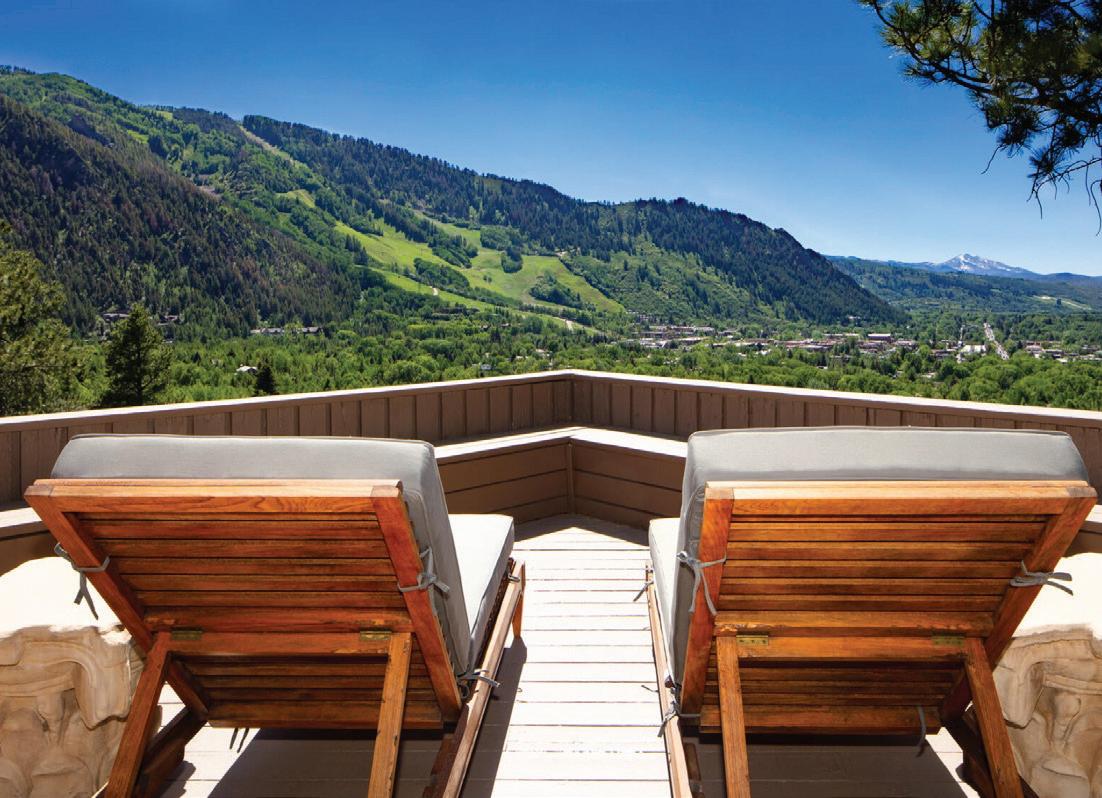

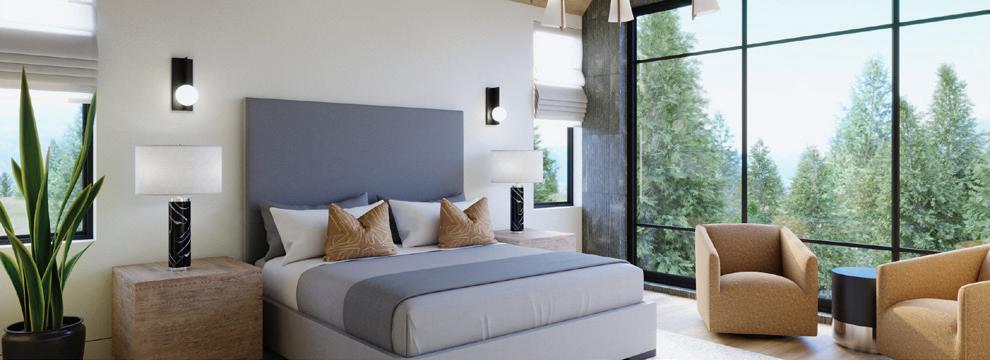
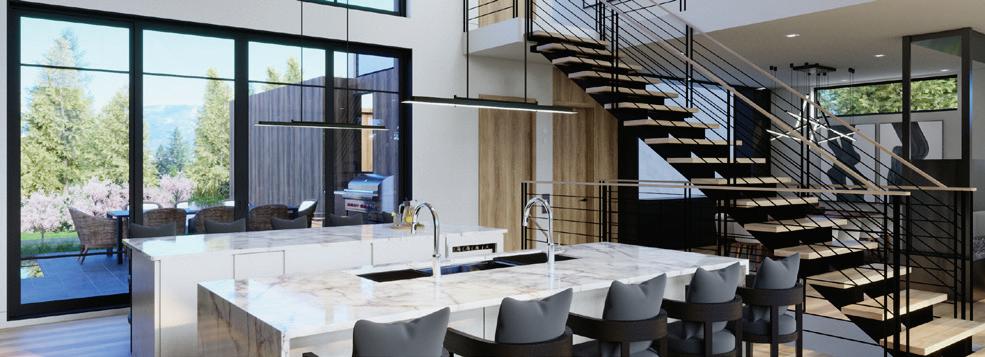
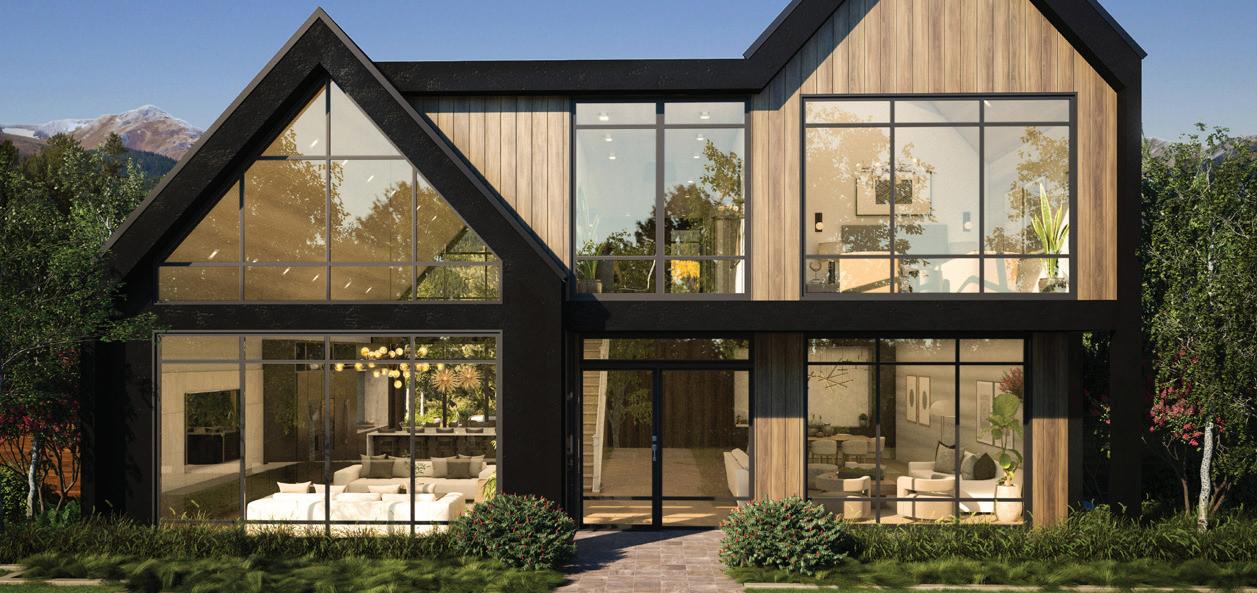
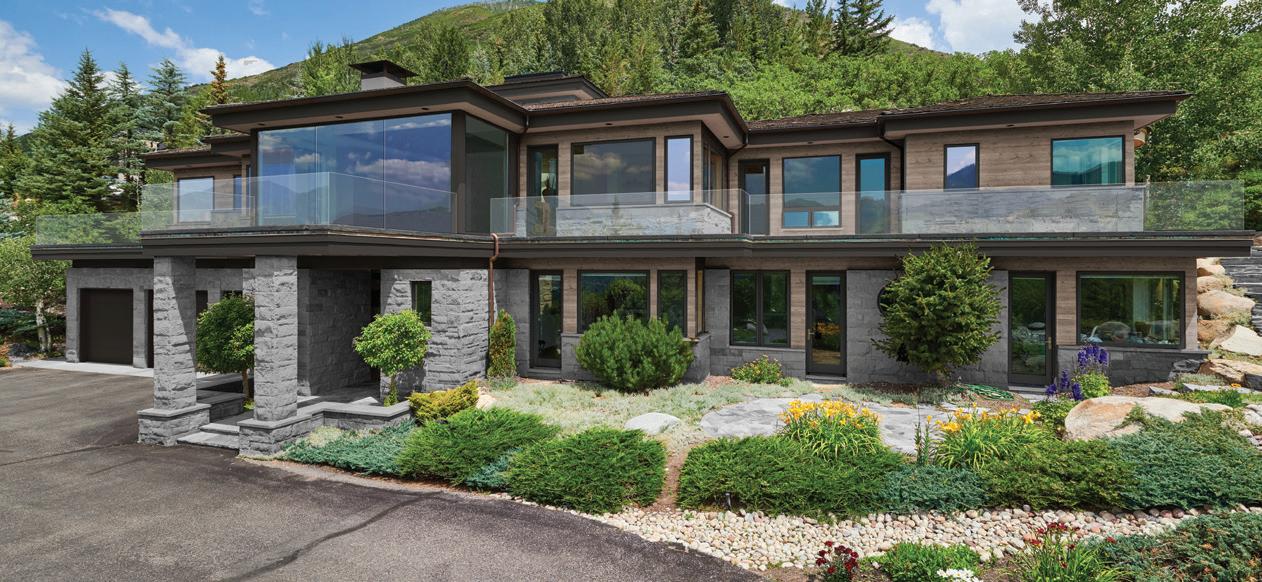

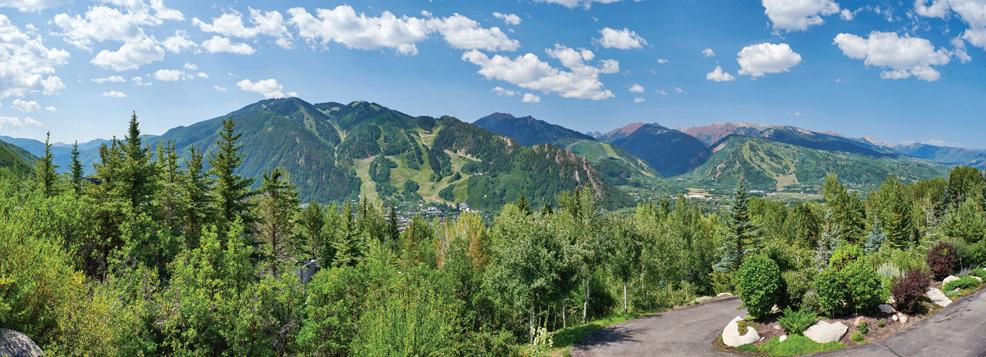
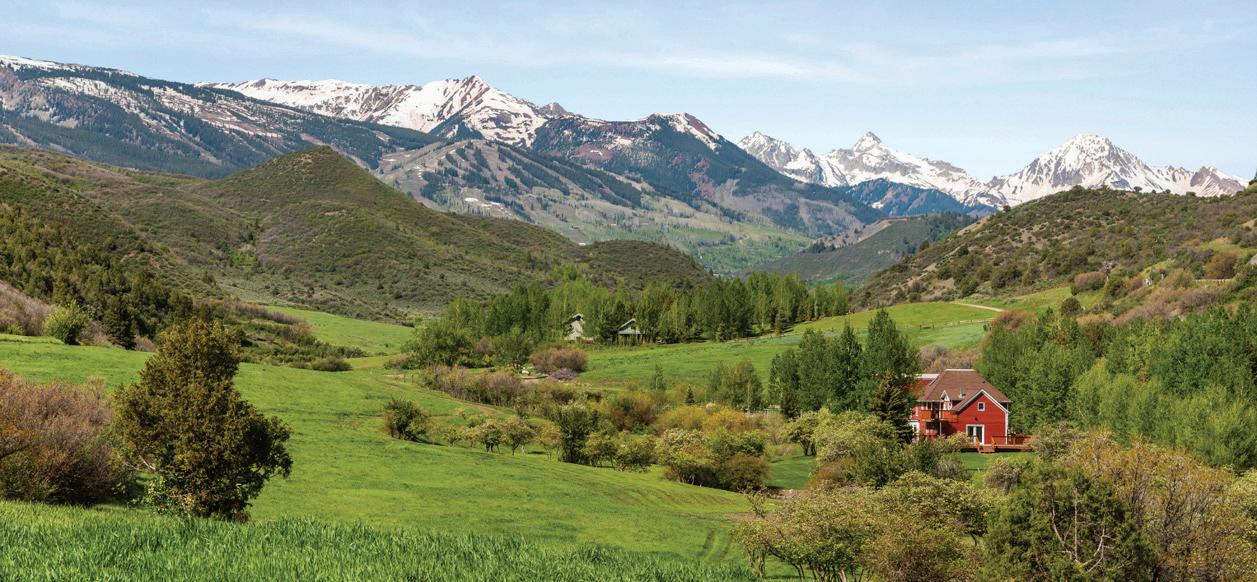

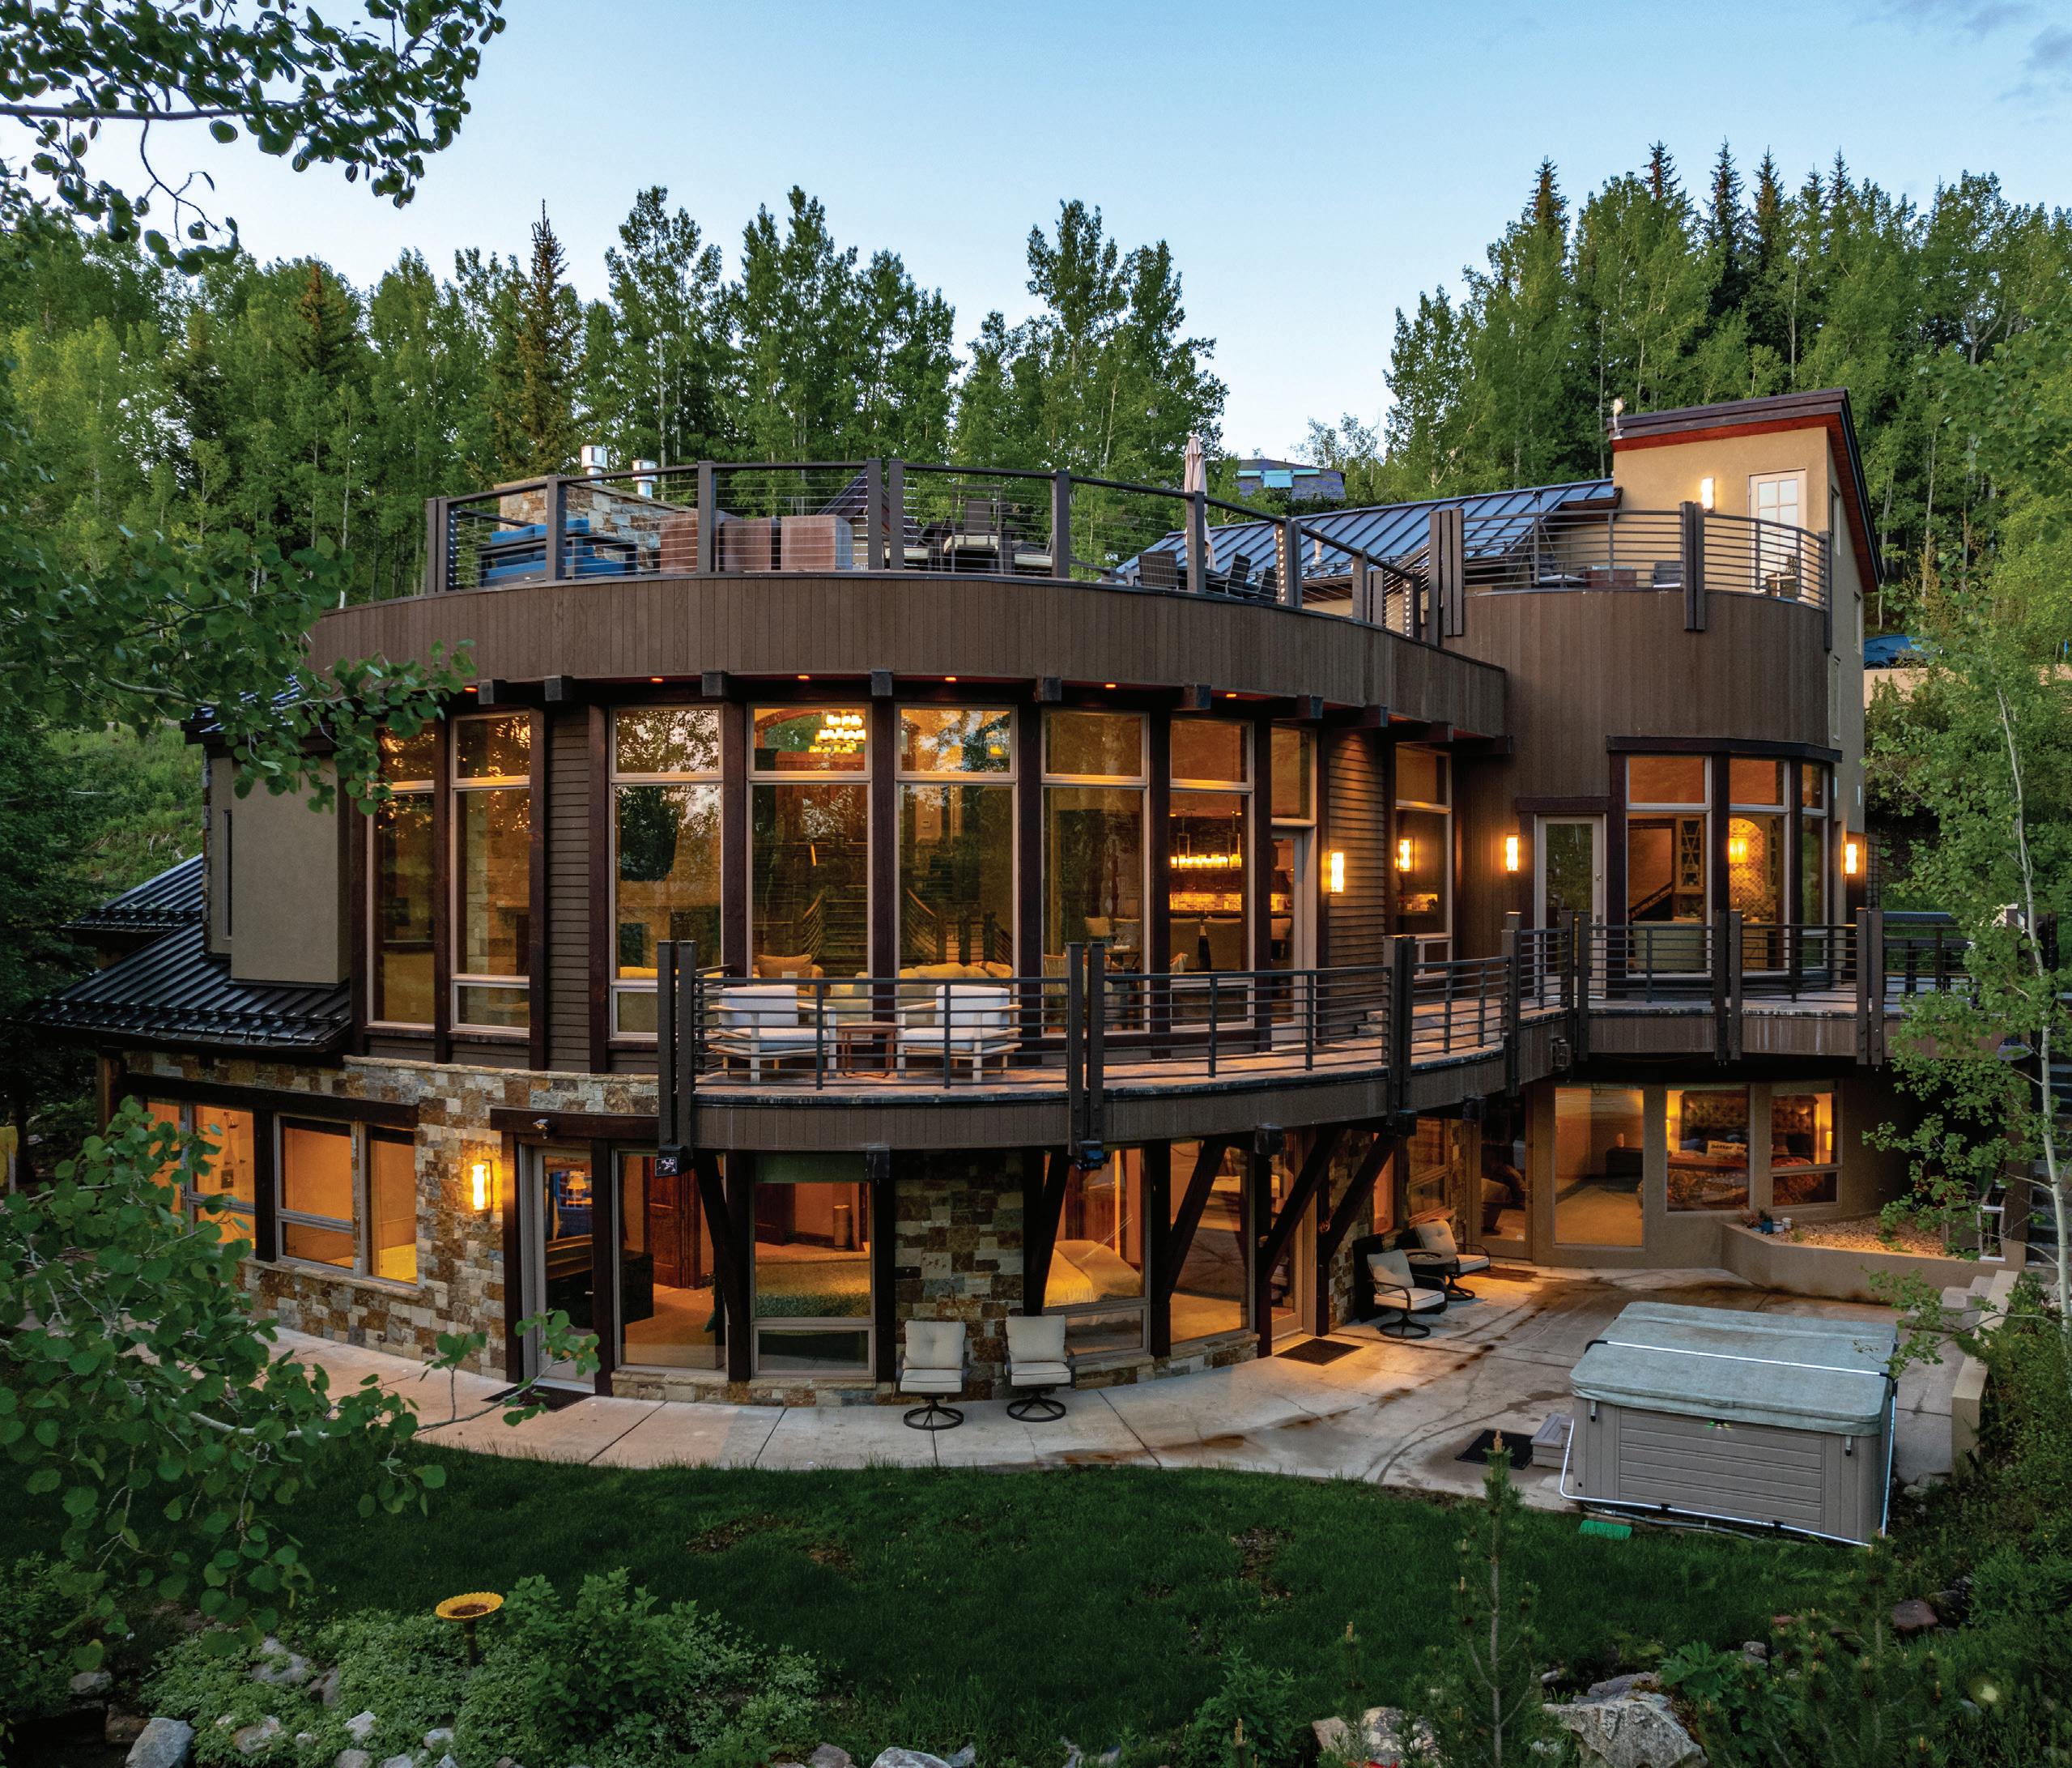
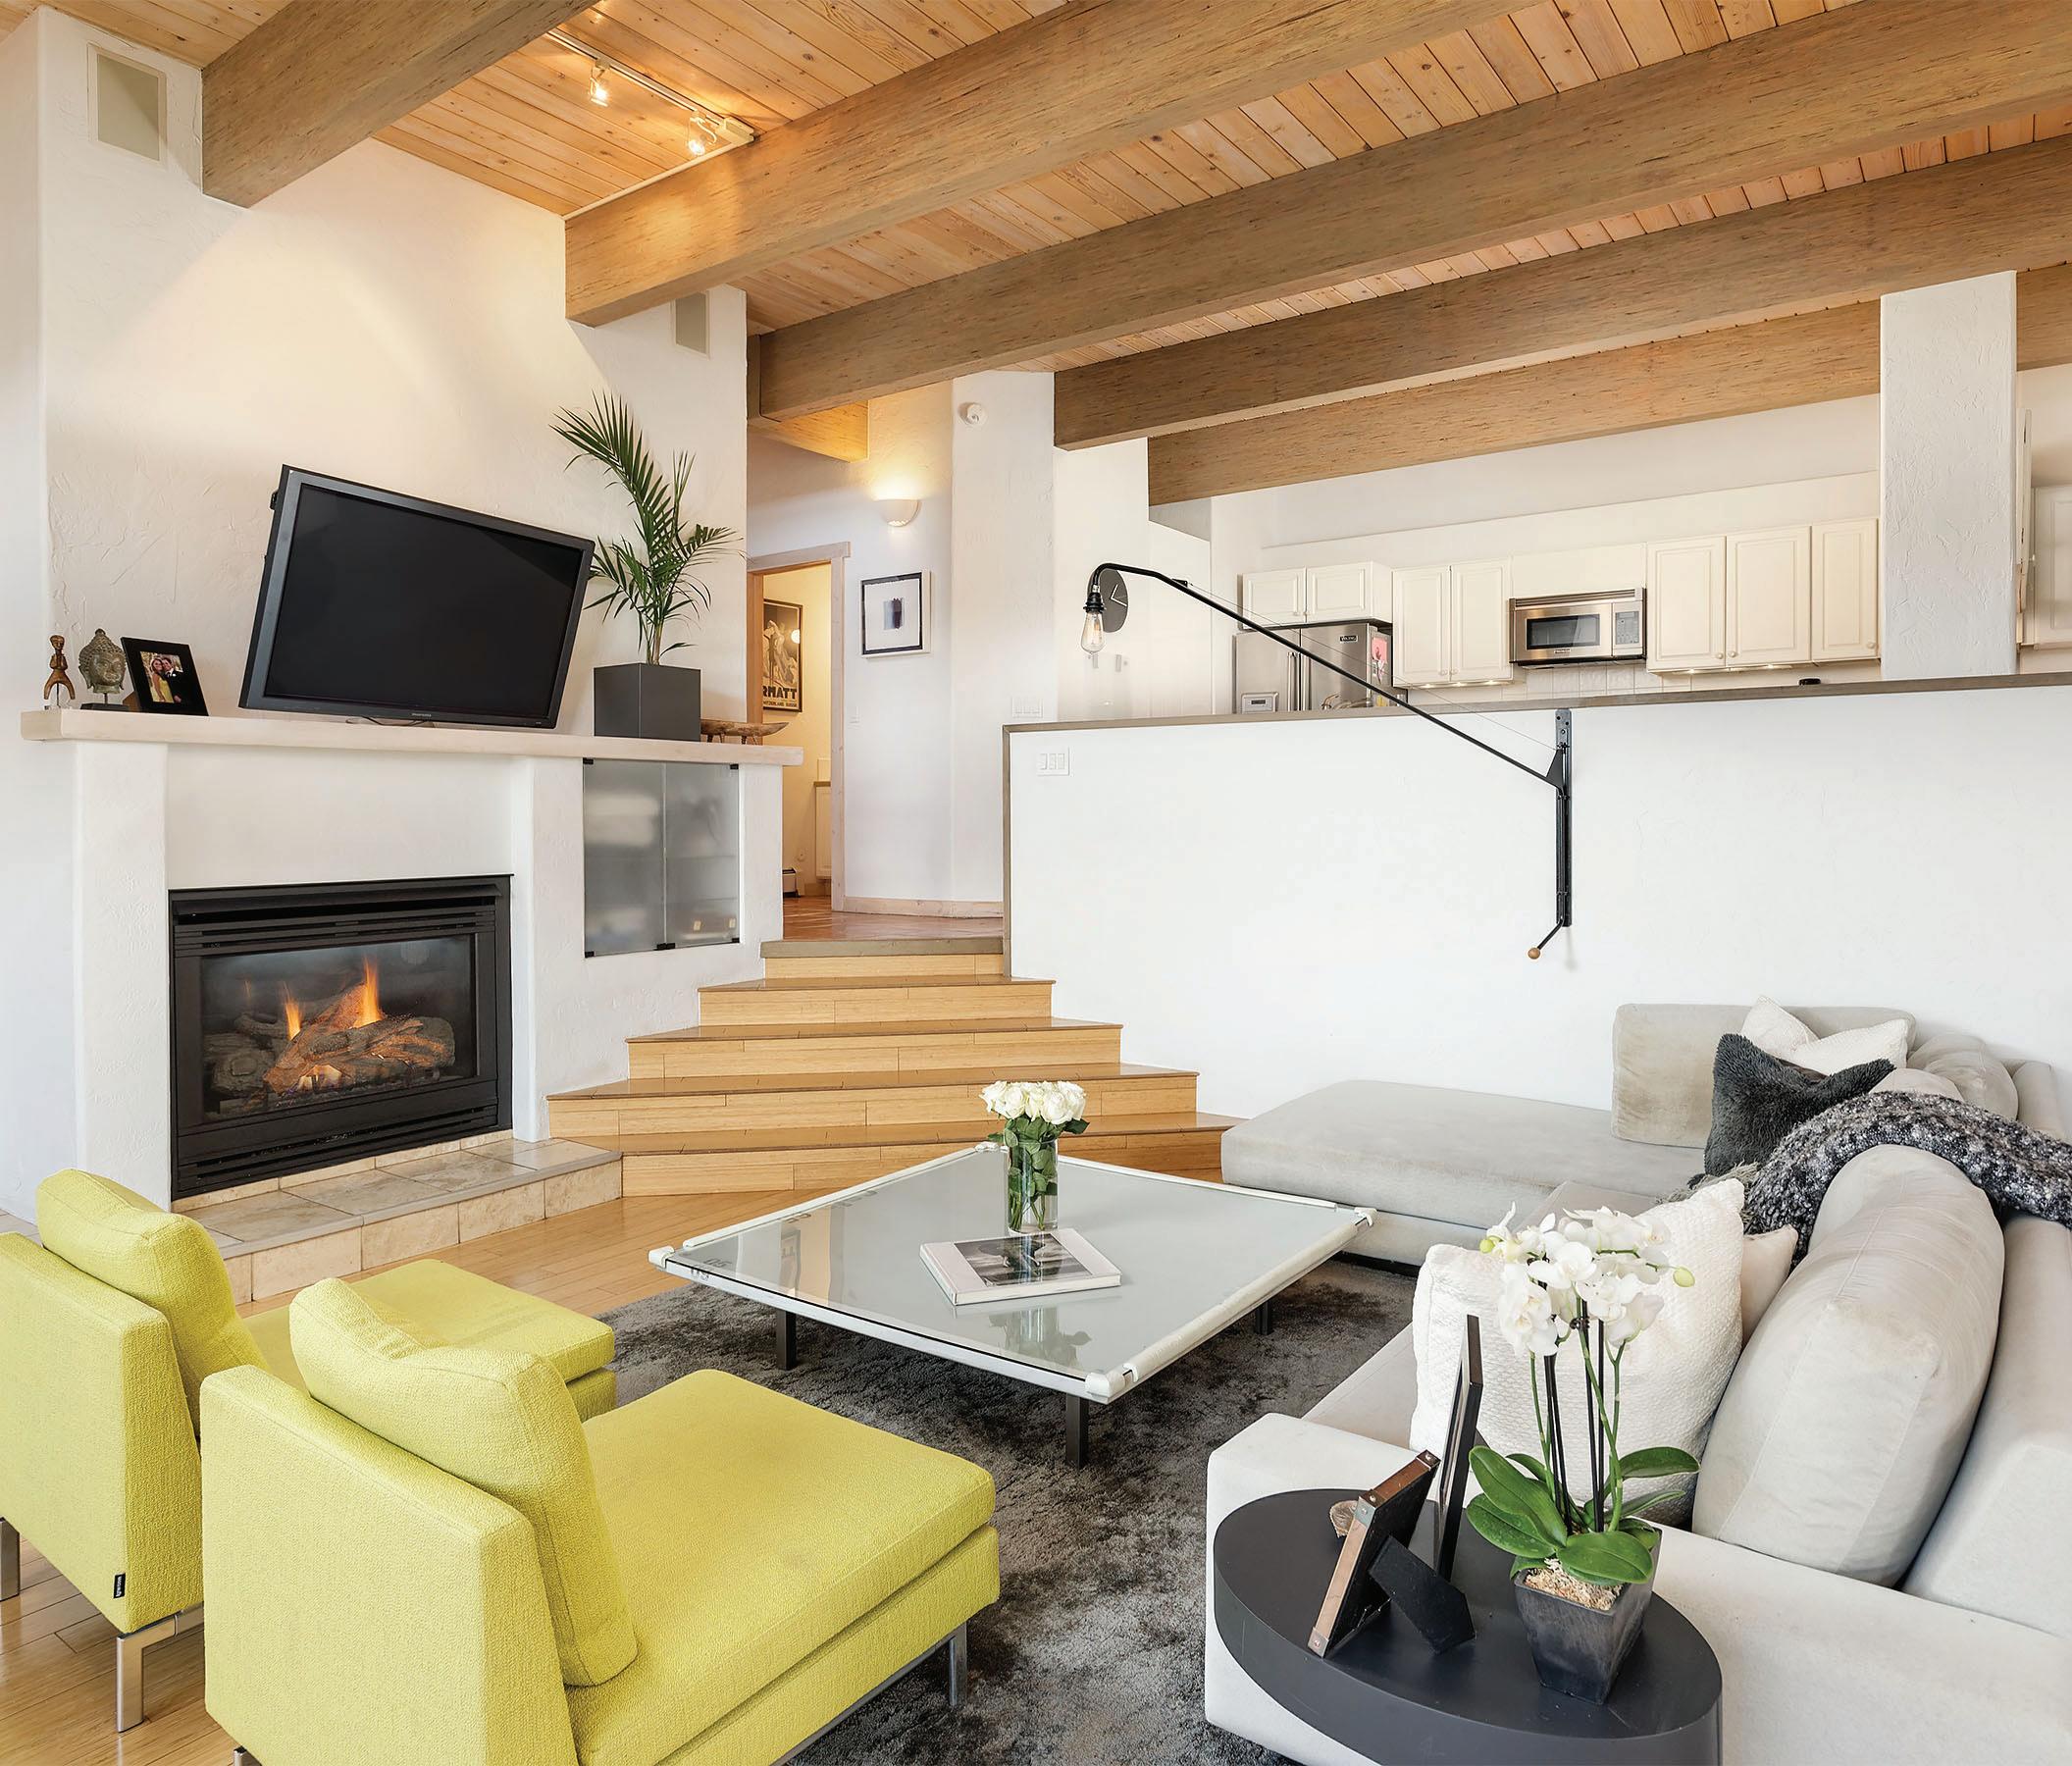
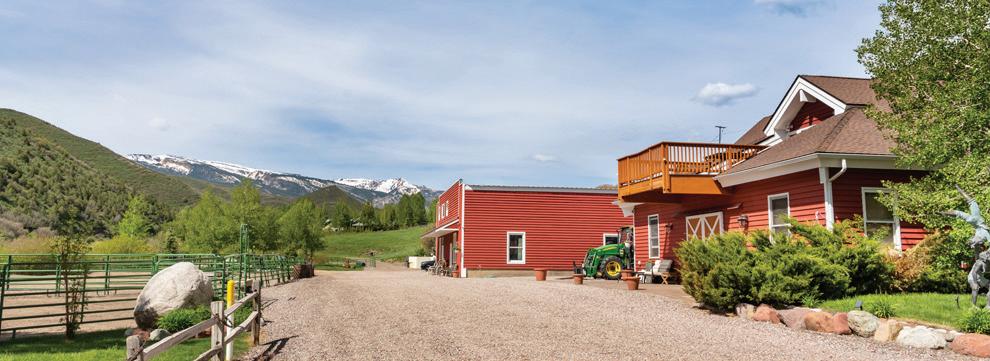 6 BEDS | 6 BATHS | 4,995 SF | 102+ ACRE RANCH 660 BRUSH CREEK ROAD, SNOWMASS VILLAGE
Unbeatable + Rare Lake Views
$21,875,000 WEST END LIVING

5 BEDS | 4F, 1H BATHS | 4,457 SF 280 LAKE AVENUE, ASPEN 60
Majestic Maroon Court
$18,000,000 NEW CONSTRUCTION
5 BEDS | 8 BATHS | 5,066 SF 30 MAROON COURT, ASPEN 660
Amazing Ski Home
$14,500,000 SKI-IN/SKI-OUT ADAMS AVE
6 BEDS | 6 BATHS | 5,023 SF 1457 WOOD RD, SNOWMASS VILLAGE
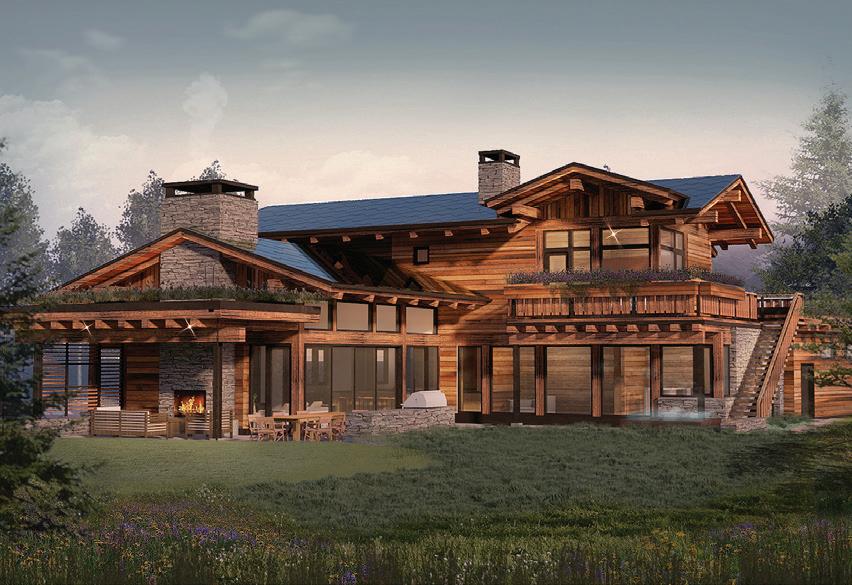
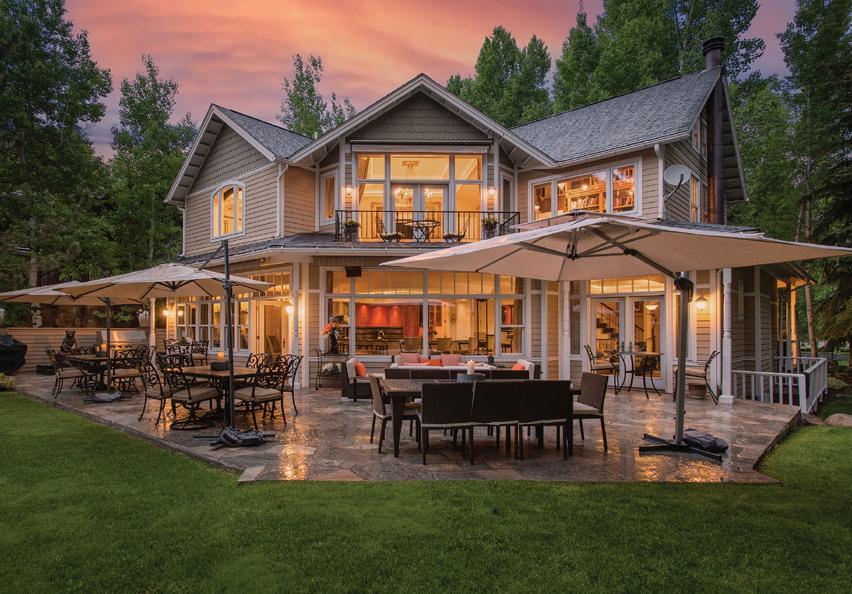
Aspen Mountain Views
$12,400,000 ENTERTAINER’S DREAM
4 BEDS | 4F, 1H BATHS | 3,083 SF 1190 RIVERSIDE DRIVE, ASPEN
Luxurious West End
$19,500,000 PERFECT FOR HOSTING
4 BEDS | 4F, 1H BATHS | 5,482 SF 101 W FRANCIS STREET, ASPEN
Havens 8
$17,600,000 SKI-IN/SKI-OUT
4 BEDS | 4F, 1H BATHS | 3,349 SF 411 WOOD ROAD 8, SNOWMASS VILLAGE
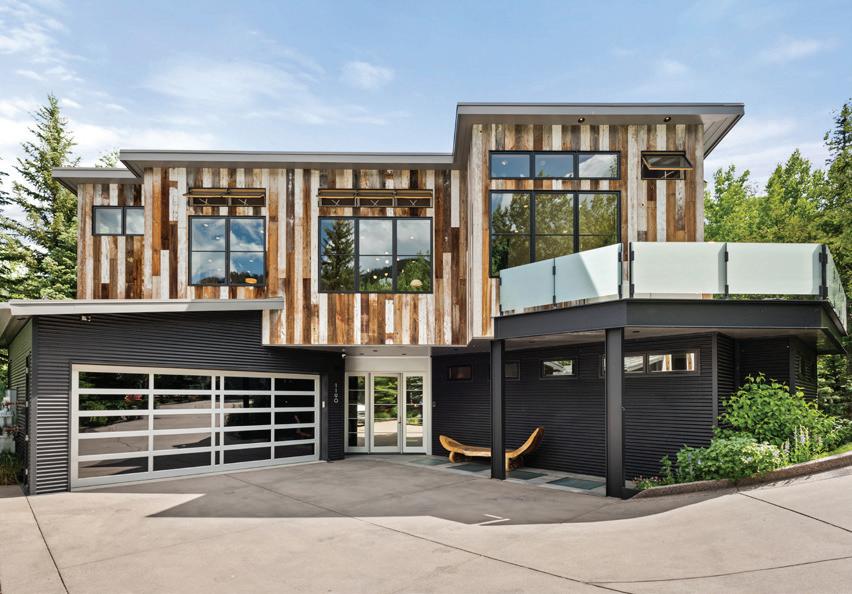
Aspen’s Coveted West End
$13,995,000 ASPEN RETREAT
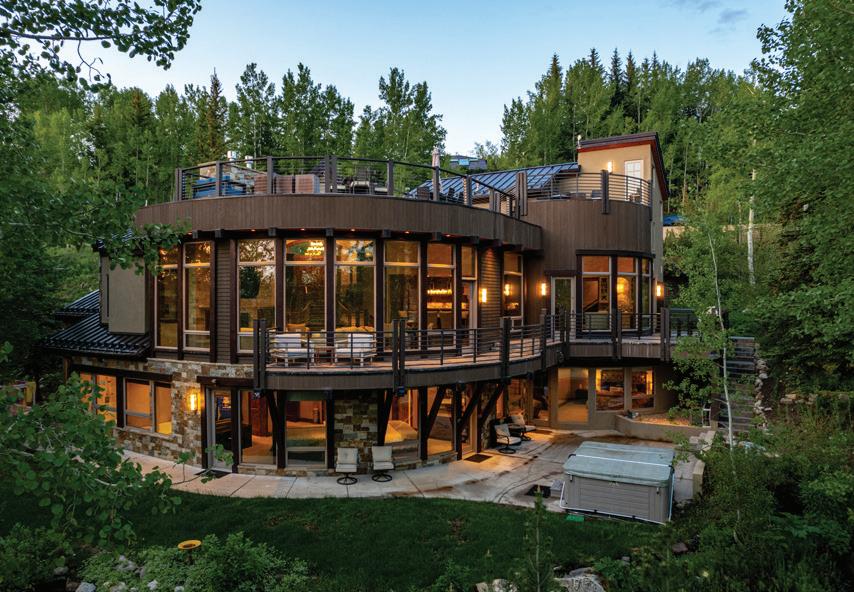

4 BEDS | 6 BATHS | 3,759 SF 604 N EIGHTH STREET, ASPEN
Beautiful West End Victorian
$8,900,000 PERFECT ASPEN PIED-A-TERRE
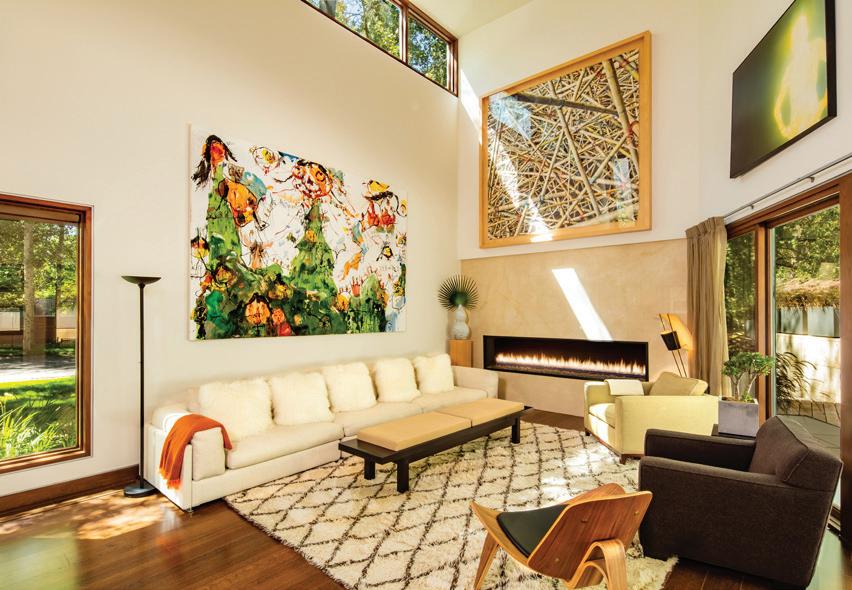
3 BEDS | 3F, 1H BATHS | 2,176 SF 131 W BLEEKER STREET, ASPEN
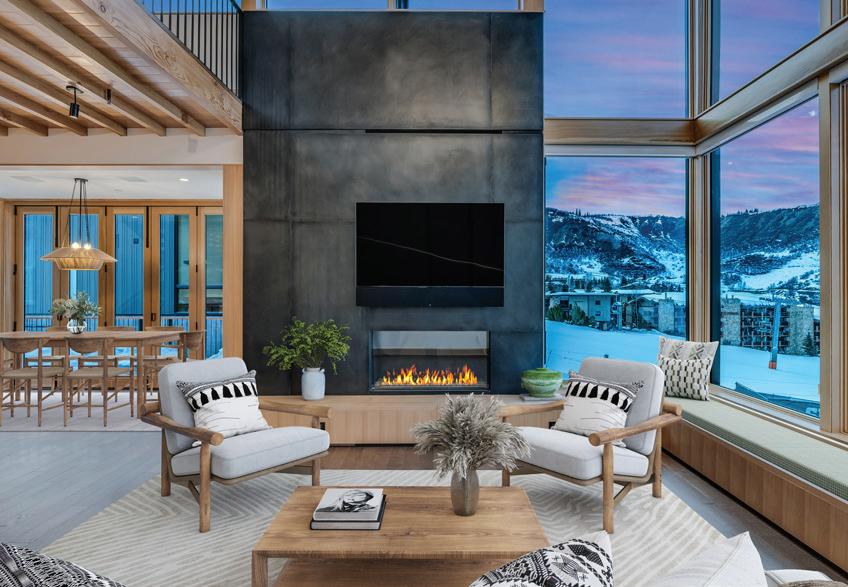
Mountains of Opportunity
$8,300,000 LUXURIOUS RETREAT
2 BEDS | 1 BATHS | 999 SF + 71 ACRES 4300 MIDNIGHT MINE RD., ASPEN
Design Your Dream Home
$6,500,000 WHITE BOX - CUSTOMIZE IT
4 BEDS | 3F, 2H BATHS | 5,740 SF 340 MONASTERY CUTOFF RD, SNOWMASS
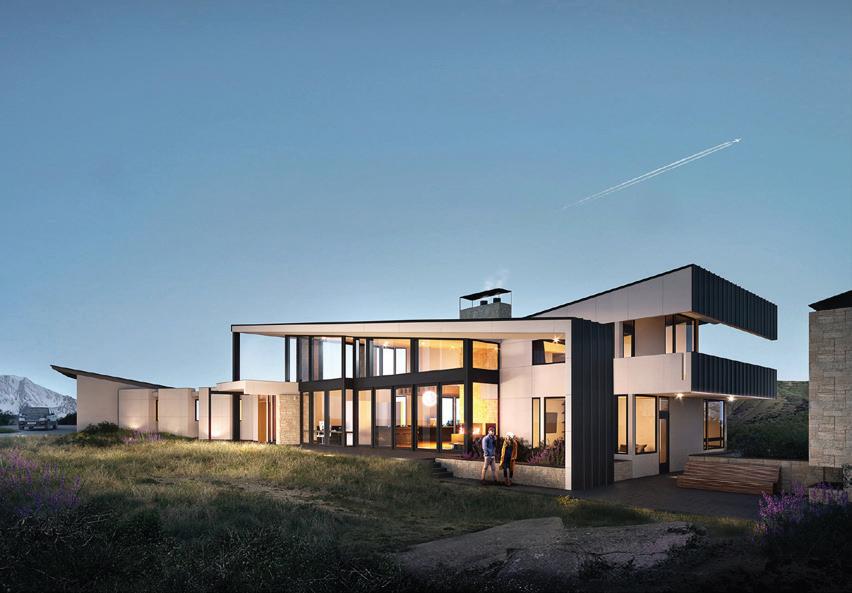
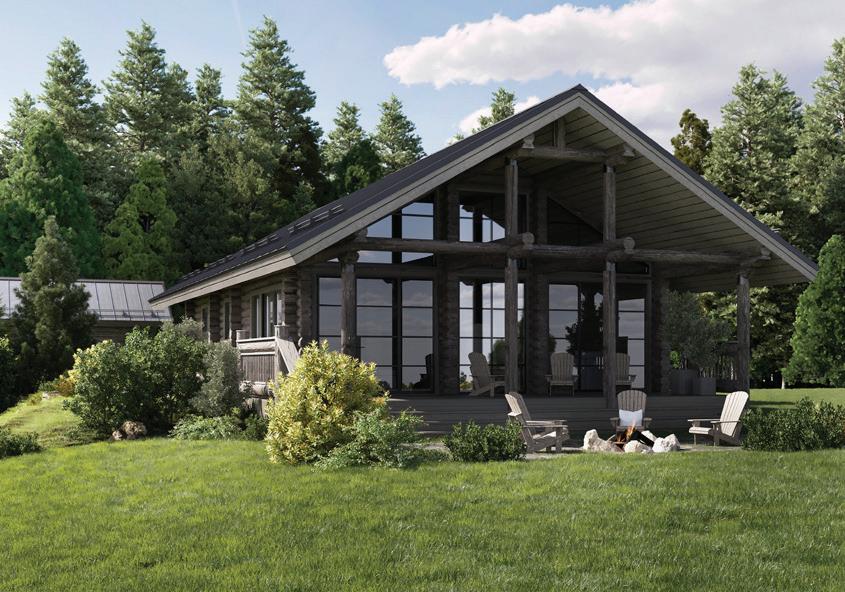
Welcome Home in Snowmass
$3,900,000 MEADOW RANCH
3 BEDS | 2 FULL, 1 HALF BATH | 2,472 SF 350 LOHRS COURT, SMV
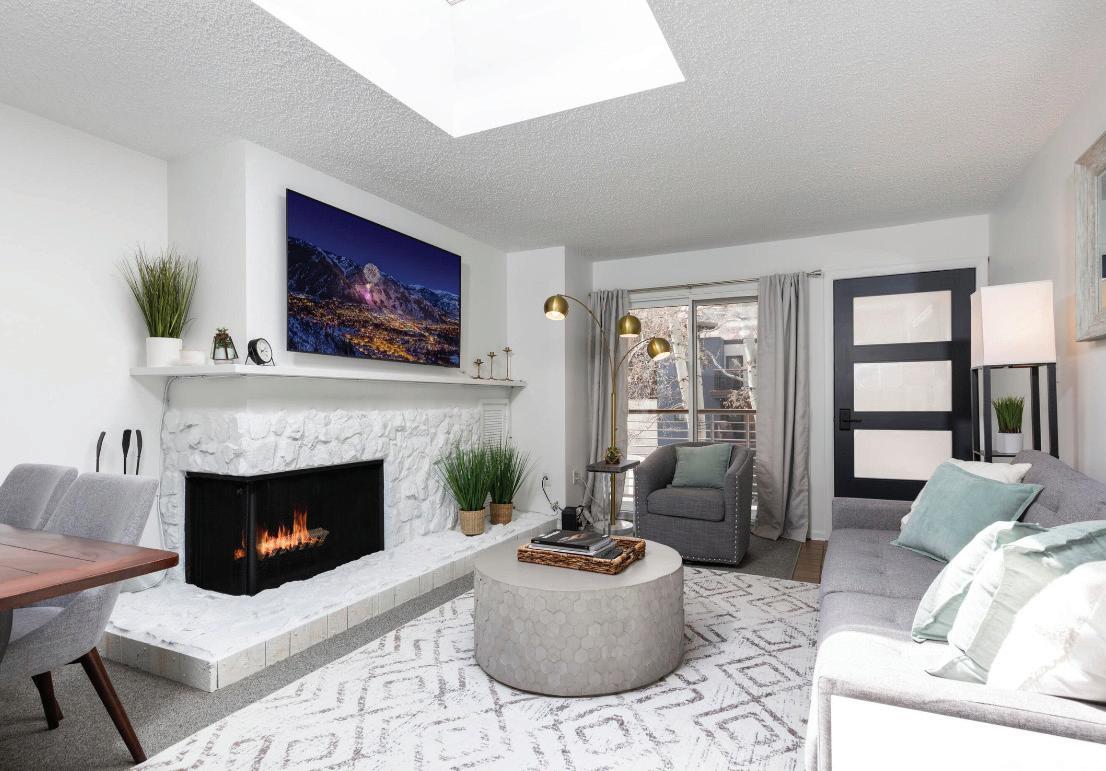
Timber Ridge Aspen Core
$2,750,000 PERFECTLY REMODELED
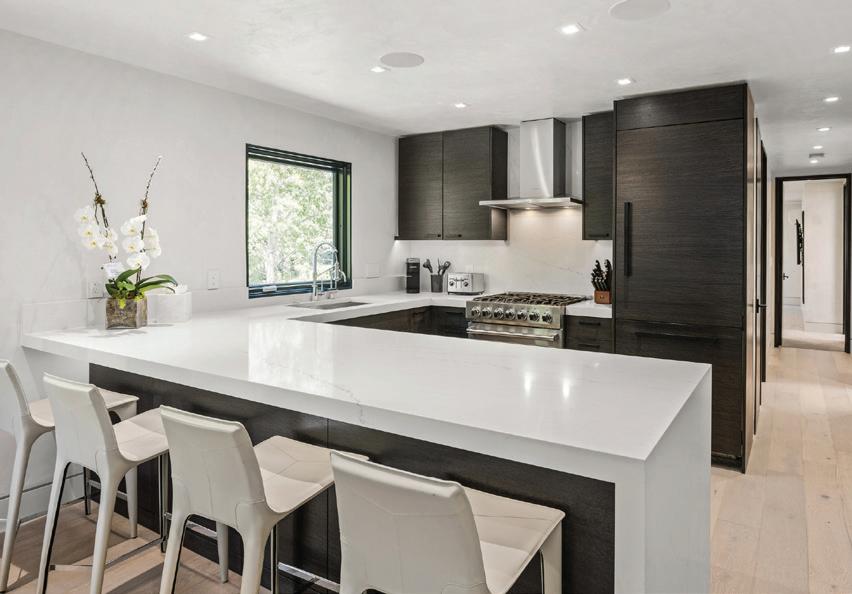
2 BEDS | 1F, 1H BATHS | 880 SF 100 E DEAN STREET 3D, ASPEN 60
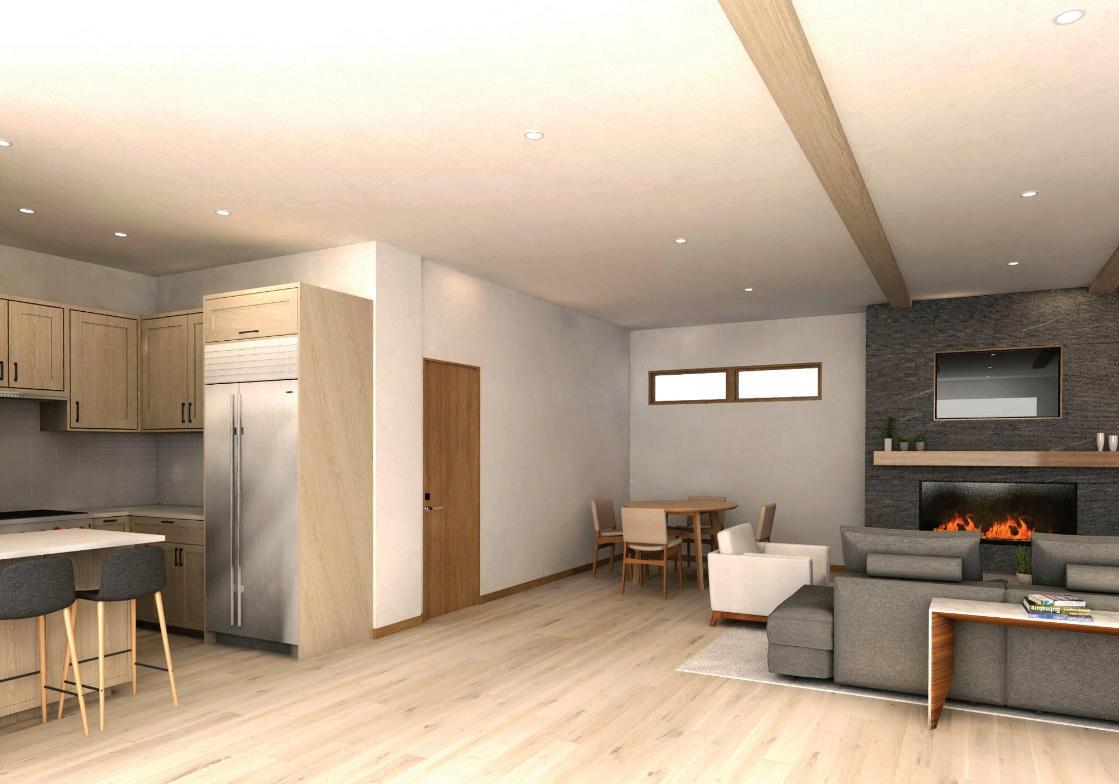

Close to Everything in Aspen
$7,250,000 ASPEN MOUNTAIN VIEWS

4 BEDS | 4 BATHS | 2,624 SF 215 MIDLAND AVENUE UNIT B, ASPEN
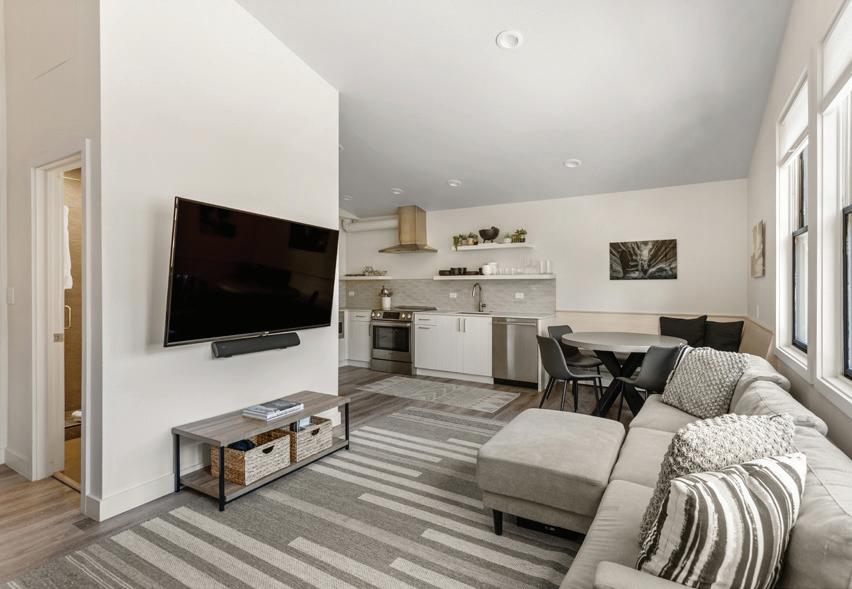
Aspen Core Timber Ridge
$4,150,000 NEWLY RENOVATED
2 BEDS | 2 BATHS | 967 SF 100 E DEAN STREET 3A, ASPEN
Fasching Haus Aspen Core
$3,100,000 RARELY AVAILABLE
2 BEDS | 2 BATHS | 845 SF 718 S MILL STREET 11, ASPEN
Downtown Aspen Core
$2,495,000 NEWLY REMODELED
2 BEDS | 1 BATH | 771 SF 220 W MAIN STREET 210/P1/B6, ASPEN
Missouri Heights Home
$2,399,000 EXTENSIVE PANORAMIC VIEWS
5 BEDS | 4F, 1H BATHS | 4,547 SF 735 GREEN MEADOW DRIVE, CARBONDALE 60
Historic Herron Mansion
$1,995,000 WEST END PIED-À-TERRE
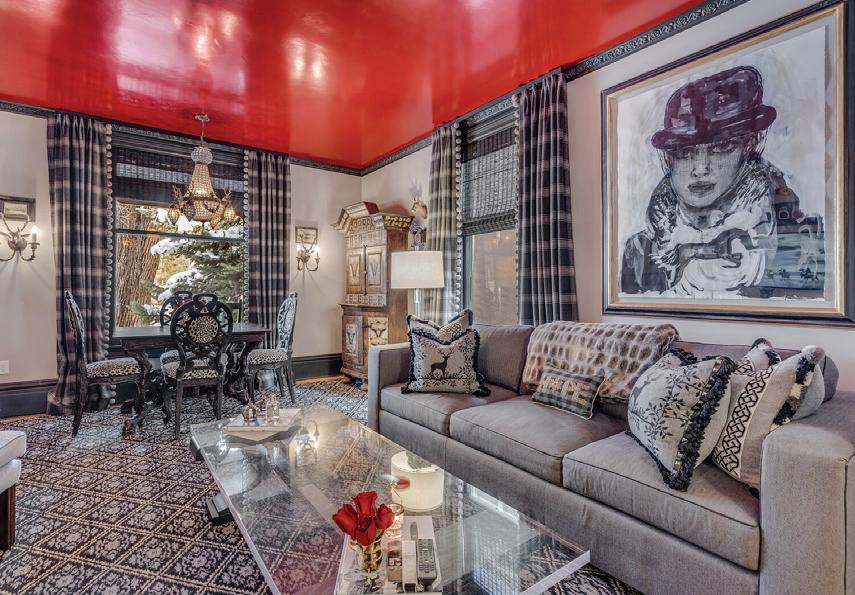


1 BED | 1 BATH | 616 SF 333 W MAIN STREET 1-A, ASPEN
Aspen Mesa Estates
$1,750,000 JAW-DROPPING VIEWS
4 BEDS | 4 BATHS | 2,856 SF 152 VEGA ROAD, CARBONDALE
$1,500,000 DELIVERY AUTUMN, 2023 New Shadowrock
3 BEDS | 2F, 1H BATH | 1,927 SF
272 OVERLOOK, BASALT
Assay Hill Lodge
$2,145,000 SKI-IN, SKI-OUT
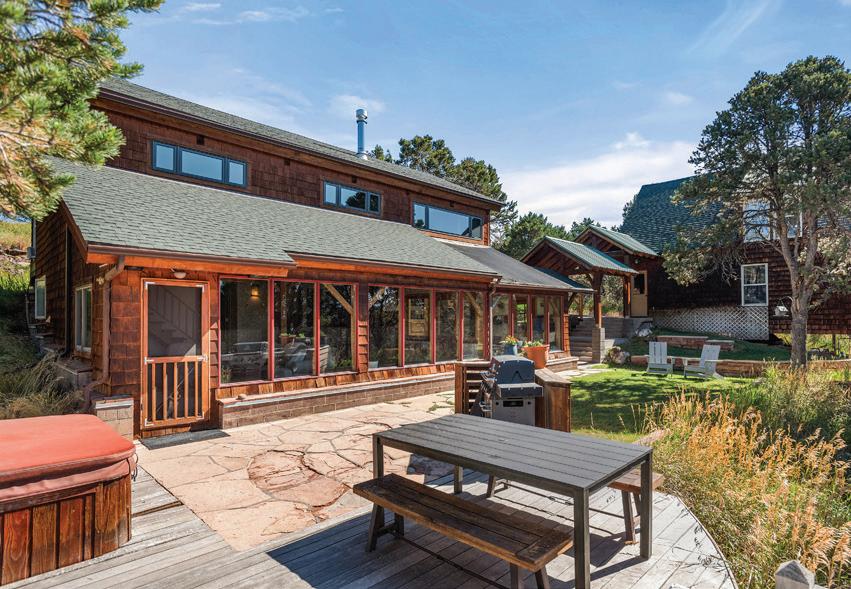
2 BEDS | 2 BATHS | 898 SF
130 WOOD ROAD #733, SNOWMASS VILLAGE
Downtown Aspen Condo
$1,885,500 BRAND NEW, TURN-KEY
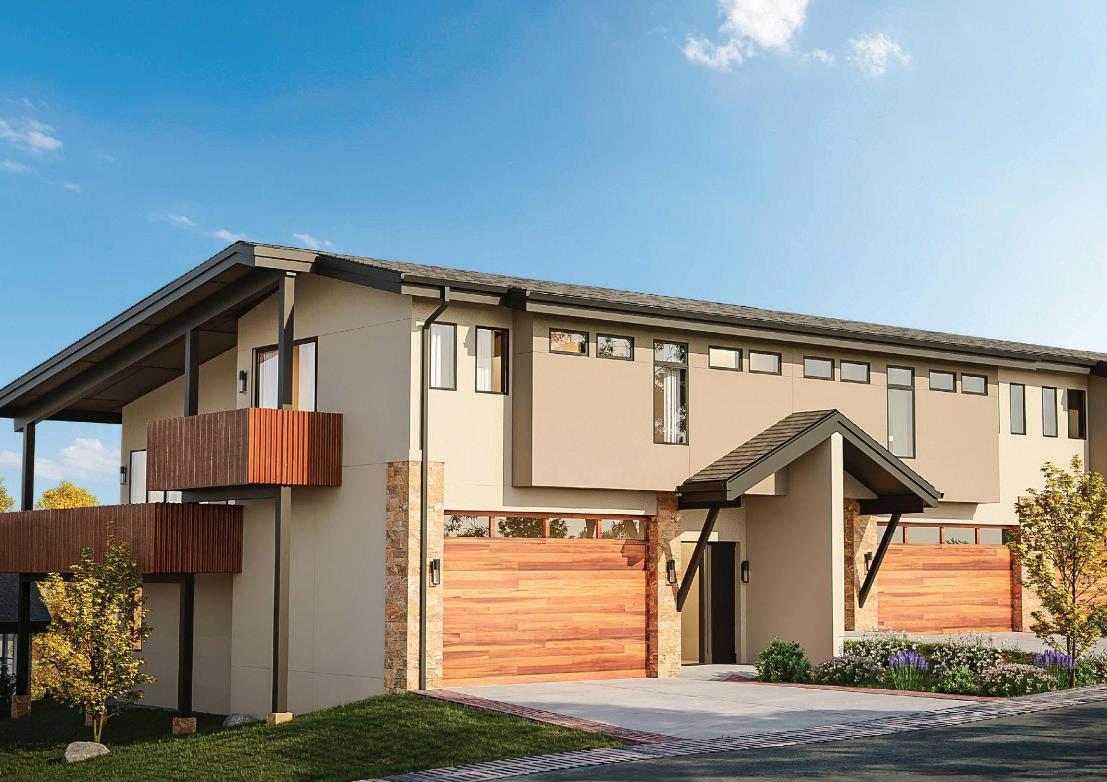
1 BED | 1 BATH | 555 SF 819 E HYMAN AVENUE #7, ASPEN
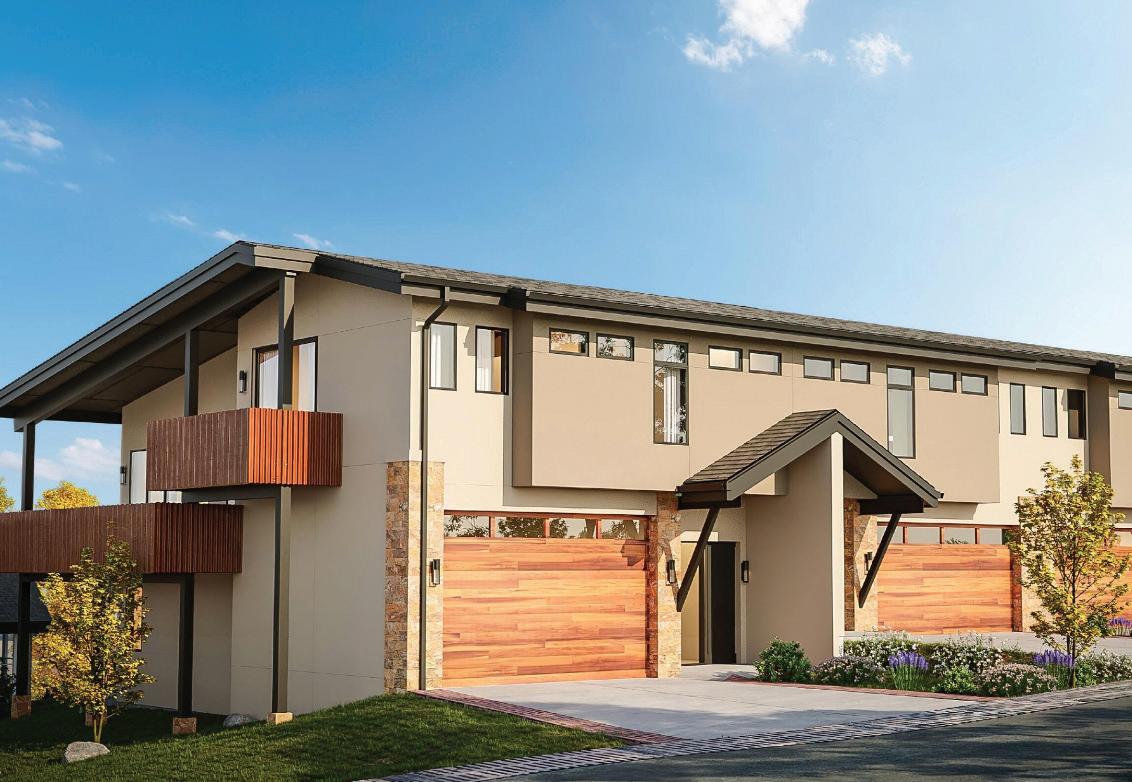
Shadowrock Mountain Contemporary
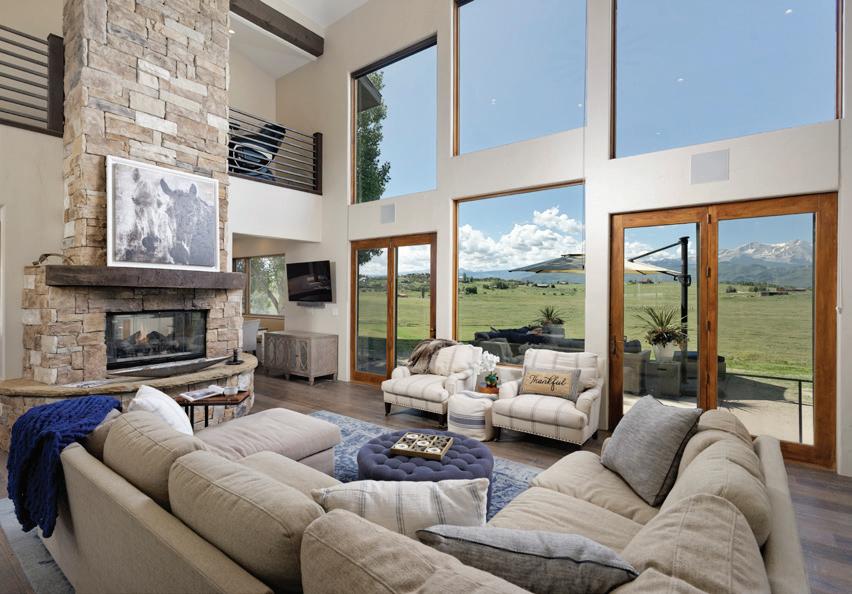
$1,525,000 DELIVERY AUTUMN, 2023
3 BEDS | 2F, 1H BATHS | 1,927 SF 270 OVERLOOK, CARBONDALE
Golf Lover’s Dream Home
$1,500,000 LAKOTA CANYON G.C. 17TH
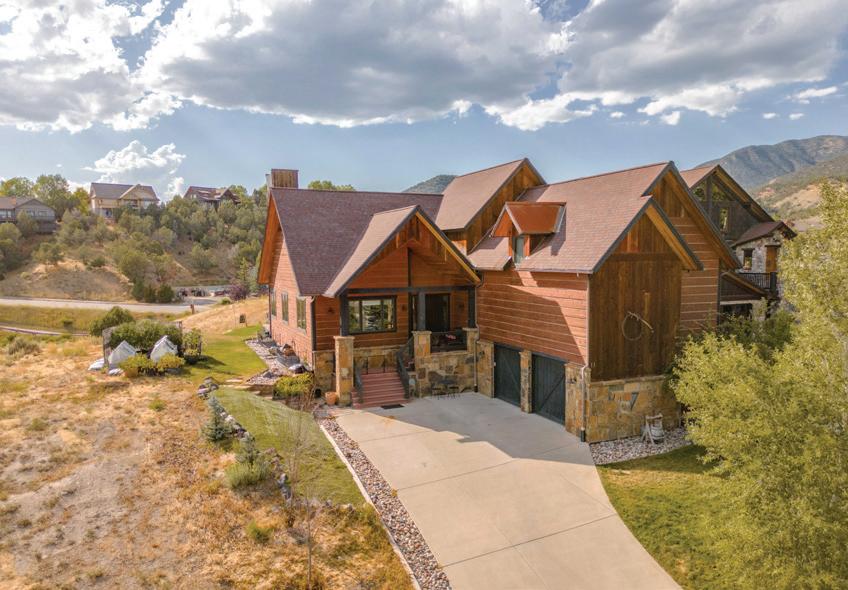
5 BEDS | 4F, 1H BATHS | 4,175 SF + LOT
11 &21 WHITE FEATHER DRIVE, NEW CASTLE
$1,295,000 SKI-IN, SKI-OUT

Sky Residences & Lodge
$825,000 SHARED OWNERSHIP
Sweeping Panoramic Views
$300,000 BUILD YOUR DREAM HOME
10 ACRES WITH STUNNING VIEWS 152 RUSTY SPUR TRAIL, RIFLE
Sky Residences & Lodge


$825,000 SHARED OWNERSHIP
Sweeping Panoramic Views
$500,000 BUILD YOUR DREAM HOME
20 ACRES WITH STUNNING VIEWS

152 RUSTY SPUR TRAIL, RIFLE
Stunning Views
$250,000 BUILD YOUR DREAM HOME
10 ACRES WITH STUNNING VIEWS 152 RUSTY SPUR TRAIL, RIFLE
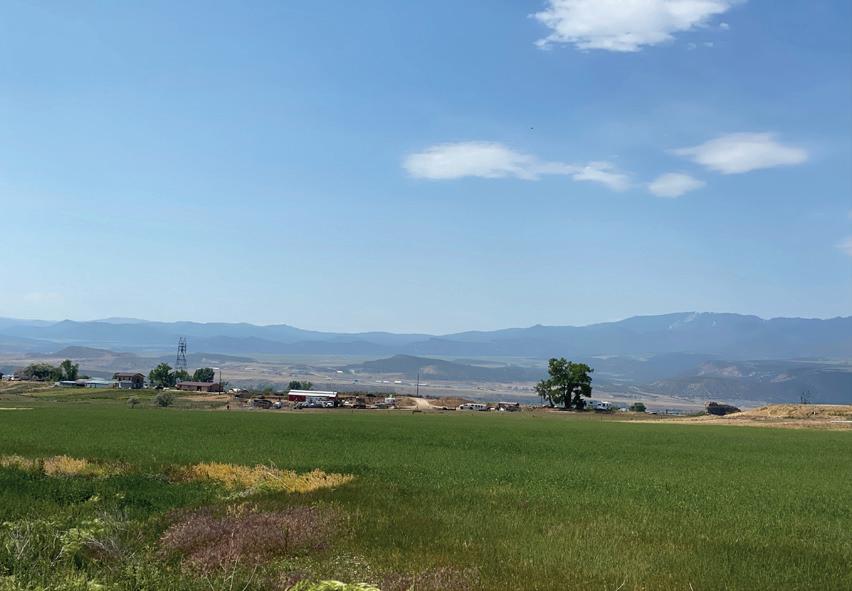


$250,000 BUILD YOUR DREAM HOME
0.41
152 GOLDEN STONE DRIVE, CARBONDALE
ACRES GATED COMMUNITY 3 BEDS | 3F, 1H BATHS | 1,993 SF 550 S SPRING STREET F2-2, ASPEN 3 BEDS | 3F, 1H BATHS | 1,993 SF 550 S SPRING STREET F2-9, ASPEN 1 BED | 1 BATH | 581 SF 130 WOOD ROAD 740, SMV Assay Hill Lodge