Aspen and Snowmass Second Quarter 2023 Market Report

Report Written By: Elliot F. Eisenberg, Ph.D.
Source: Aspen Board of Realtors Multiple Listing Service
ASPEN | SNOW MA SS
Photo: Ellen Winter
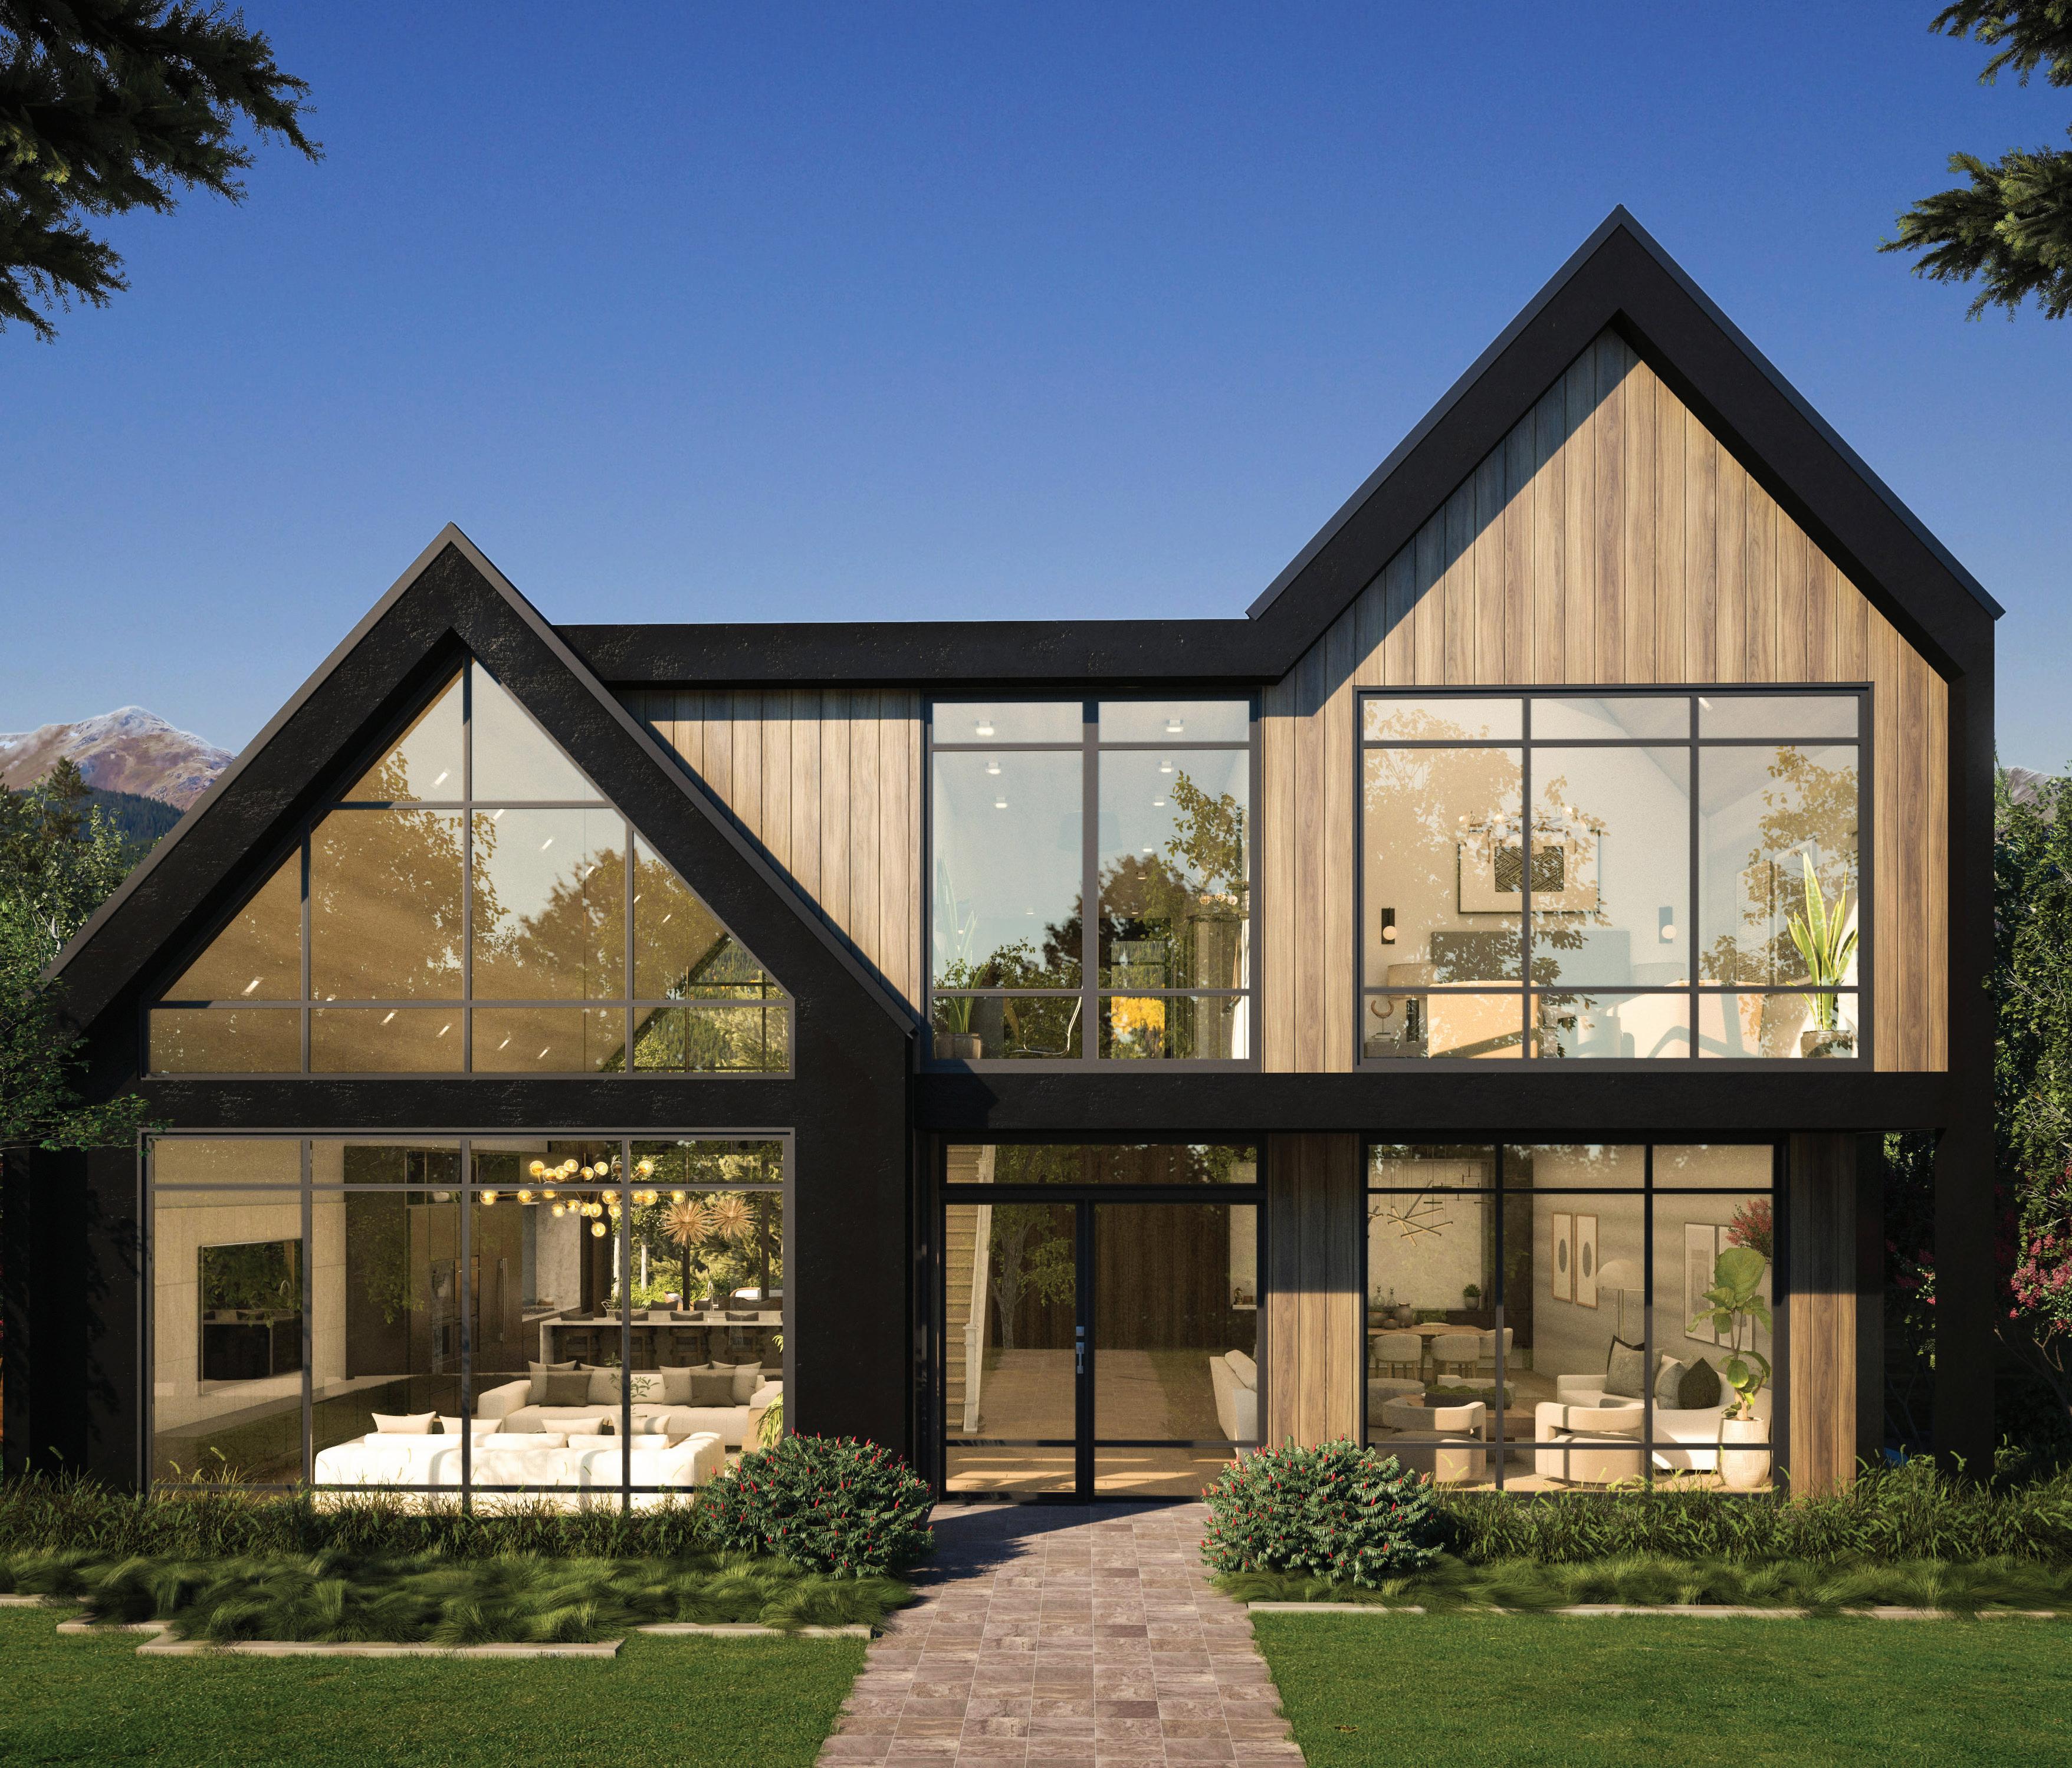
SINGLE FAMILY HOMES Single Family Homes Sold Second Quarter YTD Number Sold Sold Price Range Median Sold Price Median % Off Asking Price Avg. Days On Market Studio - 1 Bedroom 2 - 3 Bedrooms 4 - 5 Bedrooms 6+ Bedrooms 1 10 26 7 $1,300,000 $1,035,000 - $13,125,000 $1,384,717 - $35,000,000 $15,375,000 - $65,000,000 $1,300,000 $4,475,000 $12,172,500 $21,000,000 +9 5 8 4 18 109 188 102 810 Smuggler Street Aspen, Colorado 5 BEDS | 5F, 2H BATHS | 6,019 SF
What’s Selling?
% Sold Price to Original List Price
18% 2022 vs 2023 351 321 295 187 153 Average Days on Market Second Quarter of 2022 2020 2019 2023 2021
Second Quarter of 2022 vs 2023 4% 2022 2020 2019 2023 2021 91% 87% 95% 7% 93%
FAMILY
Average Price Per Square Foot 0 $500 $1,000 $1,500 $2,000 $2,500 $3,000 $3,500 Second Quarter of 2022 2020 2019 2023 2021 $1,434 $1,535 $3,176 $3,153 $2,103 1% 2022 vs 2023
Aspen SINGLE
HOMES
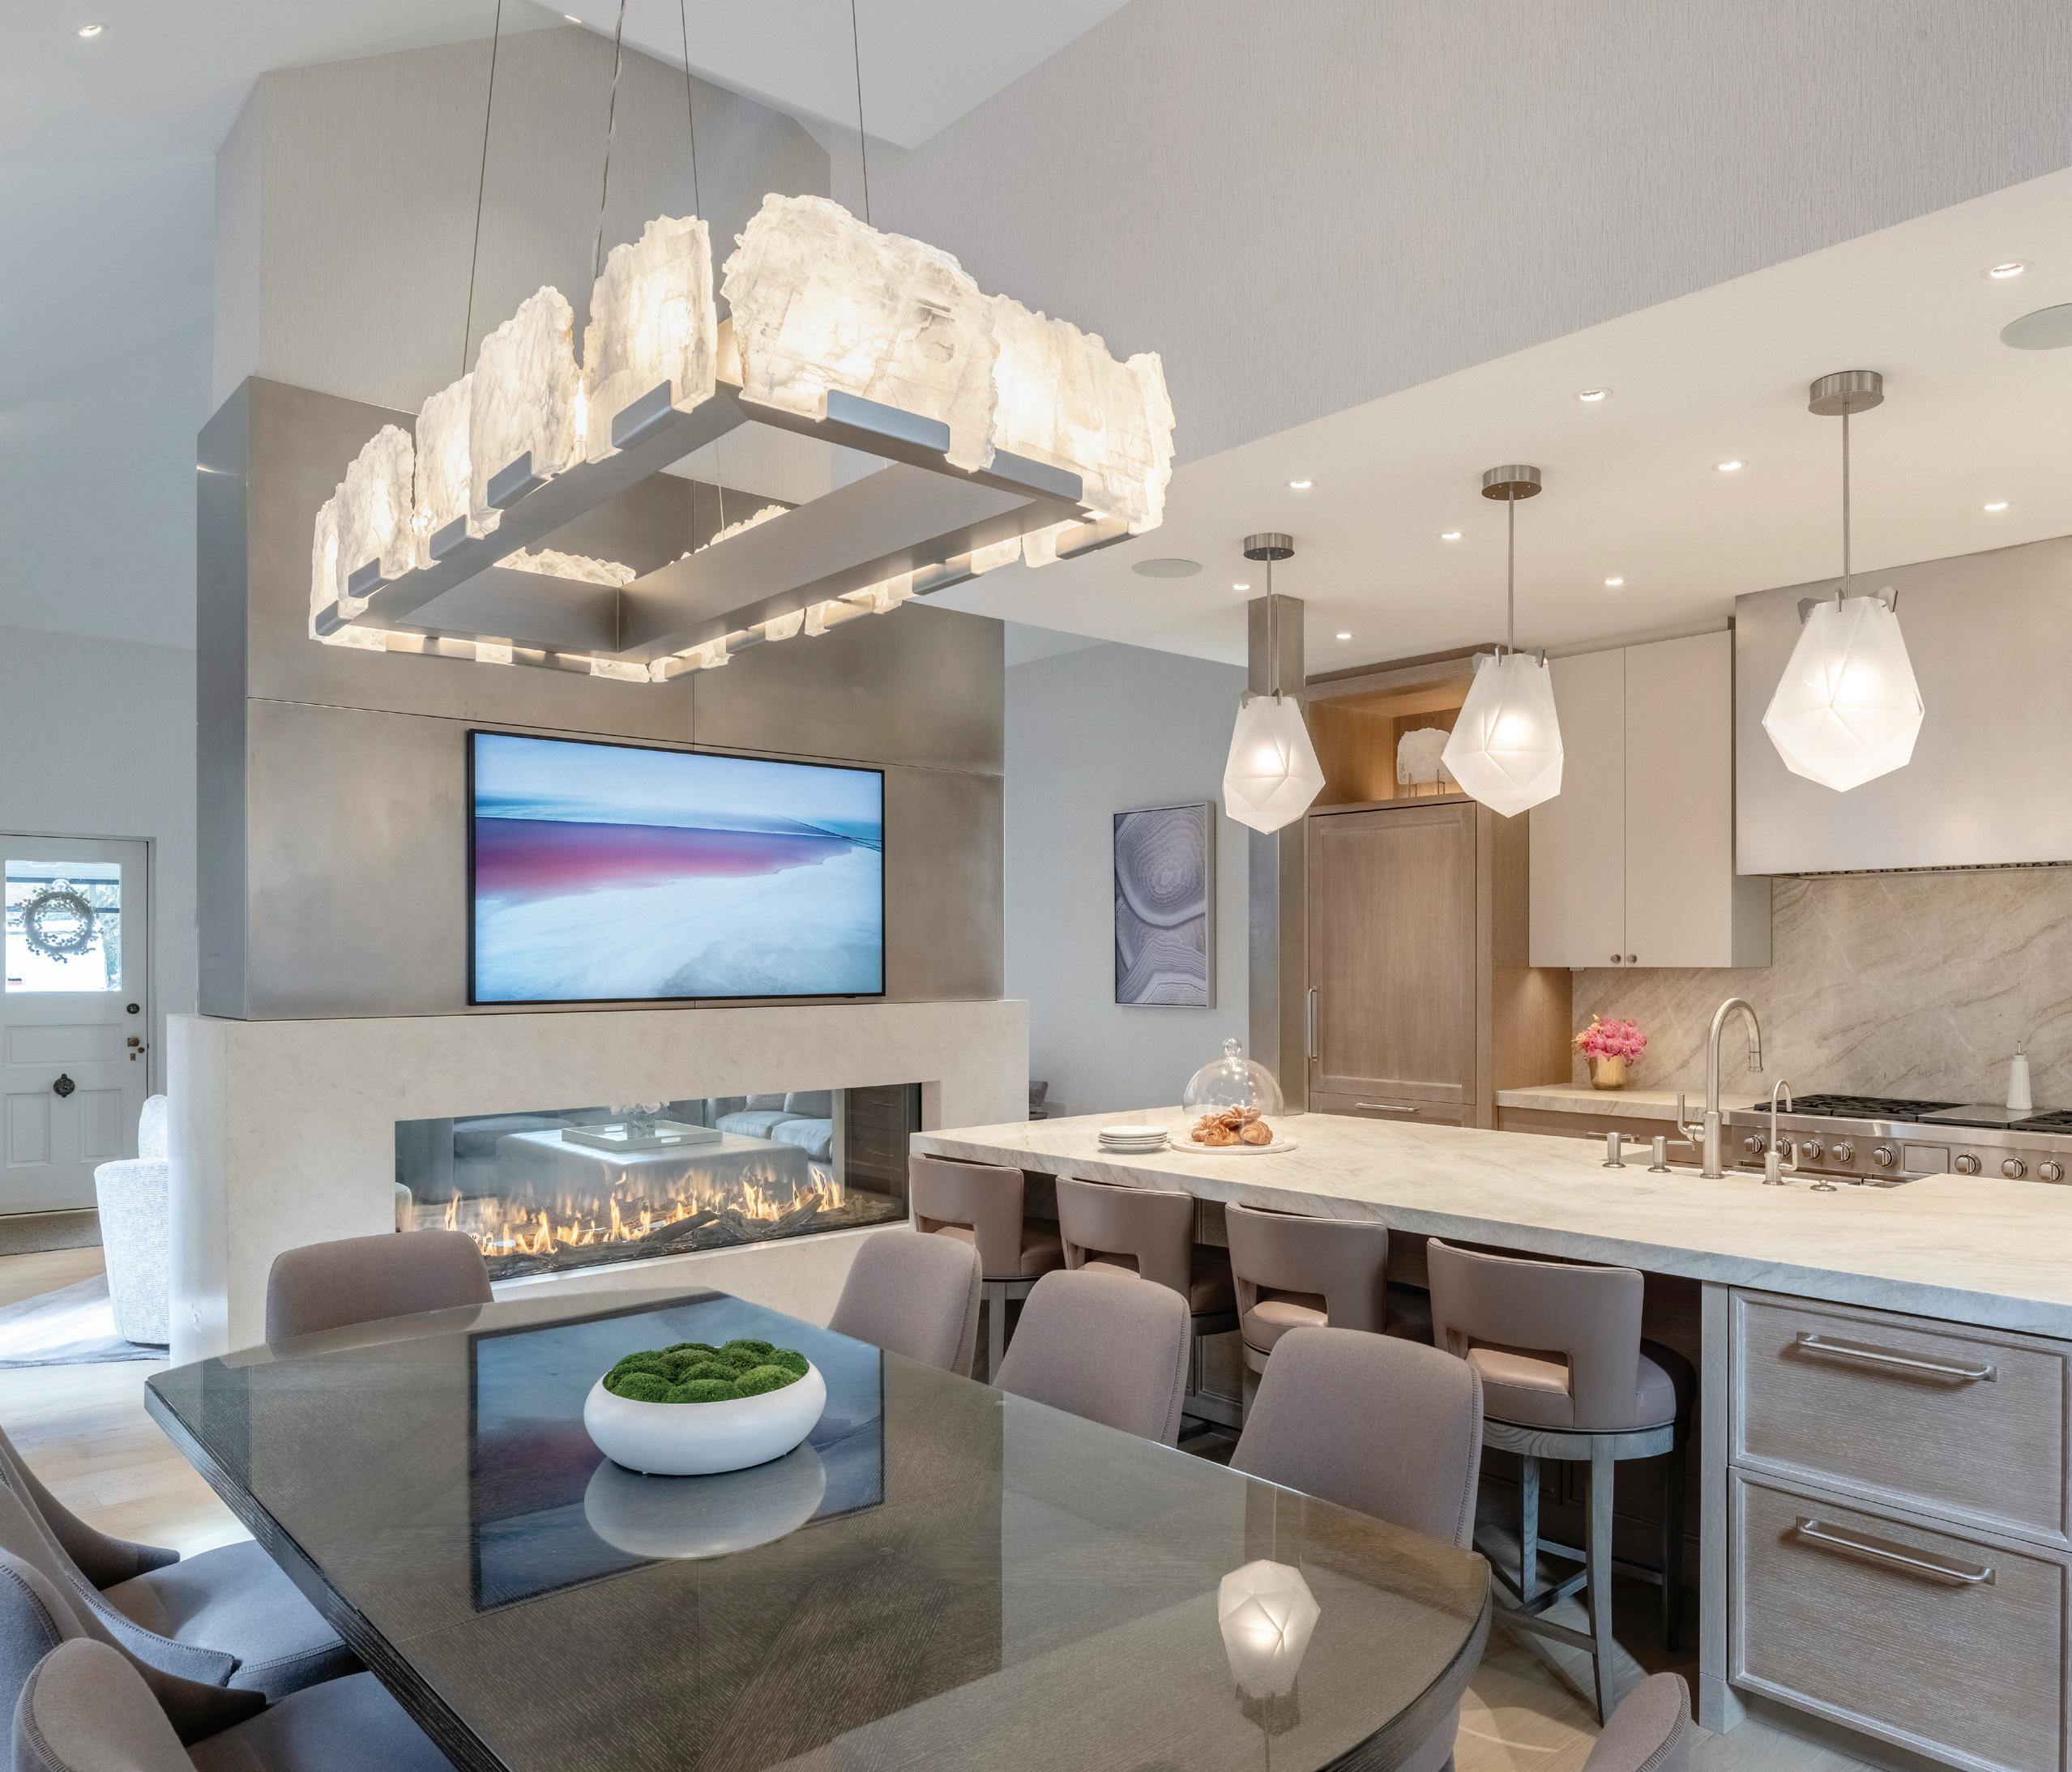
What’s For Sale? SINGLE FAMILY HOMES Single Family Homes Active & Pending Active Pending Active Asking Price Range Median Asking Price Studio - 1 Bedroom 2 - 3 Bedrooms 4 - 5 Bedrooms 6+ Bedrooms13 56 161 1 $$3,700,000 - $45,000,000 $4,250,000 - $67,500,000 $9,900,000 - $49,000,000 $$8,300,000 $18,250,000 $27,500,000 105 E Hallam Street Aspen, Colorado 4 BEDS | 4F, 2H BATHS | 3,829 SF
Aspen CONDO / TOWNHOMES
Townhome and condominium prices in Aspen were relatively unchanged in the first half of 2023 compared to the same period of 2022. The median price declined by just 1% to $2.9 million while the average price was down a slight 2% to just over $4.5 million.
The number of properties sold declined by almost half, with just 37 closed sales so far this year, compared to 66 through June of 2022. Dollar volume declined by nearly half as well, to $168 million although the average price per square foot was almost unchanged at $2,855 per square foot.
Condominium and townhome inventories rose, with 40 units on the market, up from 26 at this point last year.
In the Aspen condo/townhome market, the most expensive unit sold in 23H1 was $22 million, more than the $20 million of 22H1.
Days on market for condominiums and townhomes during the first half of 2023 were 134 days compared to 88 days for 2022. The percentage of sold price to original list price dropped from 98% last year to 94% this year.
Average Sold Price Median Sold Price
2% 2022 vs 2023
1% 2022 vs 2023
45% 2022 vs 2023
Million 0 $50M $100M $150M $200M $250M $300M $350M Total Dollar Volume Second Quarter of 2022 2020 2019 2023 2021 $164M $176M $168M $307M $256M
SOLD SOLD SOLD SOLD SOLD Number of Properties Sold Second Quarter of 2022 2020 2019 2023 2021 74 40 107 66 37
% 2022
2023 $1M $1.5M $2.5M $3.5M $4.5M $2M $3M $4M $5M Million 2022 2020 2019 2023 2021
44
vs
Second Quarter of
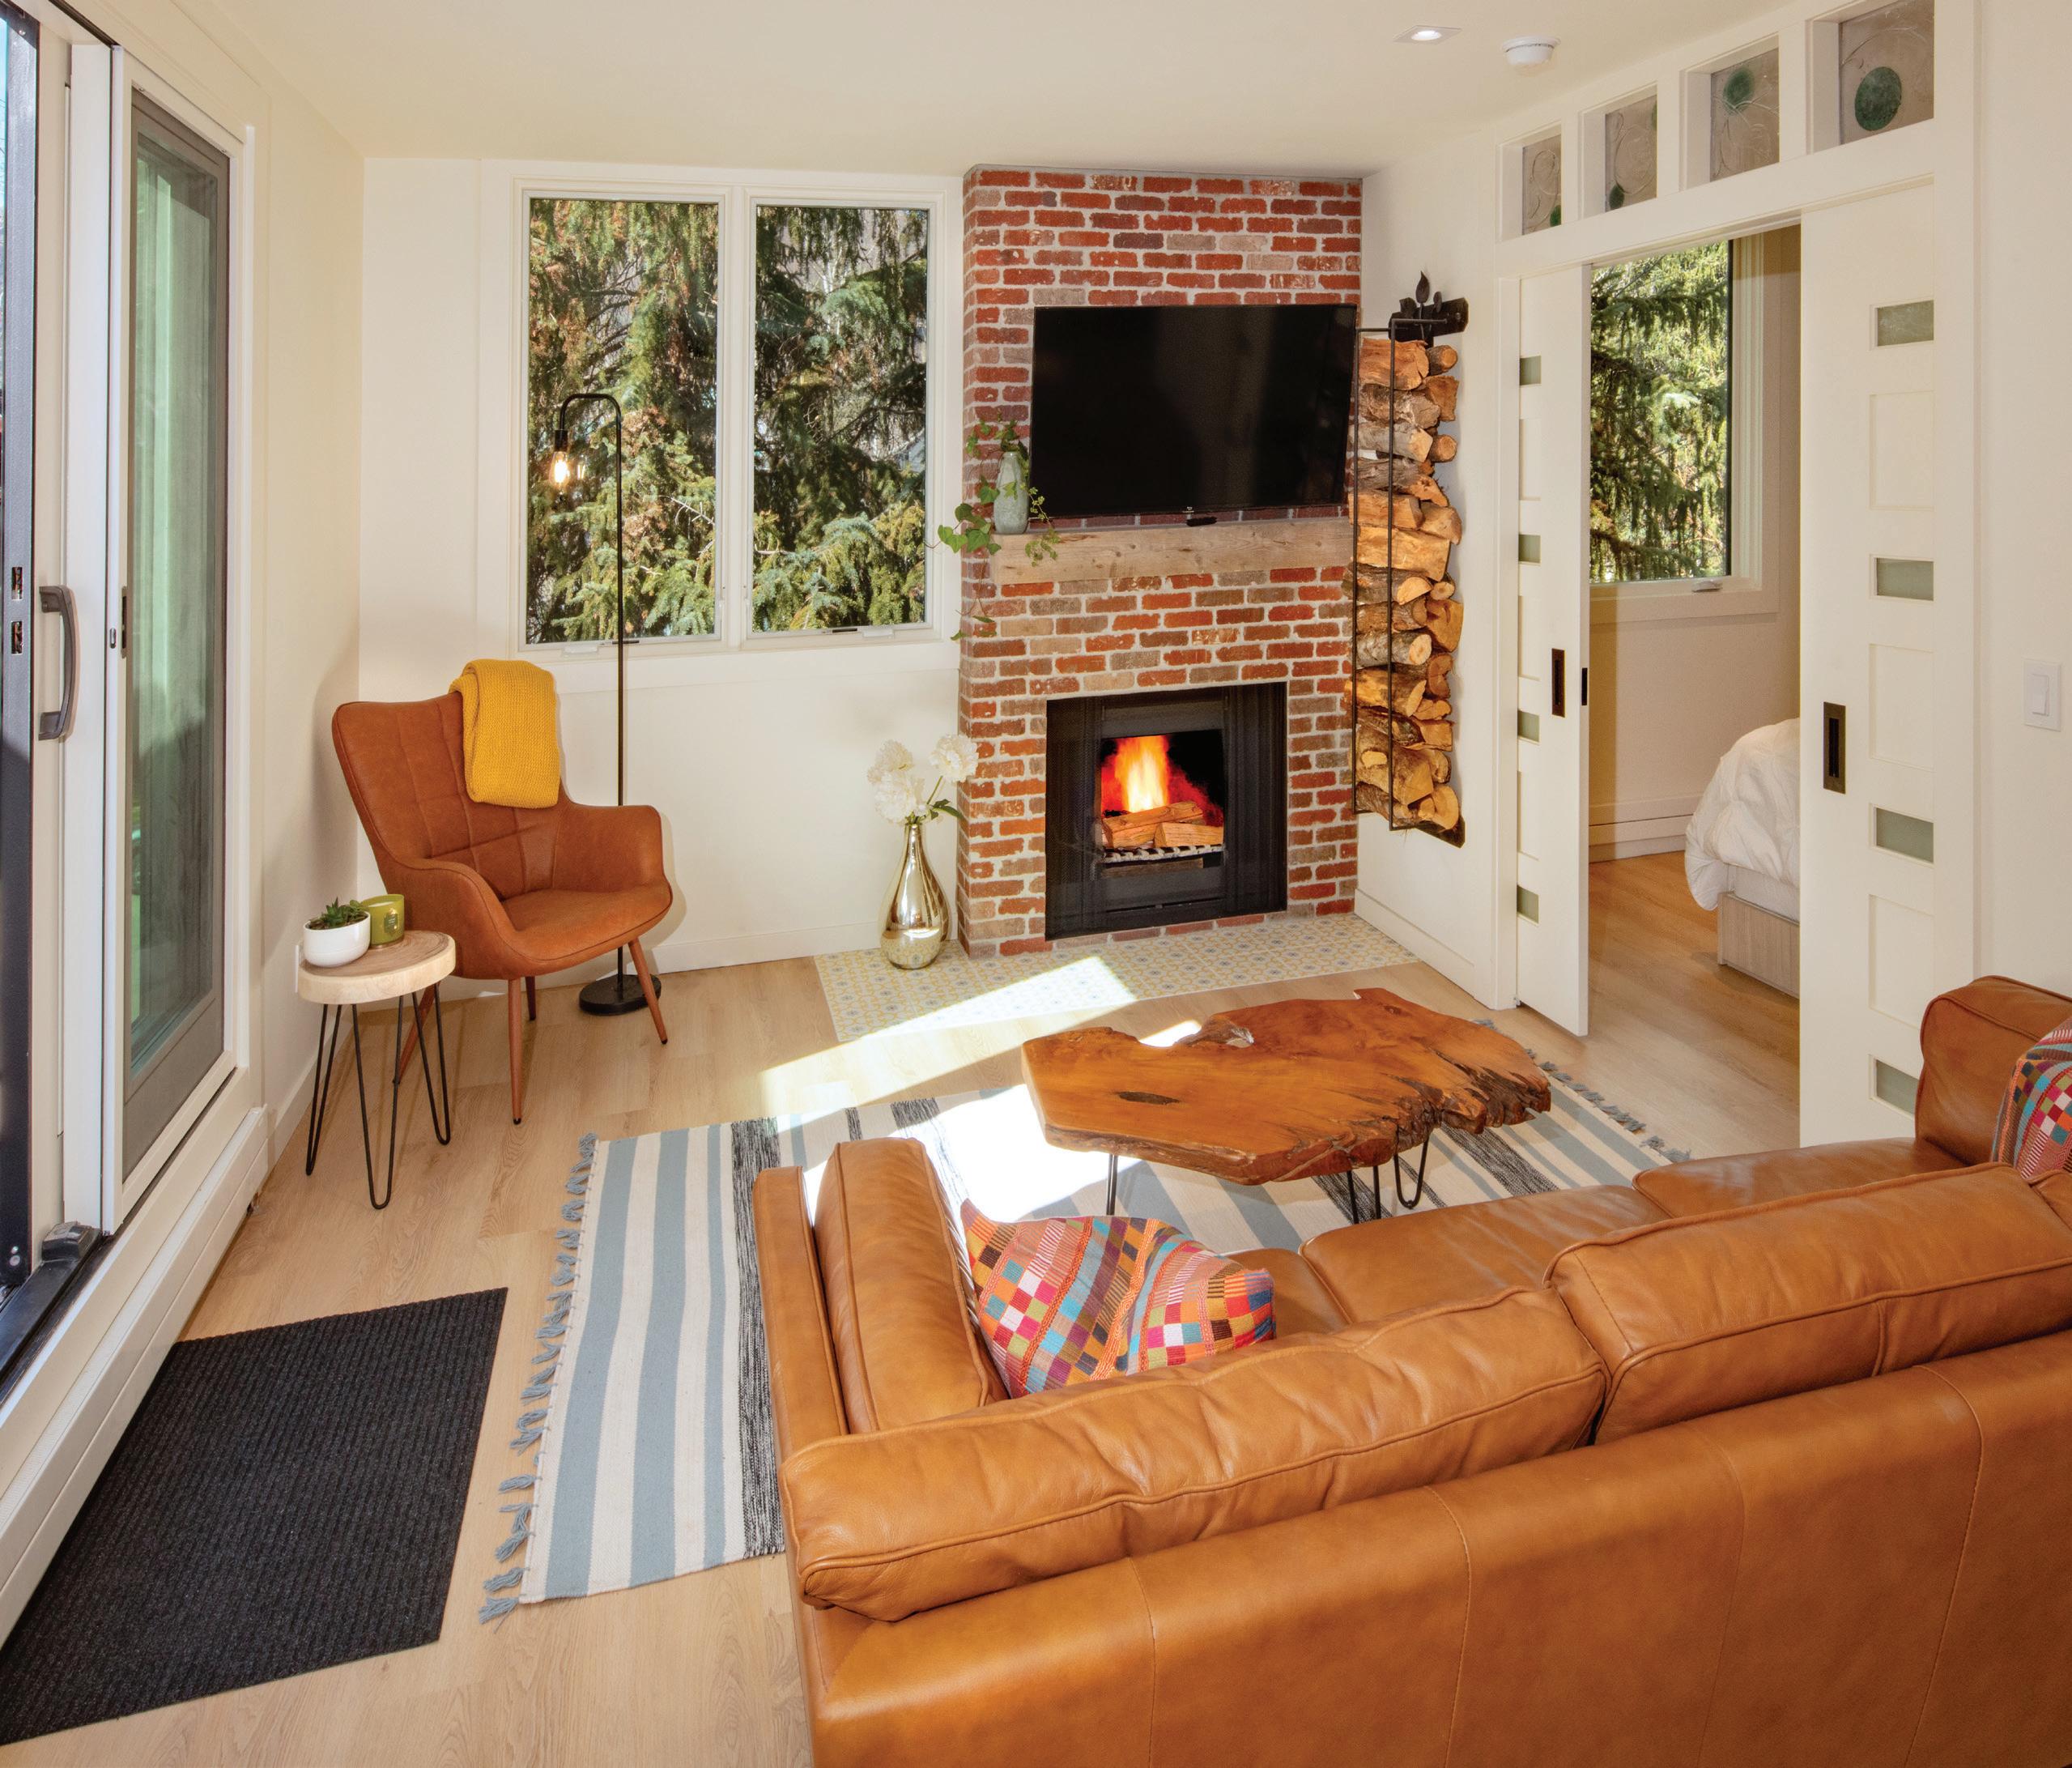
CONDOS AND TOWNHOMES Condo / Townhomes Sold Second Quarter YTD Number Sold Sold Price Range Median Sold Price Median % Off Asking Price Avg. Days On Market Studio - 1 Bedroom 2 - 3 Bedrooms 4 - 5 Bedrooms 6+ Bedrooms 8 24 5$830,000 - $1,425,000 $1,100,000 - $15,470,000 $4,900,000 - $22,000,000 $$1,060,000 $3,462,500 $6,900,000 $2 6 766 141 213819 E Hyman Avenue #7 Aspen, Colorado 1 BED | 1 BATH | 555 SF
What’s Selling?
CONDOS / TOWNHOMES
% Sold Price to Original List Price
211 353 173 88 134 Average Days on Market Second Quarter of 2022 2020 2019 2023 2021
52% 2022 vs 2023
Second Quarter of 2022 2020 2019 2023 2021 95% 93% 96% 98% 94%
Aspen
Average Price Per Square Foot 0 $500 $1,000 $1,500 $2,000 $2,500 $3,000 Second Quarter of 2022 2020 2019 2023 2021 $1,565 $1,977 $2,817 $2,855 $1,800
4% 2022 vs 2023
1% 2022 vs 2023
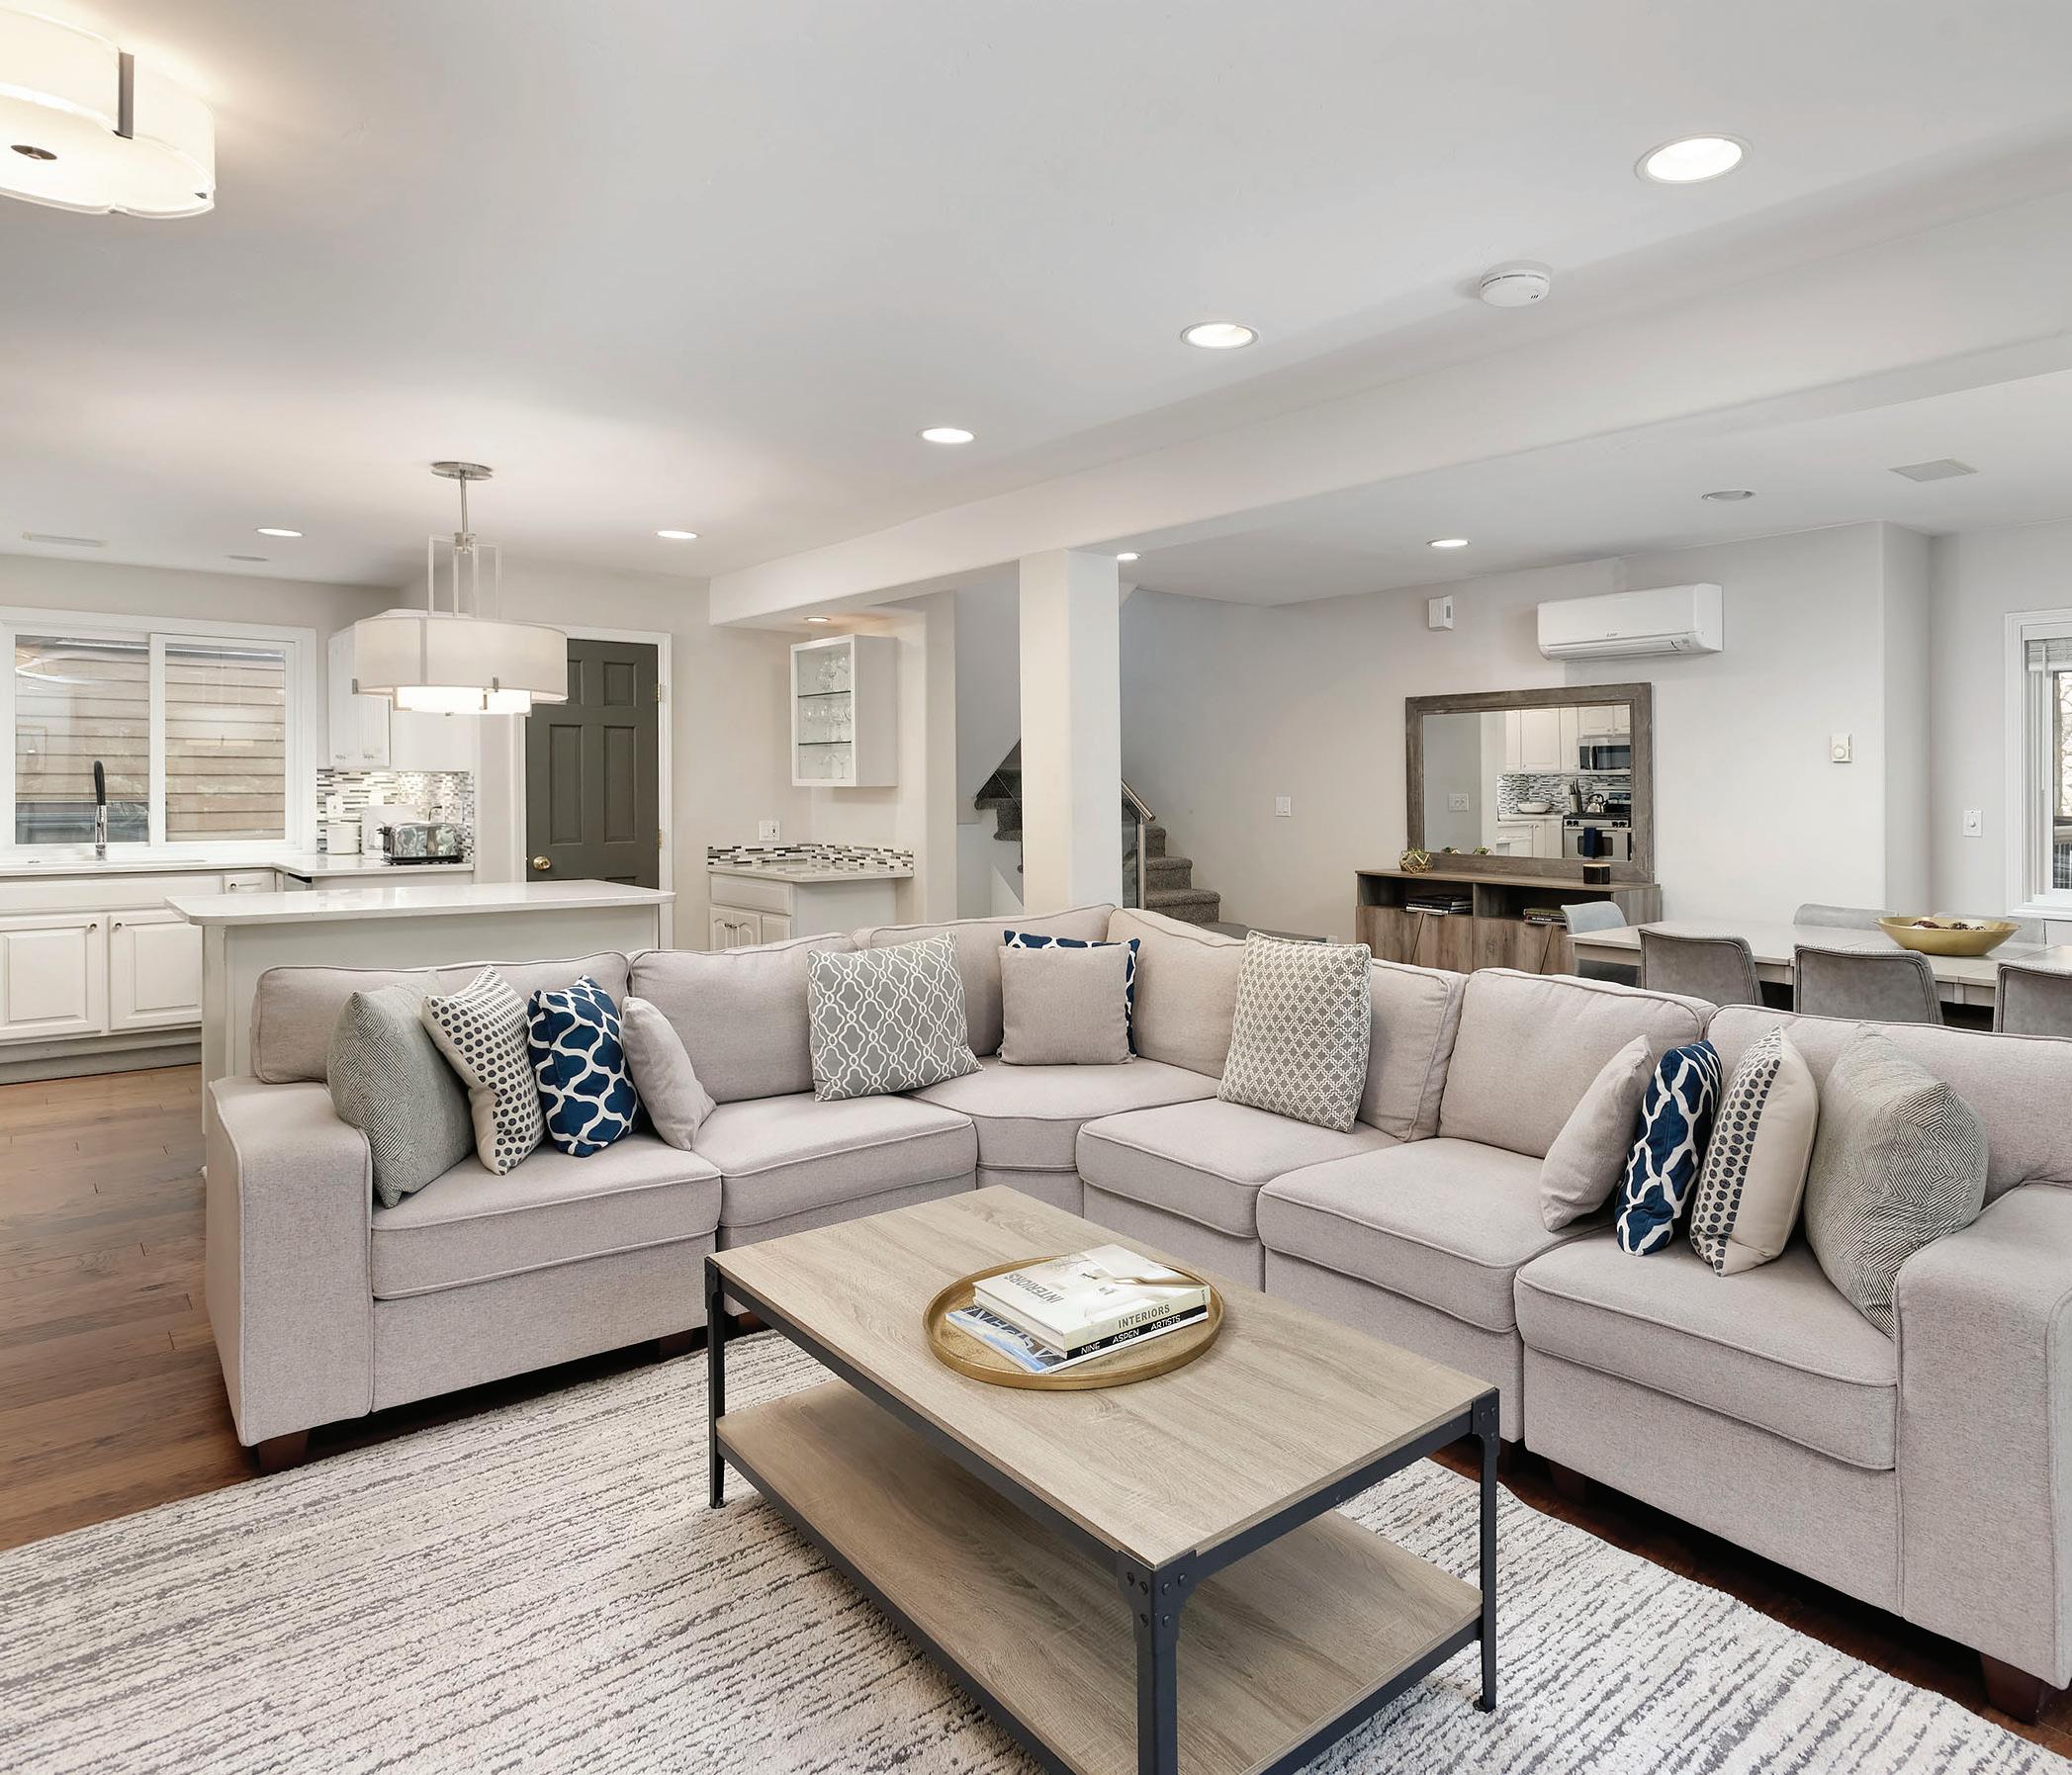
CONDOS AND TOWNHOMES Condominiums / Townhomes Active & Pending Active Pending Asking Price Range Median Asking Price Studio - 1 Bedroom 2 - 3 Bedrooms 4 - 5 Bedrooms 6+ Bedrooms 13 37 182 5 3$995,000 - $3,500,000 $1,250,000 - $9,995,000 $4,950,000 - $47,750,000 $$1,825,000 $3,500,000 $11,437,500 $650 S Monarch Street Unit 2 Aspen, Colorado 4 BEDS | 3F, 1H BATHS | 1,929 SF
What’s For Sale?
Snowmass Village
SINGLE FAMILY HOMES
In Snowmass Village, the median sale price of a single-family home sold during the first half of 2023 declined 11% to $5.4 million although the average price increased by 4% to about $7.4 million. The average price per square foot increased 7% to $1,691.
Closed sales during the first half of 2023 declined from 27 last year to just 12 homes so far this year and overall dollar volume was down more than 50% to about $88.3 million.
There were 24 single-family homes for sale in
Snowmass Village at the end of June, compared to 17 at the end of last June.
The most expensive single-family home sold during the first half of 2023 in Snowmass Village was $17.8 million, while the highest price during the first half of 2022 was $18.3 million.
The number of days on market for single-family homes in Snowmass Village declined from 189 days last year to 149 days this year, while the percentage of sold price to original list price declined from 96% last year to 92% this year.
Average Sold Price Median Sold Price
4% 2022 vs 2023
11% 2022 vs 2023
54% 2022 vs 2023
Million 0 $50M $100M $150M $200M Total Dollar Volume Second Quarter of 2022 2020 2019 2023 2021 $84M $22M $88M $192M $186M
SOLD SOLD SOLD SOLD SOLD Number of Properties Sold Second Quarter of 2022 2020 2019 2023 2021 20 7 34 27 12
$2M $3M $4M $5M $6M $7M $8M Million 2022 2020 2019 2023 2021
56% 2022 vs 2023
Second Quarter of

SINGLE FAMILY HOMES Single Family Homes Sold Second Quarter YTD Number Sold Sold Price Range Median Sold Price Median % Off Asking Price Avg. Days On Market Studio - 1 Bedroom 2 - 3 Bedrooms 4 - 5 Bedrooms 6+ Bedrooms2 9 1 $$2,850,000 - $4,550,000 $2,290,000 - $17,812,500 $10,500,000 $$3,700,000 $5,800,000 $10,500,00010 6 16122 159 116 1457 Wood Road Snowmass Village, Colorado 6 BEDS | 6 BATHS | 5,023 SF
What’s Selling?
Snowmass Village
SINGLE
% Sold Price to Original List Price
21% 2022 vs 2023 4% 2022 vs 2023 323 167 241 189 149 Average Days on Market Second Quarter of 2022 2020 2019 2023 2021
Second Quarter of 2022 2020 2019 2023 2021 93% 93% 96% 96% 92%
FAMILY
Average Price Per Square Foot 0 $500 $1,000 $1,500 $2,000 Second Quarter of 2022 2020 2019 2023 2021 $930 $824 $1,691 $1,587 $1,241 7% 2022 vs 2023
HOMES

SINGLE FAMILY
Single Family Homes Active & Pending Active Pending Asking Price Range Median Asking Price Studio - 1 Bedroom 2 - 3 Bedrooms 4 - 5 Bedrooms 6+ Bedrooms5 21 45 2 4 $$3,900,000 - $6,295,000 $3,495,000 - $18,000,000 $11,995,000 - $60,000,000 $$4,195,000 $7,450,000 $15,700,000 350 Lohrs Court Snowmass Village, Colorado 3 BEDS | 2F, 1H BATHS | 2,472 SF
What’s For Sale?
HOMES
Snowmass Village CONDOS / TOWNHOMES
This data includes 61 sales from the new developments - Electric Pass Lodge or Havens
Condominium and townhome median prices in Snowmass Village saw significant gains compared to last year, with a median price of almost $1.8 million, up 18% from last year. The average price rose 12% to almost $2.3 million, and the average price per square foot rose 8% from $1,495 to $1,620.
Closed sales during the first half of 2023 compared to last year increased from 62 to 98, and overall sales volume rose 78% to $223 million.
At the end of the quarter there were 45 townhome or condominium units on the market in Snowmass Village, compared to 29 last year.
In the Snowmass Village condo/townhome market, the most expensive property sold in the first half of 2023 sold for nearly $8.8 million, compared to the highest sale price in 22H1 of $6.6 million.
The percentage of sold to original list price declined just slightly compared to last year from 99% to 98%, while the days on market meaningfully rose.
Average Sold Price
18% 2022 vs 2023
Median Sold Price
12% 2022 vs 2023
78% 2022 vs 2023
Million 0 $50M $100M $150M $200M $250M Total Dollar Volume Second Quarter of 2022 2020 2019 2023 2021 $69M $65M $167M $223M $126M
SOLD SOLD SOLD SOLD SOLD Number of Properties Sold Second Quarter of 2022 2020 2019 2023 2021 65 51 130 62 98 58% 2022 vs 2023 $500K $750K $1M $1.25M $1.5M $1.75M $2M $2.25M $2.5M Thousands/Million 2022 2020 2019 2023 2021
Second Quarter of

CONDOS AND TOWNHOMES Condo / Townhomes Sold Second Quarter YTD Number Sold Sold Price Range Median Sold Price Median % Off Asking Price Avg. Days On Market Studio - 1 Bedroom 2 - 3 Bedrooms 4 - 5 Bedrooms 13 82 3 $450,000 - $1,300,000 $895,000 - $7,100,000 $7,210,623 - $8,789,377 $800,000 $1,850,000 $7,500,000 3 0 0 114 604 736 Assay Hill Lodge - 130 Wood Road #733 Snowmass Village, Colorado 2 BEDS | 2 BATHS | 1,630 SF | SLEEPS 4
What’s Selling?
Snowmass Village
CONDOS / TOWNHOMES
% Sold Price to Original List Price
490% 2022 vs 2023 1% 2022 vs 2023 235 319 172 92 543 Average Days on Market Second Quarter of 2022 2020 2019 2023 2021
Second Quarter of 2022 2020 2019 2023 2021 96% 93% 97% 99% 98%
Average Price Per Square Foot 0 $500 $1,000 $1,500 $2,000 Second Quarter of 2022 2020 2019 2023 2021 $802 $830 $1,620 $1,495 $894 8% 2022 vs 2023
What’s For Sale?
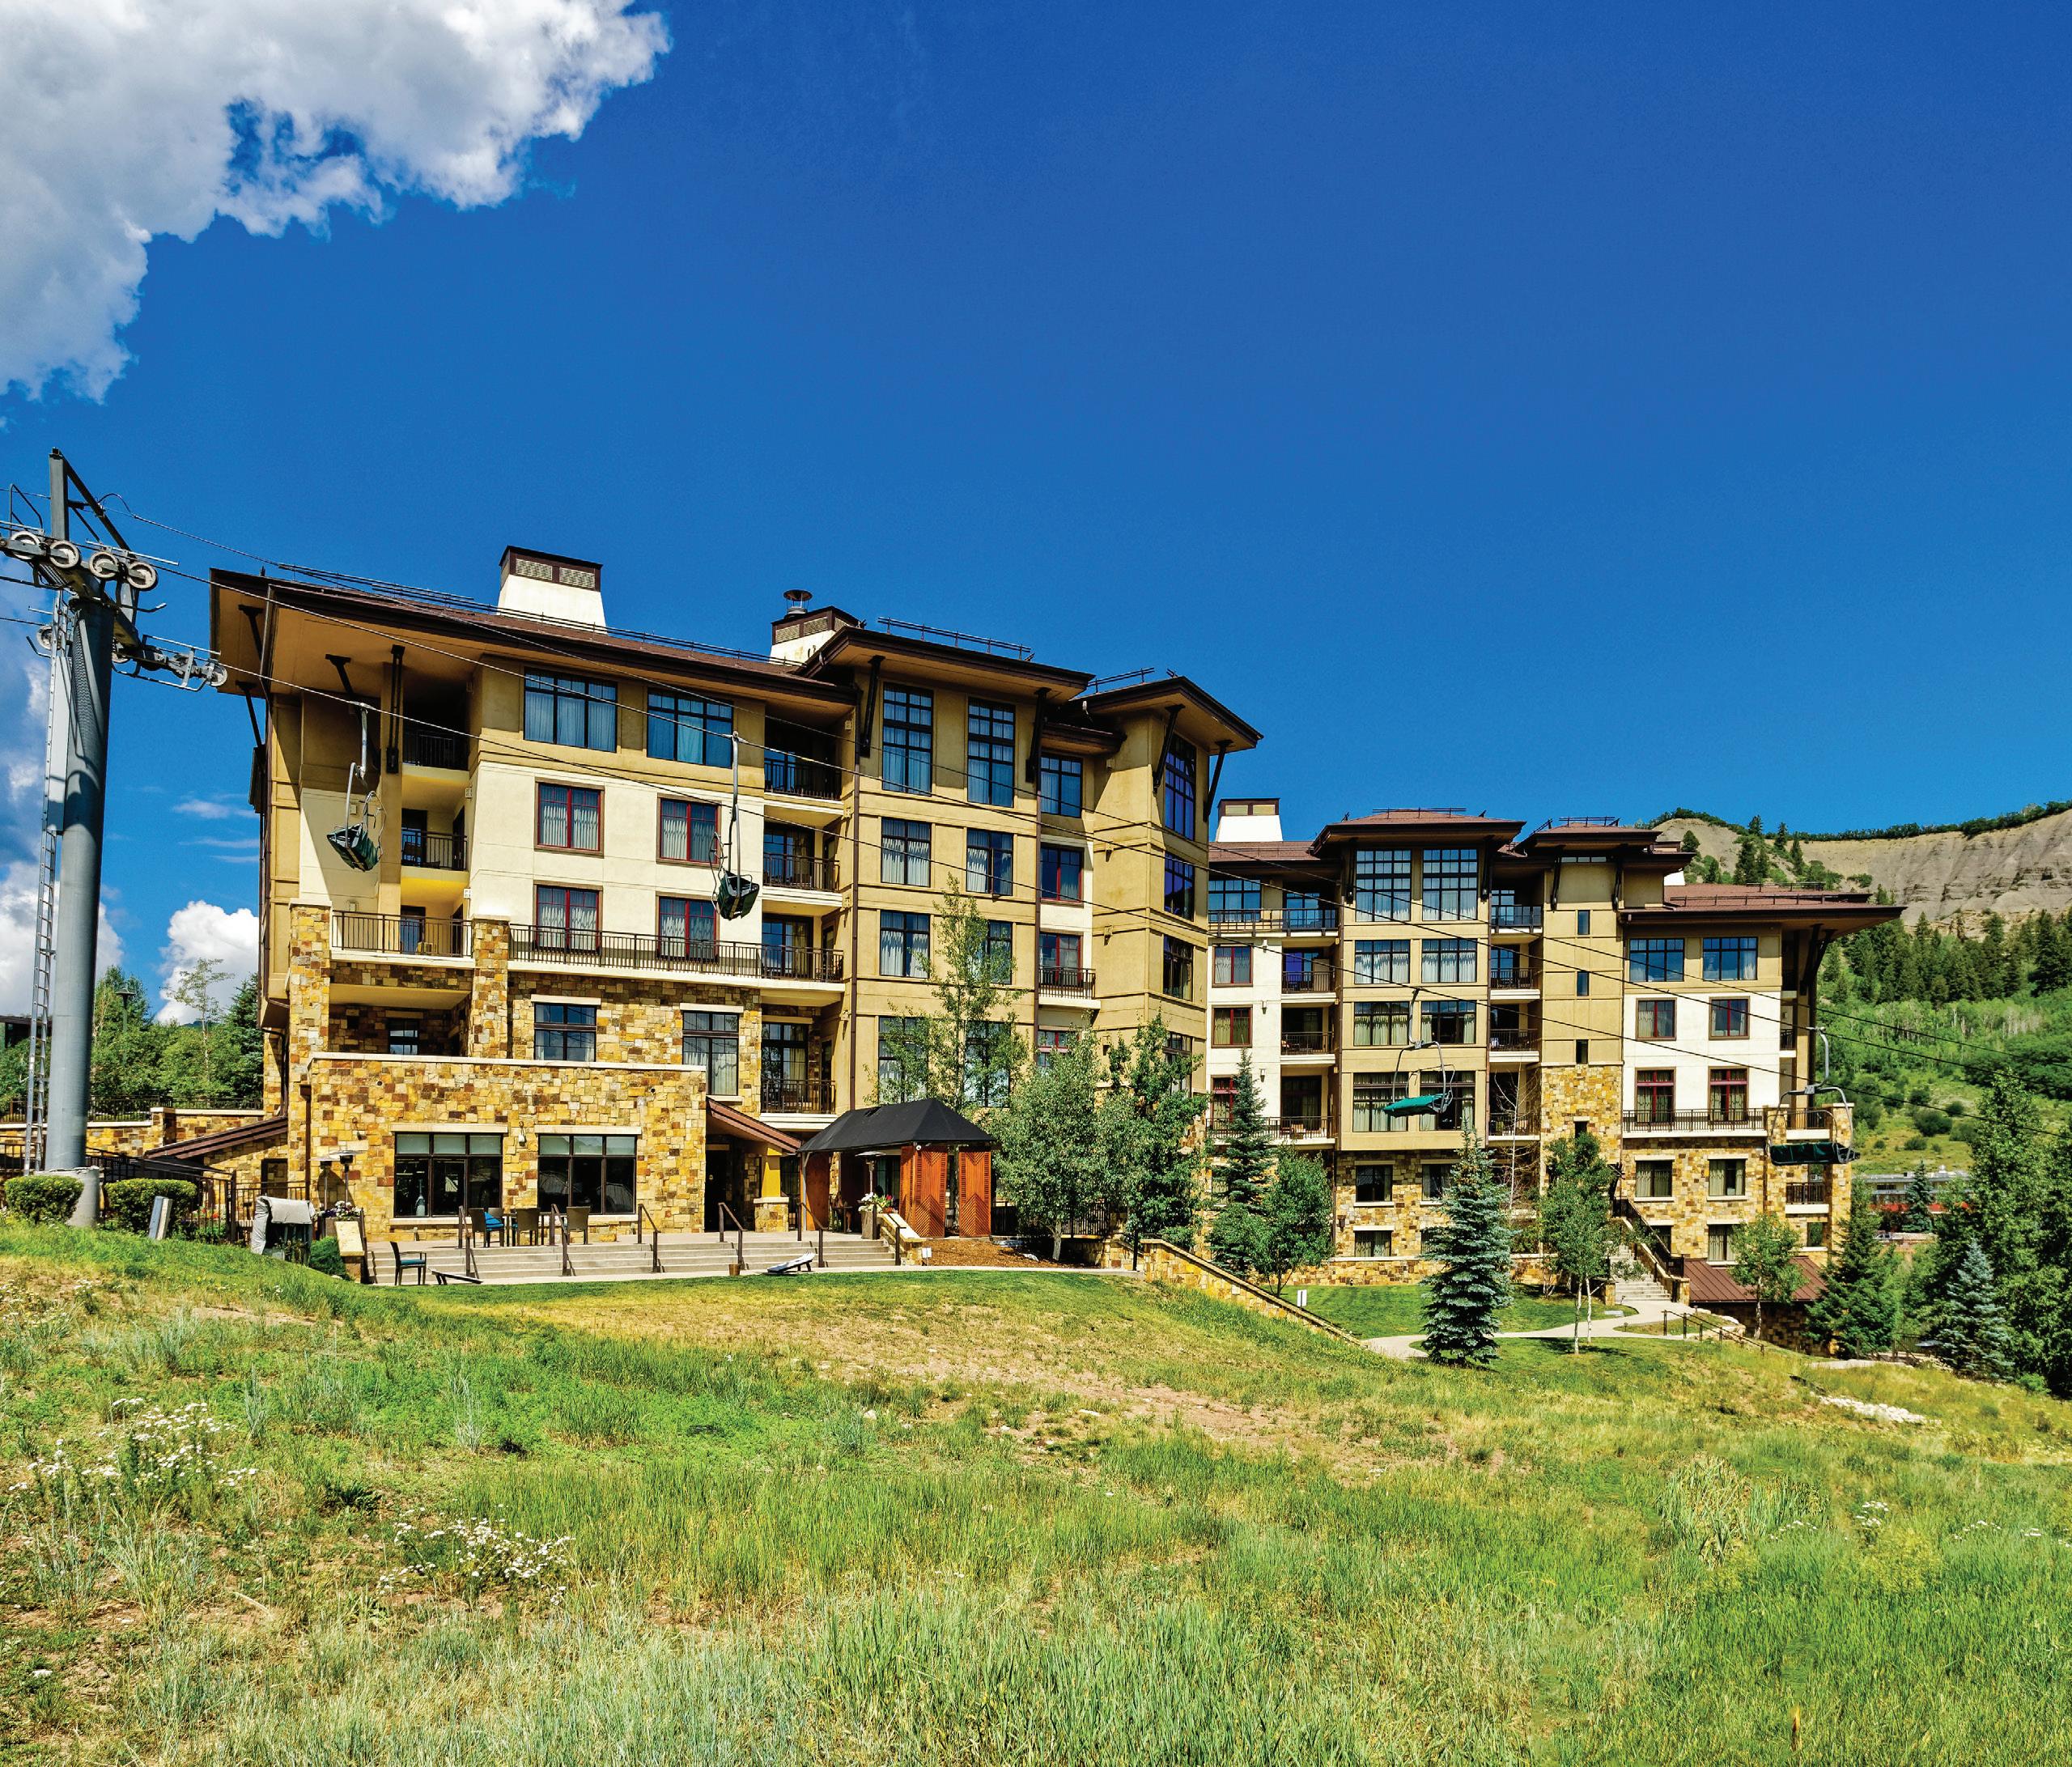
CONDOS AND TOWNHOMES Condominiums / Townhomes Active & Pending Active Pending Asking Price Range Median Asking Price Studio - 1 Bedroom 2 - 3 Bedrooms 4 - 5 Bedrooms 12 33 13 0 44 4 $799,000 - $1,700,000 $999,999 - $9,900,000 $4,700,000 - $11,750,000 $1,025,000 $2,950,000 $9,275,000 130 Wood Road #740 Snowmass Village, Colorado 1 BED | 1 BATH | 581 SF
Old Snowmass
SINGLE FAMILY HOMES
Million 0 $20M $40M $60M $80M $100M Total Dollar Volume Second Quarter of 2022 2020 2019 2023 2021 $7M $35M $82M $36M $22M 56% 2022 vs 2023 29% 2022 vs 2023 80% 2022 vs 2023 Average Sold Price Median Sold Price SOLD SOLD SOLD SOLD SOLD Number of Properties Sold Second Quarter of 2022 2020 2019 2023 2021 5 10 9 13 8 38% 2022 vs 2023 0 $1M $500K $1.5M $2.5M $3.5M $4.5M $5.5M $6.5M $7.5M $2M $3M $4M $5M $6M $7M $8M Million 2022 2020 2019 2023 2021
Second Quarter of
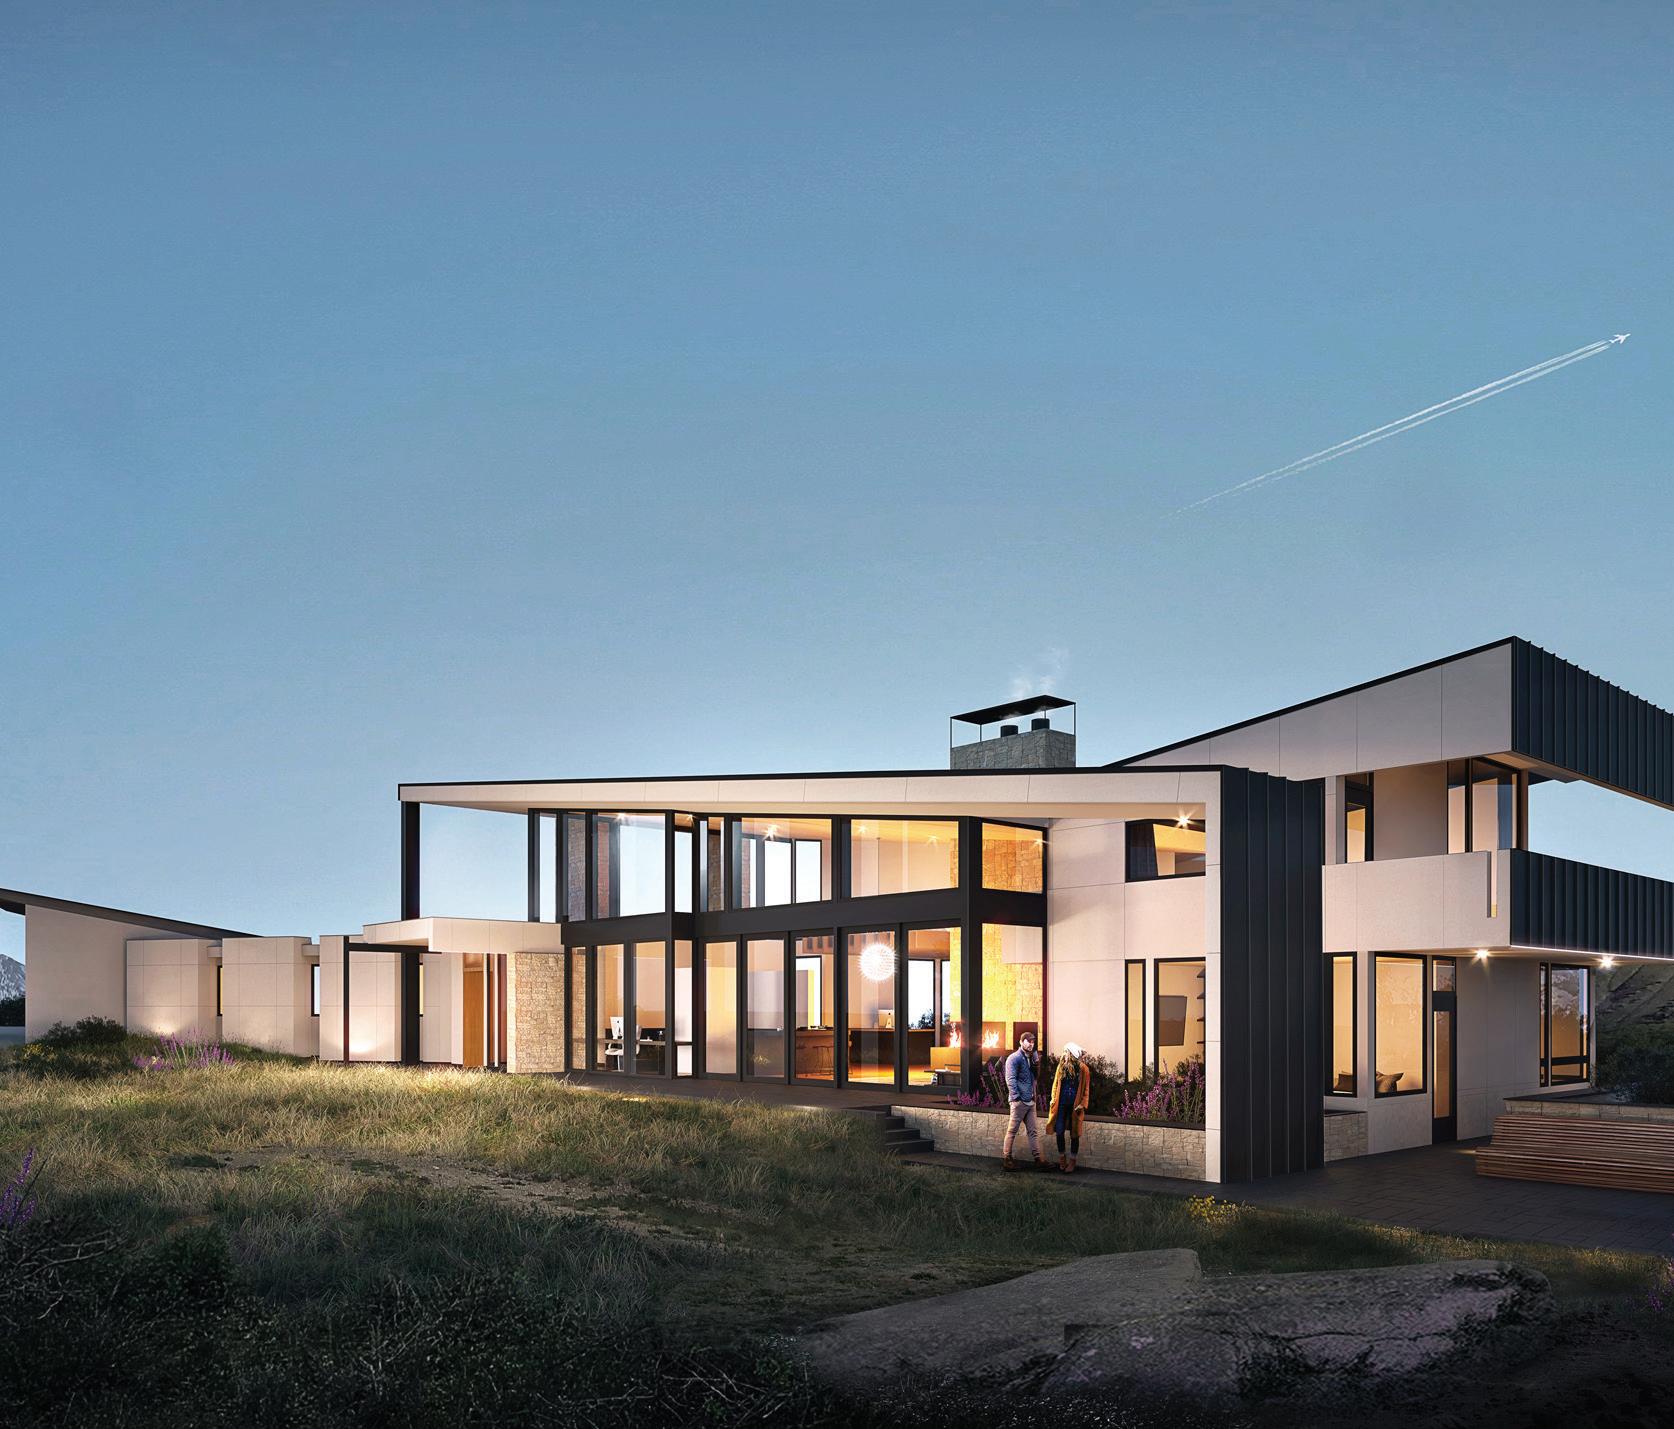
Studio - 1 Bedroom 2 - 3 Bedrooms 4 - 5 Bedrooms 6+ Bedrooms 1 3 3$5,100,000 $1,800,000 - $5,074,070 $2,850,000 - $5,350,000 $$5,100,000 $3,750,000 $3,600,000 $3 10 280 189 73340 Monastery Cutoff Road Old Snowmass, Colorado What’s Selling? SINGLE FAMILY HOMES Single Family Homes Sold Second Quarter YTD Number Sold Sold Price Range Median Sold Price Median % Off Asking Price Avg. Days On Market 4 BEDS | 3F, 2H BATHS | 5,740 SF
Old Snowmass
% Sold Price to Original List Price
52% 2022 vs 2023 216 610 115 236 113 Average Days on Market Second Quarter of 2022 2020 2019 2023 2021
Second Quarter of 2022 vs 2023 4% 2022 2020 2019 2023 2021 90% 90% 97% 94% 90%
Average Price Per Square Foot 0 $500 $1,000 $1,500 $2,000 Second Quarter of 2022 2020 2019 2023 2021 $395 $600 $1,541 $1,134 $615 36% 2022 vs 2023
SINGLE FAMILY HOMES
What’s For Sale? SINGLE FAMILY HOMES

Old Snowmass, Colorado
Single Family Homes Active & Pending Active Pending Active Asking Price Range Median Asking Price 2 - 3 Bedrooms 4 - 5 Bedrooms 6+ Bedrooms 2 51 0$3,400,000 - $5,495,000 $3,425,000 - $8,350,000 $$4,447,500 $5,350,000 $-
Woody Creek
SINGLE FAMILY HOMES
Million 0 $10M $20M $30M $40M $50M $60M Total Dollar Volume Second Quarter of 2022 2020 2019 2023 2021 $8M $2M $54M $10M $585K
2022 vs 2023 471% 2022 vs 2023 29% 2022 vs 2023 Average Sold Price Median Sold Price SOLD SOLD SOLD SOLD SOLD Number of Properties Sold Second Quarter of 2022 2020 2019 2023 2021 7 1 5 1 3 200% 2022 vs 2023 0 $3M $1.5M $4.5M $7.5M $8.5M $13.5M $6M $9M $12M $15M Million 2022 2020 2019 2023 2021
1,612%
Second Quarter of
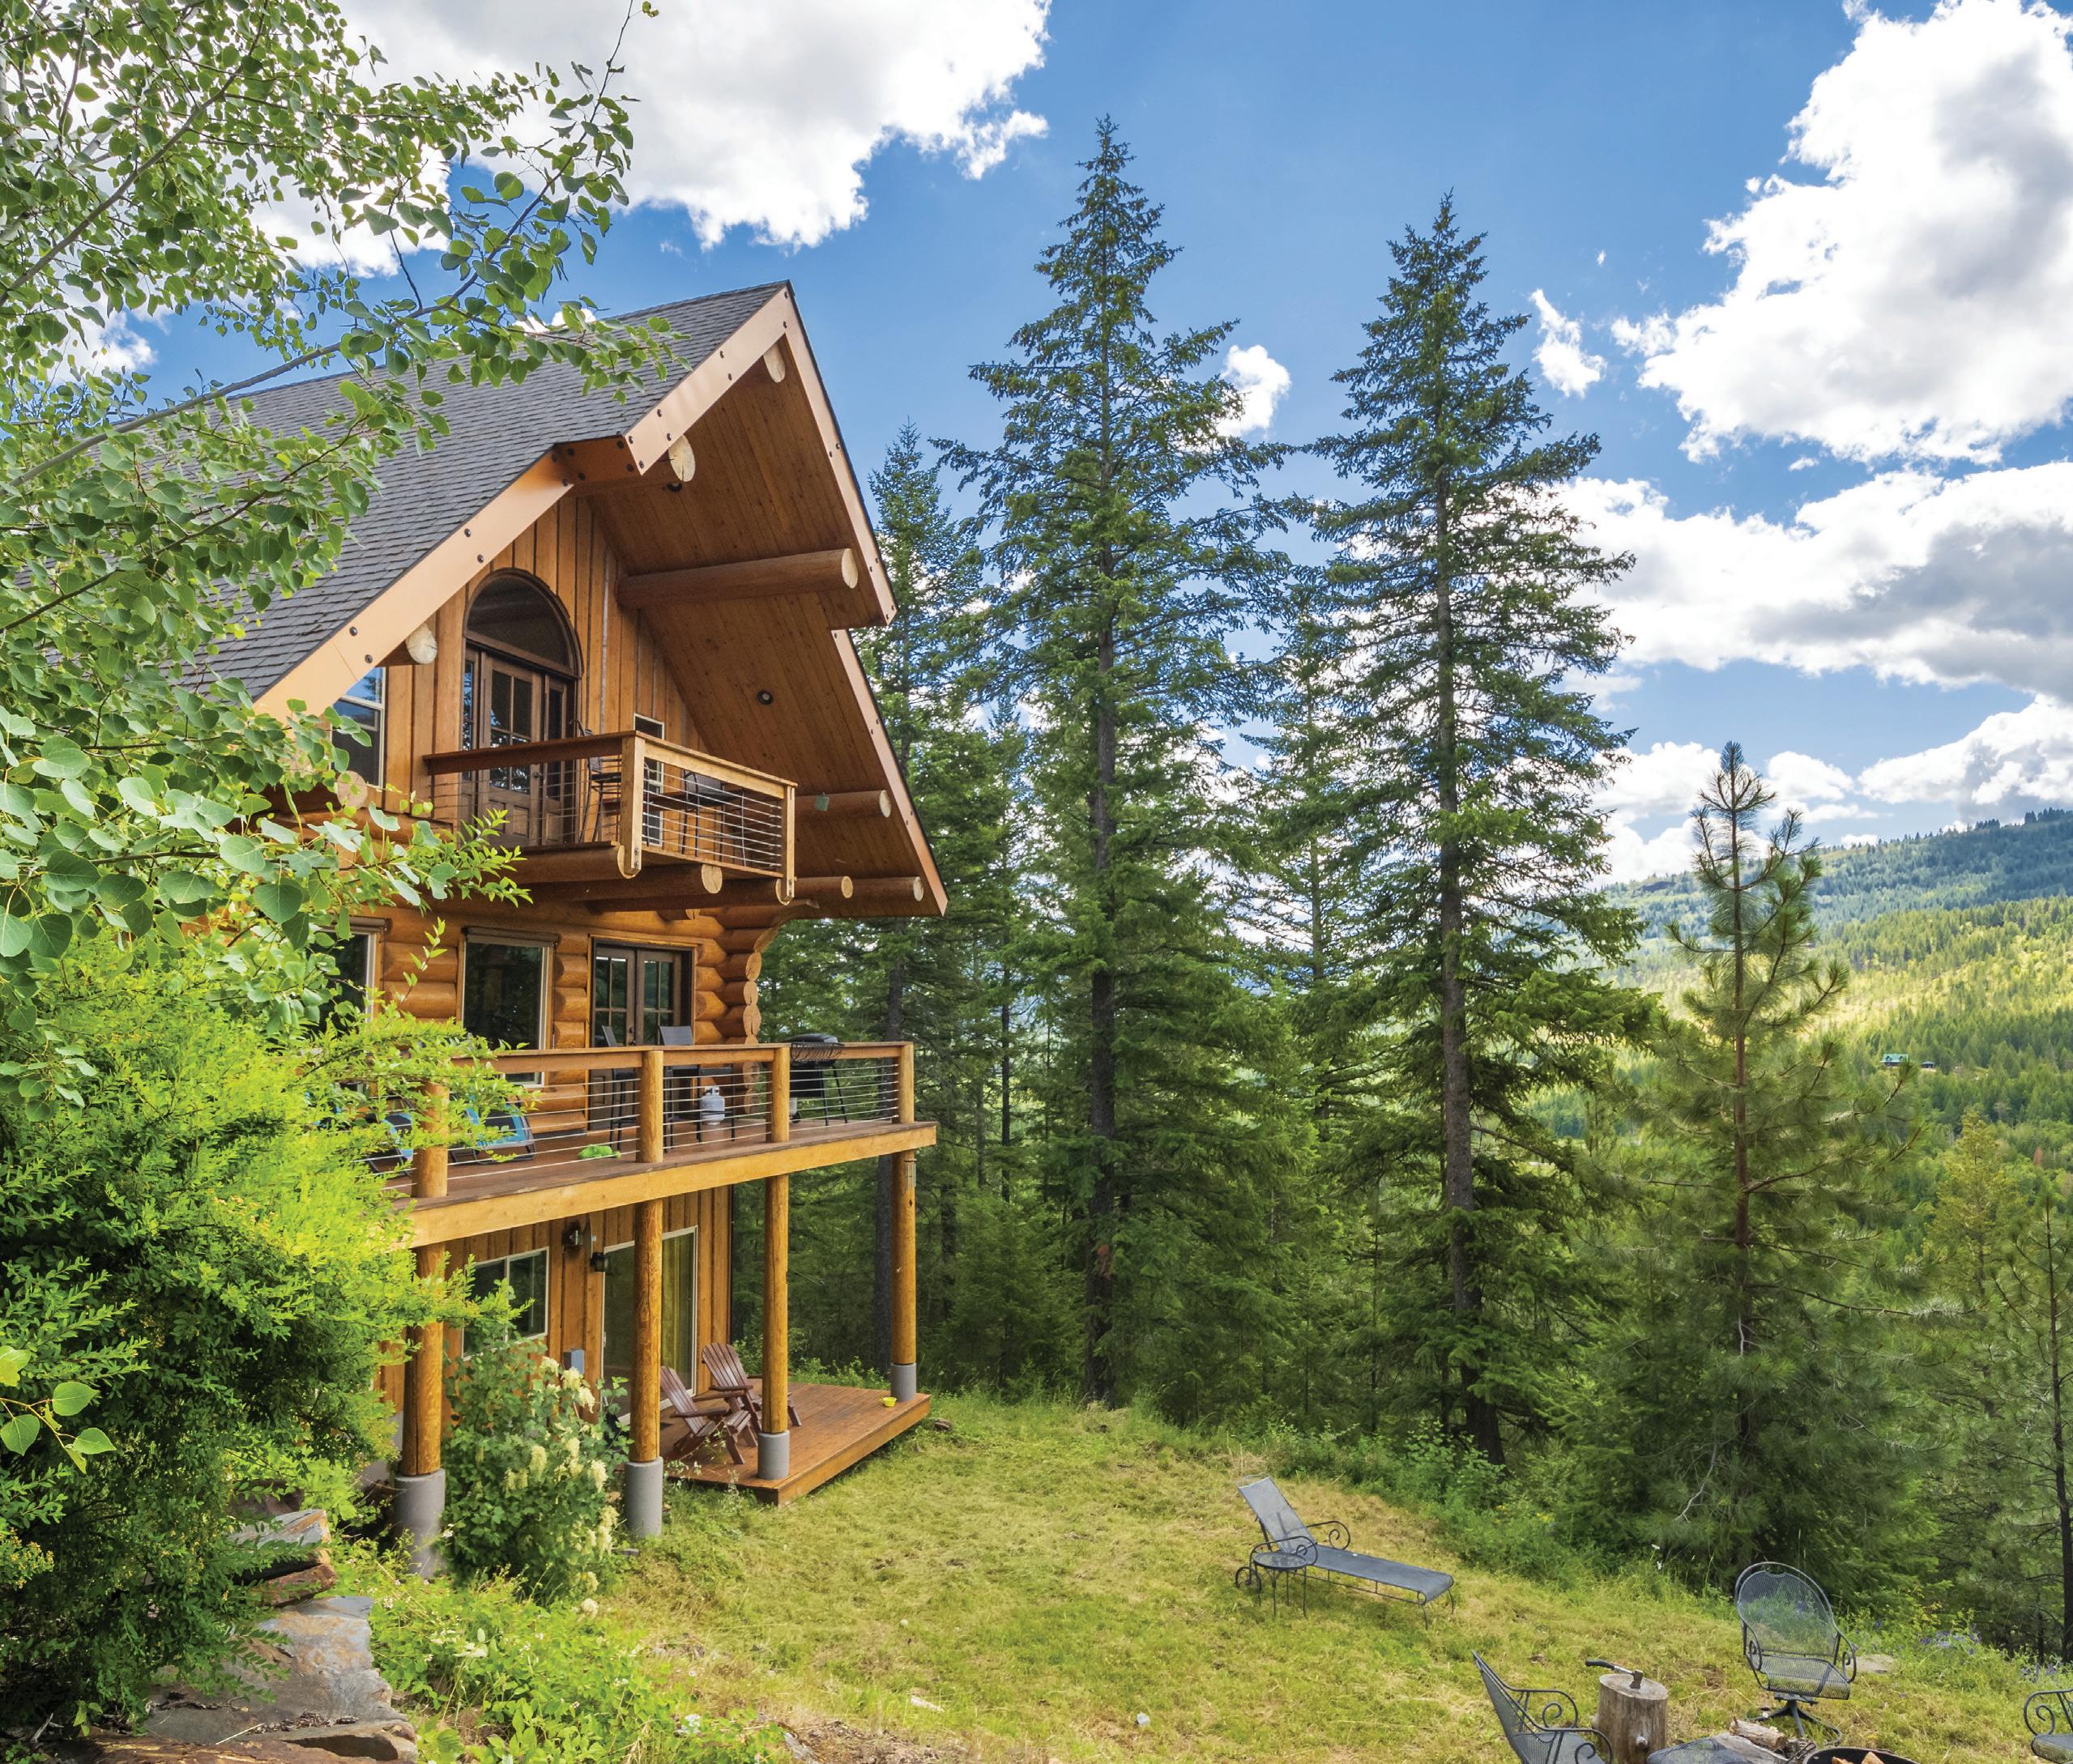
Single Family Homes Sold Second Quarter YTD Number Sold Sold Price Range Median Sold Price Median % Off Asking Price Avg. Days On Market Woody Creek, Colorado Studio - 1 Bedroom 2 - 3 Bedrooms 4 - 5 Bedrooms 1 1 1 $755,000 $660,000 $8,600,000 $755,000 $660,000 $8,600,000 0 0 9 58 56 190
What’s Selling? SINGLE FAMILY HOMES
Woody Creek
% Sold Price to Original List Price
35% 2022 vs 2023 403 376 248 75 101 Average Days on Market Second Quarter of 2022 2020 2019 2023 2021
Second Quarter of 2022 vs 2023 8% 2022 2020 2019 2023 2021 95% 83% 94% 90% 97%
FAMILY HOMES Average Price Per Square Foot 0 $300 $600 $900 $1,200 $1,500 Second Quarter of 2022 2020 2019 2023 2021 $410 $485 $1,202 $571 $1,018 110% 2022 vs 2023
SINGLE
What’s For Sale? SINGLE FAMILY HOMES

Single Family Homes Active & Pending Active Pending Active Asking Price Range Median Asking Price 2 - 3 Bedrooms 4 - 5 Bedrooms 6+ Bedrooms 6 4 3 2 0 0 $509,000 - $6,950,000 $1,275,000 - $19,995,000 $ 16,888,000 - $22,500,000 $ 1,400,000 $5,972,500 $18,500,000
Creek, Colorado
Woody
520 E Durant Ave Suite 205, Aspen • 970.544.5800 Properties@ChristiesAspenRE.com • ChristiesAspenRE.com LIFESTYLE. LUXURY. LEGACY.


