Digital Data and Advanced AI for Richer Global Intelligence
Danielle Goldfarb

Danielle Goldfarb
Danielle Goldfarb
The Centre for International Governance Innovation (CIGI) is an independent, non-partisan think tank whose peer-reviewed research and trusted analysis influence policy makers to innovate. Our global network of multidisciplinary researchers and strategic partnerships provide policy solutions for the digital era with one goal: to improve people’s lives everywhere. Headquartered in Waterloo, Canada, CIGI has received support from the Government of Canada, the Government of Ontario and founder Jim Balsillie.
Le Centre pour l’innovation dans la gouvernance internationale (CIGI) est un groupe de réflexion indépendant et non partisan dont les recherches évaluées par des pairs et les analyses fiables incitent les décideurs à innover. Grâce à son réseau mondial de chercheurs pluridisciplinaires et de partenariats stratégiques, le CIGI offre des solutions politiques adaptées à l’ère numérique dans le seul but d’améliorer la vie des gens du monde entier. Le CIGI, dont le siège se trouve à Waterloo, au Canada, bénéficie du soutien du gouvernement du Canada, du gouvernement de l’Ontario et de son fondateur, Jim Balsillie.
President, CIGI Paul Samson
Director, Program Management Dianna English
Program Manager Jenny Thiel
Publications Editor Susan Bubak
Senior Publications Editor Jennifer Goyder
Graphic Designer Sepideh Shomali
Copyright © 2025 by the Centre for International Governance Innovation
The opinions expressed in this publication are those of the author and do not necessarily reflect the views of the Centre for International Governance Innovation or its Board of Directors.
For publications enquiries, please contact publications@cigionline.org.
The text of this work is licensed under CC BY 4.0. To view a copy of this licence, visit http://creativecommons.org/licenses/by/4.0/. \For reuse or distribution, please include this copyright notice. This work may contain content (including but not limited to graphics, charts and photographs) used or reproduced under licence or with permission from third parties. Permission to reproduce this content must be obtained from third parties directly.
Centre for International Governance Innovation and CIGI are registered trademarks.
67 Erb Street West Waterloo, ON, Canada N2L 6C2 www.cigionline.org
Danielle Goldfarb is a CIGI senior fellow, and an adviser and expert on the digital economy, real-time data, international trade and public policy. She is also a global fellow at the Woodrow Wilson Center’s Canada Institute, a distinguished fellow at the Asia Pacific Foundation of Canada, an adviser on public policy to Mila – Quebec Artificial Intelligence Institute, and a senior fellow at the Munk School of Global Affairs and Public Policy. Her TEDx talk, “The Smartest Way to Predict the Future,” is about leveraging new technologies to address data bias, improving prediction.
Danielle is part of the writing group for the January 2025 International AI Safety Report She hosts the New Tools of the Economists’ Trade series for the Canadian Association of Business and Economics and teaches at the Munk School. Danielle has led novel and leadingedge research at the C. D. Howe Institute, the Conference Board of Canada and Real-Time Interactive Worldwide Intelligence, a real-time data company.
Danielle holds a master of philosophy in international relations from the University of Cambridge and a bachelor of commerce in honours economics from McGill University.
This special report explores how digital data sets and advances in artificial intelligence (AI) can provide timely, transparent and detailed insights into global challenges.
Several experiments illustrate the potential use of these tools for public interest ends. For example, researchers are using advances in AI to rapidly collect millions of online supermarket prices, creating alternative and more timely inflation measures. A shipping data company applied machine learning to ship sensor data to reveal the speed with which Russia created a shadow oil market after Western countries imposed sanctions. Academic researchers combined private sector online tax, job listing, credit card and payroll data to expose the long-lasting economic impact of the COVID-19 pandemic on low-income workers. After China abruptly reversed its zero-COVID policy, online searches, satellite images and smartphone locations showed that official metrics vastly underestimated the health toll and overstated the economic rebound. And a growing set of experiments in the poorest countries use abundant satellite images, mobility data and machine learning to form a more detailed and more frequent picture of conditions, including in remote areas.
These experiments illustrate how governments and civil society analysts can reuse digital data to spot emerging problems, analyze specific group impacts, complement traditional metrics or verify data that may be manipulated. New AI advances further expand the potential new data types available to increase transparency and detail. Large language models (LLMs) can rapidly and accurately categorize massive amounts of text and images and translate seamlessly between languages. The resulting more complete and transparent picture enables policy makers to respond to challenges more effectively while also holding them to account.
AI and data governance should extend beyond addressing harms. International institutions and governments need to actively steward digital data and AI tools to support a step change in our understanding of society’s biggest challenges. They should invest where data is scarce, lagging or incomplete; where key public interest questions are at stake; and where there are few market incentives to do so. They will also need to recognize the limitations of these methods, avoid relying on single indicators, maintain and enhance investments in baseline data, combine private sector data into public data pools, and apply frameworks for transparency, ethics and privacy.


To best anticipate, understand and respond to local and global events and issues, analysts in government, international institutions and civil society need access to reliable, accurate and timely information.
This special report explores the potential of digital data sets and advances in AI to build on traditional metrics and deepen our understanding of the world — in turn, improving our ability to respond to global challenges. It also considers the challenges that analysts in government or academia will need to confront to leverage these tools effectively.
The analysis builds upon a previous paper (Goldfarb 2024) that looks at the emergence of digital data sets to provide more timely, detailed measures in advanced economies. This report explores a broader array of experiments around the world for which the use of digital data — and newly available AI tools — are or could provide a more transparent, detailed and timely picture. The major advances in generative AI, for example, make it possible to collect new types of data from text and images and across multiple languages.
For decades, governments, statistical agencies and international institutions have invested in official measures to monitor local and global conditions. These metrics — including surveys, customs data and administrative records — became information anchors, significantly improving the evidence basis for decision making.
As economies and societies have become more complex and more digital, traditional data has not kept up with this evolution.
Decision makers increasingly require more timely and more detailed information. However, official series often lack local detail or detail about particular groups of interest. They also systematically lag reality by weeks, months or sometimes years, and some headline economic data such as employment is often revised dramatically after it comes out. Lagged data can be costly: for example, the global financial crisis would likely have been a lot less harmful had the Federal Reserve cut interest rates to near zero in December 2007, when the United States entered a recession, rather than in December 2008, when economists at last saw it in the numbers.
Official survey response rates across the developed world are declining, raising accuracy concerns. In Canada, for example, the labour force survey response rate dropped from 87 percent in 2019 to 71 percent in 2023, a trend not solely attributable to pandemic-era data collection methods (Statistics Canada 2023).
Moreover, as economies and societies have become more complex and more digital, traditional data has not kept up with this evolution. US statistical agencies — considered to be among the world’s best-resourced — find it challenging to produce timely, credible and relevant statistics to meet “evidence requirements in the 21st century” (American Statistical Association 2024).
In recent years, national statistical agencies and international institutions have been actively working on modernizing their approaches to address these issues.
In poorer countries, the data challenge is worse. Household surveys — critical for monitoring poverty and policy impacts — take place every few years, at best. These surveys are costly, time consuming and still not very accurate (Burke et al. 2020). Many countries struggle to collect the data needed to track progress toward the UN Sustainable Development Goals (Fraisl et al. 2024). Even when data is available, it cannot be disaggregated, hindering policy makers’ ability to monitor and respond to different circumstances (ibid.). During crises, critical interventions are often based on outdated, limited or non-existent data.
In all countries — but especially those under authoritarian rule — leaders can manipulate data reporting. Under Chinese President Xi Jinping, Chinese authorities have increasingly withheld or strategically altered technical data to present more favourable results (BurnMurdoch 2022). Similarly, Russian authorities have selectively withheld budget, financial and trade data since the Ukraine war started (Anisimova and Smitt Meyer 2023). These practices create significant uncertainty about true conditions.
Now, the issue of withholding data also applies to the United States. After US President Donald Trump took office in January 2025, official data appears to have been removed from many government websites, including some public health and census data.
As traditional data approaches reveal these limitations, the digitalization of our societies has resulted in a data explosion. Scanners, sensors, satellites, smartphones and online platforms worldwide generate massive, varied and continuous data feeds.
This “digital exhaust” can be repurposed for public interest research. For example, data collected from individuals by ride-sharing or transit apps can be reused in the aggregate to analyze traffic patterns, economic activity and potential disease spread. The internet also allows for researchers to collect new types of data for public interest goals. Citizen science websites such as eBird.org crowdsource bird sightings, and then researchers can use this data to track migration patterns.
Table 1 shows some sample digital data types and some related sample public interest applications. Analysts in governments, international institutions and civil society are experimenting with these novel data types to gain greater clarity on a range of societal challenges, from tracking disease outbreaks to determining the needs of migrants in near real time.
Table 1: Sample Digital Data Sets and Public Interest Applications
Sample Digital Data Set
Sample Public Interest Applications
Online price data from retailer websites Verify inflation data
• Generate high-frequency or sector-specific inflation statistics
Online search queries
Online news postings for key economic terms
Transit app movement patterns
Crowdsourced sightings on online citizen science platforms
Mobile phone location data
Ship transponder data
Online job postings
Source: Author.
Note:
Monitor public health concerns and symptoms
• Provide advance warnings of outbreaks
Assess recession risk
• Track real-time traffic and commuting behaviour
• Observe animal migration patterns
• Monitor biodiversity
Evaluate disaster impacts
• Analyze dislocation patterns
Track global supply chain movements Identify disruptions
• Analyze labour market strength or weakness in real time
Advances in AI have dramatically expanded the set of possibilities for gathering, collecting and extracting meaning from digital data for public interest purposes.
LLMs, trained on huge text data sets, can now “understand” context, and therefore extract and categorize unstructured data (from text or images) into structured information (data in rows, tables and columns). LLMs can analyze global news articles for early disease outbreak signals or economic indicators, extract labour market insights from job postings and synthesize policy developments from freedom-of-information request databases.
Table 2 shows examples of the types of data now available across different public interest domains, from traditional structured data to structured digital data to unstructured digital
data. The ability to categorize and extract meaning from unstructured data means it is now possible to combine insights from both structured and unstructured data and provide a more complete picture of social, economic, technological or geopolitical developments. It was not possible to do this before these latest AI advances.
Domain
Structured Data
Examples (Traditional)
Economic GDP, unemployment rates, foreign direct investment
Political Election results, budget allocations
Health Case numbers, vaccination rates, admission rates
Structured Data
Examples (Non-traditional)
Credit and debit card transactions
Digitized voting records
Wearable device metrics
Social Crime rates, income distribution Mobility and location data
Environmental Temperatures, carbon emission levels
Source: Author; text generated with support from Claude 3.5.
Sensor data
Unstructured Data
Examples
News articles on economic trends; meeting minutes and videos from central bank meetings
Political speeches, policy documents, social media discussions
Research papers, public health announcements, social media healthrelated posts
Articles on social issues, academic papers, public discussions online
Satellite images
Researchers are also using other AI techniques to extract meaning and predictions from digital data sets. One example is the use of neural networks to learn about economic trends from online search data. This technique compensates for the lack of online search history for each country by learning from the experience of many countries (ibid.).
This report looks at several experiments from around the world that demonstrate both the potential and challenges of using digital data and AI advances to improve understanding of key issues. Each case identifies information gaps, how new data sets on their own or in combination with advances in AI are used to address those gaps, and some of the lessons that emerge.
Drawing from diverse sources, including research papers, interviews, blogs, news reporting and the author’s own experience working with digital data sets, the report explores experiments by those in industry, finance or public policy, as well as independent academic or think tank
research. This analysis is challenging because many real-time digital data sets are not publicly available, and data collection methods are often opaque. Hedge funds and AI companies — which dominate the use of digital data — rarely disclose their sources or methodologies. And the methods for gathering even publicly available data sets are not always transparent.
Moreover, AI companies use massive data sets to train LLMs, typically without focusing on public interest questions. In addition, many AI models struggle to explain their decisionmaking processes. Similarly, hedge funds use non-traditional data to gain competitive market intelligence. Their goal is to exploit these otherwise under-the-radar results to generate outsize market returns. They keep their analyses confidential and rarely publish their results. When they do share any information, it is not focused on public interest questions.
Existing experiments in the public domain, such as those by academics or at central banks, tend to focus on advanced economies with reliable data infrastructures. These can be extremely valuable, adding timeliness, new dimensions and detail to our understanding of events or issues in advanced economies. Experiments in data-poor environments are less common.
As a result of these limitations, this analysis is incomplete or conceptual in places. Its goal is to highlight the step change that this digital data plus advances in AI enable for our understanding of societal challenges, to support more informed decision making and improved outcomes.
This report starts with one of the first widely known examples of collecting massive and previously untapped Web-based data to challenge, confirm or add to conventional data. This case focuses on inflation: inflation rates are central to economic decisions made by central banks, businesses and individuals. Transparent, timely, detailed and reliable inflation data is critical to making more targeted economic policy decisions.
The Billion Prices Project (BPP) emerged in response to the belief that the Argentinian government was substantially underestimating inflation from 2007 to 2015 (Cavallo and Rigobon 2016). Academic researchers gathered price data from large supermarkets’ websites in Argentina with the goal of getting an alternative measure of inflation. BPP estimates revealed Argentinian inflation rates were three times higher than official data (ibid., Figure 1).
The researchers also showed that these online price indexes co-move with consumer price indexes in most countries (ibid.). Even in countries with relatively reliable official data, such as the United States, this data has been an important validator of the official data.
The BPP’s successor project, PriceStats, provides daily inflation updates based on daily Web price data from hundreds of retailers in 25 major economies, and across key sectors such as food, clothing, electronics, furniture and energy.1 The goal is to anticipate major shifts in inflation trends based on observing prices in real time and because online prices tend to respond faster to shocks than offline prices.
Unlike time-consuming and costly traditional methods, where statistical agencies send people to stores to collect prices for preselected products and services, the researchers
1 See www.pricestats.com/inflation-series.
Source: Cavallo and Rigobon (2016). Copyright American Economic Association; reproduced with permission of the Journalof Economic Perspectives
Note: CPI = Consumer Price Index.
“scrape” or automatically collect online price data and convert it into structured data sets for analysis.
One major challenge with this method is ensuring the data truly represents retail transactions. The PriceStats researchers report careful selection of retailers to ensure the data is representative; however, their methods of doing so are not publicly verifiable.
With inflation control being a major global challenge in the years since the COVID-19 pandemic, and in the wake of AI advances, other researchers are experimenting with extracting data from online platforms and applying AI approaches to measuring and forecasting inflation. One study by the Federal Reserve Bank of St. Louis found that LLMs could more accurately forecast US inflation than professional forecasters over 2019–2023 (Faria-e-Castro and Leibovici 2024).
Other researchers are leveraging data from a variety of online platforms. For example, hedge fund analysts use the millions of data points from Zillow, the online real estate database, as a source of real-time US housing inflation data. Zillow’s measures are starting to displace long-standing and highly regarded home price indexes because they are available for a more complete set of cities and the data is near real time (Richter 2024).
New AI capabilities open up previously impossible ways to analyze the massive quantities of unstructured online price and product data. LLMs can now read and classify both text and images, as well as seamlessly translate from one language to another. This creates the possibility of automatically categorizing billions of individual product descriptions and price observations. The Bank for International Settlements is leveraging these capabilities to experiment with converting massive numbers of data points in the European Central Bank’s
daily price data set into accessible information.2 The approach maps price data to standardized household spending categories, with the ultimate goal of improving inflation “nowcasts.”3 This kind of foundational work can then be used by other institutions, such as central banks and statistical agencies around the world, instead of having to start from scratch. Zillow has also started using a neural network model to draw connections among its massive database of home facts, locations, values and broader market trends to estimate home values.4
More timely and more detailed inflation measurements can help central bankers respond to unexpected events in real time and enable think tanks and academics to provide more informed policy analysis.
These experiments illustrate how economists can now collect and categorize online price and product information mostly automatically, remotely, quickly and at scale. More timely and more detailed inflation measurements can help central bankers respond to unexpected events in real time and enable think tanks and academics to provide more informed policy analysis. The accuracy and usefulness of these approaches depend critically on the careful selection, cleaning and validating of this data, and a big limitation is that it is unclear in many of these cases exactly how this is to be done. Also, to do this kind of data collection requires foundational work that, once done, others can build upon rather than having to start from scratch.
During the COVID-19 pandemic, as timely information became more critical, a group of academic researchers created the Opportunity Insights Economic Tracker. Their goal was to “spot economic problems as they emerge and develop targeted, evidence-based policy responses” in the United States, instead of having to wait weeks after the fact for information critical for decision making.5
The research team combined raw data from 10 companies that, as a by-product of their business activities, collected ongoing digital data relevant to economic conditions. This data included the following:
• tax and employment data from tax software company Intuit;
• job vacancy metrics from online job postings aggregator Burning Glass Technologies;
• payroll information from payroll service provider Paychex; and
• small business revenue data from business credit card aggregator Womply.
The researchers combined this data to construct a public, ongoing economic data set, with detail at the county or zip code level, as well as by income group. To combine the
2 See www.bis.org/about/bisih/topics/suptech_regtech/spectrum.htm.
3 Ibid.
4 See https://zillow.zendesk.com/hc/en-us/articles/203512140-What-is-a-Zestimate-home-value.
5 See https://opportunityinsights.org/tracker-resources/.
data into a public resource, they had to protect the identity of both individuals and businesses. They did this by anonymizing the data. They also indexed all of the raw data values relative to pre-COVID-19, so users could observe changes relative to baseline data rather than actual levels that might identify a business. Further, they benchmarked the data to national statistics to identify biases since this data was “naturally occurring” and, unlike official data, was not specifically calibrated to represent businesses or the population. Researchers had to contend with other limitations, including a lack of time history, making it difficult to account for seasonal trends, and a lack of transparency around the business models for each company, meaning that researchers might observe a change in the data and have no way to discern if it reflects a true change in the economy or simply a business model change.
Using this new data feed, the researchers were able to identify that high-wage workers experienced a recession of only a few weeks, compared with low-wage workers who experienced much larger and longer-lasting job losses (ibid.). The researchers also used the data feed to assess policy interventions. For example, they found that special pandemic business loans barely increased small business employment (ibid.).
This is one example of the very active set of experiments around the world tracking economic activity using nontraditional indicators. Central banks, statistical agencies and international institutions such as the Organisation for Economic Co-operation and Development (OECD), have been experimenting with a range of novel data sets to track economic activity. For example, the Bank of Canada ran a daily internet survey of Canadians from 2019 to 2023, asking randomly intercepted Canadians questions about the economy. The results were well correlated with other official indicators but had the additional advantage of being available in near real time and anticipating turning points in inflation before they showed up in more traditional data (Fudurich, Mollins and Rai 2024).
Another example is the Canadian Chamber of Commerce’s Business Data Lab, a collaboration with Statistics Canada that uses both traditional measures and non-traditional data to measure local business conditions in real time.6 The lab integrates online searches, job postings, rail and container shipments, airline sales, hotel bookings and online gas price data. It also uses credit card transactions data. While this data is
6 See https://businessdatalab.ca.
available with a two-week lag, this is a big improvement over traditional official spending metrics, which lag reality by about six weeks in Canada (ibid.).
These experiments demonstrate how creative data collaboration between public and private sectors can enable policy makers to measure and monitor economic activity and intervene in a more timely and targeted manner, especially in a period of rapid change. They also illustrate the careful work that needs to be done to benchmark and anonymize this data to turn it into a public resource. A key risk is that private sector vendors may not want to share their data sets on an ongoing basis, suggesting that frameworks need to be put in place to prevent companies from removing their data from the pool.
Traditional government health surveillance data can often take months or years to collect.
China is the world’s second-largest economy and a key driver of global economic growth, global commodities demand and global inflation. As a result, in addition to Chinese authorities needing accurate and timely information on the country’s conditions, so too do foreign governments, international institutions and civil society researchers who provide advice to global policy makers.
Official data is increasingly considered unreliable, however. China now has a “growing deficit of accurate information,” with the government redefining measures to make this look more favourable and no longer publishing a wide range of technical data (The Economist 2024). As a result, analysts are experimenting with digital data sets to challenge, confirm, provide real-time intelligence on, or plug gaps in official Chinese data.
At the beginning of — and throughout — the pandemic, Chinese authorities did not fully share official COVID-19 data with the World Health Organization (WHO). The Chinese government stopped publishing death data after the outbreak began. The global community widely viewed the Chinese COVID-19 data as obfuscating the origins of the disease and underplaying the spread — and toll — of the disease.
Moreover, even if the authorities correctly reported the data, it lagged reality. This is not unique to China: traditional government health surveillance data can often take months or years to collect. This data is also incomplete since not everyone gets tested or reports this information. While these conditions existed around the world, two factors likely made this data relatively more incomplete in China: the stigma of reporting and authorities reducing the amount of testing.
With the stakes so high for both global public health and the global economy, analysts in governments around the world and in the private sector started looking for non-traditional, more indirect information. Demand for alternative data skyrocketed among hedge funds in the initial months of the pandemic (Fletcher 2020). These indicators included satellite imagery of hospital parking lots and crematoria, online searches for COVID-19 symptoms, mobile phone location data to estimate virus spread, traffic data to measure lockdown
severity at the city level (ibid.), and air pollution data to proxy for economic activity and lockdown effectiveness.
Analysts also compared social media posts in China with Chinese government statements to gauge the extent of the virus’s impact (ibid.). Social media posts in China need to be interpreted with caution. They may not reflect true sentiment, and they are not always geocoded — meaning they lack location data — so it is hard to confirm that the posts come from people who are actually there (ibid.).
BlueDot, a disease surveillance company, used an algorithm to scan tens of thousands of media sources daily for references to specific disease terms (Bogoch et al. 2020). They combined this information with air transit and vaccination data to identify the disease’s origins, where it would spread, and to determine that COVID-19 was a pandemic before the WHO announced this conclusion (ibid.). Researchers also used an analysis of six million digitized Chinese news articles to show that propaganda delayed the release of COVID-19 information of vital national and international importance (Waight et al. 2024).
In December 2022, the Chinese government reversed its strict zero-COVID approach overnight. The sudden policy change raised uncertainty about both the health fallout and the economic impact. In the wake of the policy reversal, China significantly reduced both testing for COVID-19 and public reporting of data. The government stopped publishing daily case counts, instead publishing widely questioned monthly case counts. China’s government also announced, unbelievably, that there were no new deaths due to COVID-19 after the policy change (White and Liu 2022).
To get a timely and more reliable picture of the policy reversal’s health and economic impact, hedge funds and analysts in public institutions, governments and media looked to nontraditional data to gain clarity. One example is that satellite imagery showed line-ups at morgues that did not exist before the policy reversal (Oakford et al. 2023). Another example shows that online search volumes for funeral services grew, as did those for “antipyretics,” “fever,” “blood oxygen” and “lianhua qingwen” (a traditional Chinese herbal medicine approved by the Chinese health authorities for treating COVID-19) (The Economist 2022).
Another novel metric used by private sector analysts was the results of a daily, continuous survey launched just over a week after the policy reversal. The approach randomly selected people online across all parts of the country and asked about COVID-19 symptoms and hospitalizations among close friends and family members in the previous two weeks. The questions ran 24/7 for two weeks (to avoid time-of-day bias and to track changes over time) and deployed mechanisms to avoid state censorship (typical surveys need to receive state approval). Unlike conventional surveys, researchers did not collect any personally identifiable information (to encourage honesty) and stored the results outside of the country.
The results painted a picture similar to the satellite and search findings: a consistent majority of the 2,239 total respondents reported someone with COVID-19 symptoms in their immediate circle, and more than one-quarter reported someone hospitalized with COVID-19 in their immediate circle during the previous two weeks. Because the survey autodetected the respondent’s location, the data set also provided more detailed local information by city.
Rather than data becoming more reliable and comprehensive as China’s economy advances, Beijing has stopped publishing thousands of statistical series since President Xi came to power in 2013 (Burn-Murdoch 2022). Much of the withdrawn data was detailed indicators that analysts previously used to verify headline indicators such as GDP or employment.
Other official data is now published less frequently: In 2024, China moved from publishing daily data on flows of foreign capital — a critical gauge of confidence — to quarterly data (The Economist 2024). In addition, officials hide less favourable data by delaying its release and redefining the indicators. One notable example relates to China’s massive youth unemployment problem. In 2023, the National Bureau of Statistics delayed publication of the youth unemployment rate, then later released an “optimized” rate (ibid.).
When China delayed its release of GDP data in October 2022, finance analysts turned to alternative, more high-frequency data to assess the health of the economy.
Moreover, methodologies and explanations behind the official data and any changes to it are opaque. Revisions — such as those to the GDP data in 2022 — come with little explanation, making it difficult to interpret what they mean (Hale 2023). The size of the widely watched Chinese trade balance is unclear: Chinese customs data showed a dramatically larger goods trade surplus than did balance-of-payments data, with the size of the gap increasing starting in 2022, and little helpful explanation from Chinese officials for the discrepancy (The Economist 2024).
Further, Chinese official data, like data from most other countries, lags reality by weeks or months and is backward-looking. Even alternative measures of economic activity such as the Li Keqiang Index — which uses electricity consumption, rail cargo and bank lending as proxies for economic growth — all lag reality. Moreover, new laws requiring companies to store their data in China has led foreign companies including survey companies to leave China.
Analysts have turned to a variety of unconventional indicators for greater clarity on the true state of the Chinese economy since long before these developments. For example, a study used nighttime light intensity from satellite images as a proxy for GDP and found the striking result that Chinese economic growth was likely one-third lower than reported (Martínez 2021).
When China delayed its release of GDP data in October 2022, finance analysts turned to alternative, more high-frequency data to assess the health of the economy. This data included everything from app downloads to ticket prices for Disney resorts in Shanghai to data gathered from online platforms on public transport use, road congestion, pollution and flight volumes. While all of these types of data are imperfect proxies for economic activity, taken together they provide some sense of the real-time health of the economy.
The road, transit and flight indicators showed that the country’s economy was operating at a rate one-third lower than usual, and growth was at about half the official target (BurnMurdoch 2022). One study used data from Amap (a Chinese mapping, navigation and location-based service provider) to look at traffic congestion in each of China’s biggest
cities and overall and found traffic congestion had declined significantly in late 2022 relative to the year before (Kruger 2022).
When China reversed its zero-COVID policy in late 2022, the widespread assumption was that there would be a fast and robust Chinese economic recovery and a boost to global growth. Indeed, China’s GDP data in the first quarter suggested a strong recovery.
More high-frequency digital metrics challenged that assumption. A company called MacroX combined news, social media, sensors, satellite and other data gathered from online platforms. It used AI tools to collect the data across all of these indicators daily and across both numerical and text or imagery data — and also fed this data into its AI model to generate real-time insights into Chinese industrial activity growth (MacroX 2023). The findings showed that the Chinese economy was stalling early in the second quarter of 2023, several months before GDP data came out (ibid.). Unfortunately, the way the model works and details on the types of data sets used are not publicly available, so it is hard to fully analyze the effectiveness of this approach.
Another set of real-time data after the policy reversal showed a similar picture. China accounts for 70 percent of the world’s imports of iron ore, so shipments of iron ore partly proxy for the health of the Chinese economy. Analysts at QuantCube Technology (2023) looked at marine shipments of iron ore and found they spiked after the policy reversal. But they also looked at aggregated air traffic arrivals and departures in real time for the main airports in China to proxy for fuel demand and found that air transit demand rose but was still very low compared to pre-pandemic levels (ibid.).
These same analysts also added satellite images of nitrogen dioxide pollution in Guangzhou and Beijing (ibid.). Nitrogen dioxide is a greenhouse gas emitted mainly by heavy industry and transport. They found that nitrogen dioxide concentration levels were slow to rebound as well (QuantCube Technology 2023, exhibit 7), suggesting limited growth in Chinese domestic demand in the immediate aftermath of the policy reversal (ibid.).
Other indicators are also now available to provide an alternative view of China’s youth unemployment problem after Chinese authorities changed the way they calculate it. For example, a study collected continuous self-reported employment data from Chinese Web users throughout the country between 2019 and 2023 and found significant Chinese youth underemployment in addition to unemployment (Kruger 2023). It also provides more detailed and comprehensive analysis of this issue across different cohorts than is otherwise available (ibid.).
Taken together, this experimentation shows that emerging digital data sets can help clarify conditions where there is limited transparency. The lessons learned by those applying these tools in finance can be used by those in government, international institutions or civil society. Since it is hard to validate this novel data in the face of untrusted “ground truth,” it is especially important to bring together multiple data types and appreciate the biases and limitations in each data set. For example, online activity in China is even more male-dominated than the country’s population. Social media posts are censored and hard to verify. The case also shows the importance of local sources such as Baidu for online search rather than Google. One gap is that these efforts to pull together non-traditional data are taking place on an ad hoc basis, and there is no consistent repository of information or infrastructure to draw on each time there is an unexpected event.
While traditional on-the-ground data is scarce in poor countries, international institutions, governments and researchers are reusing digital data sets and using AI techniques to try to create a more detailed, timely and nuanced understanding of low-income economies and societies.
Many developing countries conduct surveys infrequently or rarely. Without reliable demographic, environmental and socio-economic data, it is hard to target and evaluate policy responses effectively. The need for such data is more important than ever, since progress on international development has slowed. By contrast, we now have abundant, cheap and high-quality satellite data (Burke et al. 2020) and other real-time indicators such as search and mobility data. A new group of researchers is now combining these indicators with machine learning to measure economic and social outcomes in developing countries. These methods are relatively inexpensive and work across many data-scarce developing environments (Ratledge et al. 2022).
We now have more satellite images at higher quality than ever before. These images measure important development outcomes as accurately as — or more accurately than — traditional approaches (Burke et al. 2020). They also provide much more detailed information. A recent study in Colombia, for example, trained an algorithm to connect daytime and nighttime satellite images, and then used the algorithm to predict poverty rates based on daytime satellite imagery. The researchers combined the predictions with census results to verify their accuracy. The result was a 70-fold increase in data points related to poverty, or 78,000, compared to the 1,123 data points previously available (Fraisl 2024).
Not all efforts using satellite data succeed, though: vegetation and agricultural imagery are worse at predicting outcomes than are other data sources (Newhouse et al. 2024). And few policy makers use satellite imagery in their decision making, likely because the technology remains new and hard to interpret (Burke et al. 2020).
Internet search and Google mobility data also show promise for measuring outcomes in developing countries. These indicators help signal economic distress and recovery, especially in cities and during the COVID-19 crisis. For example, Google searches about food, money and jobs predicted income declines, while mobility measures predicted employment changes (Newhouse et al. 2024).
A range of other experiments are under way. For example, a pilot project in Ghana combines AI, drone surveillance and citizen science to map marine plastic pollution patterns. The approach analyzes debris distribution and composition across coastal areas automatically, including remote locations where teams cannot conduct traditional beach surveys (Fraisl 2024). The high-resolution data helps optimize cleanup resources and intervention strategies.
AI researchers working with this frontier data in least developed countries face several constraints. While satellites, phones and sensors now generate vast amounts of realtime data, the scarcity of reliable “ground truth” data makes it hard to train AI models and
validate the quality of these new data sources (Burke et al. 2020). This gap has pushed organizations to invest in new high-frequency survey methods, such as using mobile phones to collect living conditions data (Newhouse et al. 2024). Additional barriers include outdated legislative frameworks that restrict the use of alternative data in official statistics, and complex technical challenges in integrating diverse data streams into formal reporting systems (Fraisl 2024).
Traditional approaches to measuring conditions in poor countries are limited on their own, but these examples show there is immense potential to collect new data sets quickly and inexpensively; reuse data already collected in new ways, including extracting relevant information from text or images; and create a more detailed, nuanced understanding of lowincome economies and societies. This is now possible even in remote regions. For both local and global policy makers, using these tools will require careful assessment and evaluation, investments in improved foundational data, and new frameworks.
Today’s supply chains span the globe, creating deep connections across borders where problems in one area quickly affect the whole chain. Major events — from the COVID-19 pandemic to the wars in Ukraine and the Middle East — are forcing rapid changes in how goods move worldwide. Governments need current, detailed information to make informed decisions about trade policies, sanctions, diplomacy and fixing supply chain bottlenecks.
While official trade statistics tell us what products cross borders, they arrive late — typically a month after the actual trade takes place. Recent experiments with new data sources show that leaders can get a much richer, real-time view of global commerce. This matters especially during major and complex disruptions, such as tracking how Houthi attacks affect shipping routes or detecting ways Russia bypasses sanctions. And AI advances now open up a new set of possibilities to understand supply chains and shifts in real time.
Ships move most of the world’s goods, so by tracking their movements, we can get a richer picture of global trade. A number of analysts in finance and some, more recently, in public service now tap into real-time ship-tracking data to better understand supply chains. The Automatic Identification System (AIS) captures data from transponders on more than 100,000 major commercial vessels worldwide and from major global ports, showing each ship’s location, speed and cargo details. A key advantage of this data is that the information updates every 15 minutes and is freely available to the public.
One example of its use is when Yemen’s Houthis started attacking ships in the Red Sea in October 2023. Analysts plotted daily transit data from January 2022 through January 2024 for the Suez Canal and, separately, the Cape of Good Hope in South Africa (see Figure 2). The switch in routes away from the Suez Canal to the Cape of Good Hope starting in October 2023 is clear. So is the magnitude of the impact: the number of ships passing through the Suez Canal in January 2024 was half that of January 2023 (ibid.).
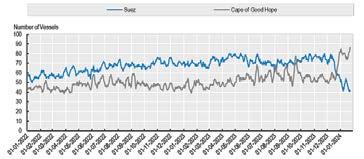
Source: Pilgrim, Guidetti and Mourougane (2024, Figure 14; authors' calculation based on AIS data).
Note: Figure represents a seven-day moving average.
This data provides clear and up-to-date information on the magnitude of the disruption and when and how it changes. And, unlike most new digital data sources, these shipping records have a history, making it possible to distinguish unusual patterns from normal seasonal shifts. Plus, since satellites collect this data remotely, experts can monitor shipping worldwide from anywhere — a major advance over traditional methods.
When Western nations banned Russian oil imports in late 2022 and early 2023, analysts concerned about the effect on global markets wanted to gauge the impact. Russian authorities made this process complicated by classifying some trade and other economic data.
MariTrace, a global shipping surveillance company, combined ship sensor data with port records and measurements of how deep ships sat in the water and their carrying capacity. Using machine learning, the company could then estimate how much cargo actually moved through global ports (MariTrace 2023). The analysis exposed how quickly a shadow oil market emerged after the embargo. The results showed that China and India became the main buyers of Russian oil, and a significant portion also went to unknown destinations (ibid.). By early 2023, Russian oil shipments had bounced back to mid-2022 levels, meaning that sanctions failed to stop flows, according to this analysis (ibid.).
Using these data sets requires careful work to ensure data quality, including excluding smaller ships, verifying port activity data and accounting for deliberate tracking evasion (DeRise 2023). Ships can mask their movements by turning off transponders. Here, too, new tools help to address this problem: by combining shipping data with daily satellite imagery and AI tools, experts can now identify vessels trying to hide their true identity or location.
Computer vision technology helps spot ships that have switched off their trackers or are broadcasting false signals. And analysts can use probability models to estimate likely oil and gas deliveries between vessels or ports in sensitive locations (ibid.).
This example shows how it is possible to creatively measure on-the-ground realities in near real time and remotely, even when governments try to hide them. It also shows the importance of using many tools and approaches given the ability to manipulate data.
This is only a taste of what is possible in terms of new ways of tracking and understanding global trade. LLMs can now read and analyze shipping manifests at scale, making sense of non-standardized product descriptions across different languages and formats. LLMs have been trained on enough text that they can “understand” context well enough to categorize ambiguous items, spot inconsistencies and flag unusual supply chain shifts — tasks that were impossible with traditional software just a few years ago.7
To fully leverage these tools to advance understanding of key societal challenges and events, policy makers should:
• Expand AI and data governance beyond harm mitigation: In addition to efforts to mitigate harms, international institutions and governments should steward the use of AI tools and digital data for a deeper and more timely understanding of societal challenges.
• Strategically invest in these AI tools: Policy makers need to treat real-time digital data and related AI tools as critical public infrastructure and invest in it. They should identify gaps in global and local data and prioritize investing in high-frequency data and the use of AI tools in underserved or remote areas or populations, in areas where there are important public interest questions, and where detailed and timely information could meaningfully improve outcomes, where market incentives are weak and where official data is unreliable.
• Create public data pools: Businesses own much of society’s digital exhaust that can potentially be reused for public interest purposes. Governments and international institutions can partner with businesses to turn these digital traces into publicly accessible data sets. This process will require investments in the foundational work to combine, validate and otherwise make these data sets ready for other policy makers and independent analysts to use them.
• Invest in rather than replace baseline data: Policy makers will need to invest more, not less, in foundational data. They will need this data to validate and calibrate new data types.
• Adopt frameworks for transparency, ethics and privacy: AI models are black boxes; it is not clear how they draw their conclusions. Also, companies keep the business models underlying digital data sets private. Further, many digital data sets contain private information on businesses and individuals. To ensure trust in the quality of this data and approaches taken to gather and analyze it, policy makers should adopt frameworks for transparency, privacy, ethics and for policy making in a real-time data world.
7 Interview with Abraham Thomas, May 2024.
• Recognize AI and big data limitations: Government, institutional and independent policy analysts need to recognize and address the limitations of digital data sets. This is not representative data, and any small biases may be amplified at scale. AI is trained on massive digital data sets and also reflects any biases. Moreover, the business models behind these digital data sets are largely opaque. How AI models come to their conclusions is also opaque. Analysts will need to use varied data sources rather than single ones. This is especially important if baseline data is scarce, infrequent or may be manipulated. Analysts should also rigorously test findings wherever possible since some of these applications and experiments will improve our understanding and others may not.
• Continuously re-evaluate possibilities as AI advances: Every policy area should have its existing data and gaps reviewed both for domestic issues and for those requiring data from other countries or globally. New possibilities now exist and may enable more targeted, timely interventions in the public interest, with costs for not doing so. New possibilities now exist to, for example, monitor conditions remotely, to impute missing data using machine learning and to extract meaning from massive amounts of text. These opportunities were previously impossible. AI advances are likely to add new options, and policy makers should continue to scan and adapt to new tools and innovations as technology evolves. Governments will also need to work collaboratively across borders to discover best practices and govern these new tools for greater knowledge and understanding of the world.
The examples in this special report illustrate the tremendous step change in possible intelligence when combining digital data with advances in AI, compared with traditional data alone. The combination of cheap, abundant, varied and timely data allows governments, international institutions and civil society researchers to access a far richer, more detailed picture of our world than previously possible.
These tools can fill in gaps in our understanding, allow for near real-time verification of claims, or provide information on vulnerable populations or in remote locations where none existed. AI advances mean we can collect data much faster and more efficiently than before, scale up the number of data points and information we have, and extract meaningful information about key societal challenges from multiple data sources. This greater understanding and transparency both allows and requires leaders to improve outcomes.
Policy makers and others addressing societal challenges need to rethink their approaches to data and intelligence gathering and invest in these new tools. They should do so especially where there are big data gaps and key public interest questions at stake, where timely and detailed information would improve outcomes, and where data is unreliable. They will also need to invest in the careful foundational work that needs to be done to turn these digital data sets into public resources, including addressing the limitations and risks of these approaches.
The author would like to thank Paul Samson and two anonymous reviewers for very helpful comments on a previous version of this paper, and Abraham Thomas and David Ticoll for comments that helped frame the ideas in this paper.
American Statistical Association. 2024. The Nation’s Data at Risk: Meeting America’s Information Needs for the 21st Century. Inaugural Report. July 9. Alexandria, VA: American Statistical Association. www.amstat.org/policy-and-advocacy/the-nation’s-data-at-risk-meeting-american’s-information-needs-forthe-21st-century.
Anisimova, Hanna and Cecilia Smitt Meyer. 2023. “Russia’s Data Warfare.” Free Network Policy Brief Series. April 18. https://freepolicybriefs.org/2023/04/18/russia-data-warfare/.
Bogoch, Isaac I., Alexander Watts, Andrea Thomas-Bachli, Carmen Huber, Moritz U. G. Kraemer and Kamran Khan. 2020. “Pneumonia of unknown aetiology in Wuhan, China: potential for international spread via commercial air travel.” Journal of Travel Medicine 27 (2): 1–3. https://doi.org/10.1093/ jtm/taaa008.
Burke, Marshall, Anne Driscoll, David B. Lobell and Stefano Ermon. 2020. “Using Satellite Imagery to Understand and Promote Sustainable Development.” NBER Working Paper 27879. www.nber.org/ papers/w27879.
Burn-Murdoch, John. 2022. “China’s GDP blackout isn’t fooling anyone.” Financial Times, October 21. www. ft. com/content/43bea201-ff6c-4d94-8506-e58ff787802c.
Cavallo, Alberto and Roberto Rigobon. 2016. “The Billion Prices Project: Using Online Prices for Inflation Measurement and Research.” Journal of Economic Perspectives 30 (2): 151–78. https://doi.org/10.1257/jep.30.2.151.
DeRise, Jason. 2023. “Data Deep Dive: Predicting China’s Exports Using AIS Vessel Tracking Data (+ Other Uses).” The Data Score, June 28. https:// thedatascore.substack. com/p/data-deep-divepredicting-chinas.
Faria-e-Castro, Miguel and Fernando Leibovici. 2024. “Artificial Intelligence and Inflation Forecasts.” Federal Reserve Bank of St. Louis Working Paper No. 2023-015D. https://doi.org/10.20955/ wp.2023.015.
Fletcher, Lawrence. 2020. “Hedge funds scour alternative data for edge on Covid and economy.” Financial Times, August 3. www.ft.com/content/8d194207-f6bf-4dde-b0fe-93cb85dfb8a0.
Fraisl, Dilek. 2024. “The Potential of Artificial Intelligence for the SDGs and Official Statistics.” PARIS21 Working Paper. April. www.paris21.org/sites/default/files/related_documents/2024-04/ the-potential-of-ai-for-the-sdgs-and-official-stats_working-paper_0.pdf.
Fraisl, Dilek, Linda See, François Fonteneau and Johannes Jütting. 2024. “AI through the lens of official statistics and the Sustainable Development Goals: The benefits and risks.” PARIS21 Discussion Paper 17. April. www.paris21. org/knowledge-base/ai-through-lens-official-statistics-and-sdgs-what-arebenefits-and-risks.
Fudurich, James, Jeff Mollins and Naveen Rai. 2024. “Experiments with High-Frequency Data and Machine Learning: Insights and Lessons.” Webinar, October 31. Toronto Association for Business and Economics and Canadian Association for Business Economics.
Goldfarb, Danielle. 2024. Real Time: Leveraging the Data Explosion for Better Policy. Canadian Standards Association Public Policy Centre. April. www.csagroup.org/article/public-policy/ real-time-leveraging-the-data-explosion-for-better-policy/.
Hale, Thomas. 2023. “China’s data ‘black box’ puzzles economists.” Financial Times, July 23. www.ft.com/content/f1ce1c09-b4fc-42cf-bc68-fb7d969cbbe0.
Kruger, Mark. 2022. “Mobility Gap Points to Contraction in November.” Yicai Global, December 2. www.yicaiglobal.com/opinion/mark.kruger/mobility-gap-points-to-contraction-in-november.
———. 2023. “A Tough Summer for China’s Youth.” Yicai Global, June 12. www.yicaiglobal.com/opinion/mark.kruger/a-tough-summer-for-chinas-youth.
MacroX. 2023. “Know Faster: Measuring Industrial Production in Real-Time with Alternative Data & AI.” MacroX (blog), April 28. https://macrox.ai/know-faster-measuring-industrial-production-in-real-time-withalternative-data-ai-2/.
Martínez, Luis R. 2021. “How Much Should We Trust the Dictator’s GDP Growth Estimates?” Becker Friedman Institute for Economics Working Paper No. 2021-78. July. https://bfi.uchicago.edu/wp-content/uploads/2021/07/BFI_WP_2021-78.pdf.
MariTrace. 2023. “Redrawing the map: observations on a year of conflict in Ukraine.” February 27. www.ww3.maritrace.com/post/redrawing-the-map-observations-on-a-year-of-conflict-in-ukraine.
Newhouse, David, Rachel Swindle, Shun Wang, Joshua D. Merfeld, Utz Pape, Kibrom Tafere and Michael Weber. 2024. “How Well Did Real-Time Indicators Track Household Welfare Changes in Developing Countries during the COVID-19 Crisis?” Policy Research Working Paper No. 10916. September. Washington, DC: World Bank Group. http://documents.worldbank.org/ curated/en/099505509182434892/IDU1091deb5e177bb145e01a8ed1ed897e538f47.
Oakford, Samuel, Lily Kuo, Vic Chiang, Imogen Piper and Lyric Li. 2023. “Satellite images show crowds at China’s crematoriums as covid surges.” The Washington Post, January 9. www. washingtonpost.com/investigations/2023/01/09/china-crematorium-covid-deaths/.
Pilgrim, Graham, Emmanuelle Guidetti and Annabelle Mourougane. 2024. “An ocean of data: The potential of data on vessel traffic.” OECD Statistics Working Paper No. 2024/02. Paris, France: OECD Publishing. https://doi.org/10.1787/34b7a926-en.
QuantCube Technology. 2023. “Insights into China’s reopening based on alternative data.” January 31. www.quant-cube.com/insights-contents/insights-into-chinas-reopening-based-on-alternative-data.
Ratledge, Nathan, Gabe Cadamuro, Brandon de la Cuesta, Matthieu Stigler and Marshall Burke. 2022. “Using machine learning to assess the livelihood impact of electricity access.” Nature 611: 491–95. https://doi.org/10.1038/s41586-022-05322-8.
Richter, Wolf. 2024. “Why We’ll Replace the Case-Shiller Home Price Index for Our Series, ‘The Most Splendid Housing Bubbles in America.’” Wolf Street, September 2. https://wolfstreet.com/2024/09/02/why-well-replace-the-case-shiller-homeprice-index-for-our-series-the-most-splendid-housing-bubbles-in-america/.
Statistics Canada. 2023. “Labour Force Survey Response Rates, September 2023.” Statistics Canada, October 27. www150.statcan. gc.ca/n1/pub/75-005-m/75-005-m2023001-eng.htm.
The Economist. 2022. “What online-search data say about China’s latest covid wave.” The Economist, December 27. www.economist. com/china/2022/12/27/ what-online-search-data-say-about-chinas-latest-covid-wave.
———. 2024. “The Chinese authorities are concealing the state of the economy.” The Economist, September 5. www.economist.com/briefing/2024/09/05/ the-chinese-authorities-are-concealing-the-state-of-the-economy.
Waight, Hannah, Yin Yuan, Margaret E. Roberts and Brandon M. Stewart. 2024. “Speaking with the State’s Voice: The Decade-Long Growth of Government-Authored News Media in China under Xi Jinping.” 21st Century China Center Research Paper No. 2024- 4. http://dx.doi.org/10.2139/ssrn.4812826.
White, Edward and Qianer Liu. 2022. “China’s disappearing data stokes fears of hidden Covid wave.” Financial Times, December 9. www. ft. com/content/abefb06e-a5a7-432b-85bf-b3250b53836f.