
WORLD DROUGHT ATLAS
WORLD DROUGHT ATLAS
in collaboration with

Publication details
This document should be cited as:
European Commission Joint Research Centre and United Nations Convention to Combat Desertification, World Drought Atlas [A. Toreti, D. Tsegai, and L. Rossi Eds], Publications Office of the European Union, Luxembourg, 2024, doi:10.2760/3842670, JRC 139691.
The full version of this Atlas is available online at: https://publications.jrc.ec.europa.eu/repository/handle/JRC139691
This URL links to the full online version of the Atlas, where the most updated content and data may be freely accessed.
Copyright notice and disclaimer
© European Union, 2024 © UNCCD, 2024
The views expressed in this publication are not necessarily those of the UN agencies involved in this project and of the European Commission. The designations and maps here employed and the presentation of material therein do not imply the expression of any official position of the UN agencies and of the European Commission. Unless otherwise indicated, the ideas and opinions expressed by the contributors do not necessarily represent the views of their employers. The publishers would welcome being notified of any remaining errors identified that the editing process might have missed.
The reuse policy of the European Commission is implemented by Commission Decision 2011/833/EU of 12 December 2011 on the reuse of Commission documents (OJ L 330, 14.12.2011, p. 39).
Except otherwise noted, the reuse of this document is authorised under the Creative Commons Attribution 4.0 International (CC BY 4.0) licence (https://creativecommons.org/ licenses/by/4.0/). This means that reuse is allowed provided appropriate credit is given and any changes are indicated.
Reuse of photos/figures/diagrams/data with the source: AAPCAD-JRC, 2024 is authorised.
For reuse of photos/figures/diagrams/data of a third-party source (i.e. any other than AAPCAD-JRC, 2024) permissions must be sought directly from the source/copyright holders. Luxembourg: Publications Office of the European Union, 2024
World Drought Atlas
JRC 139691
EUR 40104
PDF:
ISBN 978-92-68-21788-7
ISSN 1831-9424
doi:10.2760/3842670
KJ-01-24-131-EN-N
PRINT:
ISBN 978-92-68-21789-4
ISSN 1018-5593
doi:10.2760/8057111
KJ-01-24-131-EN-C
Printed
Please note: Lead Authors and Conrtibuting Authors for Case Studies in PART 3: Regional Perspectives are named in the relevant Case Study.
Cartographic Representations
Due to the resolution of the underlying data which is often still too large to represent small islands, the maps in this Atlas might not or not always represent a number of small islands. All world maps are represented according to the Robinson projection. All regional projections of World Drought Atlas data are Universal Transverse Mercator (UTM), apart from:
• United States of America (pp. 106 – 107):
USA Contiguous Albers Equal Area Conic
• South America (pp. 114 – 117)
South America Albers Equal Area Conic
• Southeast Asia (pp. 132 – 133)
Asia South Equidistant Conic
• Yangtze Basin (p. 134)
Asia South Lambert Conformal Conic. French overseas departments (including French Guiana) are part of France in the GISCO regions, therefore they display the data for France.
Country boundaries
https://ec.europa.eu/eurostat/web/gisco/geodata/ reference-data/administrative-units-statistical-units
Design and graphic support
Final design and graphic support by Lovell Johns Limited, 10 Hanborough Business Park, Long Hanborough, Witney, Oxfordshire, OX29 8RU, United Kingdom. http://www.lovelljohns.com
Lead Authors
Andrea Toreti
Daniel Tsegai
European Commission, Joint Research Centre, Italy
United Nations Convention to Combat Desertification
Tessa Maurer Cima Research Foundation, Italy
Edoardo Cremonese Cima Research Foundation, Italy
Lauro Rossi Cima Research Foundation, Italy
Marthe Wens IVM, Vrije Universiteit Amsterdam, Netherlands
Hans de Moel IVM, Vrije Universiteit Amsterdam, Netherlands
Anne-Sophie Sabino Siemons IVM, Vrije Universiteit Amsterdam, Netherlands
Contributing Authors
Francesco Avanzi CIMA Research Foundation, Italy
Alice Baronetti Institute of Geosciences and Earth Resources, National Research Council, Italy
Davide Bavera Arcadia SIT, Italy
Andrej Ceglar European Central Bank
Michele D'Amico University of Milan, Italy
Ayan Fleischmann Mamirauá Institute for Sustainable Development, Tefé, Amazonas, Brazil
Tim Foster University of Manchester, UK
Michel Isabellon Cima Research Foundation, Italy
Sarah McKenzie World Vision Australia
Michele Meroni Seidor, Italy
Mirco Migliavacca European Commission, Joint Research Centre, Italy
Robert Oakes United Nations University, Institute for Environment and Human Security
Hellen Owuor World Vision Kenya
Anupriya Pandey WOTR India
Dionisio Perez Universidad de Salamanca, Spain
Nicolò Perello Cima Research Foundation, Italy
Reviewers
Amir AghaKouchak Department of Civil and Environmental Engineering, University of California, Irvine, CA, U.S.
Roland Baatz Leibniz Centre for Agricultural Landscape Research (ZALF), Germany
Mariana M. de Brito Department of Urban and Environmental Sociology, Helmholtz Centre for Environmental Research, Leipzig, Germany
Christophe Lavaysse Institut des Géosciences de l'Environnement, CNRS-UGAINRAE-IRD-Grenoble INP, Grenoble, France
Jose A. Marengo National Center for Monitoring and Early Warning of Natural Disasters CEMADEN, Sao Paulo, Brazil
Acknowledgements
Thomas Chatzopoulos
Crow Canyon Archaeological Center
Adelaide Dura
Giovanni Forzieri
Fabian Gans
Saraya R. Hamidi
Henrik Hartmann
Caroline King
Editors
Andrea Toreti
Daniel Tsegai
European Commission, Joint Research Centre, Italy
United Nations Convention to Combat Desertification
Lauro Rossi Cima Research Foundation, Italy
Juan Acosta Navarro European Commission, Joint Research Centre, Italy
Arthur Hrast Essenfelder European Commission, Joint Research Centre, Italy
Danila Volpi European Commission, Joint Research Centre, Italy
Davide Cotti United Nations University, Institute for Environment and Human Security (UNU-EHS), Germany
Edward Sparkes United Nations University, Institute for Environment and Human Security (UNU-EHS), Germany
Michael Hagenlocher United Nations University, Institute for Environment and Human Security (UNU-EHS), Germany
Antonello Provenzale Institute of Geosciences and Earth Resources, National Research Council, Cima Research Foundation, Italy
Christa M. Pudmenzky University of Southern Queensland, Australia
Roger Pulwarty National Oceanic and Atmospheric Administration, U.S.
Ananya Ramesh United Nations University, Institute for Environment and Human Security
Felix Rembold European Commission, Joint Research Centre, Italy
Guido Schmidt FreshThoughts Consulting, Austria
Aderita Martins de Sena World Health Organization
Roger C. Stone University of Southern Queensland, Australia
Luca Trotter CIMA Research Foundation, Italy
Kees van der Geest United Nations University, Institute for Environment and Human Security
Anne van Loon IVM, Vrije Universiteit Amsterdam, Netherlands
Manuel Veiga European Commission, Joint Research Centre, Italy
Yvonne Walz United Nations University, Institute for Environment and Human Security
Saskia E. Werners United Nations University, Institute for Environment and Human Security
Dionisio Perez Universidad de Salamanca, Spain Felix Rembold European Commission, Joint Research Centre Andreia Ribeiro Department of Compound Environmental Risks, Helmholtz Centre for Environmental Research - UFZ, Leipzig, Germany
Aderita Martins de Sena World Health Organization
Pablo Spennemann Consejo Nacional de Investigaciones Científicas y Técnicas (CONICET) - Servicio Meteorológico Nacional (SMN), Argentina
Robert Stefanski World Meteorological Organization
Clare Wylie Loughlin
Diego Magni
Morrison Mast
A. Shuau Obofili
Thomas Richard
Mark Schauer
Gregory Verutes
Daniel Viviroli
United Nations Convention to Combat Desertification (UNCCD)
Drought has challenged and afflicted communities throughout history. Albeit not a new phenomenon, drought is also not going away. Instead, when we observe the droughts that have affected communities in recent years, we cannot deny their striking frequency, duration, or intensity, nor their prevalence – affecting every continent on the globe. Exacerbated by climate change, mismanagement of vital resources - such as land and water- and negligently planned development, the future looks challenging. Estimates suggest that, by 2050, three of every four of us worldwide may be impacted by droughts.
Growing up in the Trarza region of southern Mauritania, experienced drought and its debilitating impacts on families, communities and national development firsthand. I vividly recall the devastation caused by a drought in my birthplace in the 1970s. First, our water supply dried up. Then our crops failed. And then, our livestock perished. For months, famine loomed over our village. Instead of subsiding, drought has regularly returned to my community since then, causing displacement, disruption and sometimes, death. By experience, the impacts of drought are not limited to land. Drought has a rippling effect: devastating crops and the water supply; every dry spell leaves families ever-more vulnerable to the next episode of drought. And, with each drought, dreams and lives of millions are shattered, leaving behind vulnerable people in search for a better future. While droughts appear to be local phenomena, their consequences can have global repercussions, amplifying forced migrations and conflicts over access to increasingly scarce resources.
And yet, glimmers of hope remain. While society remembers disasters as tragic, the communities experiencing them firsthand not only remember them too well, but they also learn from them and build their resilience.
We must stop believing that this only happens to others. We must stop being only reactive to drought; instead, we should proactively put in place measures to mitigate its consequences and reduce its devastating impacts – in society, nature and economy–which, together, stifle development and curtail advances made towards the Sustainable Development Goals.
This World Drought Atlas serves as a wake-up call, offering insight into the stark realities of drought and calling for urgency in our response. It reminds us that drought lacks regard for borders, leaving no region or country, regardless of their level of development, immune to its impacts. It reminds us that our actions similarly have far-reaching consequences – for all of us. As the world becomes more interconnected, so do the risks we share. To manage these risks, it is critical to understand how our individual and collective decisions and actions, as well as our inaction, influence the risks we face.
This publication comes at a crucial time. At the sixteenth Conferences of the Parties (COP16) to the United Nations Convention to Combat Desertification (UNCCD) held in Riyadh, Saudi Arabia from 2 – 13 December 2024 leaders from around the world have the unique opportunity to change the course of history towards drought resilience. By challenging governments, business leaders and decision makers at all levels to radically rethink decision-making processes, and set in motion more effective, wholeof-society strategies to manage and mitigate drought risk, the Atlas provides decision makers with a systemic perspective on drought risks and impacts, illustrates how risks are interconnected across sectors and offers guidance on proactive and prospective drought management and adaptation. Importantly, it also urges an inclusive approach by, for example, democratising water governance and forging partnership with the stewards and caretakers of the world’s vast land and rich biodiversity. It is vital to place those who actively manage and care for land and water at the centre of all discussions and actions, calling on their firsthand insight and expertise to shape policies, strategies and programming. Learning from longstanding traditional/indigenous knowledge, we can develop successful mitigating strategies and resilience-building measures for the collective pathway forward.
The Atlas supports the view that, by investing in resilience and the innovation that accompanies it, we can unlock new opportunities and drive change around the world. Not only is it an effective and economically efficient way to allocate resources, it is also a critical lever to set in motion more positive ripple effects across communities and sectors worldwide.
Experiencing drought firsthand shaped my life, motivating me to commit to improving policy and practice, to help communities around the world better prepare for, and respond to, drought. Firsthand experience tends to have that effect on people – teaching us, through hardship, what not to do again. As the Executive Secretary of the UNCCD, hope that you may learn from my experience and that of my home community, taking concrete action and putting in place mitigating measures so that drought may not befall you and your community tomorrow or anytime in the future.
There is no time to lose. I call on all nations, and in particular the Parties to the UNCCD, to carefully review the findings of this Atlas and take action to help shape a more resilient, more secure and more sustainable future that prioritises the needs of people, society, and the planet.

Ibrahim Thiaw Executive Secretary of UNCCD and Under-Secretary-General of the UN
European Commission, Joint Research Centre
Drought is a global threat and a global challenge.
Almost all regions of the world are at risk of drought. The impact of droughts can be long term. They have both direct and indirect impacts, with cascading effects and shocks, that we still do not completely understand and cannot easily assess. Droughts evolve on several different spatial and temporal scales, lasting weeks (in the case of flash droughts) to months and even years. Their effects are not always immediately visible and this makes economic and financial assessment very complex.
The severity of threat is nonetheless clear. In recent years, extreme droughts have clearly highlighted the threat these hazards pose to population, economies and ecosystems. They have served as a wake-up call, revealing the limited effectiveness of the actions taken until now. The 2018 and 2022 droughts severely affected European agriculture, the energy sector, river transport as well as key natural systems providing essential services we rely on. We witnessed unprecedented combinations of warm temperature anomalies and persistent lack of precipitation, especially in spring and summer. In 2022, a humanitarian crisis was also triggered by persistent multi-annual drought in East Africa.
Again this year, in 2024, we are shocked by the vast extent of the drought affecting South America and the Amazon, a vital region of our planet that is essential for our climate change mitigation ambition.
Drought is not just a climate extreme. Human factors associated with the use and management of land and water can exacerbate and amplify droughts and their impacts. Unsustainable water use, water competition among different sectors, poor land management and not properly accounting for water resources are some examples of these human factors.
It must be clear to us all that the water crisis is linked to the climate and the biodiversity crises. Yet, much is still in our hands. We need to plan water resources adequately and avoid concurrent peaks in water demand. We need to implement sustainable land use and management practices and promote cooperation among the different sources of competition for land and water resources.
We need unprecedented levels of cooperation among countries, economic sectors and populations to improve drought resilience and more generally water resilience. The World Drought Atlas is unequivocal in conveying this message and seeks to raise awareness at all levels. It shows that sustainable solutions do exist if we boost actions now and if we step up cooperation.
International Drought Resilience Alliance (IDRA)
Quality information and data are at the basis of good governance. However, humanity’s knowledge on how drought risks are changing in a warming planet —and what that means for our communities, economies and ecosystems— is often fragmented and abstract.
We, on behalf of the International Drought Resilience Alliance (IDRA) and its more than 70 member countries and organisations, are proud to support the publication you have in your hands: the most complete global knowledge product on drought to date, created to support decision-makers in understanding what a new era of droughts means for social prosperity, economic dynamism and political stability in a globalised world.
Through telling data, illuminating visuals and curated case studies, the Global Drought Atlas shows the extent to which drought risks are globally networked through issues like trade and forced migration; highlights the impacts of drought on crucial economic sectors; and explains what we know works to build resilience to future droughts.
One after the other, the dozens of maps in the Atlas show that no country is immune to drought and that all can attune their policies and investments to better prepare for it.
Around 85% of the people impacted by drought live in low- and middle-income countries and agriculture is often hardest hit. But time and again, the Atlas brings to the fore the systemic and interconnected nature of drought and how its impacts expand across international supply chains, displacement pathways and energy grids.
Droughts are risks, but they needn’t be disasters. From IDRA, we see the Atlas as a powerful new resource to build political momentum for proactive drought risk management ahead of UNCCD COP16 in Riyadh. We already have the knowledge and tools to build our resilience to harsher droughts. It is now our collective responsibility, and in our best interest, to take action for a drought-resilient future.
In my role at the European Commission’s Joint Research Centre, I see every day how research and innovation can facilitate solutions to pressing challenges. These efforts must also go together with harmonised policy actions and initiatives. In this context, I am glad to see the recent establishment of the working group on water scarcity and drought of the European Union as an open and inclusive space to share knowledge, best practices and cooperate. We can also look forward to the water resilience strategy of the European Union that will be developed and launched in the coming months. Cooperation and actions extend well beyond the European Union. Let me highlight the International Drought Resilience Alliance and the Integrated Drought Management Programme, as well as the commitments taken during the last UN Water conference. Data are essential in building knowledge and the management of risks replies upon monitoring and forecasting systems. Let me therefore highlight the importance of the Copernicus Programme and the role of services such as the Emergency Management service. These provide homogeneous, free data and information every day and for every region of the world.
A lot has been already done and much remains to be accomplished. The World Drought Atlas signals the scale of the challenge that lies ahead and helps map out the pathways for enhanced global cooperation required to meet this challenge together.

Bernard Magenhann Acting Director General of the
European Commission, Joint Research Centre

Morán State Secretary of Environment of Spain, on behalf of the [cochairs of the] International Drought Resilience Alliance (IDRA)

Hugo
Daouda Ngom Full Professor of Ecology, Minister for the Environment and Ecological Transition, Senegal
Executive summary
Driven by changes in climate, land and water use and management, human population and consumption patterns, droughts worldwide are increasing in frequency, intensity, spatial extent and duration. The last decade has seen extreme, persistent, and recurrent droughts affecting large regions of the world and their populations, economies, and ecosystems. Despite these impacts and the growing risk, droughts have not received commensurate attention with respect to other hazards that have direct and immediately visible impacts. Response and preparedness efforts have not been enough to address the increasing threat posed by drought.
Droughts directly impact up to 55 million people annually and are among the costliest and deadliest hazards globally. They impact critical systems including drinking water supply, agriculture, energy supply, trade and navigation, while also threatening ecosystem health and the services they provide. This Atlas aims at raising awareness of and bring attention to the diverse, multisectoral, and interconnected impacts and showcase solutions to anticipate, prepare for, and adapt to drought. While drought risk is growing worldwide, including in regions not traditionally associated with droughts, the impacts are not felt evenly. Low-to-middle income countries are often more vulnerable to drought and face greater social impacts. In 2022 and 2023 alone, 1.84 billion people, nearly 1 in 4 worldwide, were affected by drought, with about 85 % of them in lowand middle-income countries. Despite the scale of the threat, drought risk management is underfinanced, which limits the deployment of policies and actions.
The nature of drought presents challenges for scientists, practitioners, policymakers, and communities. Drought is a systemic phenomenon that cuts across sectors and systems, creating compound and cascading impacts that are difficult to estimate and predict. Even what constitutes drought may vary from one region, biome, and society to the next, as the experience of a dry period as a drought depends on the adaptive capacity and resources of the local ecosystem and human communities. While a temporary water deficit is the basis of droughts, sector-specific drivers characterise the exposure and vulnerability of communities and systems.
From a spatial and temporal perspective, droughts are not clear-cut. The interconnected nature of ecosystems, transportation corridors, and the global economy means that drought impacts can propagate far beyond the region and the time period in which the hazard occurred. The onset of droughts varies greatly, with some events resulting from slow and continuous accumulated deficits and others, especially flash droughts, emerging quickly and often unpredictably. Recovery is often much slower than the onset and can trigger long-term carry over and lag effects that are difficult to monitor and may not become clear for months or even years afterwards.
Increasing the complexity of drought and its impacts is the mitigation/amplification role of, e.g., regulatory policies and actions around land and water use and management, physical gray and green infrastructure. While this complexity increases the challenge for governments and communities, it also gives different entry points for action. Drought risk is a key factor of the water crisis which is intimately connected with the climate and biodiversity crises and which increases together with land degradation and aridification. Climate change is a major factor in the increasing frequency, duration, and intensity of droughts. It also increases the possibility of compound and concurrent hazards such as heatwaves, flash floods, and wildfires, themselves intensified by climate change. Meeting international climate mitigation goals is therefore critical to avoid worst-case scenarios.
Achieving drought resilience, including supporting governments in the development of drought risk management and adaptation plans, is central to international efforts. Drought resilience directly supports a number of Sustainable Development Goals, particularly those related to access to basic services and resources (e.g. no poverty, zero hunger, good health and well-being, clean water and sanitation, and clean and affordable energy) and ecosystem health (e.g. climate action, life below water, and life on land). Indirectly, drought resilience
also supports quality education, gender equality, decent work and economic growth, reduced inequality, sustainable cities and communities, peace, justice, and strong institutions. Responding to the challenge of drought calls for a wholeof-society approach. This requires shifting from reactive crisis management to proactive, prospective and systemic risk management. On an international level, enhanced cooperation, knowledge-sharing, and resource mobilisation are critical to support governments in building resilience. To this end, the Integrated Drought Management Programme was established in 2013 and the International Drought Resilience Alliance was launched in 2022. Furthermore, in 2018, the UNCCD established the Drought Initiative, focused on preparedness systems, working at the regional level to reduce risk, and providing a toolbox to boost resilience. At the regional scale, e.g., the European Union recently established the Working Group on water scarcity and drought.
Building a whole-of-society approach implies collaborating both vertically across different levels of government and stakeholders and horizontally across sectors. Early warning systems and risk assessments under future climate conditions are key tools, but cannot fully account for all possible variables and will always be affected by intrinsic unknowns. As a result, policymakers should be familiar with best practices for decision-making under uncertainty. Pathways approaches can facilitate flexible and time sensitive implementation of risk management and adaptation measures, creating synergies between sectors and avoiding unintended negative consequence.
This Atlas is a visual resource aiming at conveying in an intuitive and direct way all dimensions of drought. It provides an overview of drought as a phenomenon, its impacts on critical systems, concrete case studies worldwide, and examples of risk management and adaptation. The Atlas is not intended to be all encompassing but to frame challenges and responses in such a way that policymakers feel equipped to take steps and actions towards drought resilience and to seek out further information where needed.
The systemic nature of drought is highlighted in Chapter 1 using a conceptual framework that elucidates its elements, including interconnectedness across scales. The connection of drought to, e.g., water security, aridity, and desertification, as well as the importance of ongoing climate and social changes, is also discussed.
Chapter 2 presents drought impacts on different critical systems: water supply, agriculture, hydropower, inland navigation, and ecosystems. Each section is organised by themes that have global importance, and includes a discussion of relevant metrics. Each system is accompanied by an impact chain, a conceptual risk model that aims to visualise the most relevant drivers. The chapter closes with a discussion of cascading and cross-sectoral impacts, including food security, human mobility, conflict and cooperation, human health, and land degradation.
Section 2.1 discusses the implications of drought for public water supply, highlighting how the impacts vary depending on the supply system and discusses how drought can negatively impact not only the quantity of available water but also the quality. These impacts are discussed in the context of sanitation, hygiene and public health. The section further addresses how political and economic drivers can mitigate or exacerbate impacts on populations and communities. The gendered effects of drought and water supply are highlighted, as is water justice. Finally, it discusses the particular risks of urban areas facing water shortages.
Section 2.2 addresses drought implications for agriculture, specifically irrigated and rainfed crops as well as livestock. The section draws a connection between food systems and their water footprint, including a discussion of virtual water transfers and the irrigation efficiency paradox. Particular attention is paid to the growing phenomenon of flash droughts, which can cause unexpected crop yield losses and failures. Socioeconomic factors, in particular for smallholders, are discussed together with future risks.
Section 2.3 addresses potential drought impacts on hydropower, an energy source that is at once vulnerable to droughts and critical for meeting carbon reduction goals. It includes an overview of current global dependence on hydropower and the impact of specific past droughts. Vulnerabilities, risks, and impacts are discussed from both an environmental and economic standpoint. Finally, the section addresses the impacts of compound events such as heatwaves or floods.
Inland navigation is discussed in Section 2.4 from both a global trade and local socio-economic perspective. For large waterways, the impact of drought is discussed in terms of shipping with implications on global supply chains and, by extension, the global economy. Smaller waterways are also discussed given their importance for local communities, especially in roadless areas where people rely heavily on this natural infrastructure for transportation, trade, and access to education, food, and medicine.
Section 2.5 deals with ecosystems through the lens of some of the critical pillars that measure ecosystem health and the benefits they provide to human society. These include biodiversity, carbon cycling, and vulnerability to tipping points. Emphasis is placed on the ways drought can negatively impact these aspects, but also on how supporting healthy ecosystem function can help achieve drought resilience. Particular attention is given to soil carbon and to the ways drought can interact with other natural hazards that threaten ecosystems.
Section 2.6 showcases cross-sectoral and cascading effects to better understand and assess systemic drought risk. It explores the shared drivers of risk in relation to land conditions, behavior and demand, socio-political context, infrastructure interventions, and water resource management. This section also draws attention to cascading effects that may not be the direct result of drought but which, when combined with other natural or social stressors, can create widespread impacts.
Chapter 3 focuses on regional case studies and describes how drought can manifest in different parts of the world depending on climate, ecosystems, governance, and economic and social resources. These case studies were primarily written by researchers local to or based in those regions, who offered their perspectives on recent and relevant events, their impacts, and lessons learned from preparedness and response actions. This chapter complements the perspective offered in Chapter 2 by offering examples that are geographically specific but multisectoral and comprehensive. Chapter 3 facilitates knowledge sharing across different areas that face similar challenges. The chapter aims for global, though not exhaustive, coverage and includes the special cases of Small Island Developing States and urban areas.
Chapter 4 introduces important concepts and frameworks to understand comprehensive drought risk management and explore different options using a pathways approach. It is based on examples and best practices highlighting new ways of conceptualising drought management, rather than attempting to cover all possible actions and policies. The chapter discusses frameworks to move away from reactive management towards forward-looking proactive and prospective approaches.
Droughts, their risks and impacts are not stationary but evolve. Although the information provided here captures the current global state of drought, the overall findings and the recommendations have general validity. The Atlas represents a resource to raise awareness, enhance cooperation and increase action towards drought resilience. It is a tool to promote the continuous policy development in dialogue with scientific innovation, and local and traditional knowledge. Drought as a hazard will be a perpetual reality across the globe; drought as risk need not be.
KEY MESSAGES:
Droughts emerge from a combination of natural climate variability, anthropogenic climate change, and human mismanagement of water and land resources It is not just the absence of rain, snow or soil moisture, droughts are intimately related to human actions. Sustainable consumption and production practices to protect and manage land are a critical component of drought management.
Droughts affect human populations, multiple sectors, and ecosystems in a complex way and over different spatial and temporal scales. They affect almost every part of the globe and their impacts can cascade through interconnected systems to reach geographically distant areas. Addressing drought requires systemic solutions.
Drought is a daunting challenge as its effects on people’s lives and livelihoods and the ecosystems on which they depend are devastating. Through innovation, commitment and solidarity, drought risks can be successfully managed.
Climate models project more frequent and severe droughts in the future and evidence of their increasing impacts calls for immediate actions at all policy levels, international efforts and commitments.
Investment is needed to fill the knowledge gaps and reduce uncertainties in droughts forecasting and risk assessment. Enhanced early warning systems are essential to reduce risks and achieve resilience.
The complexity of drought risk demands cross-sectoral policies accounting for regional diversity, leveraging local knowledge and promoting communities' engagement.
Unprecedented cooperation among sectors and countries is necessary to achieve drought resilience. Sharing knowledge, data, and best practices is essential. Key international and regional initiatives have been recently launched to support nations in the adoption of drought management and adaptation plans.
To successfully manage drought risk, communities, regions and countries must adopt proactive and prospective approaches to drought risk management and adaptation. Preventive measures such as water management, early warning systems and innovative agricultural practices reduce drought impacts and human vulnerability. Combining effective mitigation practices and adaptation pathways can create synergies that support drought resilience.

PART 1: The complexity of drought and drought risks
Droughts are increasingly and more severely affecting the lives and livelihoods of people and the integrity of ecosystems worldwide. Droughts emerge from the interaction of natural climate variability, climate change and human water resource management, materialising in unexpected ways at all latitudes and sparing almost no productive sector. This complexity is still a challenge to understand, monitor and respond to. A systemic perspective can help highlight how different drivers of hazard, exposure, vulnerability and their root causes combine to create drought risks. Such an approach is especially critical for understanding how these drivers disrupt interconnected systems through direct, cascading and response effects, felt across diverse temporal and geographical scales. Systemic measures are needed to find sustainable solutions to drought risks together with risks connected with other hazards, with the objective of achieving water resilience and security for all.
1.1 What are droughts?
Droughts are prolonged periods of unusually low water availability, leading to an imbalance in water availability, quality and demand. They are a complex hazard, resulting from a combination of climate processes such as lower precipitation, higher evapotranspiration and anomalous snowmelt, as well as human processes, related to water abstraction and use, land management and use. These processes are a manifestation of natural climate variability, anthropogenic climate change and unsustainable management of natural resources. Droughts propagate through the water cycle, from meteorological
water deficits to soil moisture, hydrological and groundwater deficits. The further droughts travel through the water cycle, the more they are influenced by land and water resources management1. Unequal distribution or mismanagement of water before or during droughts causes or worsens water deficits, leading to water of insufficient quantity and quality. It is the competition over scarce water resources during droughts that causes harmful effects on people and nature. Far from being solely climate phenomena, droughts are in fact something that we contribute to2
Map 1: Major drought events, 2022 – 2024
Examples of major drought events that occurred between 2022-24, with examples of impacted systems. Red areas represent the approximate spatial extent of drought impacts. The boundaries of these shaded areas are blurred to indicate that droughts do not have finite geographic boundaries and there can be considerable uncertainty in determining the extent of impacts.
1.2 How do droughts impact economies, ecosystems and society?
Droughts often lead to complex impacts and risks that extend across ecosystems, communities, sectors and societies. Regardless of where they strike in the world, droughts affect the sectors and systems we depend on. Droughts, in combination with ineffective, unsustainable or unequal water management, threaten the lives and livelihoods of millions of people1,2,3
They worsen food crises, harm human health, strain water and energy supplies, constrain or disrupt industrial activities and alter the functioning of ecosystems. Additionally, droughts can compound with other hazards, such as heatwaves and wildfires, or can be followed by other extremes, such as floods or landslides, further affecting people’s health, degrading land and harming ecosystems. These impacts most often affect the poorest, most vulnerable and more marginalised people in society, increasing inequality and hampering progress towards the United Nations’ Sustainable Development Goals (SDGs).
Droughts affect more people globally than many other hazards. Data from the Emergency Events Database (EM-DAT) shows that between 2000 and 2023, droughts accounted for over one third of the total number of affected people, despite making up only 3 % of all recorded hazard-induced disasters. This illustrates the extensive reach and severity of droughts.
In just the last three years, extremely impactful droughts were reported on virtually every continent (see Map 1, below)
As visible on the map, drought impacts not only extended to multiple countries, but also affected many different sectors and systems, including agriculture, water supply, hydropower, ecosystems and inland navigation.
Droughts are amongst the most economically costly hazards1,3 causing billions of dollars in losses annually2 They affect countries’ economic growth and overall development in both the Global North4,5 and the Global South6,7 Economic effects are particularly felt in the agricultural sector8

Moreover, the economic impacts of droughts are likely an underestimate, as many indirect costs, for instance related to human health or ecosystems, are rarely accounted for. Moreover, due to the interconnected nature of ecosystems and human societies, droughts can trigger cascading effects across time and space, which are often not even attributed to the drought event itself and hence difficult to capture3 For instance, impacts of drought on agricultural systems in one country can lead to an increase in food insecurity in another due to global food trade and, if vulnerable groups are impacted, also contribute to human mobility (see Section 2.6.4). This systemic nature of drought risks calls for a comprehensive approach to understand, manage and adapt to them.
1.3 Understanding the systemic nature of drought risks and impacts
This Atlas recognises the complex, interconnected and systemic nature of drought risks and impacts. It builds on a recent conceptual drought risk framework by Hagenlocher et al. (2023)1 (see Fig. 1, below) which expands on the Intergovernmental Panel on Climate Change (IPCC) risk paradigm of hazard, exposure and vulnerability.
This framework provides a comprehensive understanding of drought risks and impacts, divided into three distinct parts:
A) Components and drivers of drought risks and impacts
B) The systemic nature of drought risks and impacts
C) A systemic perspective on solutions Fig. 1: A conceptual framework of drought risks and impacts from a systemic perspective. Components and drivers of drought risks and impacts.
Adapted by LJ for the World Drought Atlas, from Hagenlocher et al., 2023.
A | COMPONENTS AND DRIVERS OF DROUGHT RISKS AND IMPACTS
Drought risks result from the interaction of multiple drivers
ROOT CAUSES
Socio-economic and political conditions, structures, processes, choices & values
SEE SECTIONS 2.1 – 2.5 FOR SECTORAL IMPACTS
B | THE SYSTEMIC NATURE OF DROUGHT RISKS AND IMPACTS
Drought risks compound and cascade through systems and scales
C | SYSTEMIC DROUGHT RISK MANAGEMENT AND ADAPTATION
Solutions to drought risks need to account for the system's structure and functioning
SEE SECTION 2.6 FOR CROSS-SECTORAL IMPACTS AND CASCADING EFFECTS
1.3 Understanding the systemic nature of drought risks and impacts (cont'd)
A Components and drivers of drought risks and impacts (see Fig. 1, Panel A on page 14)
To fully understand how drought risks and impacts manifest, it is necessary to untangle the complex web of interrelated drivers of hazards, exposure, vulnerabilities, as well as the root causes that give rise to them.
Droughts are not just natural hazards
Drought hazards involve multiple interacting climate and hydrological processes that develop as a manifestation of natural variability, human-induced climate change and unsustainable water use. While droughts are often associated only with rainfall, they can also be related to other processes. For example, they can be caused by a combination of lack of precipitation and high temperatures, lack of snow, glacier melt, erratic timing of rain or runoff. Moreover, they involve non-linear hydrological processes leading to soil moisture anomalies, reduced reservoir and streamflow levels and low groundwater storage.
The most well-known sign of a drought hazard is a lack of precipitation. Monitoring this variable forms the basis of many indices used to describe the severity of drought hazard and predict its impacts. However, focusing solely on precipitation fails to account for the complex interplay between other environmental factors (e.g. evaporation rates and soil moisture) and the significant role human activities play in causing water shortages. Therefore, understanding drought hazards and their propagation requires a broader perspective.
Drought hazard is a relative concept, as it refers to conditions that are “drier than normal". The timing, duration and intensity of these conditions are crucial in determining their impacts. This makes capturing all dimensions of drought hazards with a single metric difficult. Instead, multiple indicators should be assessed to provide a comprehensive picture, and a wealth of them exist that are suited to inform the many different facets of drought hazard. Among these, precipitation indices can provide information on anomalies in rainfall patterns; precipitation and evapotranspiration indices can show the impact of temperatures; soil moisture anomaly indices can gauge water availability for crops, and low flow indices can detect the effect on surface hydrology (stream flows).
To effectively evaluate drought hazards, it is essential to establish a baseline or threshold, i.e. an average amount of water that is typically available in a region or system under study and on which ecological functions and human activities are dependent. This baseline can vary seasonally. For example, in monsoon climates more rain is expected in the wet season than in the dry season and agricultural activities are adjusted accordingly. Therefore, the drought hazard baseline should account for these seasonal variations, being set higher during the wet season than during the dry season. A drought hazard can be understood as a negative departure from this baseline, which can further be qualified in terms of duration (how long does the deficit last?), severity (how far below the normal value?) and intensity (the ratio between severity and duration). Moreover, drought hazards can be influenced by previous impacts, which linger through carry-over or legacy effects, for example on reservoir storage or soil conditions.
Identifying the onset and the end of a drought is not an easy task. The end of a drought is not unequivocally defined, as it depends on whether the focus is more on the meteorological aspects (e.g. return to normal precipitation), hydrological aspects (recovery of the accumulated deficits in surface and groundwater storage), or impact aspects (recovery of ecosystems and societal impacts). Adding to this complexity, temporal dynamics of drought hazards require new approaches and tools to monitor, evaluate and understand. In particular, flash droughts have been recognised as suddenonset, extreme events which are characterised by a rapid intensification of drought conditions (lack of precipitation, above-average temperatures and soil moisture decline) in a time frame as short as a few weeks2 On the other end of the spectrum are megadroughts i.e. prolonged, multi-year droughts that are exceptional in terms of severity, duration, or spatial extent when compared to other regional droughts.
Exposure
to
drought risks can be direct or indirect
Given the critical reliance that people, ecosystems and many livelihoods and productive activities have on water availability, the aspects of life that are exposed to droughts are practically countless. Currently, an estimated 2.3 billion people face water stress3 Climate change and population growth are expected to significantly increase the number of people exposed to drought hazards in the coming decades4 This increase is expected mostly across the African continent5 The exposure of people to drought hazards often depends on the exposure of the sectors and systems that their lives and livelihood depend on. For instance, in agriculture and food systems, exposure can be determined by the amount and value of croplands and/or livestock in drought-affected areas. As shown in Fig. 1, Panel B on page 15 drought exposure can also be indirect. This means that regions not directly affected by drought hazards can still experience cascading impacts as a result of sector and system interdependencies. For example, many communities rely on agricultural products grown elsewhere. This constitutes a “virtual water trade", which can expose these communities to the impacts of drought, while not living in the area that is directly affected by it. In the past few decades, this trade has increased substantially and has contributed to a shift in exposure to environmental and water risks (including droughts) from production to consumption areas6 Indirect exposure to drought at the global level can significantly impact the industrial sector as well. Water-intensive production lines are vulnerable to local drought conditions, potentially causing disruptions that affect multiple dependent industries worldwide, for instance in the advanced technology sector. This indirect exposure can also manifest itself between upstream and downstream areas, especially as water uses in the former can heavily affect water availability in the latter7
Vulnerability to drought risks involves the entire system
Vulnerability is the part of drought risk that explains how likely something or someone is to be harmed when a drought occurs8 It is driven by a complex interplay of socioeconomic, physical and governance-related factors. Vulnerability considers both the sensitivity/susceptibility of people, communities, sectors and systems (including ecosystems) to droughts as well as their capacity to cope with it and adapt to changing conditions. Vulnerability to drought can manifest at the individual level, such as in farmers’ lack of financial means necessary to avoid or overcome impacts; at the community level, such as if alternative water sources are available and can be utilised; or for entire sectors or systems, such as the number of droughttolerant species in a biome.
Inequality often increases vulnerability. Inequality can limit access to resources, information, technology and aid. Sometimes, it even causes drought impacts, such as when privileged groups overuse dwindling water resources, affecting the most vulnerable9 Vulnerable groups suffer the most from drought hazards and their losses are often not fully accounted for, obscuring the true extent of impacts10 In ecosystems, vulnerability often results from the interaction between natural characteristics and human pressures11. Additionally, policies and decisions in managing water resources play a major role in determining vulnerability to drought, in some cases even reinforcing existing inequalities9
Root causes influence every component of drought risks
Underlying root causes influence all components of drought risks, i.e. hazard, exposure and vulnerability. For instance, in some regions farmers might be forced to cultivate marginal lands, with reduced productivity and higher vulnerability to drought risks, due to long-standing inequalities in land tenure rights.
Once drought risks manifest as actual impacts, they can create feedback loops that alter the state of other risk components, increasing the likelihood of future drought impacts. For example, ecosystems can suffer long-term damage, making them more susceptible to future droughts. Understanding these systemic interactions is crucial for managing and adapting to drought risks effectively.
Water security
Understanding root causes
Risk drivers such as poverty, social inequities, power structures, demographic development, land degradation and conflicts aggravate hazards, exposures and vulnerabilities. These risk drivers do not just emerge from nowhere, but stem from structural conditions as well as social, economic, cultural and political conditions, practices, priorities, choices and values. We can understand these structural conditions as root causes of risks and vulnerability. For example, legacies of colonialism have created vast inequality and deep power imbalances across societies in the world. In order for risk management to be effective and sustainable, it is imperative to comprehend and proactively aim to address root causes of risks.
B | The systemic nature of drought risks and impacts (see Fig. 1, Panel B on page 15)
Direct drought risks and impacts occur in a specific region or sector. However, these can often lead to cascading effects, often in connection with compounding hazards12 For instance, countries reliant on hydropower for electricity may face power outages during droughts. If this happens alongside a heatwave, it can result in increased hospitalisations and deaths, as people cannot use fans or air conditioning to cool their homes. Impacts can also extend through various scales and across different regions, from local to global. Additionally, measures taken to manage and adapt to drought hazards and impacts can themselves have their own risks, impacts and trade-offs, so-called “response risks”. For example, retaining water upstream might alleviate water shortages in one community but worsen them downstream. Another example of the systemic characteristics of drought risks can be found in the adoption of novel irrigation practices, where increased efficiency may not always translate into actual water conservation and actually reduce the water resources at the watershed level (known as the “irrigation efficiency paradox”, see Section 2.2.10).
C | Systemic drought risk management and adaptation (see Fig. 1, Panel C on page 15)
The complexity of interacting drought risk drivers and the strongly interconnected impacts make drought a challenge for risk management. This is partly because risk management needs to operate on longer timescales, which do not easily align with people’s ability to learn and apply lessons from the past13 This can occur, for instance, when infrastructure or water management plans are designed in a period of relatively high-water availability, which are then found to be inadequate when a drier period sets in.
This Atlas presents a systemic perspective on drought risks and impacts, illustrating how risks are interconnected across sectors. This approach is essential for comprehensive management and adaptation that enables tackling these systemic drought risks and building resilience among communities, economies, sectors and nations. Systemic drought risk management and adaptation strive to move beyond purely reactive approaches, to avoid trade-offs and maladaptation and to identify leverage points for positive cascading effects for communities and sectors (see Section 4.5)
This approach is complex, as it must consider interdependencies, non-linear relationships, feedbacks, dynamics, compounding and cascading effects, possible tipping points, globally/regionally networked risks and uncertainty.
This Atlas supports decision makers in systemic drought risk management. It illustrates drought risks and offers guidance on proactive and prospective drought management and adaptation. Not only is this an effective and economically efficient way to allocate resources, but critically, it reduces impacts for the sectors and ecosystems that people and economies rely on.
Water security is the capacity of a population to safeguard sustained access to adequate quantities of acceptable quality water for sustaining livelihoods, human well-being and socio-economic development for ensuring protection against water-borne pollution and water disasters and for preserving ecosystems in a climate of peace and political stability.UN-Water, 2013
Droughts can threaten water security as they induce temporary and extreme variability in water supply.
An imbalance between water demand and supply can threaten water security. When the ratio of total water withdrawals to annual renewable freshwater supply reaches 20 %1 a region faces water stress

Map 1: Freshwater withdrawals as a share of internal resources, 2020. Freshwater withdrawals refer to total water withdrawals from agriculture, industry and municipal/domestic uses. Withdrawals can exceed
When annual water supplies drop below 1 700 m 3 per person1, the population faces water shortage

Economic and political power imbalances can threaten water access for the less privileged.
Aridity influences the average available quantities of water.
Unsustainable land use can increase aridity

Pollution as well as heat- and drought-induced water temperature rises can threaten water quality.

Pollution, land degradation, aridity, water stress/shortage and unequal water access worsen the impacts of droughts. They amplify each other in causing water insecurity.
1.3
Understanding the systemic nature of drought risks and impacts (cont'd)
How our societies change over time influences the earth system as well as our resilience. Global trends with respect to sustainability, globalisation, demography (see Fig. 2, opposite-top) and innovation will change how people use and manage water and might further change the climate. This will influence the dynamics of the three drivers of drought risks.
Changing hazard
Failing to reduce greenhouse gas emissions will further heat the planet, causing regional changes in mean climate and climate variability, causing aridity to increase and droughts to occur more frequently and with higher severity".
With +2 (+3) degree of global warming (see Maps 5a and b, below) meteorological and hydrological drought hazard will change due to, e.g. the additional heat, increasing evaporative demand, changing precipitation patterns and regimes.
Next to climate change, societal changes causing increases in water demand can also affect drought hazard, through more abstractions hence reduced surface or groundwater levels. The human influence on the water cycle might intensify.
Changing vulnerability
The increased frequency of droughts might influence societies' coping capacity, rendering them more aware of the risks, getting better prepared and less vulnerable. On the other hand, increasing drought hazards might erode ecosystem's and societies' health and adaptive capacity, rendering them more vulnerable to droughts
Socio-economic, technologic and political changes will influence drought vulnerability dynamics. The latter incorporates elements like societal and institutional capacities to access and manage our droughts. Increases in and a more just distribution of financial, human, manufactured, social and natural capital can increase resilience.
Changing exposure
These changes will go hand in hand with land use and management changes (e.g. distribution of water-demanding crops, irrigation area, new water-intensive industry clean energy demand, demographic changes, migration, urbanisation, deforestation), which in turn will define which assets are exposed to droughts.
Increased population (see Fig. 2, opposite-top) and changes in water use efficiency (see Fig. 3, opposite-bottom) will also alter water demand, potentially influencing the propagation of drought hazards from meteorological into hydrological and groundwater deficits.
Maps 5a and b: Annual hottest-day temperature change and annual mean total column soil moisture change. With every increment of global warming, regional changes in mean climate and extremes become more widespread and pronounced: a) The annual hottest day temperature is projected to increase most in mid-latitude and semi-arid regions and b) Annual mean soil moisture changes largely follow projected precipitation changes but also show the influence of increased evapotranspiration.
Data source: Top: IPCC AR6 SYR Figure SPM2a CMIP6 Tx data; Bottom: IPCC AR6 SYR Figure SPM2b CMIP6 SM data https://www.ipcc.ch/report/ar6/syr/figures/figure-spm-2


1.4 Guide for the reader
Fig. 2: World population under Shared Socioeconomic Pathways.
Data source: Riahi et al. (2017) retrieved from https:// ourworldindata.org14
The World Drought Atlas is structured in four chapters. After this introduction, Chapter 2 explores and presents a diverse range of drought impacts and drivers of risks for five selected sectors and systems that are relevant across the entire globe. These are Water Supply, Agriculture, Hydropower, Inland Navigation and Ecosystems (Sections 2.1 – 2.5) Following this, shared drivers of risks between these sectors and systems and cascading impacts are synthesised, including their interconnections and contribution to other negative effects such as land degradation (Section 2.6) Chapter 3 presents regional and local case studies to highlight lessons learned from past droughts, illustrating how impacts have affected people and sectors, covering a range of events and thematic focuses from around the world. Finally, Chapter 4 covers approaches and solutions for comprehensive drought risk management and adaptation, including best-practice success stories and measures and pathways to tackle systemic drought risks.
PART 2: Impacted systems at global level
Water resources are vital for natural and socio-economic systems. Droughts pose a significant threat to these resources, disrupting their functioning and causing diverse impacts. For instance, droughts can severely affect ecosystem biodiversity and carbon storage potential, leading to long-lasting harm to both nature's intrinsic value and its contributions to human well-being. In addition, a deficit of rain, surface and/or groundwater can directly affect humans through shortages in drinking water or food supply. Droughts can also indirectly affect livelihoods and socio-economic systems. For example, droughts can reduce hydropower generation, leading to higher energy prices or power outages, and can disrupt local and international supply chains due to low water levels that hinder transportation in inland waterways. Due to cross-sectoral dependencies and connections, such impacts do not occur in isolation, and drought-related impacts on one sector can trigger cascading effects, including exacerbating inequalities and conflicts and threatening public health.


2.1 Water supply
2.1.1 Drought can affect the availability of drinking water

Severe droughts can result in shortages of water supplies, with widespread social and economic consequences. Good water supply systems are particularly critical for public health.
Public and private water supply systems are designed to ensure the continuous provision of domestic water supply (see Map 1, above) even during extended periods of dry weather, with the aim of avoiding excessive costs or environmental damage. During a drought, water suppliers face increasing pressure due to rising water demand in some sectors1, 2 as users may not have access to alternative water sources. Additionally, reduced water availability during a drought can pose challenges for meeting demands3 Thus, drought risk for public water supply system can be defined as the risk of not being able to meet water demand – either due to a shortage of good quality water, or elevated demand.
Shortage of domestic water supply induced by droughts can have a variety of socio-economic impacts. These include shortages for drinking, washing and related hygiene, industry use, civic amenities, sewage and related systems4 During drought, the increasing competition for water5 can lead to illegal water markets6 Drought can negatively impact not only the quantity of water available, but also lead to the deterioration of water quality, triggering waterborne and food-borne diseases and higher prices due to additional costs in water treatment.
Among the various natural hazards such as floods, there is evidence that droughts pose the greatest threat to water suppliers and water users. Especially accumulated water deficit from multiyear or consecutive drought events can represent a serious hazard7 Precipitation deficits usually lead to shortages in all parts of the water cycle, so replacing one water source with another to secure water supply might only mitigate and/or delay impacts. Furthermore, water abstraction to cope with a drought in one area can worsen hydrological droughts downstream8, 9 underscoring the need to manage droughts at a broader watershed level in a coordinated way.
Heat waves exacerbate drought risk to water supplies because they further reduce water availability. This can happen in several manners. First, heat can limit pumping capacity due to lack of cooling. In addition, heat causes more evaporation and thus faster dry-out of surface water and soil. Heat can directly and indirectly cause water quality to deteriorate through algal blooms, increased concentration of toxic substances due to reduced water volume or saltwater intrusion in coastal areas due to reduced streamflow or groundwater. Finally, heat waves increase: sectoral water use, pressure on water supply systems, energy consumption (for e.g. air conditioning), and water needs for cooling power stations.

The impact of drought on water availability varies depending on the type of water supply system. Centralised piped water systems (see Map 2, above) are generally more reliable as they often use reservoirs or deeper groundwater or apply conjunctive water use schemes, complimenting surface and groundwater. The piped water system consists of a chain of components, including drinking water, recycled water and wastewater, that can all be affected by droughts (see Fig. 2, left) In piped water systems, the effects of drought depend on four dimensions of the water supply process:
i. water source (where the water comes from), ii. water treatment (how the water is processed), iii. supply and distribution network (how the water is brought to consumers) and iv. the end users (who is using the water when and where). The processes and decisions happening at each stage can alleviate or exacerbate the impacts of droughts. Outdated pipe networks pose an extra risk to water distribution through water leakages10 as dried-out soils can increase stress on the pipes and cause pipe bursts.
Communities relying more on local wells may experience impacts earlier because these water resources are less consistent over time and space as the wells are shallower or connected to smaller aquifers. Reliance on unpiped water sources such as wells can be high in certain countries, ranging from over 50 % to up to 90 %, especially in Africa and Southeast Asia.
Fig.
2.1.2 Impact chain of the effects of drought on water supply systems
During droughts, water supply systems are exposed to a reduction in the availability and affordability of safe water for domestic consumption (see Fig. 1, below), which can mean both a reduction in quantity and quality of water. Supply systems are largely dependent on hydrological water sources and are therefore affected when droughts progress further in the hydrological cycle, reducing surface and groundwater reserves. These reserves are hugely influenced by water abstractions from different sectoral uses as demand increases during drought and heatwaves. Additional challenges connected to other sectoral water uses come from the inputs of pollutants (e.g. from industrial, mining or agricultural activities), whose concentration increases in surface waters during low flow conditions, straining the capacity of treatment systems. However, drivers of this risk are also connected to individual and collective behaviour: for instance, historical consumption habits, particularly by those in rich countries with better access to water, can result in high levels of water demand difficult to meet during drought
conditions, especially if these become more frequent due to climate change. At times, inadequate pricing schemes can be a contributing factor, as they might not encourage water-saving behaviour at the individual scale. However, individual behaviour is also dependent on awareness of drought risks, which can be influenced by having witnessed previous drought impacts. In many areas of the world, water is not supplied by a central, regulated system, but accessed directly by single communities: in these cases, drought can compound inequalities in accessing
resources, for instance by forcing people to travel longer distance to access freshwater sources. Women are in many cases bearing the brunt of this activity, due to pre-existing gender inequalities. Where centralised systems exist, deficiency in the water infrastructure can increase the system’s vulnerability, especially if the system is undergoing a process of concentration of demand: this can come as a temporary, seasonal trend (as in the case of touristic fluxes) or in more permanent form (such as in the case of urbanisation). A response to drought risks and impacts in this
sector, when conditions allow, is the increase in water storage infrastructure (for instance, building more reservoirs) to meet water demand during future droughts. However, this response, while beneficial in the short-term, can also paradoxically create an increase in overall water demand in the long term, as the increased dependency on reservoirs may attract new population settlements or water-intensive activities such as industries (a phenomenon known as the reservoir effect).
Fig. 1: Impact chain of drought risks for water supply systems. The impact chain conceptual model outlines the main drivers of risk for water supply systems at the global level and their interconnections, highlighting the multiple dependencies that need to be addressed to reduce drought risks. Drivers of risks are categorised using the categories of the conceptual framework of drought risks and impacts from a systemic perspective (Hagenlocher et al., 2023, see Part 1).
2.1.3 Drought hazards for water supply
Due to the spatiotemporal complexity of drought and its potential impacts, many hazard indices exist that aim to characterise different aspects of drought, such as anomalies in different parts of the hydrological cycle over different time windows. Here, the Standardized PrecipitationEvapotranspiration Index (SPEI) is calculated over a period of 12 months (i.e. one year) to gauge the drought hazard to water supply. Water supply is highly dependent on consistently available water resources, either from surface water or groundwater.
SPEI estimates the replenishment of such water resources. In Maps 1 – 9, the driest event over the period 2000 – 2019 is shown for different parts of the world. In Southern Africa, dry conditions are shown for 2016, which was the middle of a three-year drought during which water supply in Cape Town was heavily affected and strict water use measures were put in place. The map of Australia represents the end/high of a 3-year drought (2017 – 2019) that threatened water supply in the
south-east (known as the ‘tinderbox’ drought as it was followed by wildfires), causing Sydney’s desalination plant to be put back in service after 7 years offline.
In Maps 10 – 12, the change in average SPEI-12 is shown for three different warming levels (2 °C, 3 °C, and 4 °C warming above pre-industrial levels), indicating how the drought hazard for water supply may change under a changing climate. The maps show that SPEI-12 conditions are projected (on average) to worsen in most of the world. Particularly northern Africa, central Asia and Europe, and parts of South America stand out. The main exceptions are the far north (northern Canada and Siberia) and some equatorial regions in Africa and the Indian subcontinent. This spatial pattern is similar across warming levels, but intensity increases with warming level. Whilst agreement between the five models is generally good across the globe, it is poor in equatorial Africa and the high latitude regions where average conditions transition from drier (mid latitudes) to wetter (high latitudes).
While the maps displayed here show the global patterns of SPEI-12, other metrics can and should be included when responding to specific drought events or formulating new policies to obtain a more complete picture of hazard conditions. Moreover, moving from the global to smaller scales may require a different selection of metrics to account for specific local conditions. Given the highly specific knowledge of local needs and conditions required to make informed choices, the involvement of stakeholders is critical in the identification of metrics and approaches to interpret and use them. In addition, utilising an ensemble of climate and/or hydrological models can help to more objectively quantify the uncertainty in how future hydroclimatic conditions will evolve.


Human-driven climate change impacts available water resources. Drought conditions may worsen across most of the world and affect water supply systems.


Maps 1
9: Examples of drought events during 2000-2019 (based on SPEI-12)
Map 1: Classification of river basins in the context of the ESBs. The eight groups of river basins as defined by the status of their surface water and groundwater with respect to the safe and just surface water Earth System Boundary (ESB). Regions that are outside the ESB for surface water, impact the whole basin by over-abstracting from rivers and lakes. Regions that have a declining groundwater recharge, impact the whole basin by overabstracting sub-surface water. Both situations are not sustainable.
Data source: Stewart-Koster et al., 20246

In regions with less renewable freshwater available, the vulnerability of water supply systems is higher.
Baseline water stress, water quality and the capacity of dams to store renewable water largely define the drought vulnerability of water supply systems1 Besides, this sensitivity of water supply systems to water deficits is contingent on diversity and type of water abstraction.
Local surface water and groundwater are the primary water supply sources, but rain, transfer of water from other areas or desalinisation can also be sources, particularly during emergencies. Conjunctive use of these water sources is important for the sustainability of water resources3 Rainfed water supply systems face impacts from temporary rainfall shortages, while reservoir-dependent systems may suffer from snow droughts in preceding seasons (see Map 2, right) resulting in reduced meltwater from hydrometeorological droughts upstream and from climate-changeinduced glacier shrinkage2. While increasing dam capacity can increase reliable water supply, the expansion of reservoir storage can contribute to an over-reliance on reservoirs: this policy can heighten the system’s vulnerability to water shortages, as it undermines the incentive to pursue other adaptation actions against droughts4 Currently, the world faces already a water crisis5 1.5 billion people live in river basins exceeding the safe and just water system boundary, which are threatening the collapse of freshwater- or groundwater-dependent ecosystems6 In these basins there is insufficient renewable surface water to meet minimum needs for people and nature, making them extra susceptible to drought impacts and requiring transformation in both water supply and demand (see Map 1, above)
Map 2: Dependence on mountain water resources, 2001 –2010. Results are shown as decadal averages for lowland populations in each category of dependence on mountain water from no surplus and negligible to essential.


Staying within the planetary boundary for water
Almost a third of the world's population, 2.6 billion people, rely on groundwater because the river basins where they live have already exceeded the surface water Earth System Boundary (see Map 1, opposite) This means these river systems have highly altered flow regimes due to anthropogenic influence and/or have insufficient surface water to meet human needs6. In these basins, there is an increasing risk of groundwater table decline (see Map 3, above) and thus wells running dry and groundwater pumping may, therefore, further diminish streamflow7 Drought events exacerbate this unsafe situation.

Data source: Viviroli et al., 202016 Map
Groundwater extraction systems experience drought effects during prolonged dry periods when water stocks are inadequately replenished (see Map 3, above) Millions of wells are at risk of running dry if groundwater levels decline by only a few metres8 and the water table decline will also affect ecosystems when environmental flow requirements are not met9 (see Fig. 1, right)
Not all groundwater is created equally. Generally, the deeper one gets, the older the groundwater is and the longer it will take to be replenished after it is extracted. Some aquifers are so old (millennia) that they are referred to as fossil groundwater as they will be depleted for a decades and centuries if used.
The
darker grey hatching shows where declines in rainfall have been above this threshold.
Data source: Stewart-Koster et al., 2024
Even regions utilising grey water (water reused after treatment) for water supply may be impacted by drought-related reductions in water availability, potentially hindering wastewater treatment facilities. Droughts can further deteriorate water quality due to salinity, stratification, algal blooms and reduced dissolved oxygen10, 11,12 Moreover, increases in pollutants such as pharmaceutical concentrations during droughts can negatively impact human health13 Elevated salinity during droughts raises the likelihood of surpassing standards for water use and human health14 Increased dissolved phosphorus concentrations under drought conditions are noticeable in urban areas due to a greater contribution of point sources of pollution and reduced dilution.
Droughts and water quality
2.1.5 Political and economic drivers of water supply risk
Drought vulnerability is heavily influenced by policy and political decisions that shape coping and adaptive capacities. Government effectiveness plays a crucial role in determining the extent to which droughts impact water supply1 Good governance allows water users and suppliers to take proactive measures to enhance availability or reduce demand, particularly if such plans are established before the onset of a drought.
Management decisions, such as risk policies and investing in research and development, contribute to a region’s sensitivity to drought and its capacity to cope with it2 With the rise of risk awareness and assessment methods, more risk management strategies are being developed3 Moreover, the allocation of water-related development assistance, increasing disaster preparedness and the implementation of operational policies and procedures for participatory management are critical for mitigating drought risk.
Practicing water harvesting and retention is a prominent way to cope with droughts. Dam capacity and retained renewable water are often cited factors influencing a region’s
drought vulnerability. To be effective and sustainable, such retention efforts need to be part of integrated water resources management plans (see Chapter 4) This process promotes the coordinated development and management of water, land and related resources to maximise economic and social welfare equitably, without compromising the sustainability of vital ecosystems.
Drought impacts manifest at the community level, so community participation in water and sanitation management is crucial (see Fig. 1, below). A well-informed community with increased awareness can help reduce drought risks. Access to information (e.g. high participation rates in education and training (see Map 1, below)) and strong community participation (countries with procedures for community participation) are drivers of good water governance4 Lastly, socio-economic factors linked to the financial security of families, access to credit, the age of individuals and their general living situation influence people’s sensitivity to drought. Addressing these socio-economic factors is essential for enhancing overall drought resilience.
Water justice
Water is unevenly distributed across the globe, there is unequal access to it and not all voices are heard in the management of it.
Water issues are often a reflection of broader issues of democracy, citizenship and development5
Water justice issues can worsen during droughts and can exacerbate existing social and well-being inequalities. It is crucial to recognise the diverse nature of societies and how power dynamics affect the prioritisation of drought emergency responses, thereby creating uneven impacts6
"Water injustice" transcends the question of distribution and refers to ongoing inequalities in how people access and utilise water resources, shaped by governance and decision-making processes related to water rights, allocations and uses (procedural and substantive justice)7,21 It also includes relational justice (interspecies, intergenerational and intragenerational) and cultural recognition and epistemic justice8,21 Adopting more flexible, adaptive and decentralised approaches to water infrastructure can help ensure equitable access to water for all9
Access to water is pivotal for peace, yet achieving this requires fair distribution to all and equitable, inclusive water-related decisionmaking. To achieve water justice, the human right to water must be a reality for everyone. This means reforming current water supply systems by moving away from water privatisation towards treating rivers as shared resources that belong to and are managed by communities, supporting collective stewardship17 The way forward includes democratising water governance and the recognition that water problems cannot be resolved through technical solutions alone (as rivers are not just physical bodies of water but are integral to the social, cultural and ecological fabric of communities and thus) require broader understanding and addressing of ecological, political and social issues simultaneously5
Fig. 1: Share of countries with procedures for community participation in water and sanitation management, 2019. The share of countries in a given region with clearly defined procedures in law or policy for participation by service users/ communities in planning programmes in water resources planning and management.
Data source: UN Water, 202320


non-formal education and training within the 12 months prior to data collection. Non-formal education can take place both within and outside educational institutions.
Data source: UNESCO Institute for Statistics – processed by Our World in Data https://ourworldindata.org
Map 2: Relative poverty: Share of people below 50 % of median income, 2023. Relative poverty captures the share of people whose income is low by the standards typical in their own country by using a baseline that rises and falls over time based on average or median income. Depending on the country and year, the data relates to income measured after taxes and benefits or to consumption per capita. 'Per capita' means that the income of each household is attributed equally to each member of the household (including children). Non-market sources of income, including food grown by subsistence farmers for their own consumption, are taken into account.
Data source: World Bank Poverty and Inequality Platform, 202422
Fig. 2: Probability of being affected by water shortage in the U.S. Estimates of probability of exposure to water shortage across multiple social and economic vulnerability dimensions. Bold vulnerability factors with positive values indicate this vulnerability factor indeed increases exposure to water shortage.
Data source: Sanchez et al., 202310
Impacts from droughts also arise from water allocation decisions.
Socio-economic vulnerability in the face of drought risk is a complex and dynamic concept that is hard to quantify. It can be approximated by multiple dimensions and through various factors that can help identify the underlying pressures and root causes for drought impacts. For example, the social vulnerability index (SVI) is used to study the link between water shortage and social vulnerability in the US10 This study finds evidence that multiple dimensions of social vulnerability (see Fig. 2, left) are disproportionately exposed to water shortages. In this study, the SVI is composed of 15 indicators grouped into four themes: socioeconomic status (such as poverty level (see Map 2, above)), household composition, minority status and housing and transportation, but other authors have included other factors such as health11 access to information and the internet12 human and civic resources18, institutional conditions13 and coping capacities14 Different authors quantify socio-economic drought vulnerability differently because of the geographical context they cover and their choice of type of impacts as well as a lack of validation15 When estimating socio-economic vulnerability, it is recommended to use drought impact information to derive the relevant vulnerability factors and calibrate vulnerability indices, so that they represent the regional context16
2.1.6 Urban drought risk
Urban areas, being important hotspots of population (see Map 2, opposite) and infrastructure, are exceptionally susceptible to the impacts of climate extremes and the broader spectrum of climate change impacts. Drought occurrences worsen water security challenges as they constrain the availability of potable water for domestic consumption (see Fig. 3, opposite) Less diverse water sources make cities more sensitive to drought-induced water shortages, while diversification by using both surface and subsurface water and options for water import can increase resilience.
Droughts affecting urban areas (see Map 1, below) can trigger groundwater over-extraction (threatening long term water supply), economic impacts (service losses), conflicts, health effects and increased labour1 The urban heat island effect (urban areas being significantly warmer than surrounding rural areas during hot days) of densely populated urban centres can worsen these impacts, as the reduced supply compounds with an increased urban water demand during heat waves.
Currently, a significant proportion of the world's cities, roughly a quarter, are dealing with permanent water stress and water deficits2 a challenge present especially in regions with geographical and climatic factors, such as deep aquifers or general aridity, limiting easy water access. Projections indicate an increasing trend of droughts and heatwaves across many global regions and an increase in urban drought risk is expected3
Day zero in megacities
Whilst cities cover only 2 % – 3 % of the Earth’s surface, they are inhabited by over half of the world’s population, and this is projected to increase to two-thirds by 2050. While household water security can be a driver for rural-urban migration3 rapid as well as uncontrolled urbanisation can put pressure on existing urban water supply systems and threaten the water security situation of their inhabitants, who are highly vulnerable to climate shocks4
Megacities situated in semi-arid and arid landscapes, amidst expanding urbanisation, are especially vulnerable. The sustainable development trajectory of cities, as outlined in the New Urban Agenda, hinges on securing a dependable water supply, both in terms of quantity and quality, that is resilient to drought episodes5
Where public and private water policies fail to address urban water insecurity in the Global South, community-based water governance (CWG) can be a solution together with funding and infrastructure support6
Fig. 1: Urban drought risk in Sana'a, Yemen, 2015. With fuel almost impossible to get hold of in Sana'a, the water authority could not operate the network, so UNICEF worked with the Yemen Petroleum Company to buy fuel and organise water trucking to the most vulnerable parts of Sana'a.
Exacerbated by climate and land-use changes, river basins with important freshwater reserves have experienced major water shortages due to droughts over the last few years, impacting the cities around them that rely on these reserves for their water supply. In Australia, at the end of the Millennium Drought, Brisbane had to employ major water-saving measures while waiting for new water recycling systems to be implemented, and small towns had to import drinking water7, 8 Other urban centres have recently faced the threat of a ‘day zero’: the day that public water supply would run out and leave the city without water for basic needs. Between the onset of the twenty-first century and the present, a staggering 79 megacities have had to impose extensive drought-related reductions in public water supply. Examples include Melbourne (2000 – 2010), Barcelona (2008), Mexico City (2010), Los Angeles (2012 – 2016), Perth (2014), São Paulo (2014 – 2015), Cape Town (2015 – 2018) and Chennai (2018)9 and more are highlighted in Chapter 3
Supplying domestic water to city inhabitants is increasingly challenging because of droughts and increasing urban population, especially in megacities.
Source: Julien Harneis, CC BY-SA 2.0, via Wikimedia Commons.
Map 1: Spatial distribution of historical urban hydrological drought risk. This map shows the spatial distribution of historical urban hydrological drought risk for 264 urban agglomeration, as calculated by Stolte et al 2023. The authors combined drought hazard (drought volume focusing on surface water deficits), drought exposure (urban population) and drought vulnerability (through a multivariate vulnerability index) with the adaptation cost (replacement expenses of the freshwater deficits) to measure the severity of the drought risk. Please note: only cities with reliable, consistent water abstraction and availability data were included. Therefore, cities like Cape Town were not included.
Data source: Stolte et al., 20233

Fig. 2: Modelled water consumption across Cape Town social groups.
Daily household water consumption of each social group. Daily household consumption is disaggregated into the water that households use to satisfy basic water needs and the water used for amenities.
Data source: Savelli et al., 202311

Fig. 3: Cascading effects of water shortages on other urban inequalities. Climate extremes like droughts hit those that are already vulnerable the hardest, so climate action should not overlook the societal dimension of climate extremes. Rather, integrated social-environmental extreme scenarios should be built to understand societal implications of future droughts.
Source: Rusca et al., 202310 Copyright © 2022, Rusca et al., under exclusive licence to Springer Nature Limited.
Map 2: Share of people living in urban areas, 2022.
Inequality as driver of drought risk
"The only way to preserve available water resources is by altering privileged lifestyles, limiting water use for amenities and redistributing income and water resources more equally"11 Savelli et al. (2023)
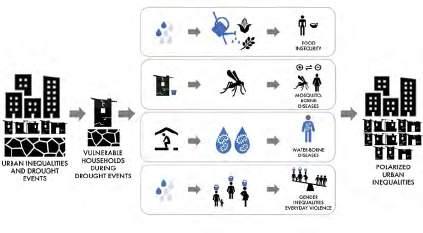
Poverty (see Map 2, page 31) corruption, inequality and conflicts also play a significant role in communities’ sensitivity to droughts and their harmful effect on water supply. Droughts can force water providers to invest in additional supplies or implement expensive, short-term measures, the costs of which are often paid by households through increased rates and surcharges12 This can induce economic water shortage –water not available to the least affluent. Daily household water consumption differs greatly between different income groups. The highest income group may use up to 2 000 litres per household per day, whereas lower income households use about one-tenth of that, basically all used for basic water needs. Higher and upper-middle income households use about half or more of their water consumption for amenities.
Water crises often arise due to the excessive water consumption of affluent social groups (see Fig. 2, left) The overuse and exploitation of water resources by urban elites is not a given but is rather the outcome of specific political and economic systems driven by the pursuit of capital accumulation and constant growth, primarily benefiting a privileged minority. The resulting water inequalities and their unsustainable consequences are deeply rooted in historical, political and power dynamics.
To mitigate risks associated with water scarcity, conventional measures such as raising tariffs have proven, in some cases, to be ineffective both in terms of fairness and environmental sustainability. As such, alternative water market mechanisms should be explored to address this. We need to move away from relying solely on increasing water supply, which has been our traditional approach. Instead, we should shift towards focusing on reducing demand, improving efficiency and reusing water resources. It is crucial to also prioritise protecting and restoring ecosystems that have suffered from centuries of exploitation. Partly because of ecosystems intrinsic value and partly because people dependent on these ecosystems are often the most marginalised, it becomes a justice issue as well. Rather than trying to extract more water from rivers, lakes and aquifers that are already overused, we should find ways to accomplish our goals using less water13
from contamination.
Data source: WHO/UNICEF Joint Monitoring Programme for Water Supply, Sanitation and Hygiene (JMP) (2024) – with major processing by Our World in Data, https://ourworldindata.org

Access to water and sanitation (see Map 2, below) is a fundamental human right. Between 2015 and 2022, the proportion of the global population with access to safely managed drinking water (see Map 1, above) rose from 69 % to 73 %. However, in 2022, 2.2 billion people still lacked safely managed drinking water, with 703 million lacking basic water services. Additionally, 3.5 billion people lacked safely managed sanitation, including 1.5 billion without basic sanitation services, and 2 billion lacked a basic handwashing facility, with 653 million lacking any handwashing facility at all1
Droughts pose significant threats to water availability for sanitation and hygiene. Reduced access, compounded by unequal water distribution and conflicts, can impede safe water management. Limited water access for sanitation and hygiene heightens vulnerability, particularly for children, jeopardising their growth and health. Diseases like cholera, dysentery and typhoid are directly linked to inadequate sanitation and non-treated domestic wastewater flows (see Map 3, opposite)
Millions of people die annually of diseases associated with unsafe drinking water, sanitation and hygiene.
Among the most vulnerable are young children, with WASHrelated diseases remaining leading causes of death in children under 5, contributing to malnutrition and stunted growth. Droughts contribute to this, as less freshwater availability can push people to use less optimal water sources, thus increasing the risk of water-related diseases.

Map 3: Proportion of safely treated domestic wastewater flows, 2020. While wastewater treatment (see Fig. 3 in Section 2.1.1) is essential for mitigating the impacts of low-quality water and good wastewater treatment (access to good quality water) reduced drought vulnerability, droughts can strain treatment techniques, exacerbating water quality concerns.
Data source: World Health Organization 2024 data.who.int, https://data.who.int/indicators/i/6EFF579/A37BDD6
Drought risk and gender inequality

Map 2: Share of the population using safely managed sanitation facilities,
During droughts, gender inequality intensifies2 exemplified by the widening wage gap between men and women. Globally, women spend up to 200 million hours a day to collect water, which can lead to major losses of time otherwise used for education, work or leisure and can sometimes be a physical and mental burden3
For example, women with children can encounter obstacles in their job activities due to household duties (e.g. childcare, cooking/ cleaning, etc.) that are more time-consuming during droughts. Longer distances to water sources and extended waiting times at water pumps mean that a large share of the day is allocated to fetching water, exacerbating domestic burdens while also exposing women to more unsafe conditions. Additionally, pastoral communities may need to travel farther to procure fodder for their cattle, implying greater domestic workload for those remaining at home.
By 2050, climate change could increase the amount of time women in households without running water spend collecting water by up to 30 % on global average (regionally even double) and up to 19 % if global warming is limited to below 2 °C3
Tasks such as water and fuelwood collection become more arduous during droughts, often associated with heatwaves and impacting health and mobility. Girls’ school attendance diminishes as they are compelled to assist with domestic chores. Households face heightened psychosocial stress and health risks stemming from food and income insecurity.
Lastly, while many women around the world have the primary responsibility for managing water supply, they often lack a choice in water management decisions.
Without water, sanitation and hygiene (WASH), people’s well-being, dignity and opportunities are severely compromised, particularly for women and girls.

Fig. 1: Gender inequality driving drought risk. Participation of all genders in decisions about water management and drought mitigation is crucial to obtain effective and equitable policies.
Source: UN Photo/Prashanth Vishwanathan.
Fig. 2: Gender inequality caused by drought. Women collect water in drought-stricken Marsabit in northern Kenya.
Source: © WFP/Alessandro Abbonizio.
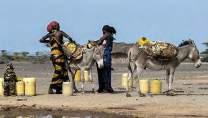
AFFECTS
Lack of access to water places a heavy burden on women and girls:


2.2 Agriculture
2.2.1 Food systems and their water footprint
Map 1: World distribution of grassland/pasture and cropland. Agricultural landscapes are diverse and can largely vary depending on the use and/or geographical location. Two general land use types are associated with agriculture, croplands and grasslands/pastures. In traditional agriculture, grasslands and pastures are used for animal food production, while most plantbased foods are produced in croplands.
Data source: Zanaga et al., 202212

Agriculture is essential for human survival, health and well-being. Despite this key role, the sector is contributing to drive many of Earth's critical systems beyond their safe operating space. A transformation is needed to make this vital activity compatible with sustainable development.
Agricultural production systems and droughts
Agricultural systems are the backbone of food security globally. Food security is reached when "all people, at all times, have physical and economic access to sufficient safe and nutritious food that meets their dietary needs and food preferences for an active and healthy life."1 Despite an important and sustained reduction of undernourishment in the past few decades, recent years have shown a stagnation in the declining trend and even, in some cases, a reversal. Hunger still prevails in many regions of the world2. Reaching the sustainable development goal 2 (Zero Hunger) by 2030 still requires deep economic, social and environmental transformations2 See also Section 2.6.3 Food security and drought, page 96.
No other natural hazard poses a larger risk to crops and livestock than droughts3 Droughts know no geographical boundaries and they can impact large scale industrial agriculture as well as smallholding farmers and pastoralists alike4 Droughts affect high-added-value crops such as grapes, coffee or nuts as well as low-value fodder crops, creating a broad range of direct and indirect economic impacts.
Recent evidence suggests that human activities have already pushed six out of the nine planetary boundaries – the critical processes for Earth's stability and resilience – beyond their safe operating space5 Non-sustainable agriculture is closely linked with the transgression of five planetary boundaries, namely climate change, biosphere integrity, land system change, biogeochemical flows and freshwater change5 A sustained push of the planetary boundaries beyond their safe operating space puts the Earth system at high risk of being unable to guarantee human development.
Sustainable land management practices prevent land conversion, soil degradation, improve soil properties and increase crop productivity, among other benefits6 Additionally, conventional and genetic breeding can improve water use efficiency, drought tolerance and agricultural productivity7 These are powerful tools to, on one hand, reduce the impact of droughts on food production by making agricultural systems more resilient and, on the other hand, reduce human carbon and water footprints, limiting biodiversity loss, eutrophication, climate change and water scarcity (see Chapter 4)6

Water footprint of animal vs. plant based foods
Animal husbandry represents 40 % of the global agricultural output, supporting food security for over a billion people and directly sustaining the livelihoods of hundreds of millions across the world8 Animal protein represents about one-third of the global intake in humans9 Animal husbandry is an important social, religious and cultural aspect to millions of people and its products extend well beyond food production.
Despite its fundamental role in food security, the environmental and water footprint of livestock is enormous9 (see Maps 2 and 3, above and below) Currently, about 75 %
HOW THIRSTY IS OUR FOOD?
Fig. 1: How thirsty is our food?
Data source: Water Footprint Network.
Map 2: Non-animal food production water footprint at country level, 2015.
U.S., China and India, followed by Brazil are the World's largest contributors to non-animal food water footprint.
Please note: These quantities include water footprint of crops used to feed animals.
Data source: Tamea et al., 202014
of agricultural land is dedicated to livestock and livestockfeed production8 (see Map 1, opposite). Furthermore, animal food products' demand is projected to double by 2050s with respect to 20007 Its importance as a fundamental means of subsistence to smallholding farmers is threatened by a continuous shift towards large scale agro-industrial farmers controlling production10
The water and carbon footprints linked to the production of a gram of protein of animal-based food are typically much larger than those linked to the production of a gram of protein in plant-based foods11 (see Fig. 1, opposite) Large scale deforestation and habitat loss, loss of biodiversity, alteration of global biogeochemical cycles, competition with crops for water and land are all symptoms of an unsustainable food production model that prioritises animal food products driven by an ever-growing demand11. A model traditionally associated to the Global North, but later adopted by the Global South as it progresses towards a more prosperous future.

Map 3: Animal food production water footprint at country level, 2016. China, followed by the U.S., Brazil and India are the largest contributors to animal food water footprint at a global level.
Data source: Tamea et al., 202014
2.2.2 Impact chain of the effects of drought on agriculture
During droughts, agricultural systems (see Fig. 1, below) both rainfed and irrigated, are directly exposed to the risk of a significant reduction in yield, as well as a decreased quality of harvest (e.g. size, appearance, nutrient content and processing quality). The factors contributing to this drought-related risk are multiple, depending on the characteristics of the agricultural system precipitation deficit and reduced soil moisture directly affect water availability for rainfed systems, whereas irrigated systems depend on hydrological water sources (surface and groundwater), which can experience shortages due to reduced meteorological inputs but also because of increased and/ or excessive water abstractions. Many drivers contribute to the latter: the multiple sectoral water uses competing for the same water sources limit the availability of water at the catchment and system level. In the food production sector, the water needs of large-scale livestock production are particularly relevant. Drought and heatwaves can further contribute to high abstraction needs in the agricultural sector as more water
than usual is needed to prevent crops from wilting, resulting in an increase in water demand. Inefficient irrigation methods can further increase the sectoral water demand. However, it is worth highlighting how an increase in efficiency does not always result in reduced demand at the catchment level, as more farmers might be encouraged to switch from rainfed to irrigated systems or to switch to more water-intensive crops (irrigation efficiency paradox). In many cases, these excessive water needs are triggered by a limited adoption of climate
smart agriculture, a large family of practices that can also reduce the degradation of land and soil. Degraded soils limit the possibility for plants to withstand drought conditions and can be particularly consequential when farmers are forced to cultivate marginal lands, a result of socioeconomic factors such as unequal access to land, poverty and inequality, population pressure and market incentives to intensify agricultural production. Lastly, droughts can affect agricultural systems in the long term through carry-over or legacy effects,
which affect soil conditions for multiple years after the first drought-related shocks.
Fig. 1: Impact chain of drought risks for rainfed and irrigated agricultural systems.
The impact chain conceptual model outlines the main drivers of drought risks for rainfed and irrigated agricultural systems at the global level and their interconnections, highlighting the multiple dependencies that need to be addressed to reduce drought risks. Drivers of risks are categorised using the categories of the conceptual framework of drought risks and impacts from a systemic perspective (Hagenlocher et al., 2023, see Part 1).
2.2.3 Drought hazards for agriculture
Due to the spatiotemporal complexity of drought and its many potential impacts, many hazard indices exist that aim to characterise different aspects of drought, such as anomalies in different parts of the hydrological cycle over different time windows. Here, the Standardized Soil Moisture Index (SSMI) is calculated over the 3-month primary growing season to gauge the drought hazard to agriculture. Agriculture, especially in rain-fed systems, is highly dependent on soil moisture availability. Using a combination of hydrological and climate modelling, SSMI was calculated for
the present-day and three different warming levels (2 °C, 3 °C and 4 °C warming above pre-industrial levels) that result from different greenhouse gas emissions scenarios. The warming level maps are based on five (for 2 °C and 3 °C warming levels) or three (for 4 °C warming level) different GCM simulations. While the maps displayed here show the global patterns of one sector-specific index, other metrics can and should be included when responding to specific drought events or formulating new policies to obtain a more complete picture of hazard conditions. Moreover, moving from the global to
smaller scales may require a different selection of metrics to account for specific local conditions. Given the highly specific knowledge of local needs and conditions required to make informed choices, the involvement of stakeholders is critical in the identification of metrics and approaches to interpret and use them. In addition, utilising an ensemble of climate and/or hydrological models can help to more objectively quantify the uncertainty in how future hydroclimatic conditions will evolve.
Human-driven climate change is modifying precipitation patterns and regimes globally, leading to changes in drought frequency, duration and severity. These changes will have deep implications for agricultural systems in the decades to come.


The water content in the root zone of the soil (i.e. soil moisture) is fundamental for plant growth and is a basic component of the hydrological cycle. Plants extract water from the soil to support biological function, a process that is especially important during the growing cycle. Crop physiological responses to droughts vary depending on the time of occurrence during the different stages of the growing cycle1. Soil moisture drying is primarily driven by a lack of precipitation, but the evaporative demand of air is also an important driver of soil moisture variability. For instance, hot and dry air has a high evaporative demand and can, through evaporation and plant transpiration, dry the soils. Climate
change is modifying and will continue to modify soil moisture content (see Maps 1 – 9, opposite and Maps 10 – 15, above) Soil drying tends to be larger as mean global temperatures rise, particularly in regions where precipitation decreases or remains the same. As an example, the average soil moisture drops significantly during boreal summer (June – August) in crop dominated regions across the Northern hemisphere, creating possible risk for many critical food producing regions. Further, the stronger global warming becomes, the greater the soil moisture drying effect. Adequate adaptive agricultural practices will be key to mitigating the impacts of droughts on crop production in the future2
Maps 1 – 9: Examples of drought events during 2000 – 2019 (based on SSMI)
Maps 10 – 15: Average future changes w.r.t. the period 1985 – 2014


Agricultural outputs have risen significantly since the middle of the 20 th century, supporting food security but increasing negative side effects like overuse of fertilisers and pesticides.


15
1: Changes in cereal production, yield, land use and population.
evolution of global cereal production showing that both total production and yield have increased at a faster rate than the global population since 1961.
Data source: FAO, 202315
The current dominant crops in the world are maize (corn), wheat, rice and soybean1 While wheat and maize are widely grown on all inhabited continents, rice and soybean are predominately grown in Asia and the Americas, respectively (see Maps 1 – 5, opposite and above) Thanks to a combination of technological advancements, wider use of chemical products and improved agricultural practices, total global yield of these cereal crops has steadily grown since the 1960s. These trends have made possible to feed a growing global population, despite little increase in cultivated area2 Furthermore, the most vulnerable regions in terms of food security (e.g. least-developed or net food-importing developing nations) have seen a clear increase in the total amount of cereal production, helping to reduce hunger and undernourishment3 (see Figs. 1 and 2, above)
Data
At the same time, the rapid intensification of food production has triggered a number of negative side effects. Policies promoting monoculture cropping and widespread unsustainable use of pesticides and fertilisers have increased environmental pollution and led to reduced soil quality and crop biodiversity5,6,7 This can increase crop vulnerability to disturbances like pests, disease and extreme weather events5,8,9 As soil nutrients have been depleted, farmers’ dependence on these artificial inputs has risen5,10 making smallholders in particular vulnerable to price and availability fluctuations, which can be impacted by global disturbances like pandemics and conflicts11,12 Finally, exposure to pesticides and fertilisers has been linked to serious health consequences for both humans and other species, impacting public health, biodiversity and ecosystem resilience5,6,13
Projections indicate that the global population will reach between 9 and 12 billion people by 210014 A vast majority of this population growth will take place in the developing world, which includes many regions with important yield gaps and in general more vulnerable to droughts4 Reducing this vulnerability while working to close yield gaps in a way that promotes holistic social and environmental health is fundamental to guarantee a food-secure future for the whole planet.
Map 5: Cereal production, 2022. Cereal production is measured in tonnes and represents the total of all cereal crops including maize, wheat, rice, barley, rye, millet and others.
Data source: FAO, 202315
Fig.
Temporal
Fig. 2: Cereal production, 1961 – 2022. Total cereal production in the most vulnerable countries has significantly increased in the past six decades increasing food security
source: FAO, 202315
Maps 1 –4: Cereal production, 2022. Spatial distribution of the dominant crops in modern agriculture and the temporal evolution of the per capita production and yield since 1961. Please note: Yield is measured as the quantity produced per unit area of land used to grow it. Data source: FAO, 2023
Rice
Maize
Soybean
Flash droughts, a rapid onset or intensification of drought, are an emerging threat driven by climate change. Understanding these fast-evolving events is essential to improve preparedness.

1: Cropland experiencing flash drought in the past and under different warming scenarios.
The multi-model mean of the yearly percentage of cropland experiencing flash drought over entire continents for the historical (black), SSP126 (blue), SSP245 (orange) and SSP585 (red) scenarios. A 30year centred moving average is applied to each time series. The shaded regions indicate the variability (±1σ) among the 30-year centred moving averages between all six models for the corresponding historical and future scenarios.
Adapted from Christian et al., 2023
Map 1: Change in flash drought frequency in the SSP245 scenario. The multi-model mean change in flash drought frequency between future climate change scenario SSP2 – 4.5 (2066 – 2100) and the historical period (1980 – 2014). Flash droughts are defined using standardised evaporative stress ratio and soil moisture. Empty regions are masked areas that are either too arid or cold for flash drought development.
Data source: Christian et al., 2023
A flash drought is the rapid onset or intensification of drought, typically in a matter of weeks. It is usually caused by below-average precipitation accompanied by high temperatures (e.g. heat waves), high winds and/or changes in radiation. The high temperatures lead to a reduction of soil moisture through increased evapotranspiration (see Fig. 2, right) Changes in soil moisture that accompany a flash drought can cause extensive damage to agriculture, particularly to rainfed crops, for which effective mitigation actions are limited (e.g. an increase in irrigation)1 Furthermore, there is a limited capability of flash drought prediction in operational forecasting systems2 In the past four decades, the frequency of flash drought occurrence has increased on almost all continents3 The dominant physical drivers of flash droughts across all regions are shifting from precipitation deficits to above-average temperatures or to concurrent above-average temperatures and precipitation deficits3 Future projections suggest that flash drought frequency will continue to increase, unless strong climate mitigation occurs (see Map 1, above) Regions of the tropical Americas, Europe, Northwestern North America, East Asia and Southern Africa show the highest increases in future flash drought frequency4 Despite large uncertainty, under the high greenhouse gas emission scenario4 all continents except Australia show a larger fraction of current croplands experiencing flash droughts in the future than under middle or low emission scenarios4 (see Fig. 1, opposite)
Fig
Fig 2: Comparison of precitation deficit and heat wave flash droughts. Schematic representation of two generic types of flash droughts. Based on the schematic processes proposed by Zhang et al., 2017


2: Agricultural water withdrawal (% of total), 2019. Agricultural water withdrawals as a percentage of total water withdrawals (which is the sum of water used for agriculture, industry and domestic purposes). Agricultural water is defined as the annual quantity of self-supplied water withdrawn for irrigation, livestock and aquaculture purposes.
Data source: FAO, 20244
Food and agricultural outputs have a water footprint that varies greatly from product to product. Behind local use the agricultural global trade hides an enormous redistribution of freshwater in a complex global web.
Virtual water: a hidden web of freshwater transfers
Virtual water is the total amount of water required to produce a commodity (e.g. food). Every gram of food traded carries virtual water from where it is produced to where it is consumed. Global trade, including food trade, has steadily expanded in a gradually more interconnected world. Agriculture is the largest contributor globally to virtual water (56 %). Every year trillions of cubic metres of virtual water are transported through global trade1 (see Map 1, above) Virtual water can alleviate water shortages in water stressed regions but can also exacerbate water shortage through virtual water exports. The global appetite of foods with a very high water demand like beef or nuts (see Fig. 1, opposite and Fig. 2, right) can lead to unsustainable water use in a region and worsen water stress. International trade has both fostered and facilitated this appetite, making these products available and affordable almost anywhere in the world. It is of great concern that many countries with medium- to extremely high-water stress also use an important fraction of their available water for agriculture (see Maps 1 and 2, above), highlighting a vulnerability to drought and aridification.
2: Total
Data source: Tamea et al., 20203
Fig. 1: Water footprints of selected crop and animal products.
Left, WF in a litre of water per kg of product; Right, WF in a litre of water per kcal of nutritional energy contained in the product.
Data source: Mekonned and Gerbens-Leenes, 2020
Map 1: Agricultural water footprint and virtual water transfers, 2016. Food production water footprint at country level, measured in m³ per year. Arrows: virtual water transfers of the agricultural sector (excluding livestock).
Data source: Tamea et al., 20203
Map
Fig.
global water footprint per animal product.
2.2.7 Drought impacts on crop yields


Crop susceptibility to droughts
Drought impacts on agricultural output are complex.
Among other factors, crop type and variety, location, degree of irrigation, plant phenology and drought severity and evolution determine the response to a water deficit exposure1 One way to understand the susceptibility of crops to drought exposure is the quantification of the long-term statistical relation between a drought indicator (e.g. soil moisture anomalies) and low yields of a given crop type1 The spatial pattern of susceptibility to drought is crop dependent. Of the main four crop types, wheat seems the most sensitive to drought, followed by soybean and maize. Rice, a largely irrigated crop, appears to be less affected by changes in drought severity in the past decade (see Maps 1 – 5, above) Conclusions based on the crop susceptibility to droughts in the last decades may not always hold in the future. Large changes in the hydrological cycle due to climate change can modify crop susceptibility in the future.


Maps 1 – 5: Country susceptibility to drought-low yield association. Average occurrence, for each country of Standardized PrecipitationEvapotransipation Index (SPEI) duration-timing combinations with SPEI ≤ −1 across all the years with Standardized Yield Index (SYI) ≤ −1. The values obtained from all cropping systems are classified into susceptibility classes considering five quantiles while zero and "no data" land areas are presented separately (grey).
Please note: Countries in the data that are not part of the GISCO country regions: French Guiana (France), Kosovo (Serbia) and Taiwan (China).
Data source: Santini et al., 2022

Droughts reduce agricultural output and, in general, the more severe the drought, the larger the output loss. However, the relationship is complex and depends on several factors, including crop type, location, irrigation availability and drought characteristics.
Risk of crop yield loss from droughts
Recent research indicates that wheat production is likely to decrease in comparison to its long-term average during severe droughts, particularly in the United States and Canada. Maize experiences the highest risk of yield reduction in India, while rice is most prone to drought impacts in Vietnam and Thailand. The United States, Russia and India face the highest risk of soybean yield loss during droughts. Furthermore, the risk of yield reduction increases more rapidly when transitioning from moderate to severe drought conditions, rather than from extreme to exceptional drought levels, suggesting that crop yields exhibit a non-linear response to increased drought severity2 (see Figs. 1 – 4, left and right) Despite the complexity appropriate soil and agronomical management practices are powerful tools to reduce the risk of impacts posed by droughts on crops.
Figs. 1 – 4 Yield loss risk. The probability (%) of yield loss (i.e. yield dropping below historical average) when experiencing a moderate, extreme, severe and exceptional drought for (Fig. 1) wheat, (Fig. 2) maize, (Fig. 3) rice and (Fig. 4) soybeans. Only the top 10 producing countries for each crop are displayed.
Data source: Leng et al., 20192
Map 2: Wheat Winter
Map 1: Wheat Spring
Map 5: Rice
Map 4: Maize
Map 3: Soybean

Map 1: Global distribution of farm field size, ca. 2017. The spatial distribution of dominant field size, estimated by means of an innovative crowdsourcing methodology, indicating that smallholder farms may occupy up to 40 % of agricultural areas globally.
Data source: Lesiv et al., 201811
Around 1.2 billion people are employed in the world’s agrifood systems, the majority being highly agriculture-dependant smallholders.
Smallholders’
relevance
Recent estimates indicate that smallholders (farms under 2 ha characterised by family-focused motives using mainly family labour for production and using part of the produce for family consumption, see Map 1, above) produce about a third of the world’s food supply while using less than a quarter of agricultural land1. Smallholders are key to ensuring sustainable agriculture and for combating undernutrition worldwide as they account for higher productivity, greater crop diversity and lower post-harvest losses when compared to large-scale, intensive agriculture (see Fig. 1, below)2 While smallholders promote a more biodiverse environment, intensive agriculture usually represents a major driving force behind habitat degradation and losses3 Increasing the viability of smallholder farming could help reduce poverty, increase food security and improve biodiversity, thus contributing broadly to the achievement of the Sustainable Development Goals (SDGs).
Smallholders’
vulnerability
Evidence from around the globe indicates that smallholders are generally highly vulnerable to shocks (e.g. droughts, pests and crop failures) due to their relatively high dependence on agriculture for their livelihoods. Figs. 2 and 3 depict the top countries in terms of agricultural labour force ca. 2022 and the evolution of agricultural labour and land from 1961 to 2021, respectively4,5 Factors that have been found to shape the vulnerability of smallholders to climate-related shocks such as droughts are inadequate education, lack of access to resources, poor institutional capacity and services and gender inequality6
Smallholders in poorly connected rural communities are particularly vulnerable due to their physical isolation, limited access to resources and lack of coping capacity7. Technical, financial and institutional support can improve smallholders’ resilience to climate change and ensure stable agricultural production and food security8
Fig. 2: Top countries in terms of agricultural labour force, 2022. The two most populous country, India and China, lead the ranking of people employed in agriculture, while countries in Southeast Asia and Africa have generally a far greater share of agriculture in employment.
Data source: International Labour Organization. "ILO modelled estimates database" ILOSTAT. Accessed February 07, 2024. https://ilostat.ilo.org/data/
Fig. 3: Agricultural land and labour evolution from 1961 to 2021. While agricultural land has generally increased worldwide during the past few decades, the number of people working in agriculture has generally declined in most middle-to-high-income and industrialised countries as people move towards employment in industry and services.
Data source: United States Department for Agriculture (USDA) Economic Research Service – processed by Our World in Data. "Agricultural labor" [dataset]. United States Department for Agriculture (USDA) Economic Research Service [original data].
Macro-economic indicators for drought resilience
Macro-economic metrics such as the Gross Domestic Product (GDP), the agriculture Gross Value Added (GVA) and the total labour force employed in agriculture are crucial for understanding a country’s economic productivity within the agricultural sector and its vulnerability to droughts (see Fig. 4, below)9,10 GDP represents the total value of goods and services produced within a country, reflecting the overall economic health. On the other hand, GVA specifically focuses on the value generated by a specific sector (e.g. agriculture), providing insights into the contribution of that sector to the overall economy.
Countries with higher GDP per capita usually show higher resilience to crop production losses associated with droughts, Moreover, in high-income countries, the agriculture GVA per agricultural worker is high as only a small percentage of the workforce is engaged in agriculture due to advanced technology and mechanisation. In low-income countries, however, the combination of low GVA per agricultural worker, relatively high number of people employed in agriculture and high agricultural share of GDP indicates limited economic diversification and poor livelihood conditions, making these economies and their agricultural workers relatively more exposed and vulnerable to droughts.
Assessing the economic impacts of drought on the agricultural sector requires a comprehensive understanding of how drought-induced productivity and capital losses can cascade through the entire economy. By examining the relationship between GDP, GVA and drought vulnerability, policymakers can better grasp the economic repercussions of droughts on the agricultural sector and implement targeted mitigation strategies. Furthermore, evaluating the socioeconomic risks of droughts, including their effects on agricultural production and GDP, is crucial for developing effective drought management policies.
Fig. 1: Farm field size area and crop/ food production, ca. 2017. Smallholder farmers produce 29 % of the world’s crops and 32 % of the world's food, while using only 24 % of total agricultural land, as seen by the cumulative total agricultural land, crop production and food supply for increasing farm size.
Data source: Ricciardi et al., 2018
Map 1: Drought risk for rainfed agricultural systems. Drought risk for rainfed agricultural systems, estimated by combining hazard, exposure and vulnerability. Higher drought risk is indicated by the deepest red colour (the 90th percentile to the global drought risk data) while lower drought risk is represented by the deepest blue colour (10th percentile).
Data source: Meza et al., 20202
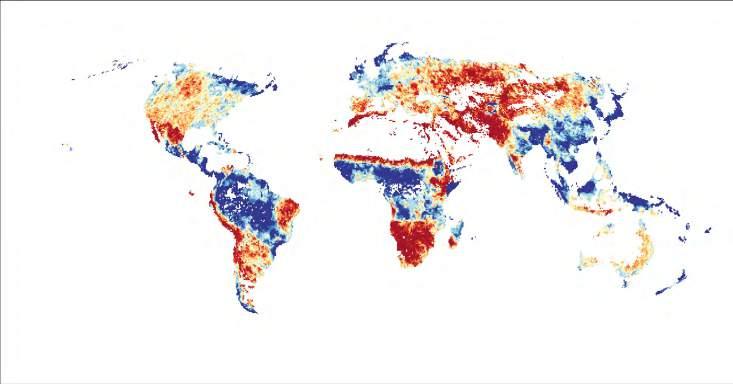

Assessing the multi-dimensional nature of drought risks is essential for enhancing the resilience of agricultural systems.
Drought risk in agriculture
Comprehensive drought risk assessments are essential tools to provide insights into the spatiotemporal variability and drivers of drought risk in agriculture (see Map 1, above) By integrating hazard, exposure and vulnerability, comprehensive drought risk assessments offer valuable information for enhancing the resilience of agricultural systems and the preparedness of vulnerable regions in sustainably addressing drought risks. While a drought can reduce both water availability and water quality, drought risks are intimately linked with how the hazard interacts with both the exposure and vulnerability in a certain location and time. Exposure refers to the presence of people, livelihoods and/or assets in an agricultural system that can be adversely affected by a drought. Vulnerability is a complex component of drought risk that depends on both biophysical and socioeconomic drivers (e.g. social susceptibility and lack of coping capacity), reflecting the predisposition of an agricultural system and its elements to be adversely affected during a drought event.
The overall increase in agricultural land over the last decades has been identified as a significant driver of drought risk due to the increased exposure of agricultural systems to droughts in many regions across the globe1 Similarly, a recent study has found that vulnerability is a main factor of high drought risk for countries in sub-Saharan Africa, some countries in western, central and southern Asia and the Middle East, mainly due to their generally higher socioecological susceptibility and lack of coping-capacity to droughts2 The combination of hazard, exposure and vulnerability highlights high drought risk in agriculture across large parts of central and western Asia, eastern and southern Africa and the north-eastern part of Brazil, while low drought risk areas under current climate conditions include parts of western and northern Europe, southern China and large parts of Southeast Asia.
Future drought risks in agriculture
Future drought risks in agriculture are of critical concern due to their potential impacts on the entire food system as well as on the correct functioning of agroecosystems and the services they provide. Climate projections indicate that droughts will become more severe and will occur more often in almost all continents (see Figs. 1, right and 2, opposite)3 threatening agricultural production in key crop-growing areas and pressuring food security and safety. Recent studies show that the global land area exposed to frequent and severe droughts is expected to expand in large parts of the Mediterranean, southwestern South America and western North America4 A significant consequence of more intense and frequent droughts, often compounded with heatwaves, is the reduction in soil moisture, which can adversely affect crop growth.
Future risks are clearly dependent on global mitigation actions limiting global warming. At 1.5 °C of global warming, the likelihood of reduced soil moisture is projected to at least double in large areas of northern South America, the Mediterranean, western China and in North America and Eurasia. This likelihood increases by up to three times at 2 °C and more than triple under 4 °C global warming5 Drought and heatwaves may also significantly reduce areas that are currently climatically suitable for crop production without a full compensation from new areas gaining suitability. Such changes may imply a more profound need for adaptation across the entire food supply chain. By looking at durum wheat, for instance, up to 19 % of currently suitable lands for growing this cereal can become unsuitable by mid-century, while this figure can go up to 48 % at the end of the century, particularly in the Mediterranean and northern America regions (see Maps 2a and b, opposite)6
Fig. 1: Relative change in the Standardized Precipitation Index (SPI-6) for a warming level of 2 °C - SSP5 – 8.5 relative to the period 1850 – 1900, for the Mediterranean (MED) region. Negative changes in SPI indicate drier conditions and higher likelihood of droughts.
Source: IPCC WGI Interactive Atlas. In Climate Change 2021: The Physical Science Basis. Contribution of Working Group to the Sixth Assessment Report of the Intergovernmental Panel on Climate Change © IPCC, all rights reserved.
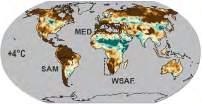
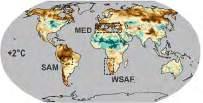
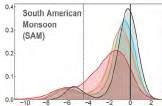
Fig. 2: Projected changes in the likelihood of an extreme single-year agricultural (soil moisture) drought event, with extreme drought defined as the driest 10 % of years from 1995 to 2014, using total soil moisture projections pooled from the CMIP6 ensemble following Cook et al., 2020 All ensemble members are treated as equally likely potential outcomes and likelihoods are calculated using the whole ensemble. Top: Percentage change in the likelihood of extreme drought at GWLs of 4 °C (left), 2 °C (middle) and 1.5 °C (right), with ‘extreme drought’ defined locally as the 10th percentile in individual grid boxes. Bottom: probability distribution functions of regional mean soil moisture anomalies for the climatic regions Mediterranean (MED), South American Monsoon (SAM) and West Southern Africa (WSAF)9 at 1.5 °C, 2 °C and 4 °C GWLs. The solid vertical line shows the baseline, that is, the 50th percentile in 1995 – 2014. The dashed vertical line shows the 10th percentile for 1995 – 2014, defining ‘extreme drought’ at the regional scale. Projections used the SSP5 – 8.5 scenario to maximise the number of ensemble members at higher GWLs, but global patterns of change are very similar for all scenarios5 and for any given GWL, similar results can be expected with other scenarios10
Source: IPCC, 2022: Climate Change 2022: Impacts, Adaptation, and Vulnerability. Contribution of Working Group to the Sixth Assessment Report of the Intergovernmental Panel on Climate Change8 © IPCC, all rights reserved.
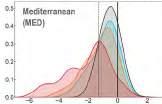

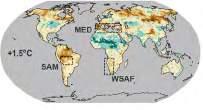
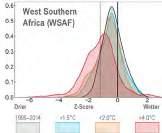

Maps 2a and b: Estimated impacts of climate change on rainfed winter-sown durum globally. Information is presented for two different scenarios (SSP370 and SSP585) and under the future period 2060 – 2090, based on the results forced using five bias-adjusted GCMs. Blue (red) colours indicate increasing (decreasing) suitability in the future. The different classes are based on the model results agreement on the change of suitability; light blue (red) is used when at least three models agree, while dark blue (red) when all five GCMs agree.
Data source: Ceglar et al., 2021

SSP370
SSP585 for the future periods (2061 – 2090)
2.2.10 The irrigation efficiency paradox
Irrigation efficiency paradox
Agriculture accounts for roughly 70 % of freshwater withdrawals worldwide (see Figs. 4 and 5, opposite)1 and often constitutes the least productive (i.e. lowest value) use of freshwater resources2 Traditionally, increasing the efficiency of irrigation systems through water conservation technologies has been promoted as a way of reducing agricultural water consumption while increasing both productivity and income3 However, substantial scientific evidence shows that increased irrigation efficiency rarely promotes water conservation4,5 This paradox is explained by the fact that non-consumed water in
Map 1: Area equipped for irrigation, with an overlay of evidence of water conservation technology on water consumption. Evidence from several places around the globe indicate that water conservation is rarely achieved when irrigation efficiency is increased.
Data source: Base map, Siebert et al., 20136 Overlay data, "Pérez-Blanco et al., 2020
low-efficiency irrigation systems (or "losses") at a farm scale (e.g. surface runoff) is frequently recovered and reused at a watershed and basin scales (e.g. by farmers downstream or the environment), while high-efficiency irrigation systems limit this potential re-use of water (see Fig. 1, below)4 In a recent global review of more than 160 case-studies that have implemented increased irrigation efficiency technologies, Pérez-Blanco et al. (2020)7 found that water consumption has increased in 83.2 % of the cases. In those cases in which water conservation is actually achieved, a combination of
The irrigation efficiency paradox refers to the fact that higher irrigation efficiency rarely results in water conservation. Behavioural policy tools combined with irrigation technology solutions are required for achieving water conservation.
water conservation technologies and policies was key to reducing water consumption (see Map 1, above) The paradox arises as improved irrigation efficiency often leads to a false sense of water security at the farm level, thus leading to the cultivation of water-intensive crops, expansion of irrigated areas and reduced return flows, generally raising overall consumption instead of conserving water. If the objective is water conservation, then a combination of allocative (e.g. by means of policies) and physical (e.g. by means of irrigation technologies) actions is required8
Global irrigation distribution and trends
Irrigation enables farmers to increase agricultural production by reducing their dependence on rainfall, playing an essential role in modern agriculture9 Worldwide, irrigated land is estimated to cover 18 % of all cultivated land, while producing about 40 % of all food10. Especially in the densely populated regions of Southeast Asia, the driving factor for increasing yields was huge investments in irrigation systems between the 1960s and 1980s (see Fig. 3, above)11 Globally, irrigation has expanded sharply since the mid-20th century, growing from an approximate 110 million hectares in the 1950s to over 300 million ha in 200512, with current estimates close to 350 million ha (in 202113). Worryingly, half of the twenty-first century's global irrigation expansion has occurred unsustainably in already water-stressed regions14 Indeed, the drastic increase in irrigated areas has caused global water withdrawals in agriculture to more than double from about 1 100 (in 1950) to 2 500 (in 1995) km3 per year15 with recent estimates for 2020 at about 2 800 km3 per year16


While some regions have extensive and well-established irrigation systems, such as Southeast Asia and parts of the United States, other regions, such as the Sub-Saharan Africa, rely mostly on rainfall (see Fig. 2, opposite) Expanding irrigation in such regions could unlock significant agricultural productivity and contribute to food security, yet it is imperative to meet any irrigation expansion with a well-balanced and sustainable water use to prevent over-extraction and environmental and land degradation17 Investments in irrigation infrastructure, particularly in underdeveloped regions, coupled with water conservation policies will be essential to meeting the growing food and water demand of the world's population and to safeguarding water and land resources for current and future generations (see Map 2, below)18


2.3 Hydropower
2.3.1 The world's biggest renewable electricity source

Droughts affect the world‘s biggest renewable source of electricity.
In 2023, the drought in the Amazon region led to the twoweek shutdown of Brazil’s 4th largest hydropower operator, located on the Rio Madeira.
The European drought of 2022 affected hydropower generation in Italy, exacerbating the record high wholesale price situation that was also worsened by Russia’s invasion of Ukraine.
Fig. 2: Hydroelectric power plants. There are three main types of hydropower generation: runof-river, reservoir (see right) and pumped storage. These differ in their capacity to supply base load or peak load electricity. Base load electricity supplies electrical power more continuously, in accordance with the baseline amount of energy that is required by users, while peak load electricity supplies for a shorter period of time when demand is high. While run-of-river plants primarily supply the base load and reservoirs have a certain degree of flexibility between both types, pumped storage can supply peak load electricity. This is possible thanks to pumped storage systems’ configuration with two reservoirs, one at a higher elevation than the other.
During periods of high electricity supply, water is pumped to the higher elevation reservoir, where it is stored until release to the lower elevation reservoir during times of higher electricity demand.
Adapted and redrawn by LJ for the World Drought Atlas, based on Office of Energy Efficiency & Renewable Energy
The 2022 drought in China’s biggest hydropower producing province, Sichuan, led to disruptions to local industries, while exports to other Chinese regions had to continue to fulfil cross-provincial power transmission contracts.
Extremely low water levels in Lake Kariba in 2019 – 2020 resulted in frequent power cuts of up to 18 hours per day for at least 3 months in Zimbabwe.
Map 1: Share of electricity production from hydropower, 2023*. Measured as a percentage of total electricity. *Data from 2022 was used where 2023 data was not available.
Data source: Ember (2024); Energy Institute Statistical Review of World Energy (2023) – with major processing by Our World in Data1
In 2024, the worst drought in 20 years in Zambia is leading to power cuts of up to 21 hours, affecting households, businesses, and even hospitals.
Hydropower provides the largest amount of renewable energy globally and supplied around 14 % of the world's total electricity generation in 20231. Global hydropower capacity has grown by 70 % in the past 20 years, though as a share of the total energy portfolio it has remained stable due to the simultaneous growth of other sources. Hydropower plays an important role especially in emerging and developing economies, where it supports the energy needs of around 800 million people2 For instance, it accounted for 45 % of Latin America‘s electricity production in 20223 In a hydropower facility, the flow of water, either from a river or from the outflow of a dam (see Fig. 2, opposite) is used to generate electricity. During drought-induced low-flows, the capacity of power plants to generate electricity and meet demand is reduced. Electricity production dependent on large reservoirs is less vulnerable to droughts due to the large water storage capacity and consequently stored energy capability, however, it can still be affected by drought4 The impacts of a decrease in hydropower generation for people and industries depend on whether other energy sources can be used to meet the demand. If an electrical grid accommodates other energy sources, such as other renewables, or thermoelectric power, power cuts or rationing might be avoided. However, there are also economic and environmental consequences to the offset of hydroelectricity with thermoelectric sources (see pages 62 – 63) and they might not all be available due to compounding hazards and impacts (see pages 67 and 70) The map above exemplifies some of the recent impacts on hydropower that drought events around the globe have caused.
The future of hydropower While the development of hydropower capacity is slowing in some parts of the world, by 2030 it is expected to increase considerably in others, including the Asia-Pacific region, Africa and the Middle East2 However, the occurrence of droughts with increased frequency, intensity and longer duration could jeopardise existing hydropower expansion plans, especially if changes in climate are not taken into consideration in the design of the plants5 Indeed, actual electricity generation may differ considerably from what was initially expected according to planned plant capacity4,5 as seen in 2023: the global average hydropower capacity factor (that is, the ratio of actual energy output to the theoretical maximum output) fell below 40 %, the lowest value in at least thirty years6
Fig. 1: What would the 2003 and 2018 European drought events’ impacts on hydropower look like under a warming future?
The melt water from snow and ice can be an important water addition to upstream rivers parts in areas of mountain water towers and it can alleviate low flows during drought events. However, with glaciers projected to further decline in a warming climate, there can be consequences for low flows, even in downstream parts of a river. A study by Van Tiel et al. (2023) investigated what the consequences of the same
Fig. 4: Net hydropower capacity additions by type, 2021 – 2030. Hydropower capacity additions expected or the future can refer to new power plant projects, or to the replacement, update or addition of turbines
growth. Hydropower development is also slowing down in Latin America and Europe, but increasing in Africa, the Asia Pacific region and the Middle East.
Data source: International Energy Agency, 2021
2.3.2 Impact chain of the effects of drought on hydropower
The hydropower sector can suffer the risk of reduced or insufficient electricity generation (see Fig. 1, below) during droughts. Hydroelectricity is a complex system, dependent on social, environmental and technological factors, all of which can be strained during drought-induced water shortages. Hydropower can be based on instream flow (run-of-river), pumped storage, or reservoirs. In the latter case, sedimentation (connected with soil erosion and floods, among other drivers) can progressively limit the
storage capacity, thereby making production even more vulnerable to intervening drought conditions. Moreover, due to aging, hydropower plants can suffer from inefficient or outdated infrastructural conditions, from the mechanical components (which could be unsuited for reduced water inputs) to limited digitalisation (which can improve management during drought conditions). Another driver of vulnerability for this sector comes from the demand side, notably when there is a high electricity demand, which
brings the system close to its capacity even before drought conditions are triggered. This demand can be driven by a concentration of industrial facilities, which in turn can be caused or enhanced by the presence of hydroelectricity plants, in a case of increased dependency (the so-called reservoir effect). Paradoxically, at times it is the very risk of drought impacts that can lead to an increase in water storage infrastructure, including reservoirs, which can be equipped for hydropower development, where possible.
However, this can feed back into the reservoir dependency in the long term. As for other systems and sectors, droughts (combined with high temperatures) can produce a spike in demand: in this case, a peak of energy demand for cooling and heating can compound with increased water demand and stimulate excessive water abstractions, for this and other sectoral water uses.
Fig. 1: Impact chain of drought risks hydropower. The impact chain conceptual model outlines the main drivers of drought risks for hydropower at the global level and their interconnections, highlighting the multiple dependencies that need to be addressed to reduce drought risks. Drivers of risks are categorised using the categories of the conceptual framework of drought risks and impacts from a systemic perspective (Hagenlocher et al., 2023, see Part 1).
2.3.3 Drought hazards for hydropower production
Due to the spatiotemporal complexity of drought and its potential impacts, many hazard indices exist that aim to characterise different aspects of drought, such as anomalies in different parts of the hydrological cycle over different time windows. Here, the Standardized Discharge Index (SQI) is calculated over a period of 6 months to evaluate the drought hazard to hydropower production. Hydropower production is dependent on river flow, often stored in reservoirs. SQI-6 estimates if river flow was high or low in the preceding half year and can thus be seen as a proxy for reservoir levels. In Maps 1 – 9 the driest event over the period 2000 – 2019 are shown for different parts of the world. In the south of Africa, the period from 2015 – 2016 experienced very low river flow, heavily impacting hydropower generation in the Zambezi River (e.g. at the Kariba Dam). This resulted in blackouts in Zambia, which is heavily dependent on hydropower (>75 % of the country’s electricity production). In South America, the most significant drought was the 2015 – 2016 Amazonian drought, which, among others, impacted hydropower generation in Brazil.
In Maps 10 – 12, the change in average SQI-6 is shown for three different warming levels (2 °C, 3 °C and 4 °C warming above pre-industrial levels), indicating how the drought hazard for hydropower may change under a changing climate. Future projections of SQI-6 differ considerably across the globe, with some regions seeing an increase in average streamflow and others seeing reductions. Increases are seen at high latitudes (Canada, Russia, Scandinavia), but also in the western U.S. and the Himalayan region. Considerable decreases are observed in the Amazonian basin and Central America as well as west Africa and the Mediterranean region. This spatial pattern is similar between warming levels, with intensity increasing as warming levels increase. Agreement on the sign of change between the models becomes better at high warming levels, but is rather poor at the 2 °C warming level, meaning that the models do not agree if streamflow will increase or decrease on average. This seems especially true for non-coastal regions in, for example, North and South America and Eurasia. Agreement in most of Africa is also poor.
While the maps displayed here show the global patterns of SQI-6, other metrics can and should be included when responding to specific drought events or formulating new policies to obtain a more complete picture of hazard conditions. Moreover, moving from the global to smaller scales may require a different selection of metrics to account for specific local conditions. Given the highly specific knowledge of local needs and conditions required to make informed choices, the involvement of stakeholders is critical in the identification of metrics and approaches to interpret and use them. In addition, utilising an ensemble of climate and/or hydrological models can help to more objectively quantify the uncertainty in how future hydroclimatic conditions will evolve. Maps 10 – 12: Average future change of SQI-6


Human-driven climate change impacts streamflow and thus water levels in reservoirs used for hydropower. Projections are uncertain but impacts may be considerable.


Map 10: +2 °C Warming level
Map 11: +3 °C Warming level
Map 12: +4 °C Warming
2.3.4 Economic and Environmental impacts
Economic impacts
The impacts of droughts on hydropower generation are often offset by an increased use of fossil fuel-powered thermoelectric plants to meet electricity demand, which can influence electricity prices1 These sources, such as coal or gas, are not only more polluting, but also more expensive than hydropower. This can lead to increased production costs and consequently higher electricity prices (see Fig. 1, right) In some cases, impacts go beyond increased prices to include load shedding (i.e. rationing measures) and power outages due to insufficient electricity generation to meet demand. These consequences affect not only households but can also be detrimental to micro, small and medium enterprises (MSMEs), whose productivity and operations get disrupted, affecting people’s livelihoods and having repercussions on economic growth and development prospects of developing countries2 A lack of diversification of the electricity generation mix, insufficient and unaffordable back-up options, financial barriers to invest in adaptation and few international electricity transmission lines are further contributors to the negative impacts of reduced hydropower generation2,3

Fig. 1: Drought impact on wholesale electricity price, Brazil.
The graph shows the monthly averaged spot market price (PLD) for electricity in Brazil’s regions from 2010 – 2021. The country’s spot market price takes into consideration hydroelectric reservoir levels, expected electricity consumption, availability of transmission and distribution, among other variables, and is an attempt to find the optimum balance between the present benefit of using water and the future benefit of storing it - measured in terms of the expected savings of fuel from thermoelectric power plants.
The graph shows that the PLD follows a seasonal trend, with prices increasing in each region’s respective dry season and decreasing in the rainy season, when hydroelectric reservoirs are full. The prices also reflect water crises (e.g. 2014/2015), reaching peak levels that do not always return to the pre-crisis level. During water scarcity periods, a special increased tariff applies.
Data source: Confederação Nacional da Indústria, 20215
Fig. 3: Electricity supply mix by region, 2020. The economic impacts of droughts on the hydropower sector can be especially severe in regions and countries that rely more on hydropower as a share of their energy mix - and for electricity exports. Of the 35 countries relying on hydropower for at least half of their electricity supply, 28 are considered emerging and developing economies, with a total population of 800 million people. Countries that rely heavily on electricity exports to support their economies can be more heavily impacted by drought. In 2022, for example, Paraguay's growth forecasts were hit by a 12 % decrease in hydropower exports compared to the previous year due to a severe drought. Thus, diversification with other renewable energy sources can increase economic resilience in face of drought.
Data source: IEA, 2020
Drought impacts on hydropower can affect end-users, such as households, businesses and industries, with increased prices, rationing and outages.
Fig. 4: Energy sector faces the second highest economic losses due to drought in the EU and UK. The estimated sectoral economic losses due to drought in the EU and UK (under present socioeconomic conditions, averaged over different warming levels) show that the energy sector is expected to suffer the second largest share of direct economic damage, after only agriculture. While impacts to the energy sector represent 23 % of the total damage on a regional level (EU + UK), this can differ when looking into single regions. In Scandinavia and in the Baltic Countries, the share of economic losses due to drought for the energy sector is considerably higher (48 %), as hydropower is an important energy source for the area. However, these damages represent only direct drought losses and do not account for indirect effects (see Fig. 5, right)
Data source: Naumann et al., 2021
Highly polluting fossil fuels are used to offset hydropower generation gap in case of drought, increasing GHG emissions. Some reservoirs can be highly emitting as well.
Fig. 5: Direct and indirect economic damages of the 2012 – 2016 drought in California. In addition to the direct economic impacts due to reductions in hydropower and increased electricity demand, there are also indirect effects of offsetting decreased hydropower production with fossil fuel powered electricity sources on health and excess mortality due to increased air pollution from GHG emissions. The increased emissions and the effects on health can be monetised by using a social cost of carbon (SCC) and a value of statistical life*. This was calculated for the 2012 – 2016 drought event in California using a SCC value of $ 117 per ton and $ 193 per ton, and a value of statistical life of $ 10.95 million per mortality. This shows that taking indirect impacts into consideration increases the economic costs associated with droughts, which are 1.2 to 2.5 times higher than direct costs reported in previous studies.
* The value of statistical life is a measure that reflects individuals’ willingness to pay for fatal risk reduction, that is, the economic value to society to prevent a premature death by one.
Data source: Qiu et al., 2020
Environmental impacts
Emissions from offset with fossil fuels
The use of fossil fuel-powered thermoelectric plants (such as coal, diesel or gas) to offset decreased hydropower production during droughts also impacts CO2 emissions, increasing the emissions footprint1,8. For example, a decrease of 5.6 % in the Chinese hydropower generation in 2023 due to severe droughts contributed to a 6.2 % increase in coal-fired generation in the country. The International Energy Agency (IEA) estimates that decreased hydropower production due to droughts drove around 170 Mt of CO2 emissions globally in 20239 (see Fig. 6, right)
Some hydropower reservoirs can emit relatively high levels of GHGs, requiring a case-by-case examination While hydropower is generally considered to be a clean energy source, in some cases hydropower reservoirs can reach – and even exceed - the emission rates of thermal plants10,11 In most hydropower projects around the globe, emissions per unit electricity generated tend to be within the range of other renewable sources, such as wind and solar plants. However, studies have shown that in some cases, as in the lowland Amazon, facilities can be more greenhouse-gas (GHG) intensive than fossil-fuel based plants11 This is due, amongst other factors, to GHG emissions from decaying organic matter within the reservoir10,11 As water temperature influences this process, lower water levels caused by droughts contribute to future reservoir GHG emissions. Thus, the climate change mitigation versus emissions potential of each reservoir and, consequently, the optimal location for new reservoirs, must be examined case-by-case. Additionally, the technological capture of methane emissions from reservoirs can be considered as an energy source10
Fig. 6: Change in global CO2 emissions by driver, 2022 – 2023. In 2023, severe and prolonged droughts in hydropower producing regions (e.g. India, China, Southeast Asia and North America) - exacerbated by the phenomenon of El Niño - led to a record decline in global hydropower generation. This shortfall provoked the emission of around 170 million Mt CO2 from the use of fossil fuels-powered plants to offset the decreased hydroelectricity. That is, if the availability of global hydropower generation had remained consistent with 2022 levels, an additional 200 terawatt-hours (TWh) would have been generated, avoiding emissions from non-renewable sources
Data source: IEA, 2024
Fig. 7: GHG emissions from hydropower reservoirs. Different mechanisms lead to the occurrence of biogenic emissions in reservoirs. They vary in importance depending on the reservoir's characteristics (e.g. depth, vegetation cover) and location (e.g. climate).
Adapted and redrawn by LJ for the World Drought Atlas, based on Levasseur et al., 202112

Map 2: Average per-reservoir-area rates of emissions.
The global distribution and magnitude of
Fig. 2: Blackouts.
2.3.5 Compound events and impacts on hydropower production
Fig. 1: Large dams by purpose (left) and shares of hydropower and non-powered dams by region and globally (right).
Reservoirs can serve multiple purposes, sectors and priorities creating trade-offs in their operations and water allocations. For instance, the use of a reservoir for flood control would favour keeping low water levels to accommodate the inflow of more water1 However, this reduces the availability of water during drought, contributing to sector competition for the available water and increasing the risk of impacts on energy production. Preparedness for drought, on the other hand, would favour high water storage, which in turn can make reservoirs more susceptible to overtopping or dam failure in the event of extreme rainfall1 The left side of the figure shows that 10 % of large dams serve the singlepurpose of generating hydropower, while 17 % of large dams serve multiple purposes. The right side of the figure shows the percentage of hydropower generating reservoirs that serve multiple purposes, which lies at almost 40 % on a global level.
Data source: International Energy Agency, 2021
Map 1: Droughts compound with other hazards, affecting hydropower generation.
The map shows for various locations around the globe what other effects of climate change on hydropower generation are expected to co-occur with droughts, based on observed trends and near-future projections. This is based on a review of the literature done by Wasti et al. (2022), whereby here only the locations expected to be affected by droughts were selected. Effects that are addressed by more than half of the studies included in the review are considered to be of “high confidence” and have a darker hued icon. Those addressed in less than half of the studies, conversely, are considered to be of “low confidence” and thus marked with a lighter hued icon.
Data source: Based on Wasti et al., 2022
Fig. 2: Change in global CO2 emissions by driver, 2021 – 2022 (Mt CO2). In 2022, extreme weather contributed approximately 60 Mt of CO2 emissions due to energy demand for cooling and heating for buildings. Around two-thirds of this amount resulted from cooling needs.
Data source: IEA, 2023


3: Warmer summer days increase energy demand. When heatwaves occur simultaneously with droughts, not only is energy generation affected by the drought, but the energy demand for cooling (i.e. electric-powered fans and air conditioning) increases4, 5 This further stresses the electricity systems’ ability to meet demand. In 2022, for instance, extreme temperatures led to an increase in the number of cooling degree days* in different parts of the world compared to the 2000-2021 period, contributing to an increase in energy demand. Moreover, due to the interconnectedness of the electricity supply system in some cases, a drought and heatwave may not need to occur in exactly the same location for the impacts to compound. For example, if a heatwave occurs in a region to which a hydropower system supplies electricity, the demand for that system‘s electricity will still be higher. At the same time, when temperatures are too high, some thermoelectric power plants might need to be temporarily shut down due to a lack of cooling water, or to restrictions on the release of warmed up cooling water back into water bodies due to environmental concerns, decreasing the availability of alternative electricity sources6
*Cooling degree days is a measure that illustrates the average number of degrees and days above a temperature threshold at which there might be an energy demand to cool buildings. In this study, the 21°C threshold was used.
Data source: IEA, 20185
Fig. 4: Power generation capacity required for cooling by country/region in the Baseline Scenario. Due to global warming and extreme heat events, combined with population and economic growth, it is estimated that by 2050 the global energy capacity need to meet space cooling demand will rise to 3 350 Gigawatts, from 850 GW in 2016. This increase in demand, with peaks during extremely hot days, puts pressure on the energy system, which may be impaired if the heatwaves co-occur with droughts.
Data source: IEA, 2018


2.4 Inland navigation
2.4.1 Droughts can obstruct transport on inland waterways
Drought-induced low flows affect navigability on inland waterways.
Inland navigation (i.e. on rivers, canals, streams and lakes)
can be both a large-scale, commercially-significant mode of transport (e.g. barges transporting bulk goods, Fig. 1, below) and, at a local scale, an important means of access, transportation and distribution for riparian communities, that is, communities that live along watercourses (Fig. 2, opposite)
It is estimated that there are over 600 000 km of navigable waterways throughout the world1
At both scales, navigable waterways can be severely disrupted by drought-induced low flows, but the impacts of droughts differ. In large waterways, low flows can disrupt the supply of materials to industries, which can face increased transportation costs due to so-called low-water surcharge fees2 charged by navigation companies. These industries might also face disruptions to their supply chain due to delays or even a complete stoppage in the delivery of goods3 In some countries, this can have direct impacts on their annual GDP. Replacing inland water navigation with rail or road transport, however, has environmental and economic implications, as there are higher emissions associated with other transport modes, as well as losses in efficiency compared to inland water transport’s economies of scale4 This is due to the fact that barges are able to transport much more cargo per unit of distance than other transport modes (see Fig. 3, opposite)
As for small-scale inland navigation, low-flows caused by drought events can hamper access through watercourses for riparian communities or cut them off. Consequently, this can affect people’s access to basic goods such as health facilities, education centres and livelihood activities as well as to drinking water and food supplies5
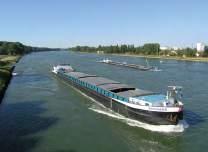

Map 1: Identification and global distribution of Golden Inland Waterways (GIWs). Wang et al. (2020) classified large rivers worldwide into categories and levels (small, S; middle, M; and large, L) based on their bearing capacity index (BCI) and socio-economic index (SEI). The BCI refers to the navigational capacity of a given waterway in terms of freight volume that can pass, while the SEI approximately represents transport need based on socio-economic development. The map shows 34 waterways that fall under the middle and large categories for the calculated indexes.
Data source: Wang et al. 2020
Map 2: Total length of navigable rivers, canals and other inland waters.
The map shows the total length of navigable rivers, canals and other inland waterways per country. Not all the navigable waterways have the capacity to carry large vessels and are commercially significant.
Data source: CIA World Factbook, 2021

Fig 2: Riparian communities are especially vulnerable to isolation due to severe droughts. Low flows can hinder access to basic goods and services, such as food, healthcare and education5 as the 2023 and 2024 droughts in the Amazon region have shown
Source: Fernando Leceta Gobitz, distributed via imaggeo.egu.eu,
CC BY-SA 3.0, via Creative Commons.
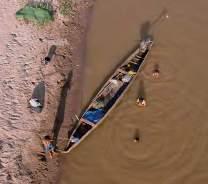
Fig 3: Inland water freight vs. rail or road transport.
Inland water transport can be very efficient compared to road or rail freight transport thanks to its scale advantages. However, droughts disrupt this advantage by limiting the capacity that can be transported over low water levels. Adapted and redrawn by LJ for the World Drought Atlas, based on https://unpointcinq.ca/dossier-special/ marine-marchande-empreinte-carbone/ and inspired by National Waterways Foundation, 20179
Fig 1: Large navigable inland waterways. Under normal water flow conditions, barges are used to transport large quantities of goods over inland waterways. Source:
DE, via Wikimedia Commons.
2.4.2 Impact chain of the effects of drought on inland navigation
The inland navigation sector is exposed to multiple risks during droughts, the impacts of which depend on local characteristics of the rivers and their use. For waterways serving industrial activities through the delivery of raw materials, drought can lead to a disruption of energy and industrial production (see Fig. 1, below) which most often results in increased production costs. These activities generally require large channels, on which barges with high carrying capacity can navigate. Because of these large loads, channels’
morphological characteristics are extremely relevant factors in creating vulnerability of the sector, as drought-induced low flows occurring in rivers’ bottlenecks is enough to disrupt or halt navigability. In some major arteries of inland navigation for industrial uses, the total amount of transported goods and vessel size have increased considerably in recent decades; during low flows, this translates into more ships having to be deployed with reduced loads to ensure the regular level of delivered goods. However, this results in delays, as more vessel
traffic is generated against a reduced level of navigability. In many areas around the world, inland navigation is also critical for delivering essential goods, such as food and medicines, to otherwise isolated communities. This dependency on inland navigation, that ensures access to markets, is a major driver of vulnerability to the impacts of drought. In some cases, risks in this sector induce important infrastructural adjustments, for example in the form of canal dredging, locks and construction of reservoirs to ensure enough water to allow navigability.
These adjustments can directly affect other competing water uses, for instance disrupting environmental flows necessary for ecosystems, and, overall, can induce higher water abstractions for other sectoral uses and, in turn, affect surface and groundwater resources.
Dependency
(increased number of vessels to account for reduced load) Increased vessel size (for industrial goods transport)
Infrastructural adjustment (canal dredging, locks, reservoirs)
Increased competition over water resources
Dependency on inland navigation for transportation of goods (bulk goods/industrial production) Channel width, depth and other morphological characteristics (e.g. bottlenecks)
Global/regional market incentives
Fig. 1: Impact chain of drought risks for inland navigation. The impact chain conceptual model outlines the main drivers of drought risks for inland navigation at the global level and their interconnections, highlighting the multiple dependencies that need to be addressed to reduce drought risks. Drivers of risks are categorised using the categories of the conceptual framework of drought risks and impacts from a systemic perspective (Hagenlocher et al., 2023, see Part 1).
2.4.3 Drought hazards for inland navigation
Due to the spatiotemporal complexity of drought and its potential impacts, many hazard indices exist that aim to characterise different aspects of drought, such as anomalies in different parts of the hydrological cycle over different time windows. Here, the Low Flow Index (LFI) is used to assess the drought hazard for inland navigation. This index is calculated by determining the maximum number of consecutive months in which streamflow is below the (monthly) 5th percentile. In Maps 1 – 9 the driest event over the period 2000 – 2019 is shown for different parts of the world. The 2015 drought in Europe significantly impacted navigation in Germany and European Russia, with cargo needing to be reduced up to 50 %. In Northern America, the 2012 drought caused record-breaking low-water levels on the Mississippi River which threatened to shut down shipping. The 2016 drought in the Amazon basin also affected navigation, isolating local populations and limiting their access to essential goods. In 2010, low water levels in the Mekong River also cut off people from their livelihoods and forced trade movement over land instead.
In Maps 10 – 12, the change in the number of months below the 5th percentile is given, indicating changes in the flow conditions that may occur under future scenarios of warming levels of 2 °C, 3 °C, and 4 °C above the pre-industrial level. These maps are based on five (for 2 °C and 3 °C warming levels) or three (for 4 °C warming level) different GCM simulations. Future conditions of low flow are projected to worsen in most places around the globe on average. Reduction in the number of months below the 5 % threshold is mainly seen in parts of the Indian subcontinent and Himalayan region, along with parts of eastern Asia, while increases are projected for the rest of the world. These increases, averaged between the different models, can be very large in some places, particularly under a 4 °C warming level. However the agreement between the models is very poor, indicating uncertainty in the projections. While the maps displayed here show the global patterns of low flow, other metrics can and should be included when responding to specific drought events or formulating new policies to obtain a more complete picture of hazard conditions.
Moreover, moving from the global to smaller scales may require a different selection of metrics to account for specific local conditions. Given the highly specific knowledge of local needs and conditions required to make informed choices, the involvement of stakeholders is critical in the identification of metrics and approaches to interpret and use them. In addition, utilising an ensemble of climate and/or hydrological models can help to more objectively quantify the uncertainty in how future hydroclimatic conditions will evolve.
Maps 10 – 12: Future changes of Low Flow w.r.t. the period 1985 – 2014
Maps 1 – 9: Examples of drought events during 2000-2019 (based on LFI) Map 10: +2 °C Warming level Map 11: +3 °C Warming level Map


Human-driven climate change impacts streamflow and thus capacity for navigation. Projections are very uncertain but changes may be very large.


2.4.4 Navigation risk due to low flows
During drought-induced low flows the water depth along waterways or in certain bottleneck points might be too shallow for vessels to pass when carrying their usual load. Thus, inland water transport companies might need to employ smaller vessels with lower draughts (see Fig. 3, right) - if available in their fleet - or decrease the load of larger vessels to avoid grounding. Due to the vessels’ restricted carrying capacities, more trips are needed to deliver the same quantity of goods1 This can lead to an increased traffic intensity on waterways and higher berth occupancy (see Fig. 4, right) triggering longer queues at locks and bottleneck points2 In addition, vessels might face difficulties in passing through locks, as water may not be sufficiently available to fill and empty the lock chambers that move vessels between different water levels (see Fig. 1, below). As a result of these processes, the delivery of goods via waterways during drought events can suffer delays, transportation surcharges, or a full halt if bottlenecks cannot be bypassed2
Shallow waters, bottlenecks and locks cause delays and disruptions to inland water transport during droughts.
3: Profile of a cargo ship in a navigation channel. The amount of cargo that a vessel can carry on inland waters depends on the vessel structure and on the minimum depth of the water in the shallowest part of the transport trajectory. The depth reached by a vessel’s draught increases with cargo weight. During drought-induced low flows the space between the draught and the riverbed decreases. Thus, in order to keep a safety margin for navigation, the so-called keel clearance, vessels need to reduce the amount of cargo that they carry.
Redrawn by LJ for the World Drought Atlas, based on Central Commission for the Navigation of the Rhine (CCNR), 2022
Fig. 4: Queue formation in quays. The berths in wharfs or quays are used for the loading and unloading of vessels. During low flows, as ships need to make more travels, or more ships are employed to compensate for the reduced cargo carrying capacity, the occupancy rate of berths increases. This can lead to the formation of queues, which increases the waiting time for ships in ports, contributing to the delays in transported goods1 Low flows might reach a point where it is not feasible for ships to sail due to the risk of grounding or lack of economic profitability. In that case, the number of ship travels might decrease again2
Redrawn by LJ for the World Drought Atlas, based on Komarov Andrey stock.adobe.com
Fig. 2: Reduced load capacities require employment of more vessels. Vessels can only operate at full capacity load under sufficient water levels. The lower water levels get during droughts, the less cargo a vessel can carry, to avoid grounding. As a consequence, more vessels need to be employed to transport the same tonnage of goods.
Redrawn by LJ for the World Drought Atlas, based on CCNR Reflection paper “Act now!” on low water and effects on Rhine navigation, Edition 3.0 of 27 October 2023, based on slides from CONTARGO4
Fig. 5: Low water surcharges. Inland water transport companies apply transportation surcharges when water levels fall below a certain threshold, to compensate for increased costs from having to employ more vessels due to reduced loading capacities (see also Fig. 2, left) The low water threshold used varies per location, with the Kaub gauge in the German part of the Rhine exemplified in the figure. There is no official level at which traffic on the Rhine is stopped – rather, this is a decision that needs to be made by boatmasters. Below certain gauge levels, companies have no obligation to transport and may opt to not take responsibility for the risk of grounding.
Adapted and redrawn by LJ for the World Drought Atlas, based on CCNR Reflection paper “Act now!” on low water and effects on Rhine navigation, Edition 3.0 of 27 October 2023, based on slides from RHENUS Logistics
In the Amazon Basin most people live close to rivers, which are the fundamental basis of transportation in a region where roads and highways exist only in a small portion of the territory.
Local populations have developed interesting adaptation strategies to the alternating flood and dry season that occur in the region, from floating vegetable gardens and floating houses, during flooding, to fast-growing crops in the dry season, before the following flood period starts. However, the increased magnitude of recent floods and droughts has posed major challenges.
In 2023, hundreds of thousands of people were isolated by the largest drought that has ever occurred in Amazonia Rural populations, which are highly dependent on the nearest urban areas to access basic services such as education, health systems and food markets, could not access these services for a few months. Access
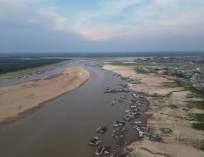
to safe drinking water was largely affected by the lack of adequate water supply facilities within the communities and the impossibility to access nearby areas that could provide drinking water. As a consequence, polluted rivers were the main source of drinking water for many people during the drought event, leading to serious health impacts such as diarrhea surges. These health impacts were further aggravated by the compounding of the drought with other hazards and environmental issues, such as heatwaves and the smoke arising from deforestation practices.
During extreme droughts, navigation distances largely increase, imposing several extra difficulties and costs to the population: in 2023 many communities saw the distance to the nearest urban areas (which in the Amazon region is calculated in terms of units of time) increase from a few hours to more than 10 hours – or even to days, in some cases.
These increased costs, combined with decreased income possibilities due to their isolation, reduced communities’ ability to withstand the drought impacts. The high social vulnerability of these populations and the lack of decentralised infrastructure, for instance related to health, makes them largely dependent on the few health facilities that exist in the region, which were inaccessible due to low water levels during the disaster. As a result, humanitarian aid, such as food, water and medicines, had to be provided by
Some
and
Mamirauá Institute for Sustainable Development, Tefé, Amazonas, Brazil.
and 2024 led to historically low flows, impacting the local populations and fauna.
7: Communities in the Brazilian Amazon that are prone to isolation. The maps depict human settlements – divided into Indigenous villages and non-Indigenous localities - that are prone to isolation during severe droughts in the Brazilian portion of the Amazon basin. Grey marks represent the remaining localities. Drawn by LJ for the World Drought Atlas. Data
Lead Author: Ayan Fleischmann,
Effect of low flow on riparian communities
Fig. 6: The severe droughts in the Amazon region in 2023
Left, image of the dry Tefé Lake during the 2023 drought, in front of the city of Tefé;
Source: Débora Hymans, Mamirauá Institute for Sustainable Development, Brazil. Right, image of the dry Coari Lake during the 2023 drought, in front of the city of Coari.
Source: Ayan Fleischmann.
Fig.
U.S.: In 2012, the drought in the U.S. affected water levels in the Mississippi River, with barge depths reduced from the normal 14 to 7 feet deep (from circa 4 m to 2 m).
T he decrease in water levels disrupted the flow of goods through inland navigation. The drought also affected the transportation routes and fishing grounds of Native American peoples residing along the river. In total, the drought created costly challenges for communities and the broader economy, with losses estimated up to $ 20 billion.
Rhine: The 2018 drought in Europe impaired navigation on the Rhine (see Fig. 1, top right) Europe’s busiest waterway corridor, on which raw materials and finished goods from multiple industries along its riverbanks are transported. Water levels dropped to historic lows, severely limiting the depth at which vessels could navigate. This forced many vessels to reduce their cargo loads to prevent grounding, leading to decreased efficiency and higher shipping costs (see Fig. 1, opposite) Some larger vessels were unable to navigate at all, disrupting supply chains and causing delays in the delivery of goods. This had a significant effect on some of the countries that rely on the waterway. For example, Germany faced a 1.5 % drop in its industrial production, which resulted in a 0.4 % decrease of its GDP Map 1: Global distribution of bearing
Panama: The 2023 El Niño-induced drought in Central America had unprecedented impacts on navigation through the Panama Canal, which carries 5 % of al global maritime trade. Global trade was impacted, as cargo ships were forced to wait for weeks to use the canal due to the decreased amount of water available to fill the canal locks. Moreover, restrictions were imposed on ship depths, equally impacting international supply chains. Shippers auctioned slots to jump the queue or opted for detours. The drought affected the national income of Panama as toll revenues dropped by $ 100 million per month 3 threatening employment in canal-related industries 4

Fig. 1: Increased rate for transport of liquid cargo on the Rhine during low flow periods. The graph illustrates the liquid cargo freight rate index (yearly averages) for gasoil transport in the ARA-Rhine area, showing the price increase during the low flow periods in 2011, 2015 and 2018.
Data source: Central Commission for the Navigation of the Rhine (CCNR) and Global Insights
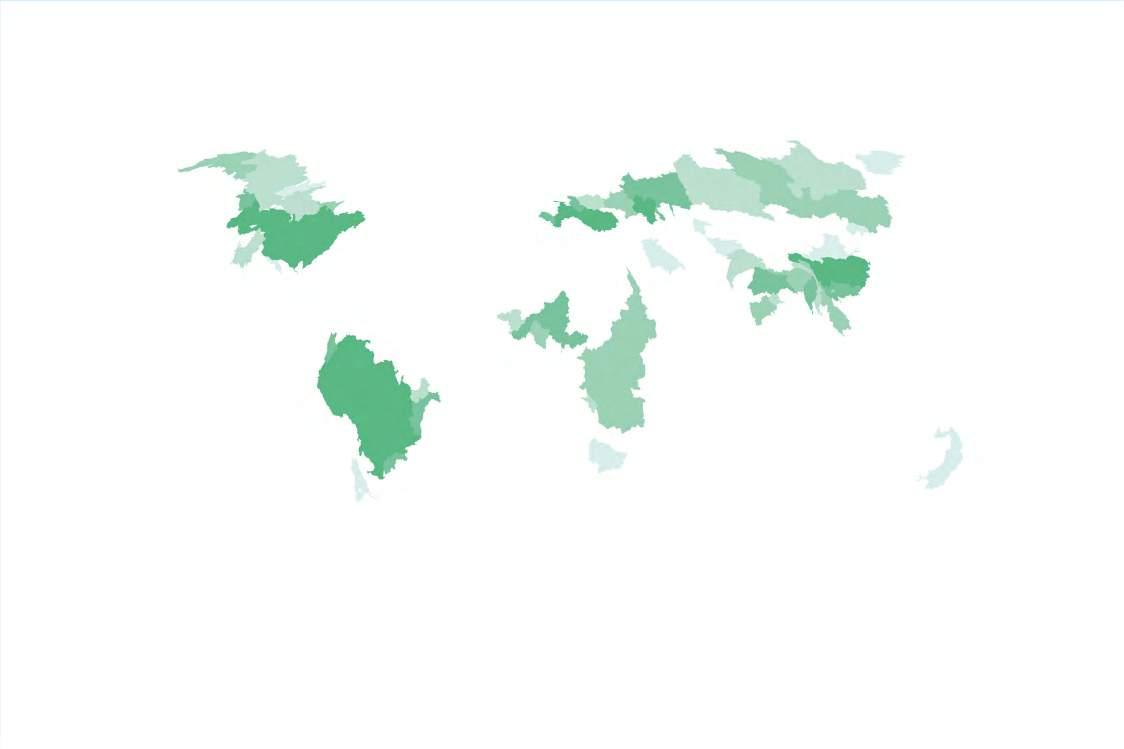
China: In the summer of 2022, the Yangtze River, China’s longest and most important river, which connects the mid and southwest of the country with the Shanghai seaport 5 reached record-low water levels, with some sections and tributaries drying up entirely6
Some monitoring stations measured a six-metre fall in water levels, reaching the lowest levels recorded since 1865 The low flows affected inland navigation, leading to some shipping routes in the middle and lower sections closing down 8

Panama Canal
The Panama Canal lock systems use around seven billion litres of water per day to raise and lower vessels4. Lake Gatun (Lago Gatún), the source of this water, fell to historically low levels in 2023 due to rainfall deficits during the rainy season in the lake catchment area caused by strong El Niño conditions, which compounded with increased water demands for public water supply. As a result, the number and size of ships that were allowed to pass through the canal had been restricted by the Panama Canal Authority. This affected global shipping, forcing some ships to take longer ocean routes, causing delays in goods deliveries and increasing demand for truck and rail services – resulting in higher costs and GHG emissions4. With about 5 % of seaborne trade passing through the canal – but a much higher percentage of the traffic between certain regions – the event has highlighted the interconnectedness of global trade, as the effects of low flows at a so-called bottleneck point can cascade to areas far away from where the hazard is taking place.
Fig. 3: What would the 2003 and 2018 European drought events look like in the future?
The melt water from snow and ice can be an important contribution to upstream rivers parts in areas of mountain water towers, and it can alleviate low flows during droughts events. However, with glaciers projected to further decline in a warming climate, there can be consequences for low flows, even in downstream parts of a river. A study by Van Tiel et al. (2023) investigated what the consequences of the same weather conditions of past drought events in Europe (e.g. 2003 and 2018) would look like at future moments in time, taking into consideration future glacial retreat. The results show that low flows along the Rhine would worsen in future conditions (purple represents near future and orange far future conditions, obtained by climate projections under the RCP8.5 scenario), both upstream and downstream, increasing the duration of impaired navigation days.
Adapted and redrawn by LJ for the World Drought Atlas, based on Van Tiel et al., 202311
Fig. 2: Quarterly inland waterway freight transport in the EU, 2014 – 2022. In the graph it is possible to see sharp declines in inland waterway transport activities in the European Union in the drought years of 2018 and 2022. Particularly, the drop in the fourth quarter of 2018 was the highest decline registered during the period from 2014 to 2022. In the third quarter of 2022, inland water transport performance in the EU was at its lowest since quarterly data are available (i.e. the first quarter of 2006).
Data source: Eurostat, 202410
Impaired inland navigation can have cascading effects through supply chains and trade.


2.5 Ecosystems
2.5.1 Healthy ecosystems are critical for maintaining the resilience of habitats, landscapes and human systems to drought
Biomes
Boreal Forests/Taiga
Deserts & Xeric Shrublands
Flooded Grasslands & Savannas
Mangroves
Mediterranean Forests, Woodlands & Scrub
Montane Grasslands & Shrublands
Temperate Broadleaf & Mixed Forests
Temperate Conifer Forests
Temperate Grasslands, Savannas & Shrublands
Tropical & Subtropical Coniferous Forests
Tropical & Subtropical Dry Broadleaf Forests
Tropical & Subtropical Grasslands, Savannas & Shrublands
Tropical & Subtropical Moist Broadleaf Forests
Tundra
Ecosystem drought occurs when below-normal water supplies stress ecosystem processes and function, but the exact conditions that trigger stress vary greatly across biomes and ecosystems (see Map 1, above) Whether a dry period is considered a drought depends on its intensity, timing and duration; the prior adaptations of the ecosystem; and the mediation of human influence1,2 Droughts can impact all aspects of ecosystem function, including biodiversity levels (pages 82 – 83) and carbon cycling (pages 84 – 85) Impacts can be more severe when drought co-occurs with other hazards (pages 90 – 91)
Unlike some other natural hazards, the impact of drought may lag behind the initial onset of the drought event and carry over after it has ended. The recovery time of an ecosystem is defined as the time it takes to return to its pre-drought functional state3,4,5 Coupling drought occurrence data with ecosystem recovery time can highlight the vulnerability or resilience of the system to current and future trends (see Map 2, right)
Human influences can exacerbate or mitigate the impact of drought6 For example, water releases from a reservoir that optimise hydropower production can support energy production during drought but change streamflow timing downstream, potentially creating even greater water shortages for aquatic and riparian ecosystems compared to unaltered flow. Conversely, floodplain protection can mitigate drought by holding water longer on the landscape, recharging groundwater and offering habitat refugia.
mega-droughts (e.g. Western U.S., Chile, & Australia) are becoming more frequent and prolonged, exacerbating hazards like catastrophic wildfires and increasing the likelihood of triggering ecosystem transformation (see 2.5.7)11,12,13
Map 1: Global map of trends, tipping points and impacts of drought.
Biomes are geographical regions with distinct physical and climate characteristics that have led to the development of a specific biological community. Drought impacts (red) almost all biomes worldwide. Drought occurrence and characteristics are changing, largely due to climate change (purple). Finally, drought can lead to tipping points (blue), abrupt and possibly irreversible changes between one ecosystem state and another4
Data source: Dinerstein et al., 201728
Map 2: Drought recovery time. Drought impacts last beyond the end of a dry period. Recovery time is the time required after a drought has ended for gross primary production, a measure of plant activity through photosynthesis, to return to pre-drought levels.
Data source: Schwalm et al., 201729
Value of Ecosystems and Ecosystems as a Value

Since baseline adaptations to dry periods vary greatly across biomes and local soil conditions, it is critical to consider the impacts of ongoing trends that are changing ecosystems’ exposure to drought, often faster than adaptation is possible. In extreme cases, ecosystems may reach a tipping point where impacts are so severe that the system cannot return to its previously stable state (see Map 1, above)7 Globally climate change is the primary cause of these aggravated trends and impacts, but regionally other influences such as land use conversion (e.g. converting forest to agricultural land), land degradation and water abstraction are also important8


Ecosystem services is a popular term in Western science and policy for the direct and indirect ways that ecosystems support human well-being which can be threatened by periods of drought (see Fig. 1, right) They are generally categorised as provisioning (products like food and water), regulating (services from ecosystem function, like flood regulation), cultural (nonmaterial spiritual, emotional, mental and intellectual value) and supporting (processes that enable healthy ecosystem function) services25. A more recent term in use by the Intergovernmental Platform on Biodiversity and Ecosystem Services26 is nature’s contribution to people which includes ecosystem services but is intended to be more encompassing of other knowledge and valuation systems.
However, both these terms frame ecosystem value in relation to humans. Alternatively, the intrinsic value of ecosystems refers to their inherent value, independent of the benefits they provide to humans27 In addition, many worldviews, particularly Indigenous and non-Western value systems, place emphasis on reciprocity and mutual respect where humans are understood as integral to ecosystem processes and have a duty of stewardship and care toward the landscapes they depend on27
2.5.2 Impact chain of the effects of drought on ecosystems
Ecosystems exist in a delicate balance of abiotic (including climatic) and biotic factors and as such they are vulnerable to drought risks and impacts, as these can significantly and at times irreversibly alter this balance. Terrestrial and aquatic ecosystems can both suffer from droughts. Among the multiple risks that are common to these types of ecosystems are loss of biodiversity, alteration of the carbon cycle and ecosystem transformation (which also results in a reduction of provision of ecosystem services for humans) (see Fig. 1, below) Naturally,
every ecosystem is uniquely characterised by its own set of drivers of risks, dependent on its location, biotic communities, physical features and innumerable other factors. However, some overarching drivers of risks can be identified. From the hazard side, ecosystems can suffer from droughts occurring at every level of the hydrological cycle, as ecosystems can be directly dependent on precipitation, soil moisture, surface water and groundwater alike. Human activities such as land cover changes and land use conversion have the potential to
significantly increase ecosystems’ vulnerability and exposure to drought. For instance, they can lead to fragmentation of the ecosystem: that creates isolated, smaller patches of habitats, individually with a higher ratio of edges compared to the interior area, which increases exposure in case of drought events. Fragmented ecosystems are more vulnerable to drought impacts as species have limited options to escape impacts by moving or migrating to adjacent environments. Land cover changes can also lead to soil and land degradation
in terrestrial ecosystems, which severely diminish the capacity of the ecosystem to recover from droughts (e.g. by depleting soils’ ability to retain water). In the case of ecosystems, carryover or legacy effects are particularly relevant, as in some cases it might take multiple years of accumulated drought impacts before the ecosystem shows a severe response (e.g. collapse). Ecosystems are also impacted by the other sectoral water uses, which might undermine their functions by inputting increased concentration of pollutants, but also by requiring
regulation of water flows, which might disrupt the availability of sufficient water of the right quality and at the right time for the sustenance of ecosystems. While in many countries environmental flow regulations ensure that ecosystems receive the necessary amount of water despite other competing uses, these regulations are sometimes waived during droughts to benefit other sectoral uses, such as water supply or industrial uses. This change in prioritisation can considerably endanger ecosystems and lead to an increase in water abstractions, ultimately compounding the water shortages experienced by the system.
on
Overoptimisation of ecosystems resources for human use
Carry-over/legacy effects from previous drought impacts (e.g. plant stress, tree mortality, depleted wetlands)
Soil and topography characteristics and conditions
Alteration of carbon cycle TERRESTRIAL & AQUATIC ECOSYSTEMS
Loss of biodiversity (lower resilience to drought)
Increased/excessive water abstractions
Increase of conditions leading to other hazards (wildfires, pest outbreaks, heatwaves, flash floods, etc.) Surface
Fragmentation of terrestrial and aquatic ecosystems
Fig. 1: Impact chain of drought risks for ecosystems. The impact chain conceptual model outlines the main drivers of drought risks for ecosystems at the global level and their interconnections, highlighting the multiple dependencies that need to be addressed to reduce drought risks. Drivers of risks are categorised using the categories of the conceptual framework of drought risks and impacts from a systemic perspective (Hagenlocher et al., 2023, see Part 1).
2.5.3 Drought hazards for ecosystems
Due to the spatiotemporal complexity of drought and its potential impacts, many hazard indices exist that aim to characterise different aspects of drought, such as anomalies in different parts of the hydrological cycle over different time windows. Here, the Standardized PrecipitationEvapotranspiration Index (SPEI) is calculated over the 6-month primary growing season of each hemisphere to evaluate the drought hazard to ecosystems. Using a combination of hydrological and climate modelling, SPEI was calculated for the present-day and three different warming levels (2 °C, 3 °C and 4 °C warming above pre-industrial levels) that result from different greenhouse gas emissions scenarios. The maps of the future conditions are based on five (for 2 °C and 3 °C warming level) or three (for 4 °C warming level) different GCM simulations.
The events shown in Maps 1 – 4 represent examples over the period 2015 – 2020 for different parts of the world when significant impacts on ecosystems were recorded. In each
example, calculations of SPEI-6 were performed from AprilSeptember in the Northern Hemisphere and October-March in the Southern Hemisphere for the final year of drought. In 2015 East Brazil experienced one of the most severe drought in decades, which caused widespread reductions of vegetation productivity and carbon sequestration and negatively impacted freshwater ecosystems. In summer 2018, an extreme compound drought and heatwave event occurred in Europe that resulted in significant decreases in net ecosystem productivity (NEP) of terrestrial ecosystems. An exceptional drought impacted much of southern Africa during the 2015 and 2016 growing seasons, particularly in Kruger National Park, where significant die-offs of megaherbivore species (e.g. buffaloes, elephants and hippos) occurred. The map of Australia represents the end of the 3-year ‘tinderbox’ drought that triggered 2019 – 2020 Black Summer Bushfires, resulting in extensive devastation of ecosystems (~ 11 Mha) and killed an estimated 3 billion native vertebrates.
Maps 1 – 4: Examples of drought events during 2000 – 2019 (based on SPEI-6)
Map 1: Brazilian Drought, 20151
While the maps displayed here show the global patterns of one sector-specific index, other metrics can and should be included when responding to specific drought events or formulating new policies to obtain a more complete picture of hazard conditions. Moreover, moving from the global to smaller scales may require a different selection of metrics to account for specific local conditions. Given the highly specific knowledge of local needs and conditions required to make informed choices, the involvement of stakeholders is critical in the identification of metrics and approaches to interpret and use them. In addition, utilising an ensemble of climate and/or hydrological models can help to more objectively quantify the uncertainty in how future hydroclimatic conditions will evolve.
impacts tipping points trends
Standardized Precipitation-Evapotranspiration Index (SPEI-6) 0.51.01.52.02.53.0
Map 3: Central European Drought, 20183
Map 2: South of Africa and Kruger National Park, 2015 – 20162
Map 4: Australia's Tinderbox Drought and Black Summer Bushfires, 2019 – 20204
Maps 5 – 7: Average future change w.r.t. the period 1985 – 2014
Map 5: 2°C Warming level

Map 6: 3°C Warming level

Map 7: 4°C Warming level


2.5.4 Biodiversity
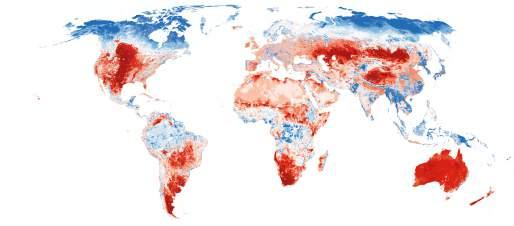
Map 1: Global map of Biodiversity Intactness Index. The Biodiversity Intactness Index (BII) describes the extent to which pre-modern levels of biodiversity remain in a region16 This map highlights areas for protection (blue) and restoration (red). However, BII is not a perfect metric, as the prevalence of many types of life (e.g. insects, fungi and subsurface species) is less understood and often poorly documented. In addition, BII does not speak to the current vulnerability of species, which remains high in many parts of the world.
Data source: Newbold et al., 201621,22
Drought can negatively impact biodiversity, but biodiversity can mitigate drought impacts on ecosystems.
Drought can impact biodiversity in terrestrial ecosystems both above and belowground as well as aquatic and coastal ecosystems (see Fig. 4, right), with some species and ecosystems more sensitive to drought than others1,2,3 Impacts can be both direct (for example, reductions in water flows can trigger fish die-offs, see Fig. 1, right4,5,6) or indirect (for example, a change in the nutrient composition of leaf litter from drought-stricken vegetation can change the predominance of bacterial versus fungal decomposers, see Fig. 3, right). Often the impacts on one species cascade through the system7 wide-spread tree die-offs in forests result in loss of habitat for other species and in some areas increase the risk of catastrophic wildfire, which can further harm biodiversity (Fig. 2, Section 2.5.8, page 91)
However, the presence of strong biodiversity levels can increase the coping capacity of an ecosystem and thereby mitigate the impacts of drought8 For example, in biodiverse forests, the presence of drought-resilient trees can reduce overall tree loss, even if the impacts are greater for droughtvulnerable species (see Fig. 2, below) In both areas with high biodiversity intactness and those with depleted levels (see Map 1, above), highlighting the need for drought mitigation measures to protect biodiversity as well as biodiversity protection and enhancement in order to mitigate drought.
Fig. 2: How biodiversity mitigates drought impacts. Biodiversity can be negatively impacted by drought but can also promote drought resilience. This can occur through resource partitioning where different species pull on different resource pools or on the same resource at different times; facilitation where one species has a positive effect on the functioning of another species through, for example, resource redistribution; or selection effects where a diverse population makes it more likely that some individuals from more resilient species will survive a disturbance. Overall, higher species richness can help protect ecosystems from reaching irreversible tipping points.
Fig. 1: Drought impacts to tropical forest ecosystems.
Drought impacts are growing, even in nonarid ecosystems. Tropical forests, including in the Caribbean13 the Amazon14 and West Africa15 have all experienced droughts in the recent decades. Since these ecosystems have evolved for high water availability, they may be particularly susceptible to drought15 Redrawn by LJ for the World Drought Atlas, based on Crausbay et al., 201823
Indigenous stewardship of biodiversity
Humans are a critical component of biodiversity and human actions can both help and harm biodiversity levels. Indigenous peoples are particularly important to protecting biodiversity globally. Though Indigenous groups comprise 6 % of the world's population, they steward areas accounting for 80 % of the world's biodiversity9 Holism and reciprocity are emphasised in many Indigenous value systems, which can offer alternatives to dualistic worldviews that see humans as separate from other parts of the natural world. By emphasising reciprocity, respect and relationality between humans and other species and ecosystem processes, holistic value systems may be less prone to exploitation and unsustainable use of resources. Among these worldviews, loss or changes in biodiversity directly impact human cultural practices and values. Affirming Indigenous sovereignty, strengthening legal recognition of Indigenous territory and increasing protections for environmental defenders are critical to protecting biodiversity regionally and globally10,11,12
Death of dolphins during Amazon drought
During the Amazonian drought at the beginning of 2023, the severity of which was largely driven by climate change, more than 150 endangered river dolphins (Inia geoffrensis and Sotalia fluviatilis) were found dead in tributaries of the Amazon River17–20 While the definitive cause of the deaths is still under investigation, most explanations offered by local experts suggest they are related to drought and heat17 Due to high air temperatures and low water levels, water temperatures reached up to 9 degrees Celsius warmer than usual. Moreover, the high incidence of solar radiation caused an algae bloom that is potentially toxic to fish, although there is no evidence yet of its toxicity to dolphins18,19 In addition to these threats, low water levels make the dolphins and other freshwater species more accessible and visible to humans, exposing them to activities such as illegal fishing19,20

Saprotrophic species gain nutrients by feeding on detritus. They are critical to decomposition and nutrient cycling.
Source: S. Axford from Orgiazzi et al., 201624


Nitrogen (N) fixers are critical for making nitrogen available for

Facility from Orgiazzi et al., 201624

Ectomycorrhiza (EM) fungi cause distinct changes to roots that can be observed without a microscope. They are often associated with trees and woody plants.
Source: M. Wood from Orgiazzi et al., 201624

Ground pearls use their exposed mouthparts to feed on and attach to plant roots.
Source: M. Bertone from Orgiazzi et al., 201624
Fig. 3: Impacts of climate change on plant-soil feedbacks. Impacts of climate change on plant-soil feedbacks Increasing drought and heat may change how plants interact with soil species, which has implications for carbon and nutrient cycling. How climate drivers will likely impact these feedbacks (+, growth; -, decrease; 0, no impact) and the magnitude of the effect (number of symbols) are indicated in this table. Examples of some of the soil species are given on the left.
Data source: Pugnaire et al., 201925
Fig. 4: Drought impacts to aquatic ecosystems. Drought impacts to aquatic ecosystems go beyond low flow levels, and include habitat connectivity and aspects of
Arbuscular mycorrhizas (AM) are a type of fungi that develop unique structures within root cells. Here,
2.5.5 Carbon cycling
Map 1/Fig. 1: Global distribution of carbon storage by biome. Estimates show that carbon storage per hectare varies considerably by biome. In most cases, however, the priority should be preserving long-standing (old growth) ecosystems, as newly converted ecosystems often have degraded function, lower biodiversity and reduced benefits for humans. Data source:
Timescales of carbon
Carbon cycling takes place over different time scales. The fast carbon cycle involves exchanges between the atmosphere, soil, water bodies and living organisms through processes like combustion, photosynthesis, respiration, digestion and decomposition
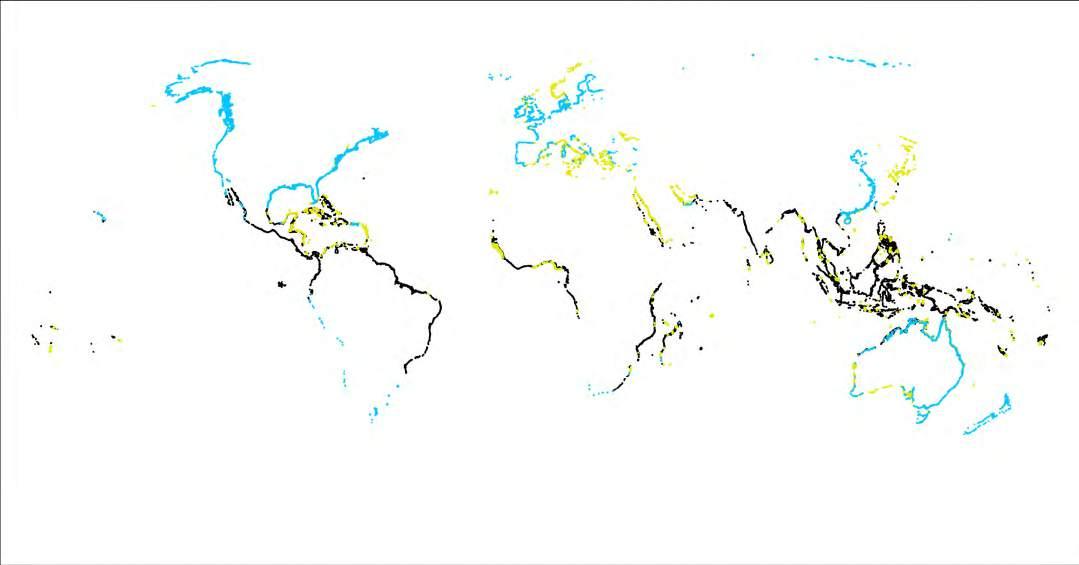

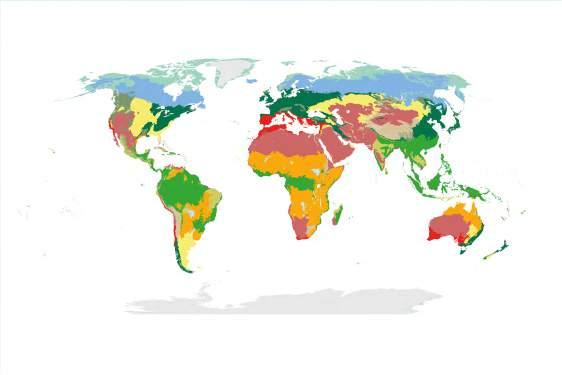
All ecosystems move carbon, as they do with other nutrients such as nitrogen and phosphorus, through the atmosphere, vegetation, soil, water bodies and bedrock in a process called carbon cycling1 While the periodic release and uptake of carbon is part of healthy ecosystem function, rapid changes in the quantity or timing of the carbon cycle, such as through the burning of fossil fuels or widespread deforestation, can trigger tipping points and amplifying feedback loops that irreversibly alter the global carbon cycle. Longer and more intense droughts, which are linked to climate change, can drive vegetation stress, decreasing carbon uptake through photosynthesis2–5 (see Map 2, opposite) and, in extreme cases, leading to conversion of land cover to systems with less carbon storage potential (see Fig. 2, right and Section 2.5.7, pages 88 – 89) This feedback can then intensify the impact of climate change by contributing to higher levels of carbon in the atmosphere.
Both terrestrial and marine systems store carbon, but it is not uniformly distributed (see Map 1/Fig. 1, above-right)
Old growth forest and grassland ecosystems store more carbon than recently converted landscapes or monoculture plantations (see Section 2.5.6, pages 86 – 878,9) In addition, certain soil structures are more adept at binding to carbon dioxide10 Marine or "blue carbon" ecosystems, meanwhile, can store more carbon per unit area than tropical forests and absorb it at a faster rate11

a
of
photosynthesis. Depending on the duration and intensity of drought, some ecosystems may be resilient to water stress. In such cases, increased temperatures can lead to increased GPP.
Drought can alter the pace and magnitude of the carbon cycle, potentially triggering amplifying feedbacks that exacerbate these changes.
In the slow carbon cycle the remains of organic organisms are compacted into sedimentary rock, trapping carbon for millions of years before it is released through processes like leaching, chemical weathering and volcanic eruptions1
Human burning of fossil fuels, which were formed over millions of years, is moving carbon from the slow to the fast carbon cycle, with profound implications for ecosystems1
Fig. 2: Impact of drought on tree mortality and carbon cycling. Stomates control gas exchange, including CO and water vapour, on plant leaves and stems. Under non-drought conditions (1), trees have access to sufficient soil moisture and healthy mycorrhiza (symbiotic connections between fungal networks and plant roots that facilitate the exchange of carbohydrates, water and nutrients). With sufficient resources for photosynthesis, carbon uptake is generally greater than carbon releases. Severe water stress during drought (2) can trigger a) cavitation, when leaf demand for water exceeds supply and air is aspirated into xylem, blocking the flow of water and nutrients; b) carbon starvation, when plants run out of carbohydrates and can no longer sustain basic metabolism; and c) mycorrhizal community breakdown, which can limit trees’ access to water and nutrients. Eventually, these stressors lead to mortality and selective regrowth (3). Drought-induced mortality can strongly affect the carbon budget of an ecosystem, but long-term impacts depend on how the ecosystem responds to drought through regrowth, competition and changes in species composition. Redrawn by LJ for the World Drought Atlas, based on Van der Molen et al., 2011 Copyright © 2011 Elsevier B.V. All rights reserved.
Map 2: Global impact of extreme drought events on the carbon cycle. Drought does not always decrease gross primary production (GPP),
measure
plant activity through
source:
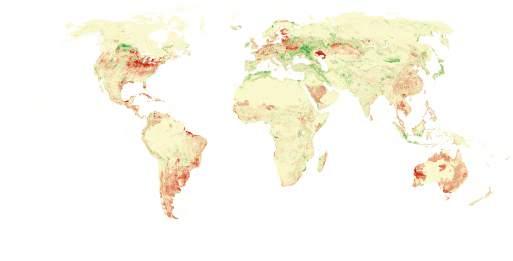


Drought can exacerbate the loss of carbon from the soil, one of the major terrestrial carbon sinks.

Eighty percent of the Earth’s terrestrial carbon is stored in the soil. Of this, approximately two-thirds is made up of organic matter (soil organic carbon, SOC) while the rest is mineral carbon (soil inorganic carbon, SIC1). Old-growth grasslands are particularly important in this regard, storing approximately a third of terrestrial carbon (see Map 1, right2 . Drought impacts on soil carbon vary by ecosystem but can influence all stages of soil carbon cycling1,3 First, drought changes carbon inputs to soil, as both the quality and amount of plant litter changes during drought2,4 (see Fig. 4, opposite) Second, drought changes how carbon is processed in the soil by invertebrates, microbes and fungi, either by directly impacting the density and diversity of these decomposers1,2 or indirectly through the altered soil inputs (see Fig. 1, right). Finally, drought can impact soil structure (e.g. through desiccation; see Fig. 2, opposite and stability (e.g. long droughts can reduce plant cover and, in turn, increase erosion), both of which can affect soil carbon cycling and distribution1,5 Erosion in particular is a very efficient process in removing carbon from the soil, as eroded particles are not able to protect carbon in the central part of stable aggregates, which are thus exposed to the air and easily transformed into CO2 by decomposers. Finally, cascading feedbacks between drought and climate change are also increasing the instability of soil carbon (see Fig. 3, opposite) Not all these mechanisms and feedbacks are fully understood at present, and the net impact of drought on soil carbon storage and releases is still uncertain, especially over longer periods of time or through successive droughts5
Fig. 1: Effects of drought plant-soil feedbacks (PSFs). Drought leads to plant litter (e.g. dead leaves) that has fewer nutrients and is more difficult to break down. This means there are fewer nutrients available in the soil, even after the litter has decomposed. It can also change subsurface communities, favouring groups like fungi that are better at decomposing this low-quality litter. Arrows indicate carbon flow. Adapted and redrawn by LJ for the World Drought Atlas, based on Pugnaire et al., 2019
Map 1: Global map of soil carbon storage change.
While soil carbon storage has increased since the Industrial Revolution in some parts of the world, there has been an overall decrease in soil carbon globally due to land use changes and soil quality degradation. Loss of carbon storage can have negative long-term consequences on local (in terms of soil quality) and global (in terms of carbon release into the atmosphere) scales. This map shows changes in soil carbon storage between 1800 and 2010.
Data source: Sanderman et al., 2017
Fig. 2: Drought-induced soil desiccation cracks. Drought can lead to desiccation cracks in soil, increasing aeration and accelerating decomposition by microbes. As a result, organic matter is broken down more rapidly, leading to carbon loss from the soil. Adapted and redrawn by LJ for the World Drought Atlas, based on Vahedifard et al., 20241
Fig. 3: Feedbacks between drought and climate change. Climate change impacts can lead to cascading feedbacks, where more intense droughts beget greater
2.5.7
Ecosystem transformation
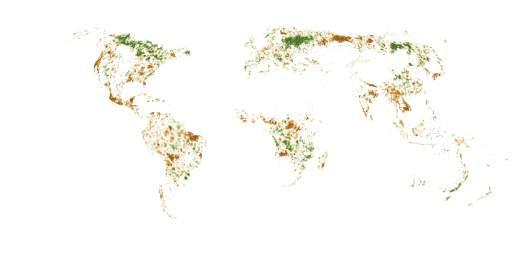
Healthy ecosystems may still be dynamic – they go through regular patterns of change and disturbance – but experience stabilising feedbacks that support resilience and recovery from perturbations1 However, severe droughts, whether due to their duration, intensity, or frequency, can surpass the coping capacity of the ecosystem and trigger a fundamental transformation where processes and functions never recover to pre-drought levels. Sometimes referred to as a regime change or tipping point, this process can result in ecosystem collapse and conversion2,3 (see Map 2, opposite) Usually, the new stable state has reduced ecosystem function (e.g. reduced carbon storage in drought-impacted wet soil ecosystems, see Fig. 1, below4–6 and can even create amplifying feedbacks that result in long-term or more severe drought impacts (e.g. loss of forest microclimates, see Fig. 2, opposite7).
The speed of these transformations can vary, particularly due to the lag in impact and recovery times associated with drought8,9 Deep rooting depths, for example, can sustain vegetation for successive dry years (see Fig. 3, opposite) thereby masking impacts in the early stages of drought. However, as systems approach a tipping point beyond which recovery is not possible, they often experience a critical slowing down characterised by longer recovery times and lower resilience (see Map 1, above10,11)

In extreme cases, drought can trigger fundamental transformations, usually harming ecosystem processes and functions.


Map 1: Forest resilience to tipping points. Global map showing estimated forest resilience to tipping points. Severe enough disturbances, including drought, can strain an ecosystem to the point that a small change or perturbation causes significant and sometimes irreversible transformation. At this point, ecosystems may exhibit a critical slowing down of normal processes and characteristics. This map, specific for forest ecosystems, is based on statistics performed on the Normalized Difference Vegetation Index (NDVI), where positive values (brown) suggest declining resilience and negative values (green) suggest increasing resilience. The most likely drivers of these changes were identified as increased in water limitations and increased climate variability.
Data source: Forzieri et al., 202212
Fig. 1: Drought impacts on wet soils. Wet soils, such as mineral, peat and paddy soils, are uniquely sensitive to drought due to their close connection with surface and groundwater. Drought can increase exposure of the soils to oxygen and increase soil salinity, contributing to loss of carbon storage, higher acidity and an increase in undesirable metals in the soil water. Redrawn by LJ for the World Drought Atlas, based on Stirling, E., et al., 2020 © 2020 Elsevier B.V. All rights reserved.


2: Forest impacts on aridity and rainfall. Land-surface interactions are a critical factor in mediating drought impacts. For example, by recycling soil water back to the atmosphere through the process of evapotranspiration, plants play a critical role in the water cycle. In some forests, this effect is strong enough to catalyse significant rainfall when the moisture condenses, either locally or downwind. If severe drought results in widespread tree mortality, forests can be converted to other ecosystems with lower evapotranspiration rates, leading to long-term loss of rainfall and increased droughts and/or aridity across the same or downwind regions.
Adapted and redrawn by LJ for the World Drought Atlas, based on Xiao et al., 202115


Fig. 3: Conceptual model of the critical zone. The critical zone refers to the region just below and at the Earth’s surface that sustains nearly all life on the planet (left). This includes the subsurface from the top of unweathered bedrock through to the vegetation canopy. Water in the critical zone can be particularly important for sustaining vegetation and fungal networks – and by extension, the entire ecosystem – through drought. However, actual water availability is usually much lower than the total water storage capacity of the subsurface (right). Gravitational loss and hygroscopic moisture is water that drains too rapidly or is held in very small pores, too tightly to be available to plant roots or mycorrhizal networks. Redrawn by LJ for the World Drought Atlas, based on Klos et al., 201816 © 2018 Wiley Periodicals, Inc.


ecosystem transformation of forests into degraded shrub or grasslands. Unlike "old growth grasslands", which have had millennia to evolve, these novel ecosystems typically have less biodiversity and carbon storage potential. Data source: Base map: Potapov et al., 202113 Observations: Hartmann, H. et al., 202214


Fig.
Map 2: Observations of elevated tree mortality. Observations of elevated tree mortality (yellow dots) overlaid with forest canopy height between 52° N and 52° S Forests worldwide are susceptible to tree mortality during prolonged drought. If widespread, tree mortality can be a precursor to
California, U.S., 2016
Source: Region 5 Photography (Pacific Southwest Forest Service, USDA) on Flickr.
Costa Rica, 2015
Source: Jennifer Powers.
Southwest Australia, 2011
Source: Katinka Ruthrof. Amazon Basin, 2010
Source: NOAA.
Germany, 2019
Source: Henrik Hartmann.
2.5.8 Compound hazards
Fig. 1: Impact of drought on fire behaviour by ecosystem.
The impact of drought on wildfire varies by ecosystem. Loss of soil moisture during drought can increase vegetation flammability However, fire behaviour is also dependent on fuel continuity as fires must have sufficient fuel to expand. If droughts cause vegetative diebacks or reduce growth, fuel continuity can diminish, reducing risk of wildfire. Thus, impacts on fire behaviour depend both on the drought and the ecosystem's response to it.
Drawn by LJ for the World Drought Atlas based on Chapter authors' composition.
Compound hazards are multiple hazards occurring simultaneously or in immediate succession1 In some cases, compounding events may be coupled – for example, a fire made more severe by pre-existing drought conditions (see Figs. 1 and 2, above and right) – while in other cases, their causes may be independent, but the difference is not always clear2 Due to climate change, droughts are increasingly coinciding with heat waves, but these events can then mutually propagate (see Fig. 3, right) These positive feedback loops where stressors compound instead of regulating each other, are becoming more frequent with climate change. The longer a drought persists and the more widespread it is, the greater the likelihood that it will co-occur with other hazards. As with the impacts of drought in isolation, the effects of compound hazards can be exacerbated or mitigated by human management decisions3,4 Common compound hazards involving droughts include heatwaves, where warmer temperatures can trigger or exacerbate drought conditions; catastrophic wildfires, where low soil and vegetative moisture can cause fires to grow in size and severity; and pests, where drought stress can make vegetation more vulnerable to infestation (see Fig. 4, opposite1) In addition, prolonged drought can contribute to the occurrence of flash floods, where reductions in soil moisture lead to soil compaction, limiting infiltration, increasing surface runoff and intensifying flooding (see Fig. 5, opposite5,6)
Fig. 3: Drought and heatwaves.
Drought in one location can generate heatwaves downwind due to land-atmosphere interactions. Stronger surface heating in the drought area warms the air in the near-surface, increasing the height of the atmospheric
(ABL),
Fig. 2: 2019 – 2020 fires in Australia.
The different drought impacts on fire behaviour were apparent in the 2019 – 2020 fires in Australia, which were preceeded by 3 years of drought. Forests were far more heavily impacted than other ecosystems.
Data source: Bowman et al., 202011
Human influence on compound hazards
The occurrence and impact of compound hazards can be heavily mediated by human actions5,7 For example, historical fire suppression in many forests and grasslands of North America and Australia by settlers has increased fuel availability and further intensified drought and wildfire severity. Both these hazards, in turn, have implications for human communities and public health through reduced water and air quality8,9
In Europe, human-driven land use changes have led to widespread tree plantations. These monocultures, with limited biodiversity, have experienced greater losses from droughtexacerbated pest infestation than diverse forestland see Fig. 4, above10).
Fig. 5: Drought and flash flooding. Paradoxically, drought can increase the likelihood of flash floods. During prolonged and/or intense droughts, soils can become dry, compacted and cracked, reducing both the ability of water to infiltrate and the overall capacity of the soil to hold water. Under such conditions, more rainfall will run overland, contributing to flooding. This phenomenon is exacerbated by increasingly intense rainfall events under climate change, which is warming the atmosphere and increasing its ability to hold moisture. Drawn by LJ for the World Drought Atlas, based on Chapter authors' composition.
Drought can co-occur with other hazards in ways that exacerbate the impacts on humans and ecosystems.
2.6 Cross-sectoral and cascading drought risks and impacts
2.6.1 Cross-sectoral dependencies and connections
While diverse drought risks and impacts emerge in different systems, they are influenced by shared underlying drivers and root causes.
Sections 2.1 – 2.5 provide an overview of drought risks and impacts for five sectors and systems, including insights on the most relevant drivers of risks at the global scale. However, sectors do not function independently, but are interconnected and mutually dependent, often competing for water resources.
For instance, freshwater ecosystems can be extremely affected by water uses such as hydroelectric power stations, industrial discharge, or inputs from agricultural run-off (e.g. nutrients, pesticides and sediments), which can crucially alter the delicate balance of water quantity and quality necessary for healthy ecosystem functioning. In another example, certain inland navigation routes provide essential inputs of raw material that allow a multitude of productive activities, including those in the industrial and energy sectors. These and other examples show that sectors operate within larger socialecological-technological systems, with water serving as one of the most critical elements of these system interdependencies. Therefore, an understanding of drought risks and impacts on each sector alone is not enough to develop systemic risk management and adaptation solutions. Achieving such solutions requires reconciling sectoral characteristics and needs with the dynamics of the wider system in which they are embedded.
Drought impacts do not stop at sectoral boundaries: a conceptual model of crosssectoral drought risks
The conceptual models presented in Sections 2.1 – 2.5 highlight the drivers and interconnections that determine drought risks at the global level for five sectors. Building on these, we explore cross-sectoral dependencies and connections, identifying drivers and root causes of risks that are shared across sectors. Fig. 1, right visualises these dependencies, highlighting which root causes and drivers of risks are shared and which are specific to a particular sector or system.
Among the shared drivers of risk, several refer to the physical conditions of the systems facing drought. In particular, land conditions emerged as relevant drivers of risk for multiple sectors and systems, as they can reduce the capacity of the soil to retain moisture and support vegetation growth (soil and land degradation), especially where land is converted to new uses such as urban development or unsustainable agriculture (land cover changes and land use conversion). Carry-over effects, i.e. impacts from previous droughts that have not been fully reabsorbed (such as soil dryness or tree vigour), can contribute to more intense impacts in subsequent droughts. This occurs also in the case of prolonged, multi-year droughts, which in addition can lead to distinct impact patterns1. Finally, the presence of pollutants can make already scarce water resources during drought not fit for environmental and societal water needs.
A second cluster of drivers refer to behaviours and demand recognising their importance in determining the water needs of our sectors and systems. Water demand is the “other side of the coin” of drought risks, as it determines if the water available is enough to meet societal and environmental needs. Water needs are dynamic and change through time, for example through temporary or seasonal concentration of demand (e.g. seasonal tourism), but also through longerterm processes such as increased dependency on reservoirs. These pressures on water resources are also connected to consumption habits and lack of awareness of drought risks, which are especially relevant in territories that have not experienced recent and/or protracted droughts, but are increasingly vulnerable under climate change. Adding to this complexity, demand for agriculture water supply and energy sectors may critically increase during droughts and heatwaves, as more water than usual is needed to cover domestic and crop demand.
Infrastructural interventions can also affect crosssectoral drought risks: for instance, infrastructural adjustments to channels’ morphology to secure navigability (e.g. through dredging, locks and the construction of dedicated reservoirs) can alter the water flow necessary for freshwater and riparian ecosystems. The increase in water storage infrastructure, such as reservoirs, while constituting a solution in the short-term, can also create maladaptive consequences by attracting new activities and population to areas affected by drought (reservoir effect), thus affecting water demands (increased dependency on reservoirs).
Finally, water resource management constitutes a final important cluster of shared drivers of drought risks. The high number of water uses across multiple sectors is an important driver of risks in this cluster, with droughts catalysing an increase of competition over water resources. In many cases, this either leads to or is caused by an unsustainable level of water abstractions. Regulation of water allocations plays an important role in sectoral water uses while some sectors are in general given precedence (such as water supply or environmental requirements), drought can trigger a change in the prioritisation of other sectoral water uses. This was the case during the 2022 European Summer Drought in France, where environmental requirements for industrial water discharge were waived to allow continued use of nuclear power plants.
Fig. 1: Cross-sectoral dependencies and connections.
Cross-sectoral conceptual model of drought risks. The figure is based on the sectoral impact chains presented in 2.1 to 2.5 and highlights which drivers and root causes influence drought risks and impacts across the five sectors and systems considered. Drawn by LJ for the World Drought Atlas, based on Chapter authors' composition.
Cultivation of water-intensive crops
Unequal access to land (land rights)
Large-scale livestock production
Concentration of demand
Increased water demand during drought and heatwaves
Increased dependency on reservoirs (reservoir effect)
Peak of energy demand (cooling/heating)
Sedimentation (from soil erosion and floods)
Limited storage capacity
SYSTEM-SPECIFIC RISK DRIVERS
Irrigation efficiency paradox
Cultivation of marginal lands
Use of inefficient irrigation methods
SHARED RISK DRIVERS
Carry-over effects (previous drought impacts)
ROOT CAUSES
Poverty and inequality
Land cover changes and land use conversion
Anthropogenic climate
Natural variability
dependence on ecosystems
Presence of affordable hydropower possibilities
Population pressure
Prioritisation of other sectoral water uses RESPONSE RISK RESPONSE RISK
High electricity demand (close to capacity)
Inefficient or outdated infrastructures (including digitialisation)
RESPONSE RISK
2.6.2 Cascading impacts of drought risks
Drought risks and impacts in single sectors and systems can compound between them and with other risks to create cascading impacts.
Sector and system-specific drought risks and impacts pose important societal challenges, but can also contribute to multiple other risks, of equal or potentially greater consequence (see Fig. 1, right) The cascading impacts of droughts can contribute to wider societal challenges. Here, we dive deeper into five selected thematic clusters of cascading drought impacts highlighting food insecurity (see page 96) land degradation (see page 100) health impacts (see page 99) mobility (see page 97) and water conflicts (see page 98)
These connections underscore the importance of taking a systemic perspective for managing drought risks that addresses shared drivers and root causes. This can reduce the occurrence or the severity of cascading risks, which have the potential to create significant negative consequences for societies and ecosystems, threatening the achievement of the Sustainable Development Goals.


Fig. 1: Cascading impacts of drought stemming from sectoral drought risks and impacts. Cascading impacts of drought stemming from the sectoral drought risks and impacts considered in the World Drought Atlas. These impacts can have a negative effect on the achievement of the Sustainable Development Goals.
composition.




2.6.3 Food security and drought
What is food security?
Food security exists when all people, at all times, have physical, social and economic access to sufficient, safe and nutritious food that meets their dietary needs and food preferences for an active and healthy life. Food security may be threatened by a complex interplay of socio-economic (e.g. access to resources, economic shocks, conflicts) and environmental (e.g. climate extremes such as floods and drought) factors. Drought, in particular, can contribute to and exacerbate food insecurity by diminishing agricultural productivity, leading to food shortages and to a reduction in income for farmers and agricultural wage labourers. Additionally, the scarcity of food on the market can lead to increased prices, further limiting food access for poor and vulnerable groups.
Acute food insecurity refers to food deprivation that threatens lives and livelihoods. However, even less severe forms of food insecurity impact people’s lives, increasing malnutrition, micronutrient deficiencies or obesity (from lack of access to sufficient and affordable nutritional food), which have especially threatening and long-lasting consequences for young children.
Drought is often one of the shocks that may trigger acute food insecurity. For example, it is considered to have been the primary contributor of acute food insecurity in the Horn of Africa in 2023, particularly in Somalia, Ethiopia, Kenya, Burundi and Uganda1 In this region, prolonged drought conditions since 2020 have led to multiple consecutive failed agricultural seasons2 particularly affecting rain-fed farmers and pastoral communities3 Droughts can also lead to transitory food insecurity, i.e. a short-term or temporary inability to meet food consumption requirements related to sporadic crises, indicating a capacity to recover1 When drought becomes recurrent and impacts vulnerable populations, it can also become a driver of persistent or cyclical acute food insecurity, which is a form of chronic food insecurity1
Progress in fighting food insecurity
Food insecurity is a critical global issue that affects millions of people worldwide. Despite international attention (Sustainable Development Goal 2 aims to achieve a world free of hunger by 2030) progress at the global level on combating food insecurity has stalled in the last decade. The FAO’s indicator on prevalence of undernourishment (PoU) reveals a significant slowdown in the decline of hunger rates since the mid-2010s and a concerning trend reversal (See Fig. 1, below) One of the main reasons for the inverted trend are the droughts caused by the strong El Nino of 20154 Trends of PoU in the different regions differ. In Africa, the rates of hunger increased continuously from 2015 to 2023, whereas hunger has been on the decline in Latin America and the Caribbean since 2021 and remained relatively unchanged in Asia in the same period. The regions currently experiencing the highest levels of hunger at the global level are Sub-Saharan Africa and Southern Asia with respectively, 23.2 % and 20.2 % of their population undernourished4 At the current rate, 58 countries are not expected to achieve zero hunger by 20305 The recent resurgence of food insecurity has been mainly driven by conflicts (such as the Russian invasion of Ukraine) and the economic shocks following the COVID-19 pandemic. However, the influence of weather and climate extremes, including drought, on food insecurity has increased dramatically between 2021 and 2023 (see Fig. 2, below) with the number of countries where weather extremes are considered to be the primary driver of food crisis jumping from 8 to 184,5
2.6.4 Droughts and human mobility
A complex interaction
Current displacement data
Map 1: Countries experiencing food crises in 2024. Colours refer to number of people affected. Call-outs indicate countries in which drought was the primary driver of food crisis.
Data source: Global Food Report 2024 (https://www.fsinplatform.org/report/global-reportfood-crises-2024/#download).
Fig. 1: Prevalence of undernourishment (% of global population), 2001 – 2022.
Data source: FAO as of July 15th 2024.
Fig. 2: Number of people (millions) by primary driver, 2018 – 2023. Number of people in food crisis (IPC/CH Phase 3) in food crisis countries where the primary factor of the crisis is conflicts/ insecurity, economic shocks or weather extremes – 2018-2023.
Data source: Global Food Report 20241

The causality between natural hazards, environmental change and human mobility is rarely direct and this is particularly true of drought1. Drought affects people's ability to grow or buy sufficient food and, when these impacts reach a sufficient threshold, people may decide to move. When people have agency in their decision to move, migration can bring positive outcomes and may be viewed as climate change adaptation. When there is less choice in whether, when and where to move, it is termed displacement, which tends to bring worse outcomes than migration. In media and policy discourses, drought is sometimes represented as causing migrants to cross borders and in particular move from the Global South to the Global North. However, this is not supported by data; the vast majority of human movement due to drought is domestic. Environmental change can also act to slow human mobility; as financial and environmental resources are depleted through drought, it may become less possible to move. In this situation the aspiration to move can increase beyond capabilities. The term “trapped populations” has been used to describe these cases. Chains of causality may be broadly understood as shown in Fig. 3, right the environment is just one of several drivers that can influence human mobility. When drought hits an area where people largely depend on agriculture for subsistence and livelihoods, the impact on incomes and food security can affect both people's aspiration (or the need) to move as well as their ability to do so. For example, temporary labour migration may be perceived as a viable option for gaining access to income to supplement a partly failed harvest. On the other hand, the drought-induced loss of income may reduce people’s ability to engage in longer-distance and more costly migration.
Since 2017, when the Internal Displacement Monitoring Centre (IDMC) first started gathering data related to drought, they have recorded 5.4 million displacements caused by drought from 259 events in 21 countries2 but this figure is likely a significant underestimate. Many countries do not actively engage in monitoring displacement related to drought, due to capacity constraints and the conceptual challenge of ascribing a particular movement to the creeping nature of drought – a process which does not normally have a defined start and finish3 The EM-DAT International Disaster Database records droughts occurring in 67 countries over the same period of time. Therefore, it is likely that drought displacement is significantly underreported.
Map 2, below shows the challenges faced in attempting to understand the global picture of drought displacements. In 2020, just 20 % of countries that reported populations impacted by droughts had figures of population displaced by droughts.
Modelling displacement from droughts Models exist that attempt to project future human mobility as a result of droughts, but the complexities related to both context and causality mean that model design depends on a range of uncertain assumptions and results should be interpreted with appropriate caution. While it might be important for governments and NGOs to have an idea about how many people may move in the future, models can have the unintended consequences of contributing to alarmist framings of human mobility. These can risk obscuring the human experience of people attempting to improve their lives and futures as a result of drought or other environmental processes.
Fig. 3: Conceptual framework of the relationship between drought and human mobility.

There is a significant discrepancy between the EM-DAT database on countries affected by drought (shaded countries) and IDMC reports of drought displacements (those outlined) in the period 2017 – 2023.
Map 2: Countries reporting people affected and displacements triggered by drought, 2017 – 2023. Drawn
2.6.5
Water: a cause of conflicts?
When water security, i.e. access to adequate water resources, is not guaranteed, safe and stable, this can lead to disputes, tensions or even armed conflicts. These may occur at any level: between individuals, communities and even countries. Droughts can contribute to these conflictual interactions by making water resources scarcer in the short- or medium-term, thus aggravating existing tensions or creating new ones. However, there is no simplistic cause-effect mechanism between drought and conflict onset, as multiple contextual factors exert strong influence on the latter1 The relationship between water and conflicts is indeed multi-faceted2 and adds complexity to the notion that scarcity of the former directly leads to the latter. Three ways in which water interacts with conflicts have been identified3
1. water can be the trigger of the conflict (disputes are fought over scarce water resources)
2. water is the weapon used during the conflict (water infrastructure are used as tools to target the population)
3. water is the casualty of the conflict (where water infrastructure or resources are incidentally or intentionally affected).
Map 1, below reports the location of recent (2020 – 2023) tensions, demonstrations and disputes triggered by water issues, derived from Water Conflict Chronology database3 The definition of conflict used here extends beyond violent conflicts with casualties involved, and encompasses low-intensity conflicts such as demonstration. These are not to be overlooked, as they can be a “driver of social change, a starting point for violent escalation, and an indicator for legitimate grievances”1
While conflicts emerge from multiple drivers and complex pathways, making for an uncertain attribution of causality, there is evidence that water-related conflicts, also known as hydropolitical conflicts, have been rising in the past decade.
In particular, impacts from drought and water scarcity have been highlighted as contributing factors or threat multipliers with events in Iran, India and Sub-Saharan Africa3
At the local level, there is evidence that water deficits induced by drought can worsen food insecurity, thereby leading to conflict amongst the population, for instance in urban settings4 When hydropolitical conflicts occur between states, it is often in relation to the management of water resources in transboundary river basins. An example of this issue can be seen with the development of new water infrastructure (e.g. dams), which greatly alter the upstream-downstream water balance, possibly reducing the amount of water available to downstream users5 When this occurs, the strain on water resources occurring during droughts can create grievances, as one country might prioritise internal water uses against the needs of its riparian neighbours.
Fig. 1, below shows the number of transboundary basins in each country that are at risk (from very low to very high) of hydropolitical tensions due to the development of new water infrastructures in a context of lack of transboundary institutional arrangements.
For tensions to turn into conflicts, however, other factors need to co-occur. de Stefano et al., 20175 also highlight six factors that exacerbate transboundary hydropolitical tension: a. locations with high present or projected increased water variability due to climate change; b. recent depletion trends in water reserves; c. the presence of armed conflicts within a state; d. the presence of armed conflicts between states; e. recent unfriendly interactions between states over water; and f. low gross national income per capita.
Water: an opportunity for collaboration While under certain conditions reduced water resources can result in conflicts, they can also function as opportunities for collaboration and peace making. Transboundary water resource management can be an important driver of cooperation, leading to the avoidance of conflicts or to peacebuilding in post-conflict settings2 Transboundary river basin organisations, in particular, can function as fora for the promotion of peace and security during increasing drought-induced water scarcity2 The importance of these arrangements is reflected in their inclusion into the SDG, as an indicator for Goal 6 (Ensure availability and sustainable management of water and sanitation for all): Map 2, below shows the proportion of transboundary basin area with an operation arrangement for cooperation at the country level (SDG indicator 6.5.2, reference year 2023). In reality, conflict and cooperation are not mutually exclusive, and in many cases they co-exist dynamically through time6
Besides affecting livelihoods, droughts have direct and indirect impacts on people’s health1,2,3,4. These impacts are determined by several underlying vulnerability drivers at individual and societal levels including socio-economic status, access to services and resources and pre-existing health conditions. Direct impacts of droughts interact with these drivers, affecting circumstances of living to the point of triggering a series of health effects, even increasing the risk of morbidity and mortality4
While the understanding of health effects of drought is an emerging field with incomplete evidence, it is possible to recognise five broad categories of impacts: malnutrition issues, water contamination and water-related diseases, respiratory disorders, vector-borne diseases and mental health impacts. The health sector itself can also be impacted by drought conditions, through lack of water or water contamination, electricity outage, lack of food and impacts on health workers3,5
DROUGHT
DROUGHT HAZARDS
Fig. 1: Hydropolitical tension. Number of basin-country units at risk (very low to very high) of hydropolitical tension due to the presence of new water infrastructure and lack of institutional arrangements.
Data source: De Stefano et al., 2017

Map 1: Location of recent tensions, demonstrations and disputes, where water issues acted as triggers, 2020 – 2023. Location of recent tensions, demonstration and disputes, where water issues acted as triggers, 2020 – 2023. Data from the Water Conflict Chronology, Pacific Institute 2024.

Map 2: Proportion of transboundary basin area with an operation arrangement for cooperation at the country level (SDG indicator 6.5.2, reference year 2023).
Directly impacting through water deficit or contamination and indirectly influencing through its nexus with food, energy as well as political stability, droughts can impair human health and services. It is therefore essential to increase the awareness of the public health actors about the relationship between droughts and health, as this would allow to tackle some of the health vulnerabilities that are triggered during droughts. This entails addressing structural issues, including access to health care, quality infrastructure and services, social protection measures and respective supportive and equity policy measures. Altogether, these efforts constitute a step towards building resilience of public health to drought and promoting human well-being overall3
DROUGHT IMPACTS
DROUGHT HEALTH IMPACTS
WATER CONTAMINATION AND WATER-RELATED DISEASES
When less water is available and no alternate sources are accessible, people might be forced to use water of lower quality (e.g. through salinity, increased concentration of pathogens, enhanced algal production, among others), both during and after droughts14,15 This can lead to exposure to several waterborne diseases such as cholera16 Moreover, decreased water availability can also lead to poor hand washing and hygiene habits which can further contribute to developing diarrheal disease4,17. Groundwater can also show elevated levels of nitrate, orthophosphates, chlorides and sulfates during drought conditions18 Evidence suggests that consumption of such contaminated water can lead to birth malformations, gastrointestinal disorders and hypertension19,20
MENTAL HEALTH IMPACTS
MALNUTRITION ISSUES
Although it is not only developing countries that face drought, most often it is their populations that experience drought-related food-shortages and related food insecurity (see Section 2.6.3, page 96) whereas developed countries can source from diverse suppliers across geographies. The impacts of drought on nutrition begin with shortage of food supplies, forced dietary changes and cutbacks6 leading to consumption of micronutrient deficient diets7 or contamination of foods, leading to serious health disorders8,9 Risk of malnutrition and mortality is higher in infants than adults10 with evidence of stunting (chronic undernutrition) and wasting (acute undernutrition) in children due to drought related nutritional deficiencies and food insecurity11,12,13
Numerous mental health issues associated with drought impacts have been documented. Examples include anxiety, depression, psychological distress, high worry and mental illness. These are particularly felt in populations living in remote or rural areas, with low level of education, unemployed or with lower income37,38,39 Uncertainty in the onset, duration, cessation and actual impacts of droughts, contribute to these long-term stressors to mental health, potentially leading to debilitating consequences, with extreme cases resulting in suicides, as documented in India40,41 In certain cases, psychological distress from drought impacts resulted in increased alcohol use and functional impairment, especially in rural communities43 Drought impacts can affect mental health in specific groups in diverse ways: for instance, adolescents have been found to suffer by impacts on their emotional well-being, uncertainty over future, family functioning and community dynamics which results from drought impacts in their communities.
Addressing structural issues including access to health care, quality infrastructure and services, social protection measures, respective supportive policy measures can help tackling some of the health vulnerabilities that are triggered during droughts.
VECTOR-BORNE DISEASES
Droughts can reduce the number of predators of mosquitoes and other vector associated with vector-borne diseases, thus increasing their populations and consequently the chances of disease outbreaks, such as dengue fever and chikungunya33,34 Additional domestic water storage containers used to cope with water shortage during drought periods can host certain species of mosquitos that have adapted to such habitats, increasing dengue risk35 Increased mosquito populations have also been associated with outbreaks of Rift Valley fever, Murray Valley encephalitis and West Nile virus disease36
RESPIRATORY DISORDERS
With increasing soil dryness, there is a higher likelihood of dust being circulated in the air which can lead to transfer of pathogens and pollutants, causing or exacerbating respiratory conditions3,4 For example, elevated concentrations of ozone and PM2.5 (particulate matter less than 2.5 micrometres in diameter) during drought periods21 can cause severe respiratory disorders by impairing lung function22,23 With growing evidence of potential wildfires linked to drought conditions24,25,26,27, resulting aerosol emissions and smoke also exacerbate respiratory problems28,29 Hydropower dependent regions witness increased emissions due to substitution with fossil fuels, negatively impacting air quality and thereby human health30 Under certain circumstances, droughts can also lead to unexpected respiratory impacts, such as a consequence of a spike in nitrate levels in crop storage facilities, potentially putting at risk health of farmers and farmworkers31 Dust from dry soils can also trigger severe respiratory disorders, as was the case during the 1930s drought-related ‘Dust Bowl’ that affected the Great Plains in the United States, when many lost their lives due to the ‘dust pneumonia’32
2.6.7 Droughts and land degradation
Land degradation is a negative trend in land conditions, expressed as the long-term reduction or loss of at least one of the following properties: biological productivity, ecological integrity or value to humans. Currently, about 20 % of the global vegetated land surface has been or is being degraded, mostly owing to direct or indirect human-induced processes including anthropogenic climate change1 The main types of land degradation are water or wind erosion and chemical or physical deterioration. Water erosion results from water concentrating and flowing over the surface. Landslides can also occur after heavy rainfall and human activities such as vegetation clearance are also important for those. Wind erosion, mostly found in drylands, is the loss of soil by wind action. Chemical or physical deterioration is associated with adverse changes in the physical or chemical properties of the soil, such as soil compaction and surface sealing, loss of organic components, changes in soil acidity and the effects of toxic pollutants with the consequent soil contamination.
Global hotspots of land degradation
Southern and central North America, central South America, eastern Africa, central and southern Asia and eastcentral Australia are characterised by high land degradation consistency and defined as land degradation ‘hotspots’.
Lowering of the water table, generated by drought and/or excessive water abstraction, can lead to soil consolidation and settlement, also favouring land degradation.
The loss of topsoil by water or wind erosion is by far the most important driver of the displacement of soil material, with water erosion accounting for about 56 % of the total area affected by human-induced soil degradation. The area affected by wind erosion accounts for a further 38 % of the degraded terrain, while chemical and physical soil deterioration covers about 12 % and 4 %, respectively2). Droughts, heat waves and changes to seasonal precipitation patterns are important physical drivers of land degradation and are expected to become more frequent and/or severe due to climate change. Drought will directly and indirectly impact land degradation in both forested and agricultural landscapes. Impacts include potential increase of plant heat stress, alterations in soil moisture levels, escalation of soil erosion by wind and rainfall, depletion of
soil nutrients, soil salinisation and an overall decrease in vegetation and biomass.
Land degradation has adverse social and economic consequences for rural populations, especially in developing countries, with the extent and nature varying according to the livelihood system. In some cases, land degradation can trigger a chain of events leading to population displacements and possibly migrations. For instance, in the Ethiopian Highlands migration is an important household adaptation strategy because of severe land degradation amplified by recurring droughts3 At the same time, severe land degradation can also have a feedback effect on regional climate, increasing system vulnerability (e.g. by increasing droughts occurrence4).
According to the IPBES (2018), land degradation affects over 3.2 billion people worldwide and has already altered 70 % of ice-free land. If current trends continue, 90 % of land could be degraded by 2050. Combating land degradation through sustainable land management and restoration is crucial not only to reduce drought risks, but also for protecting biodiversity, ensuring food security, building climate resilience and ultimately safeguarding human well-being.
Amazon River Basin (Brazil)
In the tropical Amazon River Basin region, drought varies significantly in duration, spatial extent and intensity, and high deforestation rates may have exacerbated the impact of droughts on land degradation5 An estimated 12 % of the basin is degraded land according to the UNCCD and land degradation is linked with a significant decline in productivity. The main land degradation hotspots are localised in the southern, southwestern and eastern portions of the basin (see Map 3, right) where large monocultures and pastures dominate. Currently, 86 % of the Amazon biome may be in a stable forest state, but, because of more severe drought events, some of these areas have begun to show increasing mortality rates and increasing land degradation6
Drivers of drought hazard
Data source: Jiang et al.,
Drought and dust storms

Dust and sandstorms are a major cause of land degradation in arid and semi-arid regions of the world, a process that can also lead to desertification. The quantity and distribution of rainfall greatly influences vegetation cover. Drought conditions can lead to a reduction in vegetation cover and subsequently increase the risk of wind erosion. Further, farming practices such as the clearing of native vegetation for farming and grazing can accelerate dust storm-induced wind erosion rates above natural levels by reducing vegetation cover and soil surface stability. At the same time, the increased dust load in the atmosphere from dust storm events has the potential to alter the climate system and its hydrological cycle through radiative and cloud condensation nuclei effects. Main routes of global dust transport have been estimated with the locations of the major dust sources being: (1) Sahara; (2) Arabia; (3) Asia; (4) North America; (5) South America; (6) Southern Africa; and (7) Australia (see Map 2, right)
Source: Christa M. Pudmenzky and Roger C. Stone, University of Southern Queensland.
Map 2: Main routes of desert dust transport globally. Main routes of desert dust transport (light blue arrows) and locations of the major dust sources: (1) Sahara; (2) Arabia; (3) Asia; (4) North America; (5) South America; (6) Southern Africa; and (7) Australia, depicted using global means of the measured daily TOMS Aerosol Index values (1979 – 2011). Dust emissions into the atmosphere from different regions in Mt are indicated by red arrows and deposition to the oceans in Mt is indicated by dark blue arrows.
Source: Middelton et al., 201715
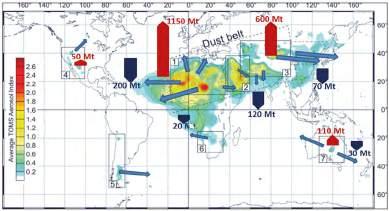
In the Amazon River Basin the main mechanism that leads to drought events is the precipitation shortage generated by sea surface temperature (SST) anomalies over the tropical Atlantic region and the El Niño-Southern Oscillation (ENSO). Since the 2000s the Amazon River Basin has suffered four unprecedented drought events (2005, 2010, 2015 – 2016 and 20237). Both events caused massive forest losses through wildfires.
Ethiopia (Eastern Africa)
Ethiopia’s climate is tropical and arid in the southeastern and northeastern lowland regions and cooler and arid in the highlands of the country8
About 85 % of Ethiopia’s land is moderately to severely degraded (see Map 4, right) and the cost of the land degradation is estimated at 23 % of the national Gross Domestic Product, the highest in East Africa. The highlands, where most of Ethiopia’s 115 million people live and which comprise 90 % of arable land, are affected by land degradation.
In these areas, natural forest cover fell from 40 % before the 1950s to about 3 % in 20209
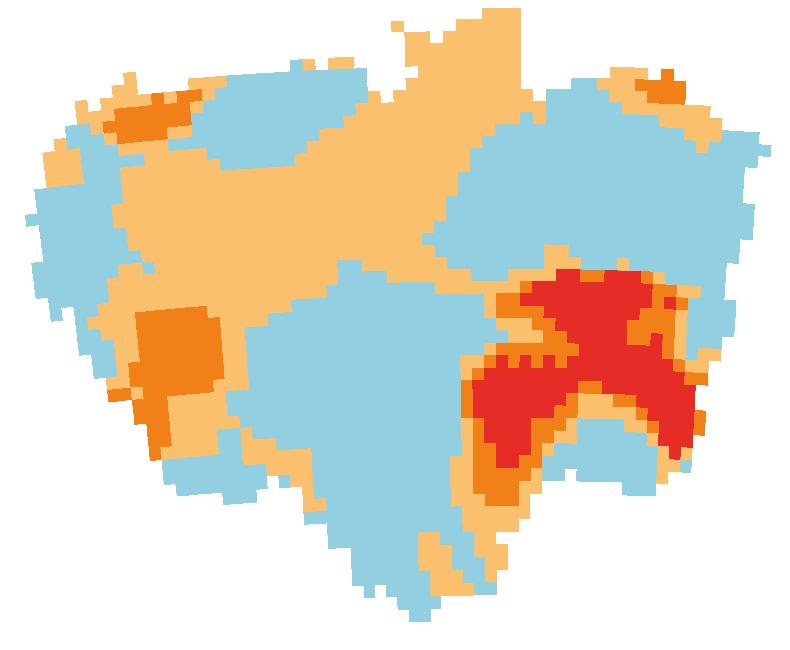
Mongolia
About 90 % of Mongolia is characterised by arid, semiarid, dry and sub-humid climatic regions. The increase in land degradation, though linked with the rise in livestock numbers and the expansion of the mining industry, can be primarily attributed to drought events that have intensified since the 2000s11 In Mongolia, 77 % of the total land area is degraded, of which severely degraded lands occupy 23 % (see Map 5, right) Since 2000, 2 800 ha of forest have been converted to grasslands and 2400 ha of terrain have been deforested, leading to a productivity decline of 6.4 %. In addition, about 34.72 t/ha of organic carbon in soils was lost over that period due to wetland degradation.
Drivers of drought hazard
In Mongolia, impactful drought frequency increases from north to south and east to west and corresponds to Mongolia’s humidity distribution patterns.
Based on satellite data, the Normalized Difference Drought Index (NDDI) indicates that in most parts of the high mountain belt region (southeast), one to two drought occurrences in a 10-year period are probable. In the Gobi Desert there is drought on average every other year and in central Mongolia drought occurs about once every 3 years14


Drivers of drought hazard


Data source: Paredes-Trejo et al.,
In addition to local drivers, severe drought events in Ethiopia are connected to global phenomena such as the negative/ positive phases of the El Niño–Southern Oscillation (ENSO).
Since 1980s the main drought episodes were recorded in 1988, 2000, 2002 – 2003, 2006, 2011, 2015 and 202010


Map 4: Land degradation severity in Ethiopia. Green shades represent low degradation while red colours stand for high degradation rates.
Data source: Battistelli et al., 2022
Map 3: Land degradation and Drought severity in the Amazon Basin (Brazil).
Left; map of Drought severity in the Amazon River Basin, calculated over the period 2001 – 2020, red evidencing the areas with the highest rates of drought. Right; map of Land Degradation severity. Red stands for degradated areas while green refers to areas in improvement.
202213
Map 1: Global land degradation 'hotspots'. Global land degradation hotspots generated comparing different method of land degradation detection. The value represents the number of methods that show the area as degraded.
202412
Map 5: Land degradation severity in Mongolia. Green shades represent low degradation while red colours stand for high degradation rates. Data source: Nyamtseren et al, 201414
The impact of droughts on price stability
Droughts have profound and far-reaching effects on economic stability, primarily through disruptions in agricultural production and water availability. These disturbances often lead to fluctuations and spikes in the prices (see Figs. 1 and 2, below) of essential goods and services as well as in the stock-to-use ratio, challenging stability, especially in regions heavily reliant on agriculture.
Impact on agricultural output and food prices
Agriculture is particularly vulnerable to drought, as water shortages reduce crop yields and livestock productivity. Water-intensive crops like grains, fruits, and vegetables suffer most, leading to supply shortages and significant price increases. For example, the 2012 U.S. drought caused corn prices to rise by 23 % and soybean prices by 16 %, affecting food prices globally1 Similarly, the 2010 Russian drought triggered a 70 % increase in global wheat prices2
Droughts also disrupt global food supply chains. When key agricultural exporters face production shortfalls, higher import prices contribute to imported inflation in other regions, further affecting price stability.
Energy costs and water supply
Droughts impact energy prices by reducing hydropower generation and increasing reliance on more expensive fossil fuels. This shift results in higher electricity prices, as seen in Brazil during the 2014 drought, where hydropower reductions led to a 25 % rise in electricity costs Additionally, droughts increase the cost of water, compounding price instability in water-dependent industries such as food processing, manufacturing, and energy production.
Macroeconomic consequences
Droughts have significant macroeconomic consequences, including rising inflation and reduced economic growth. Higher food prices particularly impact low-income households, reducing their purchasing power and dampening consumption in other sectors In developing countries, where agriculture plays a major economic role, droughtinduced price increases can lead to broader economic slowdowns.
Central banks may need to adjust monetary policies to manage inflation caused by droughts, and persistent drought conditions can undermine investor confidence, disrupt labour markets, and reduce government revenues from agriculture. The UK study by the University of Oxford5 highlights the potential for droughts to significantly impact the financial portfolios of banks and insurers, particularly those with large agricultural or infrastructure investments.
Droughts
and
inflation
Droughts significantly influence inflation, particularly in economies reliant on agriculture. By reducing agricultural output, droughts drive up the prices of staple goods like grains and vegetables, contributing to overall consumer price inflation, as food often holds a heavy weight in consumer price indices The inflationary impact is generally more pronounced in developing economies, while in advanced economies, it tends to be smaller or shorter-term. However, inflationary pressures in both cases depend on the degree of reliance on agriculture and water-dependent sectors.
Financial stability risks
Droughts also pose risks to the financial system, particularly by stressing ecosystems and degrading biodiversity. This degradation reduces productivity in sectors such as agriculture, forestry, and energy, increasing transition risks for banks exposed to these industries. As biodiversity loss accelerates due to climate change and water scarcity, the financial sector faces higher risks of loan defaults, especially in industries tied to natural capital7
There is a need for financial institutions to integrate climate risks, like droughts, into their credit and investment assessments to mitigate longer-term financial instability. The interconnected relationship between droughts, ecosystems, and the financial system calls for a more integrated approach to understanding these interdependencies.
terms of price and stock-to-use-ratio. The experiment has been run by using the worst and the best value of the Combined Stress Index for each key producer estimated in the period 1981 – 2010.
Data source: Chatzopoulos et al., 20208
Fig. 2: Extreme world maize prices attributable to concurrent and recurrent climate stress at the world level, 2030. Red and yellow grids denote extremely damaging (CSI > p90) and weak-to-severe (p90 ≥ CSI > 0) climate stress (as defined by the Combined Stress Index, CSI), respectively, during the corresponding growing season. Green indicates average or beneficial agro-climate conditions (CSI ≤ 0). The CSI is an indicator built on heat and water stresses that induce crop-yield anomalies. Reading the grid charts by row indicates domestic conditions across sets of simulations where world prices are simulated to be extremely high (x-axis). Reading the grid charts by column shows the concurrent climate conditions across key producers (y-axis) for any particular set of simulations that led to an extremely high world price. Therefore, horizontal concentration of non-green grids points to cases where domestic (simulated) events may have a high global impact, while vertical concentration of non-green grids reflects the importance of concurrent events.
Data source: Chatzopoulos et al., 20219
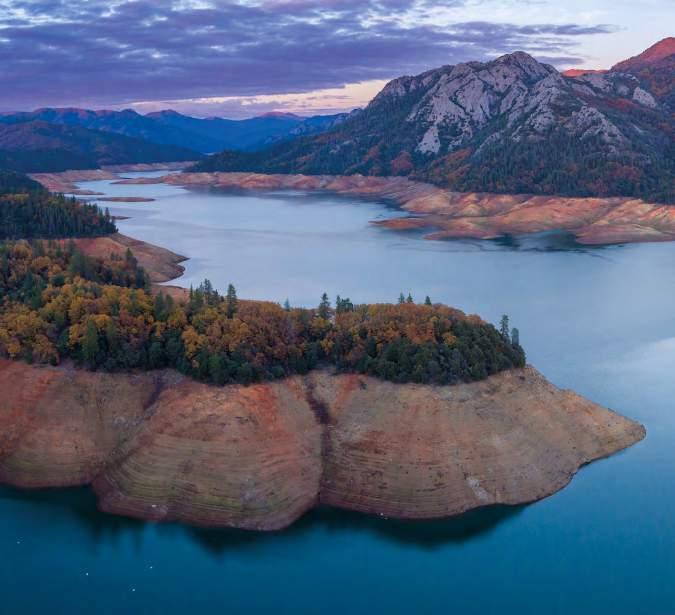
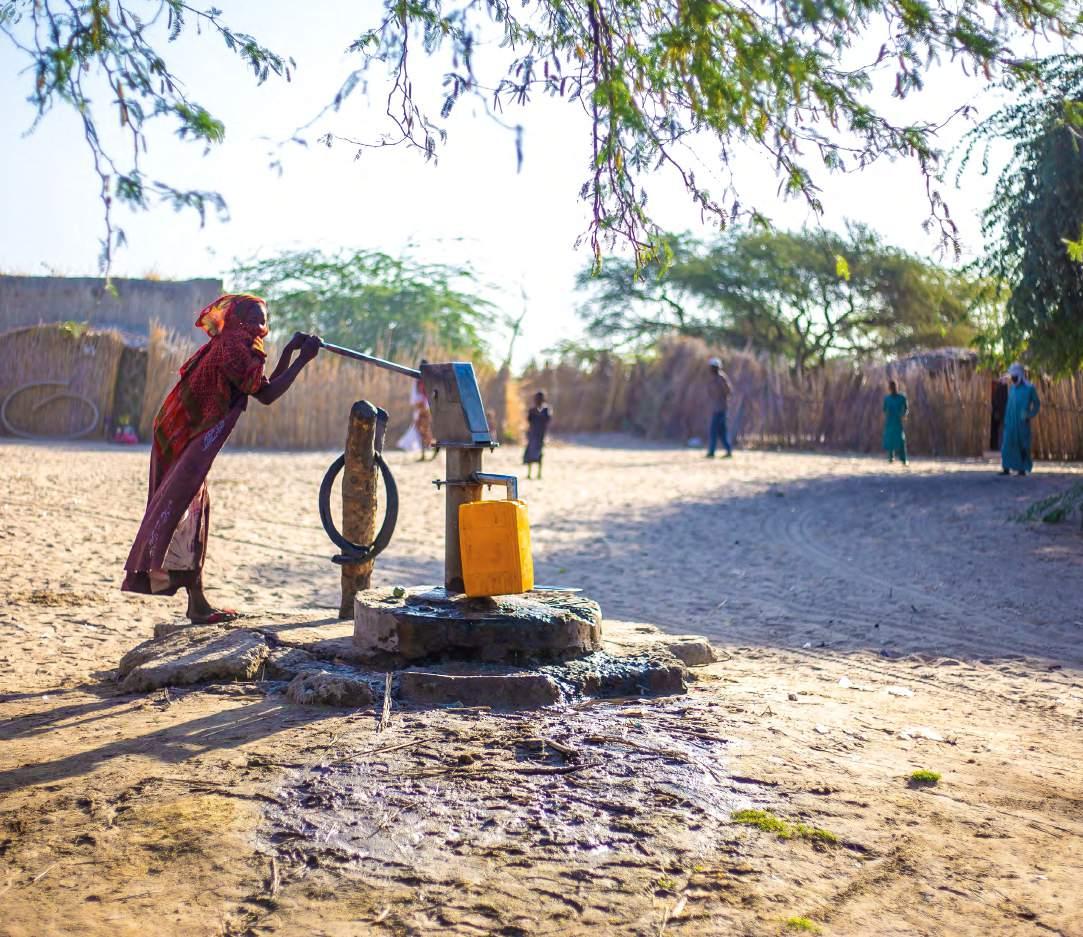
Droughts are not confined to arid regions; they occur globally, affecting areas as diverse as tropical rainforests, alpine mountain ranges and small islands. The impacts of droughts vary by geographic context, but they consistently pose challenges to both people and ecosystems. While droughts are often associated with vegetation loss and agricultural stress in rural areas, urban centres around the world can also be severely affected, particularly in terms of water supply. Effective responses to drought reflect communities’ and regions’ specific circumstances, yet there are commonalities that offer valuable opportunities for shared learning and collaboration.
Great Plains Flash Drought | Central North America | June – September 2012
A flash drought emerged in the central Plains of the U.S. in early June 2012. By September, 65 % of the 48 contiguous states (not including Alaska and Hawaii) were in drought, including the nation’s breadbasket of the central Great Plains1
The drought affected 80 % of the nation’s agricultural land, according to the U.S. Department of Agriculture’s (USDA) Economic Research Service (ERS)2 The 2012 drought prolonged recovery in Texas, where intense drought in 2011 had been easing in severity during the winter and spring of 20121
Map. 1: U.S. Drought Monitor - Class Change - Continental U.S. (CONUS).
Drought emerged rapidly over early summer 2012, centred on the U.S. Great Plains. This map shows the change in drought class between May 8, 2012 and July 31, 2012, with brown tones indicating worsening drought conditions and green tones indicating improvements in drought conditions3 Source: droughtmonitor.uni.edu
The Drought Severity and Coverage Index (DSCI), a weighted summary of area in each U.S. Drought Monitor (USDM) category, peaked at 215 in August 20123 As of May 2024, that was the highest value recorded since USDM and DSCI records began in 20001 In 2012, the USDA created a "fast-track" automatic trigger for drought declaration if any portion of a county was categorised as being in Severe Drought on the USDM. Other disaster declarations follow a lengthier process involving local, state or tribal and federal authorities
Contributor: Cody Knutson United States National Drought Mitigation Center, University of Nebraska
A flash drought in summer 2012 had widespread impacts on the U.S. agricultural sector. The onset of drought conditions was far more rapid than recovery.
droughtmonitor.uni.edu
Fig. 1: Percent area in Drought Monitor CategoriesContinental U.S. (CONUS). This time series of the percent of the contiguous 48 states (not including Alaska and Hawaii) in each U.S. Drought Monitor category from June 1, 2012 to October 1, 2013, shows drought’s rapid onset and more gradual decline. Categories run from D0 (abnormally dry, yellow) increasing in intensity to D4 (exceptional drought, dark red)3 Source: droughtmonitor.uni.edu Map 2: U.S. Drought Monitor - IntensityContinental U.S. (CONUS). The U.S. Drought Monitor showed 65 % of the 48 contiguous states in moderate drought or worse on August 14, 20123
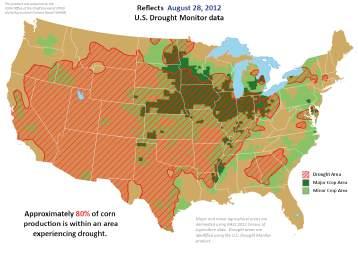
The 2012 drought had systemic impacts beyond agriculture, including:
Dust storms reminiscent of the Dust Bowl years in the southern Great Plains, leading to poor air quality and multiple-car accidents in Texas and Oklahoma when blowing dust reduced visibility.
Fish died because warmer water holds less oxygen. Deer died from epizootic hemorrhagic disease, which spreads more readily when more animals congregate around water sources.
The number of wildfires was among the highest on record. Contracting soils damaged basements and water pipes across the country.
Water suppliers implemented voluntary and mandatory conservation measures.
Hydropower production was reduced.
Drought reduced navigation on the Mississippi River1,5
More than 80 % of the acres planted in major field crops in 2012 were covered by federal crop insurance, the ERS reported2 Impacts reported in news compiled by the U.S. National Drought Mitigation Center included that as of January 2013, the USDA’s Risk Management Agency reported claims filed for all crops totaled almost $11.6 billion. Corn production for 2012 was estimated at 10.8 billion bushels, 13 % lower than the previous year and corn futures on the Chicago Mercantile Exchange reached a record high in August 2012. The U.S. Bureau of Economic Analysis estimated that drought reduced U.S. economic growth by 0.42 points from July through September 20121
Map 3: U.S. Drought Monitor - Corn areas in drought - Continental U.S. (CONUS). About 80 % of U.S. corn-producing areas were affected by drought in August 20123
Source: droughtmonitor.uni.edu
Source: National Drought Mitigation Center Drought Impact Reporter: https://Go.unl.edu/dirdash Lead Author: Kelly Smith United States National Drought Mitigation Center, University of Nebraska
Fig. 2: Number of County impacts by category. From June 1, 2012 to October 1, 2013, the U.S. National Drought Mitigation Center’s Drought Impact Reporter recorded a total of about 7 700 impact-county combinations that began during that interval of time. Each impact-county combination counts as one impact. In practice, any given impact report typically affects multiple counties. It breaks down by sector as 4 800 agricultural impacts, 2 100 water supply and quality impacts, 3 500 policy responses to drought (such as water restrictions), 1 600 environmental impacts, 1 100 fire impacts, 491 society and public health impacts, 390 tourism and recreation impacts, 334 business and industry impacts and 24 energy impacts
Native waters on arid lands | Southwestern U.S. | 2015 – 2022
Characteristics
The American Southwest (Arizona, Nevada, New Mexico and Utah) is characterised by a desert climate with low annual rainfall and seasonally high temperatures1 Southwestern states are some of the hottest and driest in the nation, with rivers that are fed primarily by mountain snowpack2 Since 2000, the region has been experiencing a megadrought (drought lasting more than a decade). According to reconstructed soil moisture records, the period between 2000 and 2021 was the driest 22-year period since 800 C.E.3 Declining water supplies have had severe impacts in the Colorado River Basin, where Lake Powell and Lake Mead dropped to very low levels in 2021. This led the U.S. Bureau of Reclamation to declare a water shortage for the first time and to implement major water supply cuts to lower Colorado Basin states4 Future warming in the American Southwest is expected to lead to increases in extreme heat events, increased evaporative demand (atmospheric thirst) and reduced river flows2
Map 1: Southwestern U.S. Southwestern U.S. encompasses the states of Nevada, Utah, Arizona, Colorado and New Mexico.
Source: Lovell Johns.
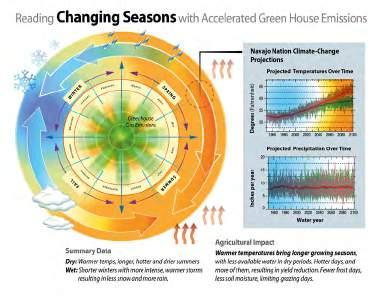
Map 2: Native Waters on Arid Lands partnerships. Native Waters on Arid Lands partnerships included Navajo Nation, Hopi, San Carlos Apache, Hualapai, Colorado River IndianTribes, Gila River Indian Community, Tohono O’odham Nation of Arizona; Navajo Nation, Jicarilla Apache Tribe of New Mexico; Ute Mountain Tribe of Colorado; and Walker River Paiute, Pyramid Lake Paiute and Duck Valley Shoshone-Paiute Tribes of Nevada.
Source: Ron Oden.
Fig. 1: Climate datasets and projections developed for the Navajo Nation. Climate datasets and projections developed for the Navajo Nation illustrate how warming temperatures and changes in precipitation are changing the seasons in Indian Country, directly impacting agriculture seasons, abundance and gathering of traditional plants, hunting, fishing and the timing of ceremonies for Tribes in the Southwest.
Source: Ron Oden.
Approximately one-third of the Navajo Reservation is covered with sand dunes. In this windy and increasingly arid environment, vegetation that grows on dunes can wither, contributing to increasingly unstable and mobile dunes. The formation and movement of active dunes downwind of alluvial sources (floodplains or other areas where loose sediments have been deposited) are endangering housing, transportation and grazing lands; potentially jeopardising native plants and cultural resources; and increasing natural and human health hazards. Plant cover in this area is declining as a result of prolonged drought. In one area, the Grand Falls Dune Field, an arid, sparsely vegetated field in the western Navajo Nation, dune migration rates range from 25 m/year to 43 m/year. Local wind regimes likely inhibit the viability of both annual and perennial plant growth. Navajo Nation communities are working with the U.S. Geological Survey and the Northern Arizona University to test approaches and provide training to help stabilise sand dunes. One strategy involves making tubes of corn-based fabrics and filling them with sand. These "sand tubes" are laid out in a gridded pattern. Small seed cakes containing native seeds are planted within the grids on a heavy clay base. The seed cakes prevent seeds from blowing away and the sand tube grids enhance rain capture, giving native plants a better chance to stabilise the surface of the dunes. The Navajo Nation has employed youth interns to assist communities in a growing awareness of the impacts and strategies available to address sand
dune mobilisation and water scarcity. Current pilot projects have been developed in partnership with local Navajo Chapters, Tolani Enterprises (a Tribal Non-Profit Group), the Little Colorado Water Conservation Association, the Navajo Nation Counci Resources Committee and the Navajo Youth Conservation Corps14-17
Lead Author: Roger Pulwarty, National Oceanic and Atmospheric Administration, U.S.
2: Dune stabilisation and revegetation. University students worked with Navajo high school and middle school students to conduct experimental dune stabilisation and rangeland restoration through Northern Arizona University's Institute for Tribal Environmental Professionals (ITEP) education and outreach program. The Institute provides students of all ages the chance to learn from one another and to assist neighbours and relatives who have been affected by drought and climate change.
Source: Redsteer, et al., 201816 and Bureau of Indian Affairs, 202417

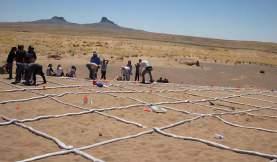
Actions
From 2015 to 2022, the Native Waters on Arid Lands (NWAL)8 project partnered researchers and extension specialists with Tribal communities in the American Southwest to collaboratively understand the impacts of climate change and to evaluate adaptation options for sustaining water resources and agriculture. In the Great Basin, NWAL worked with the Pyramid Lake Paiute, Walker River Paiute, Duck Valley Shoshone-Paiute, Fallon-Shoshone and Washoe Tribes, while in Arizona and New Mexico they collaborated with the Navajo, Tohono O'doham and Jicarilla Apache Nations and Hopi, San Carlos Apache and Haulapai Tribes. To aid tribal partners in climate planning, NWAL developed climate datasets and projections for Southwestern reservations though the year 21009 and installed weather stations to close data gaps in key areas10 NWAL held events including conferences, workshops and trainings to facilitate conversations about how to combine and integrate both Traditional Ecological Knowledge and western science into drought planning and climate resilience efforts11,12. During the COVID-19 pandemic, a working group met weekly to identify new impacts, challenges and response actions to the concurrent COVID-19 and drought crises in the region13 Responses to drought and other future climate challenges must take into account the unique cultures and situations of Indigenous communities of the Southwestern U.S.
Impacts
Climate change is having disproportionate impacts to Indigenous people in the Southwestern U.S.5 Indigenous cultures have thrived and survived in the region’s arid landscapes for many thousands of years and have adapted to changes in climate many times before, but today many Tribes are restricted to small portions of their traditional homelands, lack access to water, or have had to engage in lengthy legal battles to obtain water rights. Drought and warming temperatures are putting new stress on culturally important species used for food, medicine and other purposes and impacting farming and ranching through extreme weather events and changes in timing of planting, pollination and harvest5 Drought is not a standalone crisis; impacts can be made worse by seemingly unrelated events such as a pandemic, other extreme weather events, political unrest, or economic disruptions. The COVID-19 pandemic compounded problems of the ongoing drought, isolating Indigenous communities like the Hopi and Navajo and at times preventing them from accessing needed resources such as water for drinking and sanitation6 or hay for livestock7


Indigenous communities face unique vulnerabilities. They also possess unique knowledge and tools for responding to drought. Collaborative adaptation planning is critical for adequate and culturally appropriate drought response.
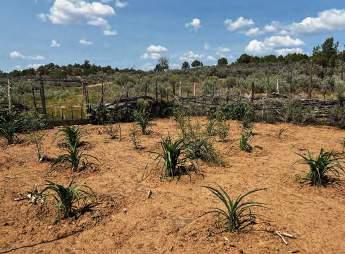

Navajo project prevents sand dune mobilisation
Fig. 6: "Water is Life". "Water is Life" painting on a wall near the Hopi Cultural Center, Shongopovi, AZ. Source: Maureen McCarthy/NWAL Project.
Fig. 5: Pueblo Farming Project. Pueblo peoples of the southwest have a long relationship with corn, or maize. This corn was grown using direct-precipitation farming methods.
Source: Courtesy of Crow Canyon Archaeological Center/Sarah E. Payne.
Fig. 3: Pointing the way. Gray Farrell on Navajo lands near Tuba City, AZ.
Source: Maureen McCarthy/NWAL Project.
Fig. 4: Planning workshop. Hopi farmers and ranchers and NWAL team at drought mitigation planning workshop in Kykotsmovi Village, AZ.
Source: Maureen McCarthy/NWAL Project.
Fig.
Erratic rain threatens food security in Guatemala | Guatemala, Central America | 2023
Rainfall patterns in 2023
The rainy season, typically spanning from May to October, began unusually in May 2023 with scant and irregular rainfall in almost the whole country (see Map 1, below) June, generally the peak of the first major rainfall, recorded significant deficits. In a departure from the norm, July and August, which usually experience a decrease in rainfall during the "canícula" period, saw higher-than-usual rainfall. This anomaly in weather patterns was notable during these months, while September and October experienced normal levels of rainfall.
Climate conditions were not only challenging to forecast but also unprecedented
While the total annual rainfall neared average levels in 2023, the main issue was the erratic distribution across the crucial agricultural months. Agricultural planning in Guatemala relies heavily on established climatological patterns, yet 2023 saw substantial deviations, particularly from May through August. This was largely influenced by the conditions observed in the Pacific and Atlantic Oceans. In the Pacific, the presence of a strong El Niño phase significantly reduced rainfall and increased temperatures from May to August. Meanwhile, in the Atlantic, elevated sea surface temperatures contributed to increased rainfall during July and August. The differing impacts from both oceans led to a year of irregular and hard-to-predict weather patterns.
Map 1: Rainfall anomaly in Guatemala, 2023. This map shows the rainfall anomaly in percentage in the months of 2023 respect to the climatological mean for the period 1991 – 2020 from the ENACTS dataset provided by the Guatemala NMHS (INSIVUMEH). In the top of the figure, it can be observed that the rainy months of May and June had a deficit in rainfall almost across the whole country reaching values of -80 % of the normal rainfall, specially towards the east of the country. Later in July and August, which are months affected by the regular decrease in rainfall known as the midsummer drought, there were exceedances in the centre of the country with values greater than +80 %.
Source: Alan Garcia.
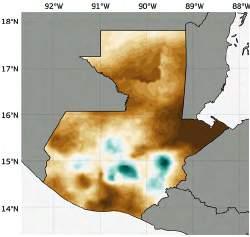
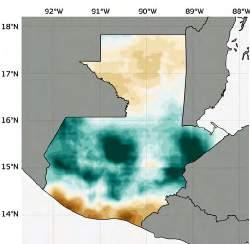
Responses
The situation remained concerning into early 2024, with persistent deficit conditions (see Map 2, right) Although the months from January through April are typically dry, they have recorded even lower than normal rainfall levels.
The 2023 – 2024 drought poses significant challenges to food security and economic stability in Guatemala. Continued climate variability could exacerbate these challenges, affecting the livelihoods of many, particularly those in rural and agricultural communities. It is imperative to consider long-term strategies for water management and agricultural resilience to mitigate the effects of such climatic anomalies.
In response to the crisis, the Guatemalan government, along with health authorities, has initiated preventive measures such as vaccination and nutrition support to address potential public health crises like acute malnutrition, respiratory infections and malaria, which can be exacerbated by drought, e.g. by reducing flows in rivers to standing water, which provides a breeding ground for mosquitos. The World Health Organization has also highlighted that the region, including Guatemala, faces high risks from global temperature increases linked to El Niño, emphasising the urgency of addressing both immediate and long-term health and humanitarian needs.
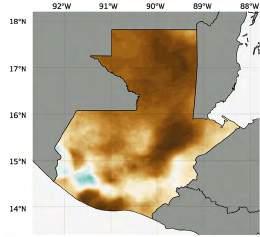
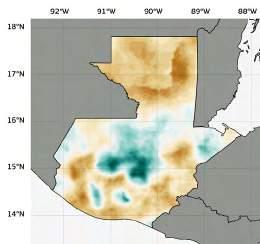
Impacts of drought
According to the country's Ministry of Agriculture and other agencies, the year saw substantial losses in key crops such as maize and beans, essential for domestic consumption. The sugarcane sector also reported reduced yields due to the irregular rainfall patterns. Over a thousand farmers in the southern coastal communities reported severe losses, potentially affecting local market prices due to scarcity and demand. 3.1 million Guatemalans faced some level of food insecurity, with 50 % of children experiencing chronic malnutrition1 The most impacted regions were the valleys of the East, North, Caribbean and Central Highlands, with the departments of Guatemala, Jutiapa, El Progreso, Petén, Baja Verapaz, Totonicapán and El Quiché being particularly hard-hit, though other areas were also affected (see Map 2, right)
Map 2: Food insecurity in Guatemala, May 2024. The 3-month Standardized Precipitation Index (SPI) map for May 2024 indicates predominantly dry conditions across most of Guatemala. Red shades dominate, representing extreme and severe drought conditions in large areas of the north, northeast and south of the country, while some southwestern regions experience moderate drought. White areas indicate near-normal conditions, but they are limited and no significant areas of excess precipitation (represented in green) are observed.
Source: INSIVUMEH https://insivumeh.gob.gt/
Seasonal forecast
and Anticipatory Actions in Guatemala
The National Meteorological and Hydrological Service of Guatemala (INSIVUMEH) produces a local seasonal forecast of rainfall based on calibrated physical models, internally called the NextGen forecast. The forecast not only provides an amount of rainfall for three months but also the probability distribution of rainfall, from which user-oriented thresholds can be evaluated as needed, for example for maize crops in a particular location.
The World Food Program (WFP) planned Anticipatory Actions (AA) in the Chiquimula department in eastern Guatemala using the seasonal forecast provided by INSIVUMEH. In 2023, the AA were activated after the seasonal forecast indicated a high probability (above 50 %) of non-exceedance for the rainfall requirement for maize during the rainy season. Drought-resistant seeds and fertilisers were distributed as part of the actions, along with the construction of community water reservoirs and seed banks.
The probabilistic forecast from INSIVUMEH was also included in the Drought Early Action Plan (EAP) implemented by the Guatemalan Red Cross.

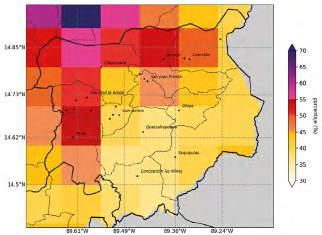
Rainfall anomoly in Guatemala, 2023
EL SALVADOR
Humanitarian crisis in the Central American Drought Corridor | Central America | 2015
2016


1. Hazard / physical context
The Central American drought corridor is affected by highly variable rainfall patterns exacerbated by El Niño-Southern Oscillation (ENSO) conditions, frequently causing cumulative rainfall deficits with impacts on agriculture, energy production, and the wider socioeconomy of Guatemala, Honduras, El Salvador, Nicaragua, and Costa Rica.
2. Impact
During 2015/16, an estimated 3.5 million people needed humanitarian aid, with 1.6 million people suffering from moderate or severe food insecurity in the most affected countries of El Salvador, Guatemala, and Honduras. Over 200 000 children suffering from malnutrition were reported. More than 119 000 ha of agricultural land was affected in Guatemala alone. Maize, rice, livestock and bean production were most affected. In response to the food insecurity, around 450 000 Central American migrants crossed the border to the US in 2017.
3. Governance management response
The International Federation of Red Cross and Red Crescent Societies (IFRC) launched a drought emergency appeal for El Salvador, seeking over 2.2M Swiss francs (2.5 M US$) to deliver assistance to over 9 000 people. In 2016, a humanitarian response plan was launched in Guatemala and Honduras as a result of the 2015 drought.
4. Lessons learned
While Guatemala, Honduras, and El Salvador suffered from a humanitarian crisis in 2015/16, more widespread use of insurance and infrastructure investment (e.g. irrigation) in Costa Rica since the 1997/98 El Niño record drought moderated impacts. However, little to no integrated water resources management across the region, paired with issues around hydrometeorological disinformation, hinders adaptation.
Contributors:
The 11 million people living in the CADC suffer from recurring erratic weather patterns, causing agricultural losses, food insecurity and humanitarian crises.
Tegucigalpa, Honduras Liberia, Costa Rica
Fig. 1: Drought related impact on rice yield, 2015/16. Influence of ENSO and 2015/2016 drought on rice yield in the region.
Bocanegra (2018).
Fig. 2: Precipitation.
Proactive approaches can mitigate multiyear drought impacts | Brazil & the Amazon Basin | 2010 – 2023
Inter-institutional arrangements help countries share information on droughts, but proactive planning is also necessary to reduce vulnerability.
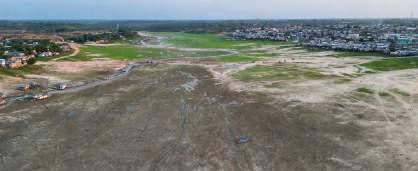
Characteristics
In 2023, a widespread reduction of rainfall over most of the western-central Amazon Basin – 100 to 300 mm below average in the Bolivian Amazon and in the Brazilian states of Amazonas, Acre, Roraima and Rondônia – coincided with a warmer austral winter due to El Niño, including six heat waves with air temperatures two to five degrees Celsius warmer than usual in the austral winter and spring pre-rainy season. As a result, several large rivers experienced the most extreme reductions in water levels since 1902.
Impacts
The severe water-level reductions caused increased mortality of fish and aquatic mammals, scarcity of potable water and food for river-dwelling communities, halted river transportation, increased risk of waterborne disease and strong defoliation of vegetation in riparian areas due to surface fires.
Actions
To reduce the negative impacts of drought on Amazonian populations, federal and state agencies monitor drought conditions and rely on seasonal climate and hydrological forecasts. Small farmers and indigenous communities living along the banks of the rivers are the most affected by drought, and the government supplies food, water and medicine as well as established credit lines for small farmers to help them to cope. Governments need to define and implement emergency plans, in collaboration with local communities, to cover basic needs (e.g. access to water, energy, transport and livelihoods). The health system needs greater capacity to treat respiratory disease caused by poor air quality. Inclusive regional strategies will strengthen the Amazon’s ability to withstand and recover from environmental challenges.
The natural climate variability of South America promotes the occurrence of droughts that have historically caused severe impacts. Furthermore, there is evidence that human influence on climate is already altering their frequency and intensity in some regions and that this will increase with increasing levels of global warming.
In the last decade, the number of inter-institutional arrangements has increased in several South American countries to share information related to droughts, as this has been identified as one of the climate haZards that most severely impacts the continent. The most common response to droughts in the region has been emergency assistance, which can be disorganised and expensive. However, a proactive approach associated with planning and preparing before a drought is growing in the region to reduce future vulnerabilities.
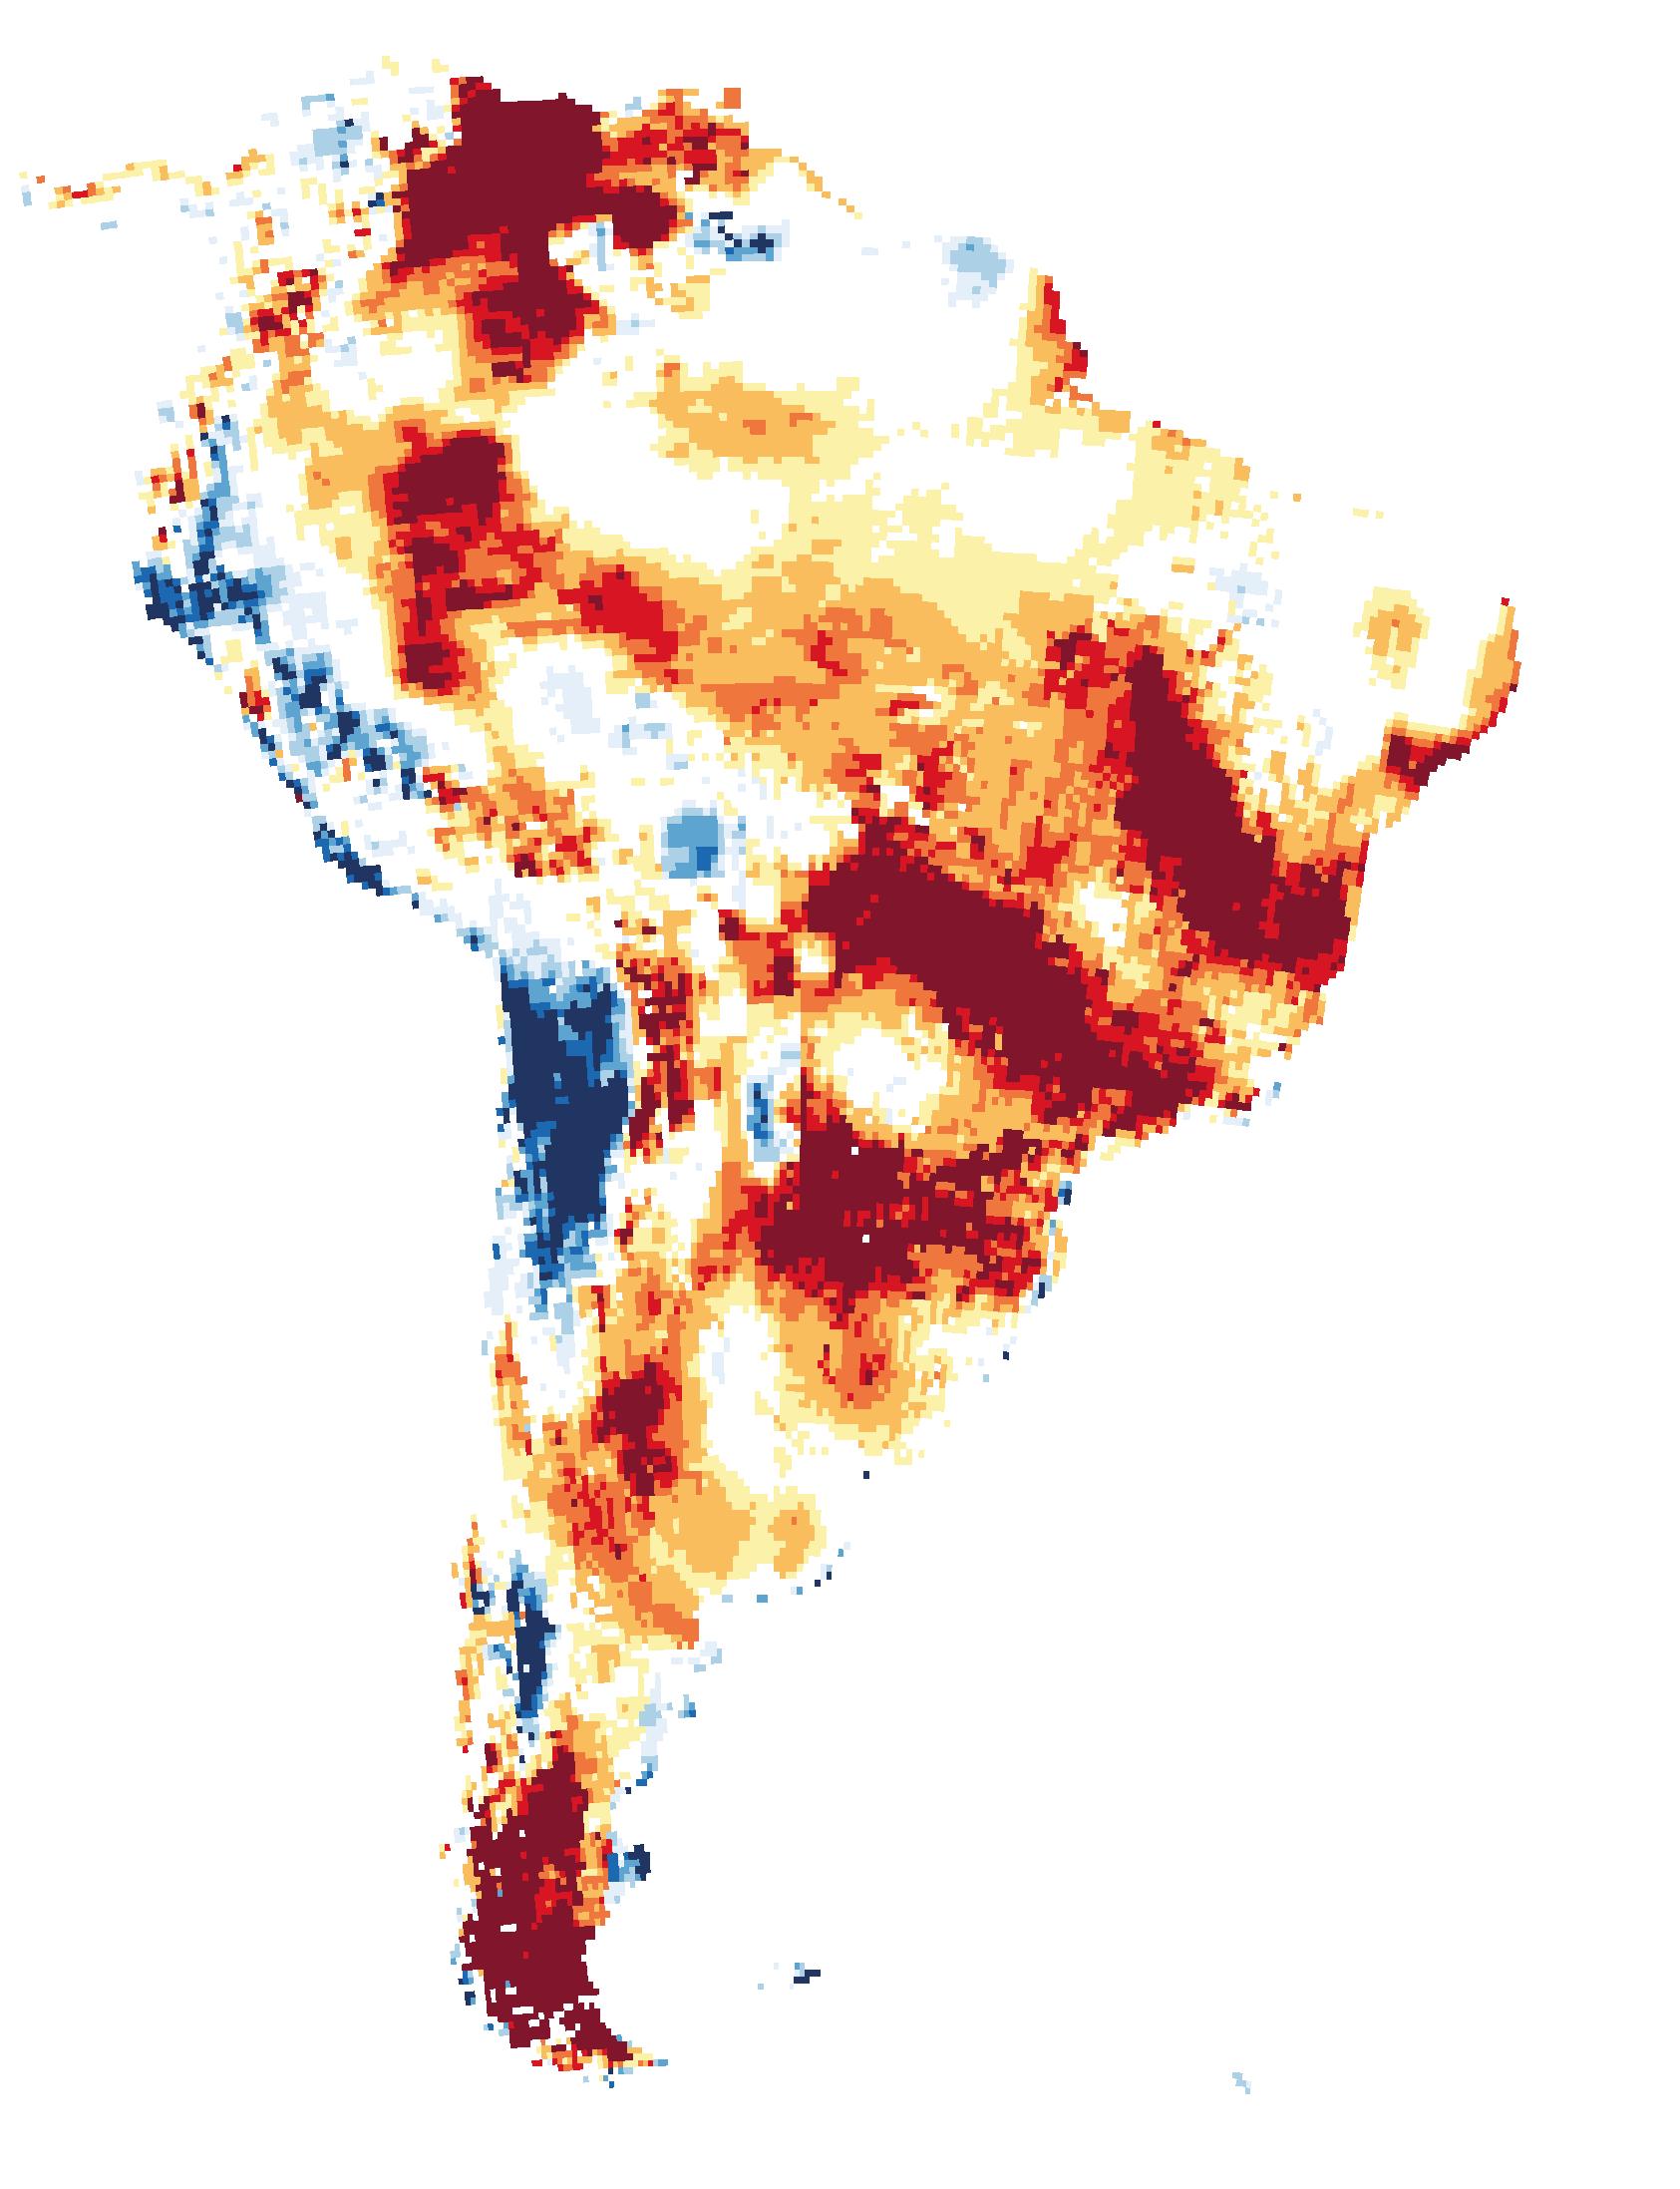
Case Study 2: Northeastern Brazil
Characteristics
One of the worst droughts on record in Northeast Brazil began as early as 2010, peaking in 2012 and lasting for a further five years. In 2012, rainfall anomalies varied from 300 to 400 mm/ year below normal, with maximum deficits occurring in March and April.
Impacts
The length and intensity of this drought have affected the regional economy in more than 1 100 municipalities of this region, including both in urban and rural areas. Between 2012 and 2016, 33.4 million people were
Actions
Measures
grating drought monitoring and seasonal prediction would allow for better anticipation of potential drought impacts. This information, together with the identification of risks and vulnerabilities, allows for better decision-making to guarantee the water, energy and food security of the population.
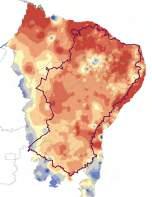
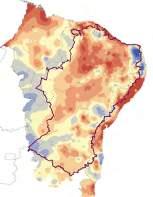
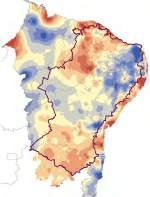
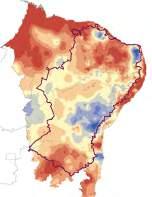
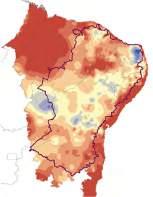
Case Study 1: Amazon Basin
Fig. 2: Water levels of the Rio Negro at the Port of Manaus. Maximum (blue lines) and minimum (red lines) levels of the Rio Negro at the Port of Manaus from 1902 to November 2023. Blue and red numbers indicate record floods and droughts, respectively.
Source: J. Schongart, Instituto Nacional de Pesquisas da Amazônia (INPA).
Fig. 4: Water tanks. Water tank (cisternas) used to store water during the rainy season so it can be used during dry periods.
Source: Ministério da Defesa, CC BY 2.0, via Wikimedia Commons.
Fig. 5: Precipitation anomalies. Precipitation anomalies (in mm) for the hydrological year October-September from 2011 –12 to 2015 –16.
Source: CEMADEN.
Fig. 1: Tefé Lake during the 2023 drought, Tefé, Brazil.
Source: Débora Hymans, Mamirauá Institute for Sustainable Development, Brazil.
Fig. 3: Impacts on small farmers. Carcasses of dead animals in the municipality of Tacaratu (state of Pernambuco), June 2012.
Source: Beto Macário/UOL.
Lead Authors: Carolina Vera Universidad de Buenos Aires, Argentina Jose A. Marengo National Center for Monitoring and Early Warning of Natural Disasters (CEMADEN), Sao Paulo, Brazil
Map 1: Shallow groundwater storage. Shallow groundwater storage in South America on October 26, 2020, as measured by the Gravity Recovery and Climate Experiment Follow On (GRACE-FO) satellites.
Proactive approaches can mitigate multiyear drought impacts | Brazil & the Amazon Basin | 2010 – 2023 (cont'd)
Characteristics
The central region of Chile and west-central Argentina have been experiencing a persistent and severe drought event since 2010, which has continued up to at least 2023. Due to its length and regional scale, it has been called a megadrought. As of 2018, it is the longest sequence of dry years since recorded observations began in 1914, and there has been almost no comparable event in the last millennium. The magnitude of the hydrological drought is unprecedented in at least the last 50 years of flow records in the Argentine region. There is evidence that climate change caused by human activities has influenced this extreme drought.
Impacts
The availability of water in this binational region – essential for food supply and other economic sectors, such as winter tourism and the production of wine and fine fruits– depends mainly on river flows fed by winter snowfall. During the 2010 – 2020 decade, the very reduced snow accumulation on the Andes Mountains has negatively impacted winter tourism and has promoted a hydrological drought that has restricted the use of water for irrigation, domestic use and hydropower generation, leading to significant sociopolitical disputes. 2021 ended with 226 communes in nine regions of Chile under declaration of Agricultural Emergency due to productive damage due to water deficit.
Actions
The extreme hydrological deficit highlighted the challenges managers face in providing water for irrigation in major agricultural centres of Argentina, with overexploitation of groundwater resources compensating for limited surface runoff. Almost half of the rural population in Chile is supplied with domestic water through community or individual management at the household level, such as local wells or shared taps. Their vulnerability to water scarcity varies depending on state support of the different existing supply modes. There are provisions in the current Water Code that conflict with water security goals and require updating. The creation of strategic water resources plans, such as community-based water resource management plans, for these basins represents an opportunity to achieve water security.



Impacts
River near the Argentine city of Rosario reached its lowest level in 77 years in May of that year. This hydrological drought has been the most severe in the last 50 years for the main basin rivers, seriously impacting the hydropower generation and river navigation in the five countries covering the basin. Due to drought impacts on the agricultural sector in 2022 and 2023, Argentina was estimated to have lost 3.3 % of GD P and suffered a 21.8 % reduction in exports.
Actions
The Drought Information System for Southern South America (SISSA) of the Regional Climate Center for Southern South America (CRC-SAS) made monitoring and prediction products available for this drought. These products were input to the national reports periodically prepared on the meteorological conditions of the six countries in the region. At the national level, special monthly drought reports were prepared during the event. Among other actions, national governments opened lines of credit for agricultural emergencies, collaborated with municipalities to facilitate access to water and reduce energy costs.


Case Study 4: La Plata Basin
Case Study 3: Extratropical Andes
Fig. 10: Salto Grande Hydroelectric Dam, Argentina-Uruguay.
Source: SISSA.
Fig. 7: Collahue Reservoir, Chile, 2022.
Source: Martín Bernetti for AFP.
Fig. 11: Rainfall-evaporative demand anomalies illustrated using SPI-6 based on CHIRPS precipitation from 15 March 2019 to 30 September 2021 for the La Plata Basin.
Source: SISSA; Funk, C. et al., 20152
Fig. 8: Anomalies in the maximum yearly value of snow water equivalent. Temporal evolution of anomalies in the "maximum yearly value of snow water equivalent" at five selected snow pillow stations in the mountains of centralwestern Argentina, calculated as departures from the period 1990 – 2020. Adapted from Rivera et al., 20211
Fig. 9: Maize field, Uruguay.
Source: Sistema de Información sobre Sequías para el sur de Sudamérica (SISSA).
Fig. 6: Aculeo Lagoon, province of Maipo, Metropolitan Region, Chile. Source: Felipe Perez Peredo, MeteoChile.
Map 1: Shallow groundwater storage. Shallow groundwater storage in South America on October 26, 2020, as measured by the Gravity Recovery and Climate Experiment Follow On (GRACE-FO) satellites.
Recurring droughts in the water-stressed Maghreb region | Northwest Africa | 2001 – 2023
The Maghreb's severe droughts, worsened by climate change, are causing water shortages and food insecurity. Sustainable agriculture and strong policies are crucial for building resilience and securing long-term food and economic stability.
The Maghreb region is facing severe droughts, worsened by climate change, leading to reduced agricultural output, water shortages and food insecurity. Droughts have heavily impacted rural livelihoods and strained local economies. Sustainable agriculture practices, such as water conservation, crop diversification and agroforestry, are essential for building resilience against drought. Effective government policies and investments in these practices are crucial for ensuring longterm food security and economic stability in the region.
Drought monitoring
Monitoring drought at higher spatial and temporal resolutions is crucial for developing effective early warning systems and mitigating associated risks. Here, we show meteorological drought conditions (see Fig. 1, right) of the past decades across the Maghreb region in northern Africa, which includes Mauritania, Morocco, Algeria, Tunisia and Libya. These countries rank among the top 30 water-stressed nations globally and have a combined population of 108 million. Standardized Precipitation Index values indicate that the driest years were 2001, 2021 and 2023, while 2010 and 2018 were the wettest (see Fig. 1, right) Since 2018, the region has received below-average rainfall, marking an increase in the severity of drought conditions over the last five years (see Fig. 1, right)
Changes in SPI in the Maghreb region
The meteorological drought trend was analysed at regional and national levels, as shown in Map 1, right The regional analysis revealed that approximately 64 % of the region experienced worsening drought conditions, indicated by an increasing trend in drought severity. Specifically, the central north, central and western extremities of the Maghreb region showed significant degradation in meteorological conditions, characterised by a negative Standardized Precipitation Index (SPI) slope. This negative SPI slope indicates a decline in rainfall and an intensification of drought over time in these specific areas.
Throughout the study period, meteorological conditions in the Maghreb countries have generally deteriorated, except for Libya which has an average positive SPI slope. Among the affected countries, Tunisia has the most pronounced negative SPI slope at -0.025, followed by Algeria at -0.0162. These trends highlight a significant decline in rainfall and worsening regional drought conditions. Specifically, 96 % of Tunisia shows a negative SPI trend, followed by Algeria (79 %), Morocco (61 %) and Mauritania (58 %)
Fig. 1: Annual
Precipitation Index across the Maghreb Region. Satellite rainfall data from the Climate Hazards Group InfraRed Precipitation with Stations for the period from 2001 to 2023.
Source: Abeyou Worqlul, based on national data.
1: The SPI slope trend of the Maghreb
Impacts
In 2001, the Maghreb region experienced significant drought conditions. This period marked one of the driest years in several decades, leading to severe water shortages and agricultural losses. The recent prolonged dry conditions since 2019 have severely impacted agriculture, water availability and the environment, affecting both rural and urban communities.
According to WMO, 2021 was one of Africa's warmest years on record. This has caused food insecurity and displacement, with many communities struggling to adapt to the changing climate conditions2 In 2022, the drought situation remained critical. The region faced extreme heat waves, further reducing water availability and impacting crop production. The drought in 2023 continued to exacerbate the challenges faced by North African countries. The region experienced one of the warmest years on record, with significant rainfall deficits.
Among the Maghreb countries, Morocco has been significantly affected by drought conditions in recent years. In 2023, the planted area and crop yield reduced significantly, exacerbating the country's food insecurity and economic challenges. The country had to import 2 million tons of wheat to mitigate the effects of drought on its crops, highlighting the severe strain on local food production3
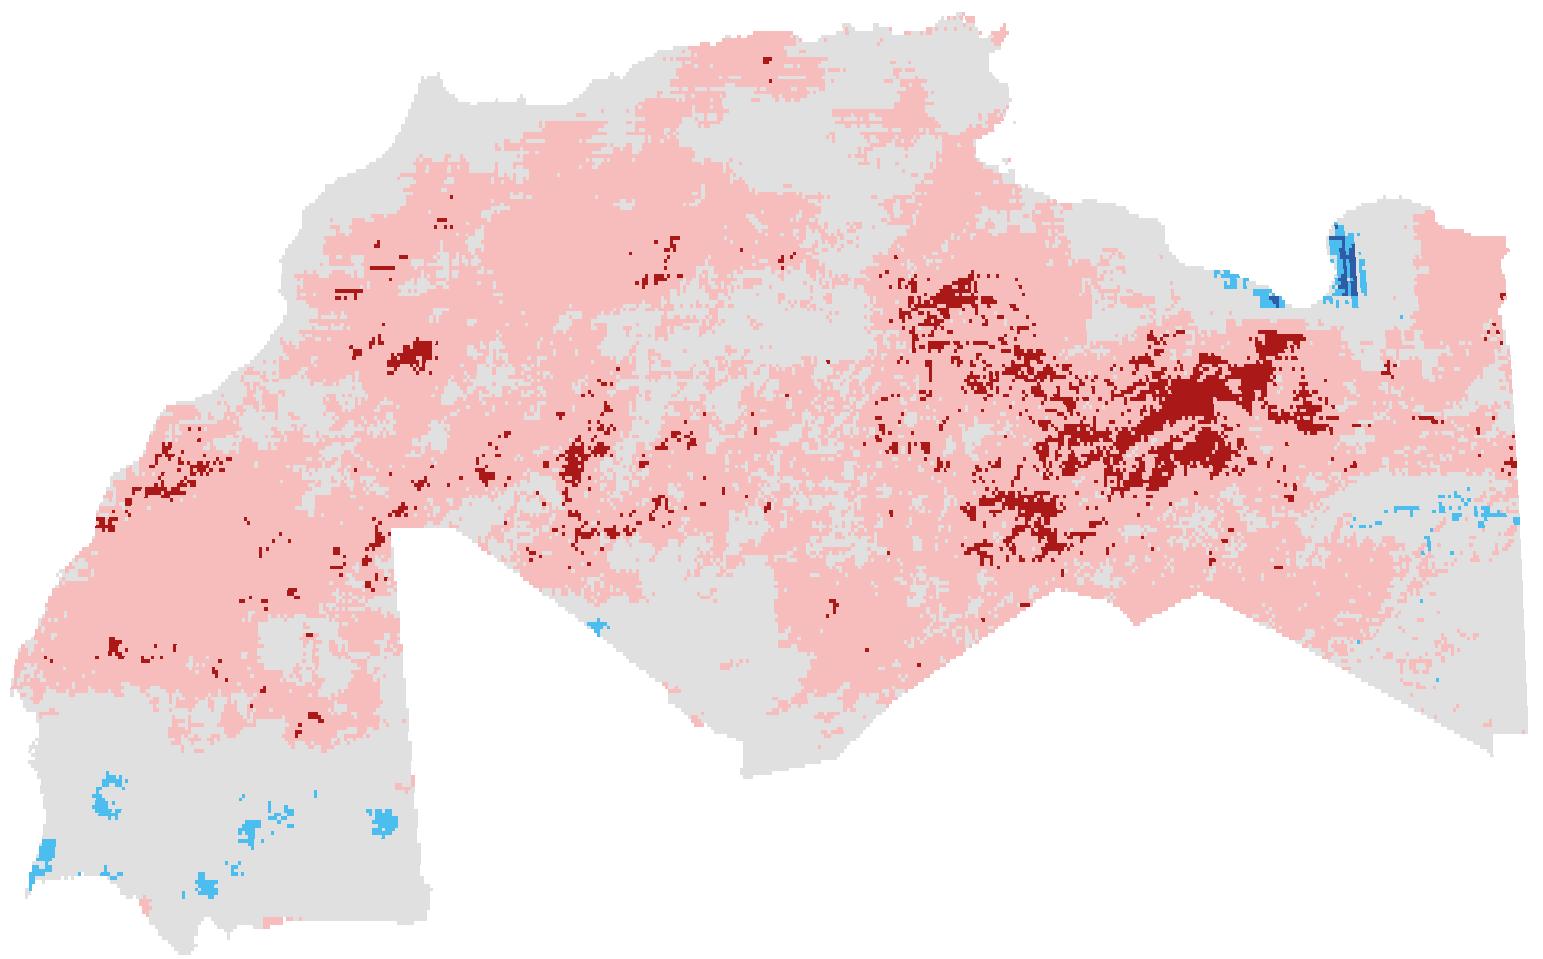
The persistent and increasing severity of drought conditions in the Maghreb region over the past two decades underscores the urgent need for comprehensive drought management strategies. These strategies should focus on enhancing water resource management, improving agricultural practices and increasing resilience to climate extremes. Addressing these challenges is vital for safeguarding the livelihoods of millions of people in the Maghreb region and ensuring long-term food and water security.
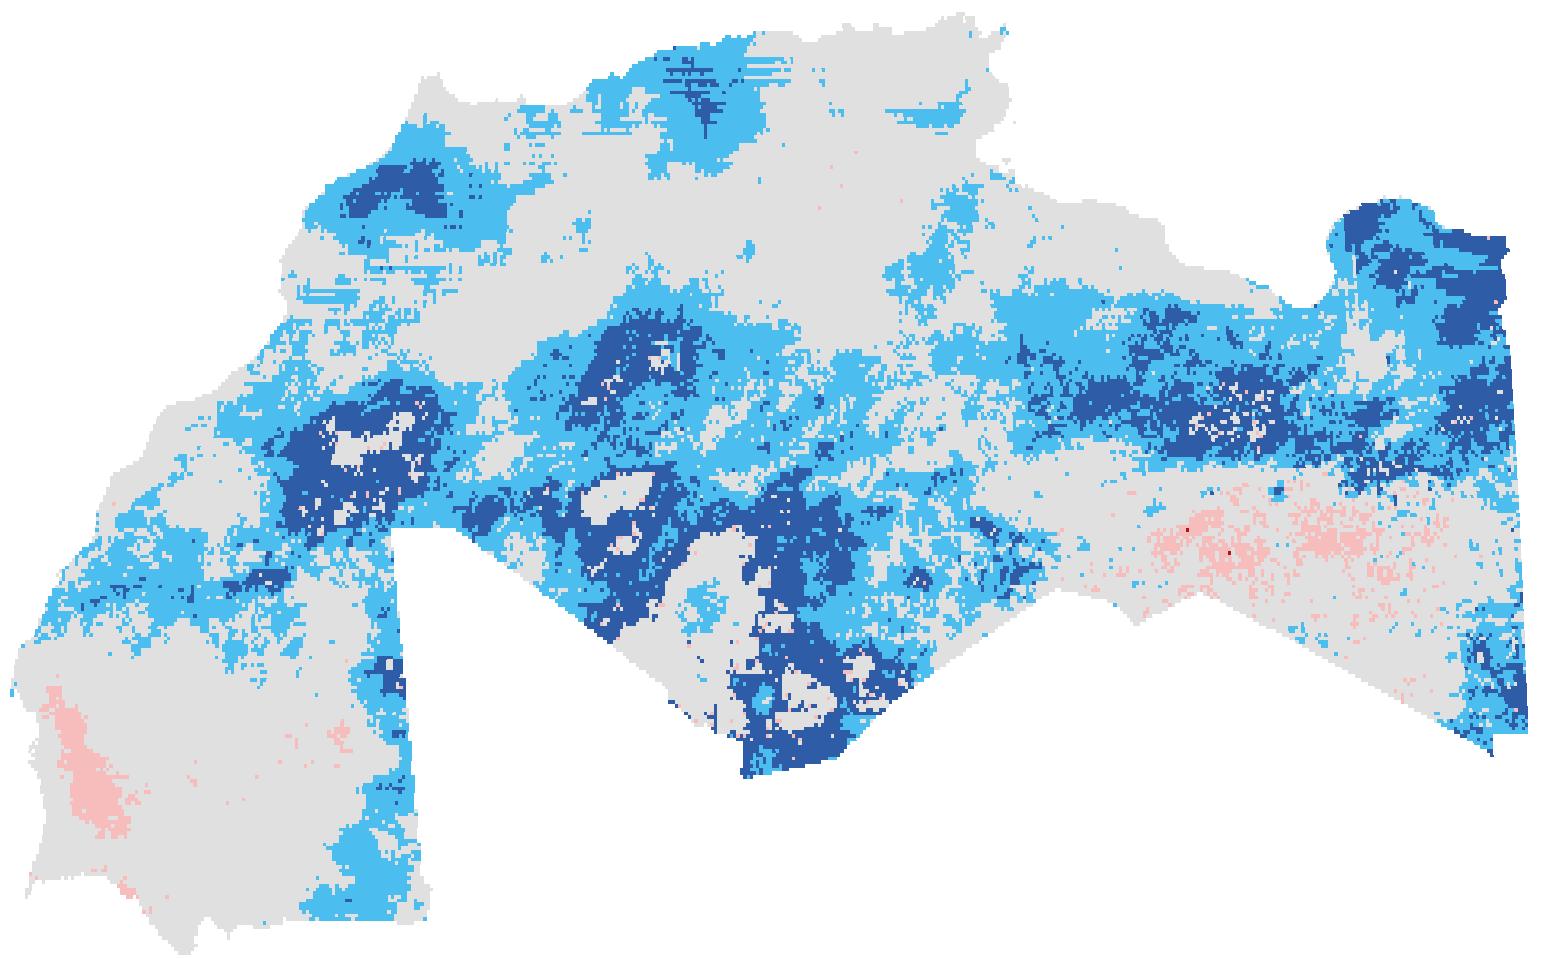
Fig.
Prolonged drought over the Horn of Africa |
Eastern
Africa | 2020 – 2022
The protracted drought in East Africa spanning from 2020 to 2022 revealed the region's profound susceptibility to climate variability and change, resulting in significant food insecurity and displacement. Enhanced early warning systems, strategies to build climate resilience and international collaboration to reduce the occurrence of future climate-induced disasters are urgently needed.
Level of impacts (2020 – 2022 Drought)
East Africa experienced severe drought conditions in the period 2020 – 2022, leading to severe food insecurity in the region as a result of 5 consecutive failed rain seasons. These years marked the driest periods in decades, adversely affecting water availability, agricultural productivity and food security. An estimated 13 million people faced acute food shortages, with pastoral communities experiencing substantial livestock losses, including over 3 million livestock deaths in Kenya alone. The drought exacerbated existing vulnerabilities, leading to increased displacement, with hundreds of thousands of people moving in search of water and pasture. Natural ecosystems such as forests and grasslands suffered degradation, affecting biodiversity and ecological balance. Recurring droughts underscore the urgent need for enhanced resilience and adaptive strategies in the face of climate change.
With the 2020 – 22 event, we learned that enhanced early warning systems proved crucial in predicting and monitoring drought conditions, allowing for earlier responses and preparation. This highlights the need for continued investments in early warning systems and data-sharing across borders. Despite early warnings, the allocation of resources often remained reactive rather than proactive, leading to delayed responses in many instances. This points to the need of better preparedness and pre-allocated resources for rapid deployment.
Maps 1 and 2: Combined Drought Indicator (CDI), East Africa Region. The maps depict the evolution of drought conditions in Ethiopia, Eritrea, Djibouti, Somalia and Kenya on two specific dates: 11 – 20 April, 2021 and 1 – 10 June, 2022. On 11 – 20 April 2021, the drought event impacted a large area of the region. On 1 – 10 June 2022, the most severe conditions of this continued drought were reached in the Horn of Africa, with a large portion of the region under the alert phase, implying that both natural and agricultural vegetation was affected.
Source: Base map, OpenStreetMap; Data, ICPAC https://droughtwatch.icpac.net/
Drought conditions as of 11 Apr 2021 Drought conditions as of 01 Jun 2022
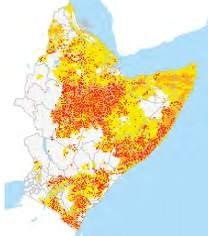
Fig. 1: Cropland exposed to drought, June 2022, East Africa Region.
Source: https://droughtwatch.icpac.net/ Lead Authors: Jully Ouma
(ICPAC)
Amdihun Intergovernmental Authority on Development (IGAD), Climate Prediction & Application Centre (ICPAC) Viola Otieno Africa Union Commission (AUC) Alfred de Jager European Commission, Joint Research Centre, Italy
Graph (a) shows the evolution of the 10-Day Combined Drought Indicator (CDI) for Ethiopia, Eritrea, Djibouti, Somalia and Kenya, covering the period from January 2020 to December 2022. The data displays the proportion of the affected area in three distinct stages: Alert Phase (indicated by red), Warning Phase (indicated by orange) and Watch Phase (indicated by yellow), as well as periods of Normal Conditions (indicated by the colour white). The peaks represented by the yellow bars indicate periods when a substantial portion of the region was in the warning phase, indicating intensified drought conditions. The red bars, which represent the alert phase, point to more severe drought conditions that demand immediate attention. The changing patterns demonstrate the varying levels of drought severity and geographical extent during the specified period. The analysis of the 3-month cumulated Standardized Precipitation Index (SPI) (c) for the same five countries during 2020 – 2022 shows two distinct drought peaks as well as the failed rain seasons (March /May) in which hardly the moderate wet class is reached. This highlights the lack of recovery of the rainfall deficit and that the drought did not leave the area .
The 10-Day Fraction of Absorbed Photosynthetically Active Radiation (FAPAR) anomaly analysis for the period 2020 to 2022 shows a similar pattern, as depicted in (b). This indicator monitors the health of vegetation using satellites. During the entire period, there are notable variations in the health of vegetation, which corresponds to the severity of drought, with a slight delay in time as evident when comparing with the SPI analyses.


Fig. 2: Population exposed to drought, June 2022, East Africa Region.
Source: https://droughtwatch.icpac.net/
Figs. 3a – c: Combined Drought Indicator, Vegetation and Precipitation Anomalies, Jan 2020 – Dec 2022, East Africa Region (Ethiopia, Eritrea, Djibouti, Somalia and Kenya).
Source: https://droughtwatch.icpac.net/
Compound drought and heatwave in the Zambezi Basin | Southern Africa | 2023 – 2024
Food insecurity, lower hydropower production and high wildfire danger in southern Africa were driven by compounding drought and heatwaves fueled by El Niño and exacerbated by climate change.
A severe drought affected southern Africa and the Zambezi basin in 2023/2024, with extremely dry and warm conditions from October 2023 to March 2024. Heatwaves exacerbated the impacts of the lack of precipitation. The average temperature was abnormally high, registering record values since 1960. Soil moisture and vegetation conditions were severely affected, with negative anomalies over large areas of the region. The Zambezi River was at its lowest discharge for the season, corresponding to about 20 % of the long-term average. Crops were affected as the extreme conditions occurred in the most critical period of the growing season, with severe economic and social impacts. Crop damages and losses caused the IPC (Integrated Food Security Phase Classification) Acute Food Insecurity to range from stressed to crisis level in most of the Zambezi basin regions. Hydropower production was severely affected. Wildfire danger was high in Namibia, Botswana and north-western South Africa1


Maps 1 – 6: Soil Moisture Anomaly. Soil Moisture Anomaly (ensemble based on Lisflood model and ESA-CCI dataset) and spatial-temporal tracking of the meteorological drought (based on SPI-3 data derived from the ERA5 precipitation reanalysis) from late October 2023 to late March 2024.
Source: Toreti, et al., 2024
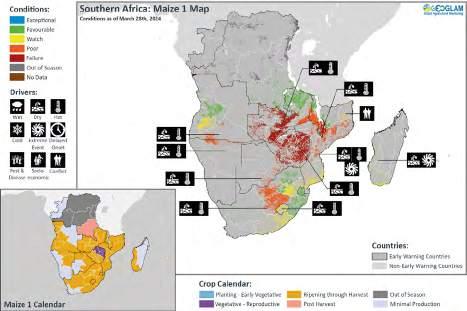
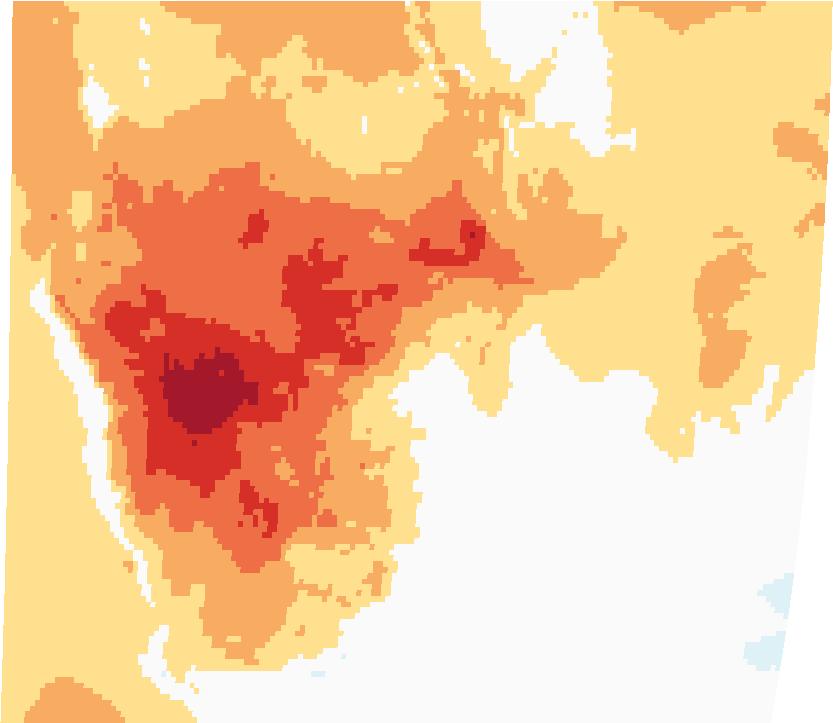
8: Temperature anomaly. Average temperature anomaly (ERA5) computed for the period October 2023 – March 2024 (baseline 1991 – 2020).
Map 7: GEOGLAM crop monitor. Crop condition map synthesising maize conditions as of March 28th 2024. Crop conditions over the main growing areas are based on a combination of inputs including remotely sensed data, ground observations, field reports and national and regional experts. Crops that are in other-than-favourable conditions are labelled on the map with the relevant driver(s).
Source: GEOGLAM Crop Monitor for Early Warning https://www.cropmonitor.org/
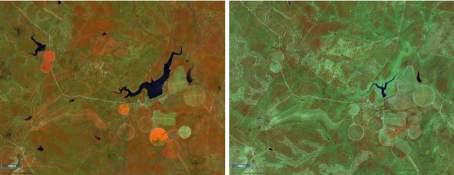
Agriculture and ecosystems during recent droughts | Europe | 2018 and 2022
2018 conditions
In 2018, central and northern Europe faced severe drought due to low precipitation and sustained above-average temperatures, including heat waves, driven by persistent anticyclonic conditions. Heat waves worsened the drought in Ireland and the U.K. from May to mid-July, while Scandinavia experienced an enduring heat wave starting in late May. Norway and Denmark had their warmest May since 1900. By August, drought conditions intensified in Scandinavia, Ireland, the UK, southwest Germany and northern France. Meanwhile, southern Europe had unusually wet spring and summer conditions. The Iberian Peninsula saw exceptional rainfall in March 2018 due to unusual planetary wave activity, sudden stratospheric warming and a persistent negative North Atlantic Oscillation anomaly.
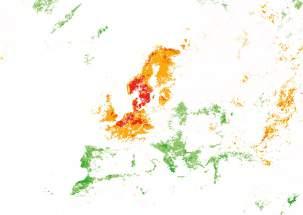
Agriculture
Agriculture in the European Union takes up 38 % of land area and contributes about 1.3 % to the GDP1 Despite its relatively small land use, it consumes 46 % of the average annual water supply, which can rise to up to 80 % in specific regions. Consequently, the sector is highly exposed to droughts, accounting for over 50 % of total drought losses in Europe2
Impacts in 2018
Drought conditions in central and northern Europe caused yield reductions up to 50 % for key crops, including wheat, barley and maize. Drought also had a significant impact on pastures, leading to negative effects on the livestock and dairy sectors. Conversely, southern Europe saw wet conditions that resulted in yield gains of up to 34 % compared to the previous five-year average3
Impacts in 2022
In 2022, summer crops suffered substantial yield reductions due to severe and prolonged drought conditions across many regions in Europe. The most affected crops were rice, maize, soybean and sunflower, with yield reductions ranging from 13 % to 21 % compared to the previous five years' average at the EU level4
The year 2022 was the second-worst for wildfires in the EU since monitoring through the European Forest Fire Information System (EFFIS) started in 2000. Nearly 900 000 ha of land burnt in the EU, corresponding roughly to the size of Corsica. For a third year in a row, unprecedented wildfire events caused large environmental and economic damage in the EU and tragic loss of life. Fires also impacted Natura 2000 sites, the EU's biodiversity reservoir, accounting for about 43 % of the total burnt area. Thanks to prevention measures put in place by the EU and its Member States and the enhanced preparedness and firefighting operations of the fire management services, the number of casualties in 2022 was contained.
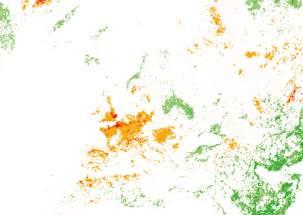
Forests and Ecosystems
About 40 % of Europe's land area is covered with forests. They host most of the terrestrial species of animals and plants native to the continent. Forests are a central component of nature and wildlife in Europe and provide a wealth of ecosystem services positive for human and the planet's wellbeing5
Impacts in 2018
Despite the relatively lower extent of area impacted by the drought of 2018 with respect to those of 2003 and 2022, the net loss of carbon uptake in the summer of 2018 (50 – 66 TgC) was comparable to those of 2003 and 2022. In 2018 about 75 % of this reduction in carbon uptake was compensated by off-growing season activity in the previous spring thanks to warm conditions6
Impacts in 2022
2022 conditions
The drought of 2022 in Europe was triggered by a significant lack of precipitation starting at the end of 2021, affecting the western Euro-Mediterranean region. By March, it spread to northern Italy and the Po River basin, exacerbated by a severe precipitation deficit and poor snow accumulation7 By April, the Danube River basin was also affected. High mid-tropospheric pressure anomalies from May to July 2022, which divert moist and cool air, were observed over most of Europe. These conditions led to record-high positive geopotential height anomalies and recurrent heat waves which persisted through early August 2022, particularly in western, southern and central Europe. The series of heat waves was further exacerbated by the pre-existing drought, creating a reinforcing feedback loop that intensified both the drought and the heat waves.
While different in terms of spatiotemporal characteristics, recent large scale droughts in Europe had considerable impacts on several socioeconomic and natural systems at a continental scale.
The drought of 2022 saw the largest impacted forested area in the period 2000-2022, only comparable to the drought of 2003. The reduction of net carbon uptake in the summer of 2022 was 56 – 62 TgC over the area affected by drought and only about a third was compensated by off-growing season activity during the subsequent fall6
Wildfires, 2022
Energy Production
Water is an essential asset for both renewable and traditional energy production sources, as it can act not only as a source of energy (e.g. hydropower) but also as a cooling substance. Exceptional droughts can significantly affect energy production due to reduced water availability and increased competition for water resources. Both the 2018 and 2022 droughts in Europe led to severe impacts on energy production, but in very different ways due to their spatial-temporal development over the European continent and implications for energy storage of hydropower systems.
Impacts in 2018
In 2018, extreme negative precipitation anomalies and warmer-than-usual conditions hit mostly northern and eastern Europe (see Map 5, right) The most affected countries in terms of hydropower were in Scandinavia and the impacts became more relevant from May onwards.
Impacts in 2022
The drought of 2022 covered large areas in Central Europe and along the Mediterranean basin (see Map 6, opposite) Negative precipitation anomalies started even earlier, during the winter of 2021 – 2022 with an extreme snow drought that exacerbated the lack of water during the melting season. Italy and Portugal registered record low levels of stored energy.
Map 1: SPEI-12, Dec 2018. Standardized Precipitation-Evapotranspiration Index (SPEI) over a 12-month accumulation period as of December 2018. Meteorological data input is the CRU TS (Climatic Research Unit gridded Time Series) 4.08 dataset, spanning the period between January 1901 to December 2023 and computed using the SPEI package version 1.8.1. in R language.
Source: Beguería et al, 20231

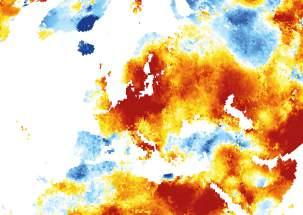
Fig. 1: Stored energy in reservoirs and hydropower plants for some European countries. The years 2018 (blue lines) and 2022 (pink) compared to the 2016 – 2023 average (grey). The European drought of 2018 covered most of central and northern Europe, where the most severe stored energy deficit occurred during the summer. The drought of 2022, instead, covered most of southern and central Europe, leading to severe lowflow levels in southern Europe, particularly during the spring and summer and in Italy, Spain and Portugal where record extreme low-flow values were registered.
Source: Data source ENTSO-E Transparency Platform: https://transparency.entsoe.eu/dashboard/show


Fig. 2: Val Di Mello, Lombardy, N. Italy. Due to an exacerbating compound effect of lack of rainfall, snow drought and heatwaves, some rivers in the Alps were affected by extremely low flow values, showing the extreme impact of droughts in the Alps. In Val di Mello in 2022, the river and the small lakes were completely dry and it was possible to walk on the river bed and on the lake bottom. The comparison with normal conditions in 2019 shows the striking consequences of the 2022 drought.
Source: Davide Bavera, CC BY 4.0.
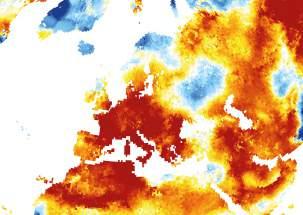
River

Transportation
The Rhine River Waterway
With around 41 000 km of waterways connecting hundreds of cities and industrial regions, inland waterway transport is fundamental in Europe. The Rhine is Europe’s busiest river, transporting daily some 600 ships and over 200 million tonnes of cargo across the Dutch-German border daily.
The river is the most important transport route for German industry, connecting the Port of Rotterdam to the Rhine-Ruhr region, Germany’s industrial heartland. The Rhine has a pluvionival regime, being fed by both snow melt and precipitation processes. Transport along the Rhine was severely disrupted during the 2018 and 2022 droughts, when water levels fell below a critical threshold for navigation.
Impacts in 2018
Unusually warm and dry conditions across northern and central Europe during spring and summer of 2018 led to low-flow conditions in the Rhine River basin. Water levels at the chokepoint of Kaub, near Frankfurt, fell to about 28 cm in depth on November 24th, 2018, well below the level of 250 – 260 cm for optimal navigation (see Fig. 4, below) Low flow conditions impacted the Rhine River’s transport capacity for a period of several months, causing shortages of source materials and fuels in regions far in-land3 Economic impact in industrial production was estimated at 1.5 %, for a decline of German GDP by about 0.4 %4
2: SPEI-12, Dec
Standardized
(SPEI) over a 12-month accumulation period as of December 2022. Meteorological data input is the CRU TS (Climatic Research Unit gridded Time Series) 4.08 dataset, spanning the period between January 1901 to December 20237
Source: Beguería et al, 20231
Fig. 3: Rhine water levels at the Kaub measuring station. Rhine water levels at the Kaub measuring station during the years 2018 (blue line) and 2022 (orange line). Indications on the approximate relative capacity to which ships can be loaded with respect to the Rhine water levels at the Kaub station are given as the coloured-dashed horizontal lines. The critical threshold of one-sixth load capacity was crossed during both the years of 2018 and 2022.
Source: Federal Waterways and Shipping Administration (WSV), German Federal Institute for Hydrology (BfG).
Fig. 4: The Rhine near the city of Cologne, August 2022. Water levels on the Rhine River, Europe’s second-largest river, as captured by the Copernicus Sentinel-2 mission near Cologne, showing alarmingly low river levels and the river banks during August 2022.
Source: ESA, Copernicus Sentinel data (2022), processed by ESA6
Impacts in 2022
A combination of a severely dry winter over the Alps with a dry-and-warm spring-summer over Central Europe has led to low flow conditions along the Rhine River5. Water levels at Kaub fell to about 32 cm in depth on August 15th 20227 , leading some larger vessels to cease their operations due to low-flow conditions, while most freight ships kept operating but under a substantially reduced capacity of around 25 % to 35 % (see Figs. 3 and 4, below)7

Map
2022.
Precipitation-Evapotranspiration Index
Multiyear drought in
the Don Basin |
Southern Russia and Ukraine | 2007 – 2017
Fig. 1 Ground water levels at Kamennaya Step’ water balance station for 1900 – 2017 Ground water levels dropped by 3 m around 2007, reversing a significant positive trend that was established after 1950.
Source: Dzhamalov et al., 2017
Fig. 2: Standardized drought indexes (PDSI, SPEI_3 and SRI) at River Don – Belyavsky Station for 1960 – 2017 and 2000 – 2017 The main cause of drought was the extraordinary anomaly in precipitation (SPEI < -2.5, PDSI < -4) and major regional heat wave in 2010 with temperature anomalies by 4.5 – 6 °C in June – Aug.
Source: Kreibich et al., 202218
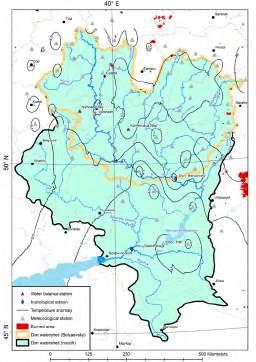
Map 1: Don Basin temperature anomaly The temperature anomaly for the Don basin from JuneAugust 2010 (reference period 1961 – 1991) and areas burned by wildfires.
Source: Dzhamalov et al., 2017
Fig. 3: Water deficit and annual runoff volume with different probability at River Don – Razdorskaya Station for 1930 – 2020 Cumulative volume of water deficit during 10 years of historical drought totaled as 43.7 km which is equal to doubled annual total runoff.
Data source: https://gmvo.skniivh.ru/
Basin characteristics
The Don River Basin is one of the most intensively developed regions of Russia, with a water usage coefficient of more than 0.41 at the river mouth. This region is an important agricultural area, where more than 20 % of Russian cereals are grown6 Water resources are crucial to the region’s economic well-being. As a result, the anthropogenic pressure on this basin is very high. For instance, in the Russian part of the basin, which occupies about 2.2 % of the country's territory, the area of agricultural land is 32.2 million hectares, representing nearly 15 % of all agricultural land in Russia1 It should also be noted that the total population living in the basin within the Russian Federation is about 12 million people, or 8 % of the total population of the country6 Additionally, the Lower Don is the largest cargo waterway connecting the Sea of Azov to the Black and Mediterranean Seas and through the Volga-Don Canal, to the Caspian Sea. On average, the volume of freight traffic on the Lower Don between 2001 and 2006 was 17.7 million tons2
Water resources
The runoff of the Don River has a decisive influence on the water influx into the Sea of Azov, the condition of the fish community and significantly affects the salinity levels. The total water deficit during the 2007 – 2017 drought event was approximately 43.7 km³, which is equivalent to twice the Don's annual runoff (see Fig. 3, above) For long-term and intra-annual flow regulation, numerous reservoirs and ponds have been created in the Don basin (917 reservoirs and 8 000 ponds with a total volume of 31.8 km³)3. The largest reservoir is Tsimlyanskoye, with a surface area of 2 702 km² and a volume of 23.86 km³. The reservoir was filled in 1952 and is the largest water body in southern Russia. The primary purpose of these regulations is to manage seasonal and multi-year flow for navigation in the Lower Don and the VolgaDon Channel.
Fig. 4: Water use sectors The main water consumers in the Don basin during last 2 decades are industry and irrigation and the total volume of water intake is around of 5.4 km3 per year. Updated from Dzhamalov et al., 20171
Data and drivers
The main drivers of the long-term multi-year drought event were anomalies in precipitation volume and duration, as well as a strong positive temperature anomaly, especially in 2010 when the average summer temperature exceeded the norm by more than 5 degrees. The drought indices shown in Figs. 2 and 3, left were calculated for the Don-Belyaevsky area, which has a catchment area of 204 000 km² (total area at the river's mouth: 422 000 km²)1 and are based on data from 52 meteorological stations5 (see Fig. 2, above). The values for temperature and precipitation were averaged over the area, and the reference period was defined as 1961 – 1991, in line with WMO recommendations from 2010. Groundwater level data from the "Kamennaya Step" water balance station were also used (see Fig. 3, above) The drought conditions were reflected in reductions in precipitation, soil moisture, river discharge and groundwater levels. As a result, the SPEI for Don-Belyaevsky fell below -2.5, and the PDSI dropped below -4 between 2007 and 2017 (see Fig. 2, above) Groundwater levels at the "Kamennaya Steppe" water balance station dropped by 3 metres (see Fig. 1, above). These anomalous conditions compounded the longterm trends of water regime transformation in the Don basin. The key characteristics of these changes include the redistribution of annual runoff, with winter runoff increasing and spring runoff decreasing (see Fig. 3, above)
Society:+56000 additional deaths (to 2009), long-term health consequences
Agriculture: 7 bln. $ decrease of total yield by 26 % (to 2009), lost crops on 13.3 mln. hectares (17 % of total), 25 000 households are affected
Transport:
2009), river passageway 15.8 mln. p. (-7 % to 2009), reduction of the navigation period by 30 – 150 days
Consequences
Totallossin2010 -2.2% gross domestic product, 15 bln. $
Lead Author: Maria Kireeva BioSense Institute, Novi Sad, Serbia
Contributors: Maksim Kharlamov Toloka, Belgrade, Serbia Natalia Frolova -
Tourism:1.2bln.$, air travels and cruise tourism, outdoor activities and festivals, local restaurants and hotels
Hydropowergeneration:
Fig. 5: Socio-Economic consequences of 2010 drought
Total loss of economy by 2010 drought in Russia, according to official estimations, news reports and independent and local assessments was about -2.2 % of gross domestic product.
Source: Case study authors based on13,14,15,16,17
The river system of the Don supports the reproduction of more than 60 % of the migratory and semi-migratory fish stocks of the Sea of Azov, as well as about 70 % of Don fish. Over the past decades, the landscape and hydrographic network of the Lower Don floodplain have changed due to economic activities and the filling of the Tsimlyansk reservoir in 1952. The likelihood of flooding has been altered by 30 – 35 %, with interruptions sometimes lasting up to nine years6 A strong connection between water levels and fish populations has been identified (see Fig. 6, below). In general, total fish biomass depends on river discharges in an inverse logarithmic relationship (see Fig. 7, below). During the 2007 – 2017 drought, the ecological conditions of the Lower Don shifted from mesotrophic to eutrophic status4,6. The concentration of cyanobacteria in the Tsimlyansk reservoir was so high that the surface occasionally turned completely green. Drought conditions deteriorated water quality and doubled the number of samples exceeding pollution safety levels, particularly in the Lipetsk and Belgorod regions3
In addition, according to local news reports, salty water has
Fig. 8: Crop yield anomaly of selected dry years. Crop yield anomaly deviating from linear trend in Central South (including Don Basin) region of Russia during severe droughts dropped by 14 – 45 %.
Source: Created from data in Strashnaya et al., 2010
Multi-year droughts are the most dangerous and cause the greatest damage in the Don Basin.
been moving upstream through the main Don riverbed and occasionally appeared in the tap water of cities like Azov and Rostov-on-Don16 During the 2007 – 2017 drought, the most severe period occurred in the summer of 2010. According to official statistics and calculated rates, the average number of additional deaths during this heatwave ranged from 20 % to more than 50 %, with 30 % in rural areas and 40 % in cities of the Don basin7,17 Regions with the highest rates typically experienced wildfires as well (see Fig. 10, below5). Unfortunately, forest management remains insufficient. Illegal logging, inadequate protective measures (such as firestop lines), the lack of equipped barbecue areas and limited reforestation efforts are the most critical issues.
Data on economic loss is mostly available at the scale of the entire river basin or the entire countries, as regional reporting is often unavailable. The main water-related sectors in the Don Basin are industry (including transport), irrigation, fishery and domestic water use, with a total water intake of 4.5 km³ 6 (see Fig. 4, opposite) Total economic loss from natural hazards in
Fig. 6: Population of bream fish and water level of Tsymlyansk reservoir for 2003 – 2015 The strong connection between population density (Number/1 net) of several species (bream fish for example) and water level in Tsymlyansk reservoir was obtained.
Source: Kireeva et al., 2018
Fig. 9 Hydropower production on Tsumlyansk reservoir
The amount of electricity in kW/h produced by Tsumlyansk HYPS dropped by 30 % in 2007 – 2010.
Source: Dzhamalov et al., 20171
2010 (in all Russia) was about 2.2 % of Russia's gross domestic product, approximately $15 billion (see Fig. 5, above) The largest economic losses from the 2010 historical heatwave were in agriculture, with a loss of $7 billion, as the crop yield anomaly was negative by about 43 % (the highest since 1981, see Fig. 8, above). The assessments of forestry losses range from $1 billion to $300 billion depending on the source and tourism lost $1.2 billion7 Drought affected the fishery industry and river cargo and passage transport. Populations of several fish species declined by 30 – 80 %, the navigation period on the Don in 2010 was reduced by 30 – 60 days2 and energy production at the Tsimlyansk hydroelectric power station decreased by 40 % (see Fig. 9, below) In response to these extreme conditions, the Russian government issued subsidies to farmers totalling approximately $5.5 billion12 (60 % as credit and 40 % as direct donations) and sought to encourage the insurance process. However, insurance companies deliberately slowed down or refused to sign contracts with farmers.
Fig. 7: Total biomass and river discharge at riv. Don – st. Kazanskaya for 2004 – 2015 Connection between total biomass and discharge was established for 2004 – 2015 and showed that in drought years biomass was so high that convert ecological status of the river to eutrophic.
Source: Kireeva et al., 2018
Fig. 10 Number of deaths and wildfires areas Increase in average number of deaths during main heat wave. During 5 Jul - 22 Aug 2010 there was an increase of about 20 - 50 % in deaths for the regions. 2010 was about 20 – 50 % for the regions located in Don basin (more than > 20 % in area). The area of wildfires varies from 15 to 20 000 ths. hectares.
Data source: Redrawn from https://www.hse.ru/17 Wildfires area from https://rosleshoz.gov.ru/rates/forest_fires/area
Severe droughts in South Asia | Sri Lanka, India, Afghanistan
| 2009, 2016, 2018
South Asia is increasingly vulnerable to droughts, with climate change exacerbating the frequency and intensity of these events. This trend has devastating consequences for the region, including reduced agricultural productivity, economic hardship, food insecurity and displacement of populations. Despite the growing threat, drought forecasting in South Asia remains inadequate due to limitations in data collection and analysis. This highlights the urgent need for improved monitoring systems and proactive measures to mitigate the impacts of droughts and build resilience in the region.
South Asia has faced several severe droughts in recent years, with the most significant impacts occurring in 2000, 2001, 2004, 2010, 2012 and 2016. These droughts caused widespread hardship for communities and extensive environmental damage, lasting for months in each instance.
The 2016 drought serves as a stark example of the devastating impact of these events, with both agricultural production and meteorological conditions severely affected. Maps 1 and 2 (right) effectively illustrate the extent of the 2016 drought.


Sri Lanka
Drought is a recurring natural disaster in Sri Lanka, severely impacting livelihoods, particularly in regions heavily reliant on agriculture. Over the past three decades, major droughts have occurred between 1983 and 2020, causing an estimated economic loss of around 45 million USD. More than 60 % of Sri Lanka's districts are susceptible to droughts, resulting in substantial agricultural production losses and adverse effects on the livelihoods of local populations. The recurring nature of droughts in these districts underscores the urgent need for improved water management strategies and effective mitigation measures to protect vulnerable communities and sustain agricultural productivity.
Map 5: Population exposed to drought in Sri Lanka (2001 – 2019) This illustrates the spatial distribution of drought-affected districts in Sri Lanka, along with population exposure during recorded drought years. The data show a progressive increase in drought severity from 2001 to 2019. Notably, Anuradhapura district (outlined) experienced population exposure exceeding 70 000 in seven out of the eight recorded years, emphasising it as the most drought-affected district in the country.
India
India has been already experiencing widespread droughts, with a particularly severe one occurring in 2016 in Southern India. The unprecedented drought was due to exceptionally low rainfall during both the summer and winter monsoons.
The scarcity of rainfall persisted, leading to the region's most severe drought in 150 years, as confirmed by researchers analysing historical rainfall data. This extreme drought, particularly affecting the Northeast monsoon, resulted in a deficit of over 45 % of the expected rainfall over the threeyear period from 2016 to 2018, causing significant hardship for the region.
In January 2017, the State of Karnataka (see Map 4, below) was severely impacted by a drought that affected over half of its cultivated land, covering 47 425 square kilometres out of a total cultivated area of 118 032 square kilometres.
The drought was particularly severe in the districts of Uttara Kannada, Udupi, Dakshina Kannada, Bidar Kodagu, Chikkamagaluru, Bangalore and Kolar. Records indicate that a total of 162 taluks across the state were severely affected by this drought.

Map 1: Meteorological drought index for South Asia (2016) Meteorological drought index using SPI for the 2016 drought event across South Asia.
Data source: https://dmsdemo.iwmi.org/

Map 2: Agricultural drought index for South Asia (2016) Quantifying the impact of agricultural drought for 2016 using Integrated Drought Severity Index (IDSI).
Data source: https://dmsdemo.iwmi.org/


Map 3: Exposure of agricultural land to drought in Karnataka, India (2017) Exposure of agricultural land at the district level during the 2017 drought in Karnataka, India.
Source: https://dmsdemo.iwmi.org/
Map 4 Agricultural drought in Karnataka, India (2016 – 2017) Monthly agriculture drought progression captured using Integrated Drought Severity Index (IDSI).

Data source: https://dmsdemo.iwmi.org/


Afghanistan
Afghanistan is among the world's most exposed countries to the impacts of the climate crisis, resulting in more frequent droughts in recent years than previously experienced. The 2018 drought directly affected more than two-thirds of Afghanistan1 impacting 22 out of the country's 34 provinces and approximately 10.5 million people impacted out of 17 million in those areas.

Many areas of South Asia are routinely confronted with severe, prolonged and diverse drought impacts, affecting millions of people and highlighting the critical urgency of multi-year, multi-country drought monitoring across the region.
Map 6, below illustrates the spatial distribution of drought mapped using the Integrated Drought Severity Index (IDSI) across Afghanistan in 2018, a year recognised as the most severe drought in a decade for the country. The severe drought, driven by reduced water availability, lack of snowfall and rising temperatures, caused widespread crop failures, leaving 13 million people in severe food insecurity. The provinces most affected are Badghis, Faryab, Kunduz, Sar-e-Pul, Balkh, Jawzjan and Herat.
Map 6: Agricultural drought in Afghanistan (2018) Drought severity mapped using IDSI in 2018 drought.
Source: https://dmsdemo.iwmi.org/
Fig 2, below presents an analysis of drought conditions between 2001 and 2019, categorised by the number of districts and provinces affected, ranging from extreme, severe and moderate drought to no drought. The analysis clearly indicates that 2001, 2011 and 2018 were the most severe drought years, with over 90 % of districts experiencing drought during these periods.
of
Fig. 1: Standardized Precipitation Index (SPI) in the Anuradhapura district, Sri Lanka.
Fig 2:
Lead Authors: Giriraj Amarnath International Water Mangement Institute (IWMI), Colombo, Sri Lanka Niranga Alahacoon International Water Mangement Institute (IWMI), Colombo, Sri Lanka Dhyey Bhatpuria International Water Management Institute (IWMI), New Delhi, India Alok Sikka International Water Management Institute (IWMI), New Delhi, India KV Rao Central Research Institute for Dryland Agriculture (CRIDA), Hyderabad, India
Droughts reduce staple crop production in Southeast Asia | Southeast Asia | 1970 – 2019
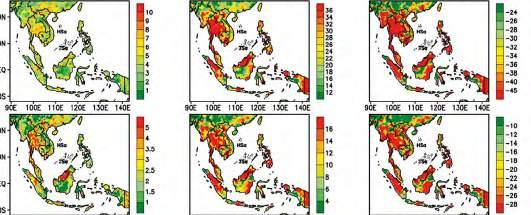

Precipitation-Evapotranspiration

Precipitation-Evapotranspiration Index (SPEI-1),
Standardized Precipitation-Evapotranspiration Index (SPEI-1),
Drought characteristics across different levels of intensity strongly vary across the SEA region, identified by the differences of drought features between the mainland and the Maritime Continent. Droughts in the mainland are more frequent and severe with a shorter duration than droughts in the Maritime Continent. In the last six decades, droughts have been more widespread and severe in the two decades of 1990 – 99 and 2010 – 19, which were associated with the strong El Niño events of 1997/98 and 2015/16. The variability of the drought frequency duration, severity and geographic extent across the SEA region reveals the complexity of the spatial distribution of drought in the most recent two decades.
Droughts have increased more substantially in the mainland than in the Maritime Continent. The increasing trend of drought was also significant over Sumatra Island. However, drought slightly decreased or remained unchanged in most parts of the Maritime Continent and some other areas, such as the northern part of Laos, the southern part of Vietnam and in the Philippines. The increasing (decreasing) drought trends were almost consistent with the decreasing (increasing) precipitation trends.
In the context of global warming, droughts are expected to increase in spatial extent, frequency and severity in many regions worldwide, including SEA. To cope with these changes, a solid understanding of the spatial and temporal variability and trend of drought over SEA is required.
The correlation between the drought index (SPEI) and the CIs and SST points to the ability of the drought forecasting and early warning systems for the area, especially when some of the large-scale climate drivers could be predicted in advance such as ENSO. Based on that, drought prediction models can be developed to forecast drought characteristics, which provide crucial information for various socioeconomic sectors, such as agriculture and water management
Fig. 1: Climatological drought characteristics over Southeast Asia Climatological drought characteristics over SEA (averaged over 1960 – 2019): a. DF Spells decade-1), b. DD Month decade-1) and c. DS Decade-1 for drought levels of 1. moderate, 2. severe and 3. extreme.
Source: Phan-Van et al., 2022
Fig. 2: SPEI Time series of annual rice and maize production per capita and SPEI between 1970 and 2019 for (a) 1-month time scale, (b) 6-month time scale and (c) 12-month time scale.
Historical analysis of the effects of drought on rice and maize yields in Southeast Asia
Considering climate variability and extremes in agricultural decision-making, contributes to enhancing regional climate resilience and ensuring sustainable food security in the face of global climate change.
The climatic conditions prevailing in the region are primarily tropical in the environment exhibiting elevated temperatures and humidity levels, alongside substantial seasonal precipitation patterns attributed to the monsoonal airflow. The prevailing environmental circumstances in this region are favourable for agriculture, albeit accompanied by challenges such as periodic flooding and sporadic drought. The relationship between agricultural productivity in Southeast Asia and the monsoonal cycles is intricately interconnected, as evidenced by the significant impact of fluctuations in the El Niño-Southern Oscillation on precipitation patterns and, consequently, crop yields.
Rice plays a pivotal role in the agricultural landscape of Southeast Asia, particularly in the Mekong and Red River deltas, which are globally renowned for their highly concentrated cultivation of this staple crop. In contrast, the cultivation of maize, although not as widespread as that of rice, assumes a pivotal role in regions where the climatic and soil conditions are less conducive to rice production. Maize cultivation serves as a vital means to ensure food security and functions as a lucrative cash crop.
The investigation of the relationship between climate and agricultural output in Southeast Asian countries is of great significance due to the pivotal role that agriculture plays in the region’s economies and cultures.
The analysis suggests a potential positive correlation between the two crops and the climatic factors encapsulated by the SPEI. Especially maize production is more vulnerable to fluctuations in climate conditions, as represented by the SPEI. Also, the temporal analysis of the SPEI and crop productivity from 1970 to 2019 illustrates a repetitive pattern for the entire time series. This suggests that the pattern of climate oscillations, such as the El Niño-Southern Oscillation (ENSO), dominates agricultural yields in Southeast Asia.
Fig. 3: Scheme illustrating the link between drought in the subregions of SEA and the largescale climate drivers Red (blue) indicates El Nino (La Niña), the warm (cold) phase of the PDO, the positive (negative) phase of the IOD, or their impacts. +/- (-/+) indicates increased/decreased (decreased/increased) drought. 0/0 indicates an unclear impact on drought.
Source: Phan-Van et al., 2022

A solid understanding of the spatial and temporal variability of droughts over SEA is required.


Fig. 4: Drought subregions. Four drought subregions of the SEA region classified using K-means with (top) the optimal cluster number determined by the silhouette width.
Source: Phan-Van et al., 2022
Fig. 5: Average rice and maize production. The average production per capita for countries in Southeast Asia during 1970 – 2019 for (a) rice and (b) maize.
Source: Phan-Van et al., 2022
Rice Maize
Summer flash droughts in the Yangtze River basin | China | 2022
Impact
During the 2022 summer drought, there was noticeably less water coming from the rivers. The water levels of the main stem of the Yangtze River and most lakes reached the lowest levels recorded for this period of the year. The water levels of Dongting Lake and Poyang Lake, the main lakes in the middle reaches of the Yangtze River basin, were 4.85 and 6.13 metres lower, respectively, than their historical averages. The surface extent of Dongting and Poyang lakes shrank by two-thirds. The drought affected about 830 000 people, damaged agricultural production, caused hardship for local residents, threatened ecological security, created electricity imbalances between supply and demand and increased the risk of forest fires. From July to November, hydropower generation at the Three Gorges Hydropower Dam decreased by 24 110 million kilowatt-hours (44.75 %) compared with normal conditions, with the largest decrease in September.
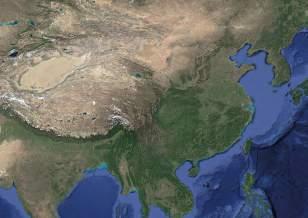
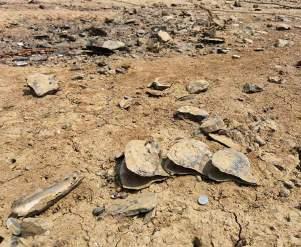
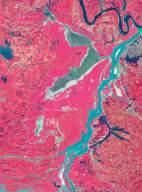
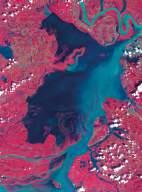
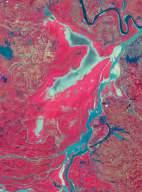
Characteristics
In the context of global warming, influenced by the persistent La Niña event, most of the Yangtze River basin in China has experienced persistently low precipitation and high temperatures since June 2022, resulting in a summer flash drought with a rapid decline in soil moisture and surface water levels. This was the most severe drought event in the region since complete meteorological records began in 1961.
Actions
The China Meteorological Administration has continuously monitored the development of the drought and issued drought warning information. At the early stage of the drought in August, the Ministry of Water Resources of China launched a Level IV emergency response for drought prevention, dispatching water resources from rivers and water conservation projects to mitigate the drought impact. Governments and administrative departments at all levels took various actions, such as releasing water resources from rivers and water conservation projects, giving priority to securing drinking water, making every effort secure water for agricultural irrigation, allocating funds from the central government’s reserve funds for drought relief, and exploring measures to promote late rice harvesting.
anomaly of daily precipitation from March to mid-September, 2022
Precipitation anomaly
Date
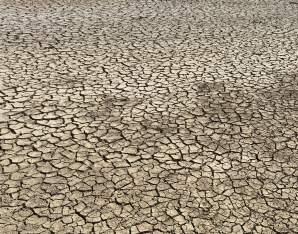

The rapid onset of flash drought in the Yangtze River basin during summer 2022 highlights the need for continuous monitoring and the ability to quickly deploy mitigation measures to secure water resources.
Map
Fig. 2: Accumulated anomaly of daily precipitation during summer flash drought. Precipitation anomaly in the middle and lower reaches of Yangtze River in August 2022, data from GPM satellite product.
Source: AIR-CAS.
Fig. 3: Drought impact. Dry lake bed exposed during 2022 summer flash drought. Source: Yuanbo Liu, NIGLAS-CAS.
Fig. 4: Poyang Lake. The submerged landscape of ancient Chinese architecturearchways, pavilions, terraces and towers - in the centre of Poyang Lake near Jiujiang City, Jiangxi Province, East China.
Source: HAIYAN - stock.adobe.com.
Fig. 2: Dongting Lake. The water surface of Dongting Lake shrunk dramatically during the 2022 summer drought, as detected by Chinese satellite GF-1. Source: AIR-CAS.
Fig. 1: Drought impacts at Poyang Lake. The water level of Poyang Lake was so low that the lake bed in the centre of the lake was exposed, seriously threatening aquatic life.
Photo taken on September 22, 2022.
Source: Yuanbo Liu, Nanjing Institute of Geography and Limnology, Chinese Academy of Sciences (NIGLAS-CAS).
Mountain snow to downstream water | Himalayas, Karakoram and the upper reaches of the wider Indus Basin | 2013 – 2024
The mountains of Asia are home to vast expanses of snow and ice, the source of some of the largest rivers on Earth. This area includes regions that receive the highest amount of annual rainfall globally and is still rarely associated with droughts. However, evidence exists of water deficit in a variety of contexts, with potentially dire consequences for immediate mountain as well as downstream livelihoods and ecosystems. Examples for high and low mountains, respectively, are snow droughts (in the Western Himalaya and Karakoram) and socioeconomic drivers of droughts (in agriculturally intensive mid-reaches of the Indus Basin).


Socioeconomic droughts
Socio-economic droughts occur when water supply does not meet demand, with a focus on shortages attributed to poor human decisions. This is common in small reservoir systems, where hydrological processes are strongly coupled with anthropogenic factors. Small reservoirs, vital for local communities, are often overlooked in large-scale studies despite their significant impact on regional and global hydrology1 In Pakistan, large reservoirs dominate the narrative, overshadowing the role of small reservoirs. As a result, the contribution of small reservoirs to socio-economic development and environmental evolution is less understood.
The Potohar Plateau in the Pakistan Punjab, covering over 5 % of Pakistan's cultivable land2 saw over 50 small reservoirs built in the past two decades for agricultural purposes. These lakes have evolved as multiuse systems facing conflicting stakeholder interests, leading to suboptimal operations.


Namal Dam (see Figs. 5 & 6, opposite) on the Potohar is an instructive example. Built in 1913, it irrigates 6 000 acres in the Mianwali district and has evolved to support a multitude of socio-economic activities, in addition to its primary objective of agricultural water storage. Competing upstream and downstream interests complicate dam operations, with fishing, farming and uncoordinated forestation also influencing water levels in contrasting ways. Adoption of simplistic and outdated heuristics by reservoir operators, compounded by political pressures by influential stakeholders, often leads to operational errors, exacerbated by climate change. The lack of a scienceinformed risk evaluation and early warning system leads to suboptimal (and sometimes disastrous) outcomes, including floods and droughts (see Figs. 1 & 2, below). Similar issues affect other small dams in the region.
Studying small reservoirs is challenging due to their number, remote locations and limited data3 There is a need to integrate rainfall patterns, agricultural practices, demographic changes, socio-economic development and operator biases in innovative decision support frameworks. Key challenges include monitoring small reservoirs with limited instrumentation, modifying hydrological models to capture human factors and understanding how natural and socio-economic processes still perpetuate water scarcity despite the presence of many small reservoirs in the region.
Snow droughts
Snow droughts occur when the amount of snow is well below the average for a certain period. This can be characterised relatively easily by the number of days per year a region is covered by snow, compared to preceding years (see Maps 1 & 2, left) More difficult to assess regionally is the amount of water contained in the snowpack, also known as snow water equivalent (SWE), a function of snow depth and density. The Western regions of High Mountain Asia (covering parts of Afghanistan, Pakistan and India) have been subject to considerable lack of snow cover between 2023 and 2024, shown here for the Badakhshan province in Afghanistan (ca. 1 million inhabitants) as well as the border regions between China, India and Pakistan of Ladakh and Baltistan (ca. 1.5 million inhabitants). These regions have seen a reduction in snow cover days by 8 to 16 days respectively, with some parts seeing snow cover days reduced by a whole month. The direct consequences include:
Despite being considered a wet region, the High Mountain Asia can experience water deficits (such as snow droughts and socioeconomic droughts), with implications for ecosystems and human livelihoods.
a. a lack of direct irrigation water in spring before and during the sowing season for mountain agriculture, threatening self-subsistence. This water insecurity has already driven a number of local initiatives for local water supply including solar powered pumps adjacent to rivers (see Fig. 4, below) and retention of water during cold periods as ice reservoirs for spring supply (so called ‘ice stupas’4
b. a lack of discharge in downstream regions of the Indus, where snow melt accounts for 30 to 60 % of total discharge5 potentially problematic for hydropower generation as well as agriculture;
c. a lack of water supply for rapidly growing urban environments in the region, with e.g. Skardu, a city at 2 200 m above sea level (a.s.l.) and more than 260 000 inhabitants, facing serious water scarcity;
d. early exposure of local flora to cold temperatures, causing potential damage; and e. increased exposure of permafrost, potentially accelerating its thaw, which in turn has resulted in local drying on the Tibetan Plateau, affecting food sources for pastoralists and shifts to their migration patterns6
Recommendations and adaptation strategies
Droughts in mountain regions are multifaceted. Comprehensive data on the issue are rare and scattered and, while anecdotal evidence of local challenges exist, these have so far not led to comprehensive adaptation strategies. An assessment of local experiences and knowledge with respect to mountain droughts is necessary to define issues, existing strategies and challenges and required assistance for local communities and governments. This would complement gaps with existing data from remote sensing or reanalysis products. This should also include projections of future developments, as temperatures, precipitation (including snowfall) and subsequently also soil moisture and groundwater are expected to change, with potentially complex effects for droughts. On the governance side, clear definitions of responsibilities need to be created, as the issues of droughts affect the ministries of Agriculture, Water, Environment, Energy and Infrastructure, while measures are sometimes best coordinated at the local and sometimes at the federal level.
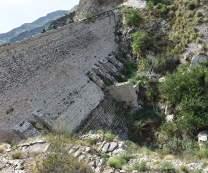
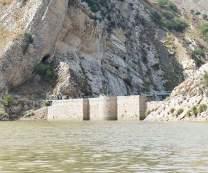
Figs.
Figs.
Figs. 5 and 6: Namal Dam. Left, upstream Dam and right, downstream view of the Namal Dam.
Source: Case study authors.
The Millennium Drought | Australia | 1996 – 2012
The Big Dry
The millennium drought spanned from the late 1990s to 2010. The drought mostly affected southeastern Australia, which experienced prolonged dry conditions beginning with a strong 1997 El Niño event. Dry periods continued, with 2001 and 2002 marking some of the driest and warmest years on record, extending drought conditions across the eastern regions of Australia. The dry conditions persisted despite occasional rainfall until 2005, without significant recovery. In 2006, southeastern Australia, for example, faced its second-driest year on record, profoundly affecting the major agricultural region of the Murray–Darling Basin, with rainfall 40 to 60 % below normal. This dry period stretched into 2007, despite initial forecasts of relief, leading to the driest conditions recorded for the region, although limited rainfall in mid-2007 gave some hope for drought breaking. The situation marginally improved in 2008 and 2009 with intermittent heavy rain, but these events were insufficient to break the drought. By late 2007 and 2008, Sydney's water levels improved significantly, yet other areas like Victoria remained critically dry. For example, Melbourne's consecutive years of below-average rainfall from 1997 to 2009 saw significant drop in water storage, from 97.5 % in 1996 to 33 % by 2010.
Economic impact
The economic impact of the millennium drought, particularly evident in the June quarter of 2003, was severe, with a 24.3 % drop in farm GDP, a 26.6 % decrease in rural exports and a 46.2 % reduction in agricultural income, resulting in about 70 000 – 100 000 job losses in agriculture. Tourism was also notably affected with, for example, the Murray River region seeing an estimated $70 million loss in tourism revenue in 2008. In total, one source (ABC) has estimated the aid bill for the Millennium Drought to be $AUD 4 billion. Another important factor is the co-association of drought and bushfires. For example, towards the conclusion of the millennium drought in 2009, we saw the tragic Black Saturday bushfires occurring across Victoria. These fires resulted in 174 deaths and over $AUD 900 000 in net damages.
Action
In response to the Millenium Drought, the Murray–Darling Basin Plan was established to reallocate water entitlements more equitably and ensure water availability for critical human needs, cultural needs and the environment. The plan also addresses long-term climate trends that have resulted in drier conditions and reduced water availability. A key instrument of the plan are the water buy backs. An example of a direct action to address water management was the introduction of Schedule H into the Murray-Darling Basin Agreement in 2011. This schedule was introduced to better address management of the Murray River system in future droughts while ensuring a conveyance allowance that can be drawn upon when human water needs are not being met in the Murray River System.
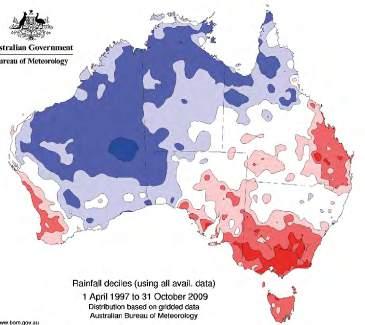
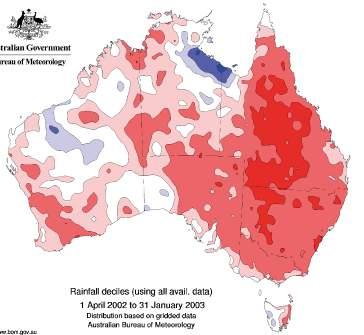
In Australia, an estimated 110 Mt of dust is eroded by wind storms each year (see Fig. 1, below) mostly originating from the arid and semi-arid rangelands. In 2009, the ‘Red Dawn’ dust storm swept across parts of inland South Australia, Victoria, New South Wales and Queensland (see Map 3, right) The dust plume grew to 3 450 km in length and is estimated to have ejected 2.5 million tonnes of sediment off Australia's east coast. Most of this topsoil ended up in the Pacific Ocean and some settled in New Zealand. This was Australia's largest loss of soil ever reported from a dust storm.
Lead Authors: Christa M. Pudmenzky and Roger C. Stone, University of Southern Queensland, Australia.

First Nations people
A key work titled "If the land's sick, we're sick:* The impact of prolonged drought on the social and emotional well-being of Aboriginal communities in rural New South Wales" by Rigby et al. 2011, identified three themes that describe the impact of the Millennium Drought on Aboriginal communities. These include 1. Impacts on Culture, 2. Socio-demographic and economic impacts and 3. Loss. The study recognises the importance of Aboriginal tradition and knowledge in looking after the lands, for example, in providing support to traditional custodians who care for Country in the ways they have known
Melbourne water
During the millennium drought, it was estimated that Melbourne could have run out of drinking water by 2009 had water saving measures not been taken. Storages such as Thomson Reservoir, which supplies 60 % of Melbourne's water, had dropped to 16 % by mid 2009. Overall, with measures in place, Melbourne's water supply dropped to around 25 % of capacity by mid 2009 during the decade long Millennium Drought. Key to managing the concerning water levels was reducing water demand through imposing water restrictions, advertising and subsidising local water storage such as rainwater tanks and water saving devices. Together, this resulted in almost halving per capita water use to around 150 L per day or an average overall saving of around 100 GL per year. Or about a 10th of the total capacity or almost half of the annual average inflow of Thomson Reservoir.
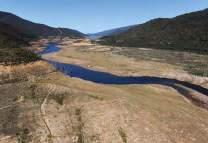
for millennia. Another key recommendation is appreciating the importance of Aboriginal art in all forms in caring for Country. Elders of Nations along Murray and Darling Rivers have watched on as the Murray and Darling rivers "die" due to the over extraction and mismanagement of water over decades. The dire state of rivers during the drought inspired the concept of "cultural flows" which was endorsed by the Murray Lower Darling Rivers Indigenous Nations alliance and the Northern Basin Aboriginal Nations as part of the Echuca Declaration 2007, which states water is to be allocated "of
sufficient quantity and quality to improve the spiritual, cultural, environmental, social and economic conditions". The MurrayDarling Basin Plan specifically recognises cultural water and is funding a water investment programme aimed at assisting First Nations communities in planning and implementing cultural and economic entitlements. However, there are still significant hurdles to empowering Aboriginal people to assess cultural water and incorporating Indigenous knowledge in managing future droughts3
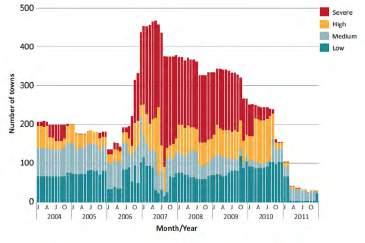
Dust storms in Australia
Drought risks and impacts can compound across sectors and systems to create cascading impacts.
Co-ordinating
Drought in the ocean: the case of Small Island Developing States | Caribbean Sea and Indian Ocean | 1950 – 2024
Islands are tightly coupled socio-environmental systems and must be considered through a systems lens. Small island developing states (SIDS) face challenges related to climate change (e.g. sea level rise, saltwater intrusion and erosion) and economic resilience (e.g. reliance on imports and sectors like tourism). Traditional climate solutions are highly resource intensive in terms of water, energy and materials, all of which are of limited availability for SIDS. These solutions frequently respond to symptoms rather than core problems, accumulating greater risk in the long term. Drought impacts are explored here within this context by considering two contrasting SIDS, Grenada and Maldives.

South China Sea (AIMS)9
Source: Lovell Johns.

Drivers and Pressures
Despite abundant freshwater sources, Grenada faces significant challenges in its water sector7 Global climate variability threatens Grenada by changing the length and intensity of its dry and wet seasons. Arid conditions substantially reduce surface and ground water stocks, while erratic precipitation increases surface water runoff and groundwater contamination1,2 Overall, both effects create a decreased water supply on the island. Rapid urbanisation, economic and industrial activities and especially tourism are major contributors to excessive water demand. Centralised infrastructure that is vulnerable to shocks from extreme events adds to the conundrum. This disparity between water availability and demand, both in terms of quantity and quality and in combination with a vulnerable and centralised water infrastructure and its governance, exacerbates Grenada’s social drought risk – together they heighten the "sociometabolic risk"8 to this small Caribbean nation’s water system amid ongoing climate changes.
Impacts
Grenada’s current water situation is characterised by cascading impacts that magnify socio-metabolic risk over time. Climate variability causes erratic precipitation and saltwater intrusion from coastal inundation, increasing surface water runoff and contamination of groundwater sources1,2 This affects water quality, raising turbidity and necessitating extra treatment, which then causes supply delays and interruptions. Excessive rainfall and flash flooding can damage infrastructure, reducing its quality and lifespan and requiring (already scarce) financial resources for maintenance and repair, thus raising water production costs. Unpredictable rainfall and water supply can lead farmers to maladaptive practices like overusing agrochemicals and increasing fertiliser and chemical concentrations in the environment3 which can negatively impact watersheds and water quality, ultimately reducing overall water availability. These interrelated factors impact health and augment social drought and water security issues4
Actions
The island's government has begun the "G-crews" project aimed at improving water governance, infrastructure and freshwater storage capacity5 While the project focuses on building rainwater and desalination plants, reservoirs and better infrastructure, complementary measures are necessary. Encouraging systemic approaches, such as nature-based solutions and decentralised water systems, as opposed to short-term symptomatic solutions, is crucial. For example, residential rainwater harvesting could reduce reliance on the central water supply. Urban green spaces provide environmental benefits and can serve as natural freshwater sponges to dilute aquifer salinity, which affects parts of the island6 Additionally, providing innovative financing for retrofitting homes and businesses, rebate schemes and progressive water pricing implementation can be leveraged to foster climate resilience within Grenada’s water sector.
2: Systematic and cascading impacts. Diagram showing the systematic and cascading impacts associated with water availability in Grenada.
The Republic of Maldives comprises of 1 192 coral islands in the Indian Ocean spread over an area of 90 000 km2 of which only 1 % (~300 km2 is land. With over 0.5 M inhabitants in 2024, Maldives is not only one of the world's most densely populated countries, but also the flattest and lowest, with an average elevation of just 1.5 metres above sea level20
Source: Lovell Johns.

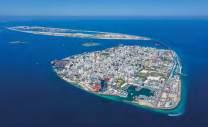
Lead Author (Maldives): Aisha Azfa University of
Small islands represent tightly coupled socio-ecological systems, making them especially vulnerable to adverse cascading impacts of drought. Systemic solutions are needed to reduce “socio-metabolic risks”, which originate from a significant divergence of critical resources from local sources, the integrity of material circulation, and the (in)equitable distribution of derived products and services.
Responses
Maldives is facing significant water shortages and drought issues, exacerbated by climate change. Due to its unique geography, the only freshwater sources available in the Maldives are rainwater and groundwater in shallow aquifers. Rainwater collection is hampered by erratic and reduced rainfall, while groundwater is limited and is often contaminated through saltwater intrusion and introduction of pollutants from anthropogenic activities. Consequently, there has been increased reliance on desalinated and bottled water.
Desalination, while effective, is costly and energy intensive, while plastic water bottles overwhelm the waste management systems of most islands. At the same time, water demand is rising steeply, with the population increasing nearly sixfold since 196013 and with ~1.3 M tourists visiting the coral nation each year. Inadequate infrastructure and budget, lack of technical staff and growing reliance on rainwater and desalination, which are both susceptible to climatic and technical disruptions, exacerbate water scarcity.
Impacts
Water scarcity and drought impacts are felt differently in urban and rural areas of the Maldives. In the Greater Malé Region, where over a third of the population resides, most households rely almost exclusively on piped desalinated water, putting them at risk of water disruptions in the event of technological failure. This was demonstrated by the December 2014 water crisis. In the atolls, rainwater harvesting capacities differ, putting communities at risk during extended dry periods. Between 2017 and 2020, 59 islands required emergency water supplies that were dispatched by the central government in tankers14 Women are disproportionately burdened by these crises, as they are primarily responsible for collecting water, cooking and cleaning and caring for those who fall sick due to water-borne diseases. Vulnerable populations in the atolls frequently report skin diseases and irritation, as well as intestinal diseases, which are more pronounced in children15
In response to increasing water stress, there has been a significant shift towards bottled water consumption in the Maldives over the past two decades. As confidence in the supply and safety of rainwater decreases, bottled water has become the primary drinking water source for nearly a third of the population, despite its high cost. This has cascaded in an increase in plastic waste, exacerbating groundwater contamination, particularly in atolls where waste collection and recycling infrastructure is inadequate. In addition to bottled water, many residents in the atolls use alternative methods to purify water, such as chlorination, boiling, filtration, or solar disinfection16 From 2017 to 2024, the Ministry of Environment, with substantial financial backing from the Green Climate Fund (GCF), implemented a US$ 25 million initiative titled "Supporting Vulnerable Communities in Maldives to Manage Climate Change-Induced Water Shortages."17 The project's objective was to assist 105 000 residents on the outer islands of the Maldives who face water security challenges due to climate change. It focused on enhancing the integrated water supply system, decentralising water supply during the dry season and improving groundwater quality. According to the interim evaluation report, the project was only “moderately satisfactory”.18 In addition, the Maldives recently collaborated with China to inaugurate five seawater desalination plants, powered by renewable energy sources such as solar and wind. This US$ 12 million project established desalination facilities on the islands of Alifushi, Olhuvelifushi, Kelaa, Dhaandhoo and Kaashidhoo. Each plant has the capacity to produce up to 200 tonnes of fresh water daily, serving approximately 2 000 people per island. The facilities are equipped with 200 kW solar panels and the plant on Kaashidhoo includes a 100 kW wind turbine, further enhancing the sustainability of the water production process19 The cascading challenges posed by symptomatic fixes such as use of bottled water and desalination highlight the ways that short-term solutions only exacerbate the probability of future and greater risks. Instead, systemic solutions that address root causes must be prioritised to mitigate socio-metabolic risks8
Grenada
Maldives
Drivers and Pressures
Map 1: Small island developing states (SIDS). Thirty-nine states and 18 dependent territories are classified as small island developing states (SIDS). SIDS can be grouped by region: the Caribbean; the Pacific; and the Africa, Indian Ocean, Mediterranean and
Fig.
Fig.
Fig. 5: Aerial view of land cover changes.
(top)
(below)
Fig.
Rising temperatures and reduced precipitation | Caribbean Sea | 2013 – 2016
Precipitation deficits related to the El Niño-Southern Oscillation and temperature-driven increases in evaporative demand have contributed to worsening drought since the 1950s.
Characteristics and impacts
Seven of the world’s 36 most water-stressed countries are in the Caribbean, with islands such as Barbados, Antigua and Barbuda, and St. Kitts and Nevis having less than 1 000 m3 of freshwater resources per capita and deemed waterscarce. Until relatively recently, drought was not a hazard that most authorities in the Caribbean region considered a major risk beyond seasonal impacts on agriculture. Even within apparently non-water-scarce islands, local communities and cities are now experiencing chronic shortages, especially with drought-related water deficits during key periods of demand, such as the tourism season and crop growing season (see Fig. 1, below) Since 1950, the Caribbean has experienced several significant droughts including multi-year events in 1976 – 77, 1986 – 1987, 1997 – 1998, 2009 – 2010, 2013 – 2016 (see Maps 1, below and 2a – c, opposite) and 2019 – 2020. Variability within the dry and wet seasons often results from multi-scale interactions across the weather to climate continuum. These interactions result from the gradient between Atlantic and Pacific sea-surface temperatures including El Niño-Southern Oscillation (ENSO)-related impacts, the North Atlantic Oscillation and North Atlantic high-pressure decadal fluctuations, the Madden Julian oscillation (MJO), and the Caribbean low-level jet. The years 2019 and 2020 further illustrated that not all droughts in the Caribbean are region-wide or are associated with strong ENSO signals alone. In 2019, significant impacts from drought occurred in Belize and Jamaica in the west as well as the southern portion of the eastern Caribbean island chain. The onset of the wet season in 2019, though late or slow to develop in these countries, signaled relief from drought impacts in these areas. However, lower-than-normal-rainfall in the wet season in countries like Barbados and Trinidad and Tobago meant that impacts again increased and spilled over to 2020. As the wet season subsided towards the end of 2019, Barbados had completed a 24-month period with below normal rainfall, with record low rainfall in 2019. This rainfall deficit in turn resulted in critical depletion of the island’s underground aquifers.
Collaborative decision making
In recognition of the increasing cascading and compounding multi-sectoral impacts of drought in the region, the Caribbean Institute for Meteorology and Hydrology has pursued formal agreements across several key public, private and nongovernmental regional institutions responsible for a range of climate-sensitive sectors for collaboration in the development and integration of climate services in sectoral decision making. Fully established in 2017, the Consortium of Sectoral Early Warning Information Systems across Climate Timescales (EWISACTs) Coordination Partners is a multi-agency group that co-develop and co-deliver user-specific and actionable drought information products and services. As part of this effort, the Caribbean Regional Climate Centre in collaboration with sectoral experts routinely prepares climate bulletins tailored to three of the climate-sensitive sectors it currently engages: agriculture, health and tourism. The Caribbean Agro-Climatic, Health Climatic, and Tourism Climatic Bulletins (see Fig. 2, right) developed with regional sectors and donor partners include information on drought with messages aligned with sectoral decision making. Examples of such initiatives include the Investment Plan for the Caribbean Regional Track of the Pilot Program for Climate Resilience (PPCR) and the Programme for Implementing the Global Framework for Climate Services (GFCS) at Regional and National Scales. Specific national training or drought assessment and risk management have been provided for National Meteorological and Hydrological Services and partners in St. Lucia, St. Vincent and the Grenadines, Grenada, Jamaica, Haiti, and Dominica.


Actions
Future needs
Caribbean communities have clearly identified water availability and scarcity as the major issue of concern even when tropical storms are included in the list. Climate change predictions for the region indicate that the frequency and intensity of drought will increase in the future (see Fig. 3, below)
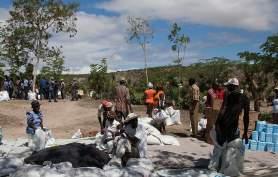


As a result, addressing drought represents a critical aspect of the region’s economic and environmental sustainability. The 2009 – 2010 event, with exceptional impacts across the region, was a focusing event, challenging regional decisionmakers to give stronger consideration to drought. Since then, the Caribbean Drought and Precipitation Monitoring Network - a regional operational network of national hydrological and meteorological services (NMHSs) coordinated by the Caribbean Institute for Meteorology and Hydrology (CIMH) - has been routinely providing a suite of technical drought early warning (monitoring and forecasting) tools and products geared towards multi-sectoral decision-support. The 2014 – 2016 event, the most severe and extensive period of dry conditions in the Caribbean and Central America since 1950, illustrated that the region was better prepared, having improved early warning information and capacity since 2010.
Significant progress since 2009 – 2010 has been made through a range of climate services initiatives. At the national level, priorities outlining needs for water resources management and drought planning have been developed but with limited plans for implementing drought management. More work needs to be done at community, national and regional levels in areas such as: 1. the development and implementation of drought policy and plans linked to water resources, 2. forecasting, early warning and integrative decisionsupport systems and 3. stakeholder engagement in the development and use of integrated drought information for risk reduction.
Fig.
Fig.
Fig.
Urban drought impacts in Barcelona | Spain, Europe | 2021 – 2024
Characteristics
Barcelona and the surrounding areas, home to 5 million people, are located in the Catalan River Basin District. This region, characterised by a Mediterranean climate, faces water scarcity and periodic droughts. The main sources of urban water supply are the Llobregat and Ter Rivers, which have five reservoirs.
Catalonia has been experiencing an unprecedented and persistent drought over the past 40 months, with every season being extremely dry. Notably, the typical autumn rainfall was almost entirely absent. The spring of 2024 marked the first season with normal rainfall during this period.
A Drought Management Plan was debated and approved in 2020, defining three drought severity levels. Detailed water use limitations were established for all sectors, while allowing the most efficient users to request individual allowances. It has been the main management tool during the drought, although some minor amendments have been made to relax a few of the toughest restrictions in the last stage of the drought.
A key strategy in managing the drought has been the mobilisation of alternative resources, thereby conserving water in the reservoirs.


During 2021, 2022 and 2023, rainfall deficits exceeded 50 %, an unprecedented occurrence in a 100-year record. Additionally, temperatures reached new maximum records in 2022 and 2023.
Map 1: Reservoirs of the Ter-Llobregat System. Map of the Ter-Llobregat water supply system which provides Barcelona with drinking water.
Source: Catalan Water Agency.

4: Seawater Desalination Plant, Llobregat. Barcelona-Llobregat Desalination plant is one of the largest seawater desalination plants in Europe producing potable water from seawater of Mediterranean Sea, with maximum capacity of
Aigües Ter Llobregat.
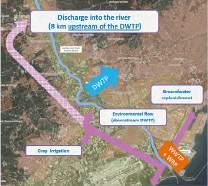
5: Water
Indirect potable reuse in Barcelona
The Drought Plan incorporated the use of reclaimed water to supplement the flow of the Llobregat River, a primary water source for Barcelona. This initiative was intended as a 'safety net' and was tested in 2019. Due to the severe drought conditions, it has been in continuous operation since December 2022.
What if mitigation actions had not been taken?
After three years of severe drought, the total amount of water in the reservoirs dropped below the critical threshold of 100 hm3, leading to an emergency declaration. However, urban water shortages have been avoided so far.
Without any drought measures, the reservoirs would have become completely depleted by the summer of 2023.
The contribution of alternative sources (desalinated water and potable reuse) was crucial, but the restrictions outlined in the Drought Plan also played a significant role. Without these limitations, total depletion would have occurred at the beginning of 2024.
The drought management plan, with its clearly defined and structured actions and responsibilities, played a crucial role in mitigating the severity of the impacts on communities, ecosystems and economies, while also preventing major conflicts over water allocations.
Fig. 1: Sau Reservoir, September 2021 (left) and March 2024 (right). River flows dropped to their lowest levels in 68 years and reservoirs steadily declined. The church in Sau Reservoir, typically submerged, became an iconic symbol of the drought.
Source: Catalan Water Agency.
Fig.
Fig.
Fig.
Fig.
Fig.
Urban drought impacts in Guayaquil | Ecuador, South America | 2023-2024
The influence of climate and El Niño on droughts in Ecuador Ecuador, due to its location and geomorphological features, is exposed to considerable climate variability, which contributes to the occurrence of droughts. In particular, the country is influenced by two main meteorological regimes: the Pacific Regime, which is connected with fluctuations of El Niño phenomenon and produces a summer dry season and the Eastern Regime, which results in a less intense rainy period between the months of November and February. The precipitation regimes are influenced by the Amazon and Andean slopes1
Between November 2023 and May 2024, Ecuador faced one of the most extreme droughts in six decades in the Southern Andes region, particularly affecting the Paute River basin. During the drought, this basin, which provides the water source of multiple crucial hydroelectric power plants, witnessed a drastic decline in water flow from an average of 120 cubic metres per second to a mere five2
Reservoirs, urban power supply and drought in Ecuador
This unprecedented drought severely affected hydroelectric production and triggered a nationwide energy rationing program which in turn led to disruptions in various essential services across the country.
Over the past two decades, Ecuador significantly increased its hydroelectric capacity through the construction of several key reservoirs. Currently, 90 % of the country’s energy demand is covered by hydroelectric power1. Ecuador's new reliance on hydroelectric power makes it particularly vulnerable to negative impacts from drought. Reduced water flow in rivers can significantly decrease the capacity for hydroelectric power generation, forcing the implementation of energy rationing measures. However, impacts of droughts extend beyond water availability and ecological health.
The 2023 – 2024 drought severely affected the Mazar dam, the biggest of the country which supplies three main hydroelectric plants for a total production of 657 megawatts.
During the drought period, the Mazar reservoir registered an operational storage level of 0 %, causing nationwide blackouts affecting most cities in Ecuador. This scenario presents a clear example of systemic risk where the Mazar hydroelectric plant, located more than 220 km away in a completely different climatic context, can affect the urban systems of a city like Guayaquil (see Map 1, above)
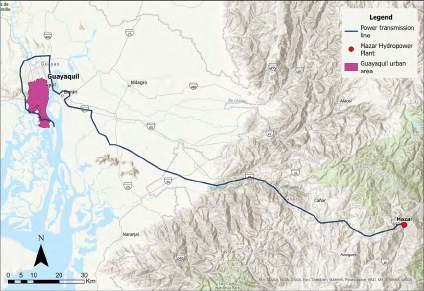
The multi-faceted impacts of the drought in Guayaquil
With a population exceeding 2.6 million, Guayaquil is the biggest city in Ecuador and faced a significant challenge during the 2023 – 2024 drought. This extreme drought resulted in multiple impacts in the city, especially on its water infrastructure, revealing a series of vulnerabilities which also determined a number of consequential cascading impacts.
The most immediate impact was felt in the energy sector. Reduced water levels in the critical Mazar reservoir significantly reduced hydropower generation, a primary source of electricity for Guayaquil This precarious situation resulted in a total energy deficit of 1 000 Megawatts within the Ecuadorian electricity system, plunging parts of Guayaquil into darkness.
The power outages triggered a domino effect, causing substantial economic losses. Businesses across the city were forced to reduce their opening times and acquired power generators. The Guayaquil Chamber of Commerce (CCG) estimated a staggering $ 20.6 million in lost sales per hour due to the power cuts. These disruptions extended beyond businesses, significantly impacting the daily lives of Guayaquil's residents. Schools were forced to close, hindering education and childcare. Traffic congestion worsened as power outages disrupted traffic signals, creating gridlock on major roads.
One notable impact of the power rationing on urban systems in Guayaquil was the disruption of drinking water access. In fact, this occurred not because of scarcity of water resources per se, but because of the interruption of power supply to water pumping stations. These disruptions hindered daily activities, impacting personal hygiene, food preparation, sanitation and household cleaning, causing significant disruptions particularly in high-altitude areas that rely on these stations for their water supply. Even after electricity was restored, some areas of the city experienced delays in distribution systems, leading to public discontent. Additionally, the impact of the drought extended beyond Guayaquil's city limits. Ecuadorian exporters estimated losses of around $ 400 million due to power outages, highlighting the ripple effect felt across the entire nation.

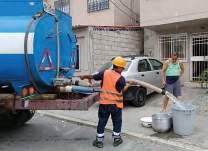

Lessons learnt for drought risk management
The recent drought has made evident Ecuador's vulnerability to water shortages. This underscores the urgent need for a robust and multi-pronged approach to drought risk management. In particular, a strengthened drought monitoring (including precipitation, soil moisture and reservoir levels) and early warning systems would allow for proactive measures to be taken before droughts reach critical stages. Additionally, an integrated water resource management approach could help monitoring and regulating water usage across sectors (agriculture, industry, domestic). Recent impacts also highlight the need to prioritise investments in infrastructure; particular attention should be paid to critical infrastructure like hydroelectric plants, ensuring they operate with optimal water usage during drought periods.
The diversification of energy sources could decrease Ecuador's heavy reliance on hydropower. Diversifying the energy mix through investments in renewable energy sources such as solar and wind power can significantly reduce drought risks on the energy sector for the country.
Implementing comprehensive drought response plans at both local and national levels is essential. These plans should outline clear actions and responsibilities for government agencies, water management entities and citizens in the event of a drought. Effective communication and public awareness campaigns are crucial for ensuring coordinated and effective responses to drought events.
shows how a drought occurring more than 200 km away can have cascading effects on the multiple systems cities depend on, including health, education, basic services and productive activities.
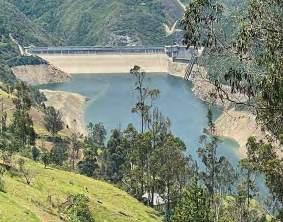
Guayaquil
Map 1: Influence of El Niño in Ecuador. Effects of extreme El Niño events on precipitation patterns for hydrological basins in Ecuador, calculated from mean annual (Year 2) SPDI during the 1983 and 1998 extreme events. Adapted from Thielen et al. 20233
Map 2: Geographic location of the city of Guayaquil (A) and the Mazar hydroelectric plant (B).
Fig. 1: Traffic congestion due to power outage. Traffic lights without electricity on Rumichaca Street, in downtown Guayaquil, on Sep 29, 2024.
Source: Fanny Carolina Moreira Head of the department of Post Disaster Recovery from SEGURA EP Guayaquil.
Fig. 2: Water deliveries. Power outages disrupt water pumping stations, leading to water shortages in the city. Vulnerable areas are receiving water deliveries by tanker trucks.
Source: Photo by Fernando Luzzaraga, Environmental and Technical Audits Supervisor at Guayaquil Municipal Water and Sewerage Company EMPAG 2024.
Fig. 3: Power generators. Businesses in the city centre are using power generators to serve their customers.
Source: Courtesy of Miriam Obregon CEO Department Social Fabric from SEGURA EP Guayaquil.
Fig 4: Hydroelectric plant at Mazar reservoir, April 2024.
Source: Courtesy of Silvia Naranjo, Head of the department Disaster Risk Reduction Azogues Municipality 20/09/2024.
Day Zero | Cape Town, South Africa and Chennai, India | 2018 and 2019
The looming Day Zero of Cape Town In the city of Cape Town in South Africa, its ~4 million inhabitants are dependent on surface water for their water resources. Over 95 % of this water comes from a system of six large dams (see Map 1, right) which provides water for Cape Town (58 %), other towns (6 %) and agriculture (26 %; the remaining 10 % evaporates)1 In 2014 these reservoirs were at full capacity, which is enough to supply water for ~1.5 years. However, starting from 2015 a drought persisting 3 years started with rainfall amounts about 50 % – 75 % below the long-term average. Particularly 2017 was a dry year, breaking many rainfall records in its recorded history (since 1880s)2 As a result, reservoir levels dropped dramatically to about 20 % of their overall capacity Water levels in the largest reservoir –Theewaterskloof – hit a low of 10.4 % in April 20182 When a dam reaches 10 % of its capacity, it is considered to be practically empty, as this last water is very difficult to access. When overall reservoir capacity would reach 13.5 % piped water in Cape Town would be shut off and people would need to go to designated points to pick up daily rations of water (25 litres per person). This moment when no water would come from the tap is called Day Zero. In the end Cape Town narrowly avoided Day Zero by buying enough time through extensive water savings until the rainfall in April – June 2018 replenished the reservoirs again.
The response of Cape Town
When the drought was evolving over 2015 and 2016, reservoir levels were not dangerously low yet. However, some restrictions were already introduced (e.g. limiting car washing, gardening) in anticipation of a possible poor rainy season in 2017. The 2017 rainy season turned out to be record low and Cape Town realised that there was not enough water in the reservoirs to last until the next rainy season in 20182
A shortage in water resources can be approached from two sides: supply and demand. There were little options on the supply side due to the strong reliability on surface water of the system. Developing infrastructure for largescale groundwater extraction, large-scale water re-use, or implementing desalinisation was simply not possible on such a short timescale1 Opposing political parties at the national and regional level also limited resources mobilisation and government effectiveness2 Cape Town focused on reducing demand in an effort to manage the crisis. This was done through four types of measures: i) increased tariffs, ii) usage restrictions, iii) reducing water pressure and iv) information campaigns. This resulted in a staggering 50 % decrease in water usage over 3 years, from
Lessons on socio-economic inequalities
The large reduction in demand is generally attributed to reductions by high- and middle-income households, which historically were the highest water users. A large saving came from stopping outdoor water use (the peaks in Fig. 2, right) and at the height of the drought in early 2018 water use was quite equal among households in freestanding homes, around the 350 litres/ day per household that is considered the ‘lifeline’ amount4 Nevertheless, the drought was experienced markedly different between socio-economic groups. Notably, informal dwellers (not connected to piped water) live under chronic water shortage, where ‘every day is a Day Zero’5 In contrast, upper- and middle-class households were able to adopt coping strategies such as rainwater tanks, efficient appliances, bottled water and drilling wells for groundwater, to supplement their tap water5 Moreover, wealthier households may be smaller, meaning less water is needed per household. This also resulted in disparities with water use restrictions, as these were set per residential unit (350 litres per unit), based on 6 – 7 people. However in townships multiple households (8 – 15 people) in one stand share facilities, such as water taps,
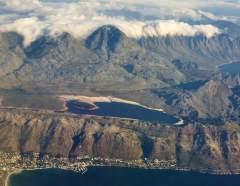
The actual Day Zero of Chennai
Chennai is located in the south-east of India and on paper is not a dry city having an average annual precipitation of about 1 400 mm. In this region, the Northeast Monsoon (NEM, during October – December) is critical for water availability as it brings about 60 % of annual rainfall and precedes a dry period from Jan-May1 To overcome this, water is stored in four main reservoirs, supplying 60 % of the city’s requirements2 Moreover, groundwater is extracted a lot for domestic and industrial use in Chennai.
Over the year 2016 – 2018, the 3-year accumulated NEM rainfall was the lowest in 150 years3 (see Fig. 4, right) 2018 was particularly dry, leading to reservoirs depleting completely (see Map 2, below) Groundwater levels dropped, resulting in household groundwater wells running dry2 On the 19th of June 2019 Day Zero was declared and water stopped coming from the taps of the municipal network.
As a result, many people become even more reliant on water imported from elsewhere through emergency trains and private water tankards bringing water in from outside the city (see Fig. 5, right). Prices of such tankards (which were already ~50 % more expensive than municipal water) tripled in price over the course of a few months4. Overall, the story of Chennai is about urban and water management, making the growing city susceptible to water scarcity and droughts.
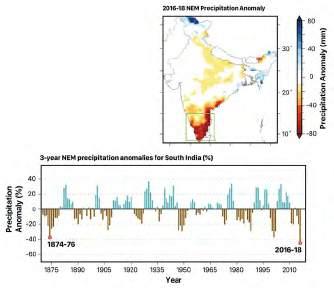
on average 183 litres per person per day to on average 84 litres per person per day (see Fig. 2, right)3
Whilst measures always came in packages, it stands out that information campaigns seemingly had a large impact
(see Fig. 2, right) A campaign in February 2017 publishing the top 100 water users accompanied by sending them letters threatening the installation of water restriction devices significantly reduced water usage. A considerable effect was also seen in October 2018 after the announcement of a Disaster Plan which garnered a lot of media attention. The largest reduction was seen in January 2018 when the possibility of reaching Day Zero in April was announced and a reduction in water pressure was implemented and a Water Map was published showing which households complied to the restrictions and which didn’t. Tariffs seem to have had less of an impact as high income households indicated that they were more motivated by social pressure and civic duty3 Overall, open data publication, along with a relentless campaign raising the alarm and giving residents responsibility to avert crisis, had a big impact.
meaning they were actually restricted to less water per person than intended5. On top of this, poorer households were much more impacted by tariff increases, even up to 15 % – 20 % of their income4 The drought and corresponding measures may thus have exacerbated existing inequalities. This persists after the drought as the wealthiest households enhanced their resilience due to the investments in (permanent) measures they had taken (e.g. wells and tanks) whilst poorer households remain in water scarce situations and may actually be worse off6 (see Fig. 3, right)
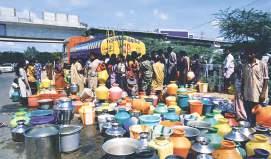
A cocktail of drivers
A large variety of factors determined the Day Zero in Chennai. The city has always had a large amount of lakes and reservoirs to store the monsoonal rainfall water. However, many lakes have disappeared over time, such as the famous ‘Long Tank’ (see Fig. 6, right) a huge reservoir which was drained and developed into what is now known as Theyagaroya Nagar neighborhood in the 1920s5 But also in more recent decades reservoirs, lakes and wetlands have been encroached by urban development. In addition, the capacity of the reservoirs (with the last one, at the time, being build in 1944) decreased over time due to poor siltation maintenance6 This is in a city with a growing population and thus high water demand.
There are also many groundwater wells, either for private residents, industry, or private tankard companies that supply water year-round to residents not connected to the municipal network. However, the overall rate of extraction is approximately 1.3 times more than it is replenished due to rainfall7 resulting in falling groundwater levels, particularly during drought.
In order to combat falling groundwater levels, the state of Tamil Nadu introduced in 2001 legislation that required new buildings form 2003 onwards to have rainwater harvesting structures in place8 Through them, water is either stored for use on the surface, or infiltrated into the ground to replenish groundwater resources. Whilst this policy has resulted in many new rainwater harvesting structures, its implementation has also been hampered by non-compliance, with many buildings still not having rainwater harvesting systems or insufficient ones (e.g. due to poor maintenance or design) in 20199

The threat of not being able to supply tap water (Day Zero) has been a reality for various cities.
Fig. 1: Steenbras reservoir, Cape Town. View of Steenbras reservoir, one of six main reservoirs around Cape Town.
Map 1: Cape Town's 6 dams. Map showing the location of the six main reservoirs around Cape Town.
Source: Lovell Johns.
Map 2: Red Hills Lake, 2018 and 2019. Satellite imagery of one of the four main reservoirs of Chennai (Red Hills Lake), contrasting June 2019 when it was empty, with June 2018. Source: Copernicus imagery.
Fig. 4: Monsoon precipitation anomaly. North-eastern Monsoon precipitation anomaly, showing the extent and exceptionality (worst in 150 years) of the 2016 – 2018 drought in South India. Adapted from Mishra et al., 20193
Fig. 6: The Mylapur Tank or Long Tank. Map of the presidency
Fig. 5: People filling water from tankards. People filling water from tankards in Chennai, India.
Source: Alamy Stock Photo, V. Muthuraman. Fig.
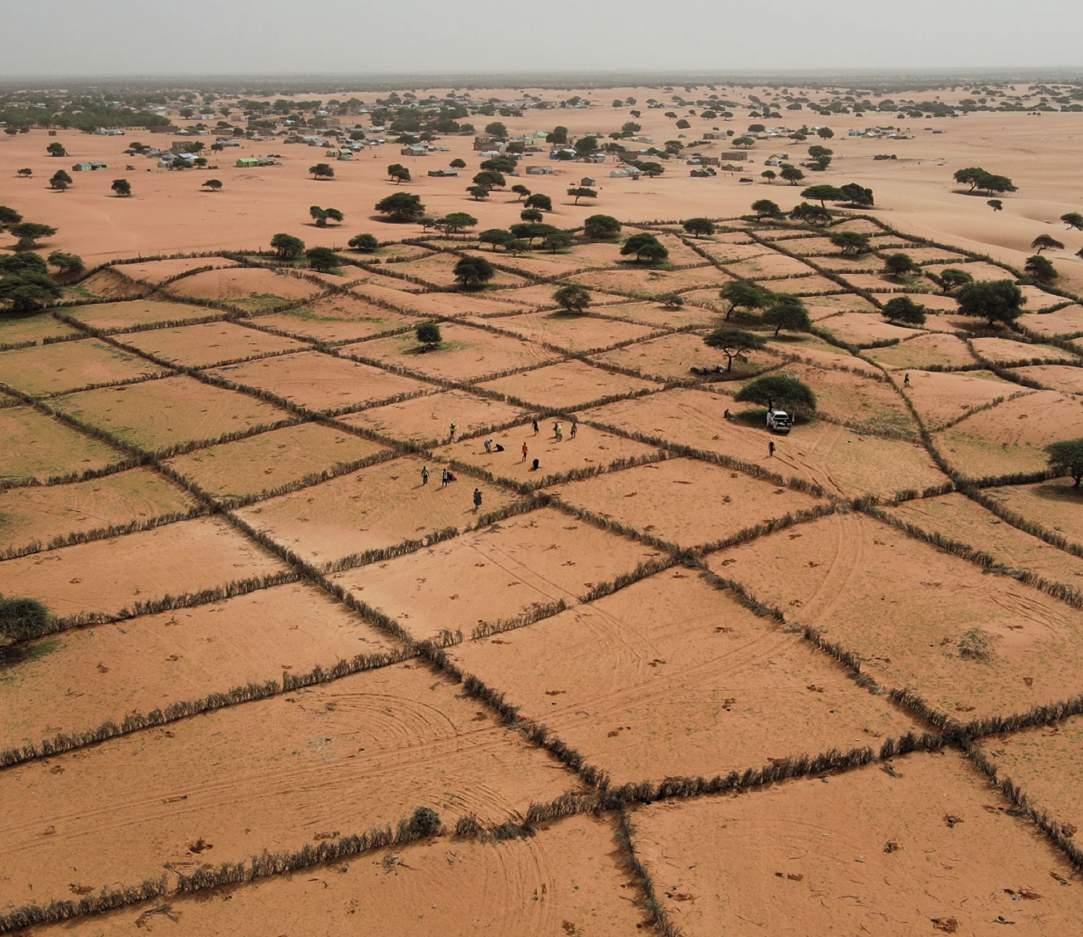
Understanding and characterising the complexity of drought risks is only one part of the challenge in adequately preparing for and responding to drought. Comprehensive drought risk management and adaptation that is forward looking, inclusive and prospective is needed, especially to mitigate the worst impacts of climate change and to realise the UN Sustainable Development Goals. This requires comprehensive and coordinated decision making to implement diverse drought risk management and adaptation pathways that provide benefits across multiple sectors. When combined, different mitigation and adaptation options and pathways can create synergies and have positive cascading effects, strengthening the resilience of human and more-than-human systems.
4.1 Managing and adapting to drought risks
The effects of drought are wide-ranging and highly diverse, involving complex socio-economic and ecosystem interactions (see Chapter 2) Risks and impacts cross systems, sectors, borders and regions and cascade into other, interconnected systems (see Fig. 1, Chapter 1.3). Drought risks vary from region to region depending on local social, economic and ecological contexts. This means that drought risk management and adaptation require collaborative action and cross-sectoral decision making in policy, research and implementation from the individual to the international level.
Given the interconnectedness of the systems in which drought risks emerge, targeted interventions can benefit multiple sectors and systems affected by drought at the same time, as well as tackle related issues such as flooding, pollution, land degradation and desertification. Comprehensive management of drought risks can have cascading benefits for soil, water, climate and biodiversity, strengthening the resilience of land and water for the people and communities who depend on them. Beyond environmental benefits, such interventions can reduce poverty, inequality and water injustices. Forwardlooking drought management and adaptation may require initial financial investments and policy efforts but will be less costly and avoid impacts in the long term compared with reactive management in the future.
What is drought risk management and adaptation?
Drought risk management and adaptation encompass plans, actions and policies aimed at reducing the adverse effects of droughts. Drought risk management covers a large suite of measures designed to prevent, mitigate, prepare, respond and recover from drought impacts for human and ecological systems. Drought risk adaptation measures involve adjustment to actual or expected drought and its effects in order to moderate harm or exploit beneficial opportunities. These could be, for example, technical measures such as improving water retention infrastructure, governance measures such as community-based water resource management, nature-based and land-management measures such as land regeneration and agroforestry or finance-based measures such a micro-insurance for farmers. Measures come with additional co-benefits as well as trade-offs, all of which should be considered to avoid maladaptation and to strenghten resilience while being equitable towards those in more vulnerable and marginal situations (see Section 4.4, pages 158 – 161
UNCCD’s Drought Resilience, Adaptation and Management Policy (DRAMP) Framework
UNCCD’s Drought Resilience, Adaptation and Management Policy (DRAMP) Framework1 brings together drought management and adaptation considerations across three pillars of drought risk reduction (see Fig. 1, below) While each pillar (indicated by the colours in the figure) is relevant to their specific sections, they are not mutually exclusive but cross over and inform the others. Here, we have adjusted the DRMAP framework, bringing in also the systemic nature of drought risks and impacts. Each pillar should be considered in policy planning if nations are to shift from reactive drought impact management to proactive and prospective drought risk management and adaptation (see Fig. 2, opposite for more information)
The framework calls for a joint and continuous sciencepolicy effort to co-construct a thorough understanding of the shared impacts, drivers and root causes of drought risks and their interconnections and cascading effects within wider socio-ecological systems. This includes collecting data and establishing monitoring systems that support mainstreaming risk decision-making into planning and anticipating future scenarios to prepare for potential impacts, as well as designing just and equitable solutions that consider multiple systemic risks in connection to other compounding hazards, to achieve resilience for economies, societies and ecosystems. The framework is designed to guide practical actions for countries to implement their drought policy and management plans (see Section 4.3 for more information on drought management and adaptation plans for countries).
Drought risk decision-making under uncertainty
Drought risk management and adaptation planning is an inherently uncertain process. Sources of uncertainty include the availability and accuracy of data needed to forecast or monitor drought (data/monitoring uncertainty), how systems, including society and human systems, will respond to drought events (modelling uncertainty) and how to balance conflicting objectives and manage trade-offs (decision making uncertainty)2 Uncertainty in drought risk management is further aggravated by ongoing and dynamic ecological and socio-economic changes, including but not limited to climate change, which are altering the frequency, intensity and duration of drought risks faced by many regions. Increasing drought risks also create conditions for complex human behavioural responses that can further exacerbate drought impacts. For example, drilling of illegal wells or water theft during droughts can alter both immediate and longer-term impacts. While uncertainties around drought can be partly reduced with improved data and knowledge3,4,5 the scale and interconnectedness of climate, human and water systems imply that uncertainty is an inherent part of drought risk management and adaptation planning6 Uncertainty usually increases when droughts affect transboundary areas, where different datasets, indicators, measures, institutions and sectoral and stakeholder preferences drive decision-making processes for risk management, all interacting and competing to influence outcomes7 Managing uncertainty is critical to design effective drought risk management and adaptation plans. Under uncertainty, decision-making only on probability models of future conditions and model optimisation is no longer appropriate, since it may artificially reduce uncertainty and risks providing unrealistically precise information that can lead to maladaptation. For example, a combination of data and modeling issues (biased agronomic parameterisation of the staple crop maize) led the African Risk Capacity drought insurance model to underestimate losses in the 2015 Malawi drought by more than two orders of magnitude. This led insurers to conclude that Malawi’s drought was mild, with an estimated affected population of around 21 000 people, and no payout was triggered. However ground-truthing by aid organisations estimated the population affected to be 6.5 million. This could have been averted by a more thorough uncertainty quantification to avert the vulnerabilities of the model.
Addressing uncertainty in drought risk and adaptation planning calls for a thorough 1) quantification of uncertainty (in monitoring and modelling) and 2) adequate decisionmaking methods to interpret and manage uncertainty, thus balancing trade-offs (decision making uncertainty). Tools to quantify uncertainty have been progressively expanded and improved in recent years. Sensitivity analyses, for example, assess how different values of inputs affect model outputs8,9 , while ensemble experiments that use the same inputs but a range of models help assess how different model structures impact outputs10
Appropriate decision-making under uncertainty relies on careful interpretation of available data and model outputs. For example, the oversimplification of human agency by water resources managers may assume that farmers will take the same decisions after policy/technological change as before, which has proven to be wrong (see Section 2.2.10, pages 54 – 55) Starting from uncertainty quantification, tools such as information-gap decision theory11 decision scaling12 , scenario-neutral approach13 robust optimisation14 real options analysis15 and robust decision-making1 can be used. These decision-making tools can support the development of pathways where risk management and adaptation decisions can be progressively implemented depending on future drought risk scenarios, avoiding lock-in and balancing sectoral and stakeholder water needs.
Reactive, proactive and prospective drought risk management and adaptation
Drought risk management and adaptation can be characterised as reactive, proactive or prospective.
Reactive drought management involves plans, actions and policies that are taken to react to drought impacts in order to alleviate negative effects that have already occurred or are occurring, and to recover from them to restore the impacted systems functions. This does not involve adaptation as it primarily focuses on emergency response.
Proactive drought risk management and adaptation involves plans, actions and policies that are taken before the onset of a drought, in order to reduce drought risks by preparing for and mitigating any potential negative impacts that may occur and to strengthen the resilience of system functions.
Prospective drought risk management and adaptation involves plans, actions and policies designed to avoid the development of new or increased disaster risks in the future. These span beyond drought risks exclusively and take a systemic perspective towards disaster risk reduction
Proactive vs Prospective drought risk management and adaptation –What’s the difference?
The terms "proactive" and "prospective" both describe forward-looking approaches to drought risk management and adaptation. The approaches overlap, particularly concerning the actions that are taken and the benefits and co-benefits that can arise. However, they focus on different aspects of the risk management process. Proactive risk management involves taking anticipatory actions to identify, assess, and manage risks before they escalate into impacts or disasters. Prospective risk management is an emerging concept that specifically refers to the process of seeking to avoid the development of new or increased disaster risks in the future. This goes beyond drought risks specifically and involves mainstreaming risk decision making into planning and policies, by anticipating future scenarios and analysing and preparing for the likelihood and potential impacts from all risks before they materialise, including from responses and for systemic risks16
Nature-based solutions for drought
Nature-based solutions (NbS) are strategies to sustainably use and manage ecosystem functions and services in a targeted way to address environmental, social and economic challenges. They mitigate risks associated with natural hazards by leveraging the capabilities of ecosystems to absorb and adapt to these events, and simultaneously contribute to biodiversity conservation, climate regulation and the enhancement of human well-being through improved ecosystem services. To ensure good practice in the selection and implementation of NbS, the International Union for Conservation of Nature (IUCN) provides an NbS standard framed by eight criteria, including net gain for biodiversity; economic viability; and inclusive, transparent and empowering governance processes17
The effectiveness of NbS for drought risk reduction is still not well understood18 however, there is clear evidence that many types of ecosystems can provide sustainable and multifunctional approaches to disaster risk reduction, including droughts19 In the context of drought risk, NbS can prevent or mitigate the incidence and severity of drought hazard through influencing hydrological processes both above ground, e.g. through changing evapotranspiration or surface run-off and below ground, e.g. through modifying water infiltration and soil moisture20 Thus, NbS can accumulate ground and soil water over time through targeted management of ecosystems in drought prone regions. In addition, NbS can reduce vulnerability and help communities through providing ecosystem services. While provisioning and cultural services mainly reduce vulnerability of people through increasing their coping
REACTIVE
reactive drought management drought risk management and adaptation systemic risk management and adaptation
MEASURES INCLUDE: MEASURES INCLUDE: MEASURES INCLUDE:
emergency food and drinking water assistance
subsidies for restoring crops and livestock
relief funds
MANAGING IMPACTS
early warning systems de-stocking of livestock and adjusting cropping patterns
introducing seasonal micro-credit and crop assurance schemes
PROACTIVE REDUCING RISKS
capacities, health and well-being, regulating and habitat or supporting services mainly reduce vulnerability through maintaining ecosystems intact and healthy and with this enable ecosystems to provide services21 Against this background, NbS support prospective drought risk management and adaptation.
NbS encompass a variety of approaches that harness natural processes to mitigate the impacts of water scarcity and drought related impacts. Solutions can be applied across different sectors, such as agriculture, water management and conservation, ecosystem restoration, biodiversity conservation and urban planning, and can be implemented at different scales, from local to regional. Some examples of NbS for drought risk reduction are measures such as agroforestry, soil management, restoration of forests and wetlands, or urban green infrastructure. A good overview of sustainable land management practices to reduce drought risk can be found at the World Overview of Conservation Approaches and Technologies (WOCAT) database for sustainable land management technologies (https://wocat.net/en/global-slm-database/). NbS for drought risk should be considered as an integral part of an overall adaptation strategy and have a huge potential to address multiple goals of international frameworks and conventions at the same time22
climate smart agricultural systems
disaster resistant water supply systems
land-use planning to achieve Land Degradation Neutrality
PROSPECTIVE AVOIDING FUTURE RISKS
Fig. 2: Understanding reactive, proactive and prospective drought risk management and adaptation.
Fig. 3: Wetland. Restoring and regenerating wetlands strengthen resilience to floods and droughts, and are a critical ecosystem for many plant and animal species.
Source: Roman Biernacki via Pexels Stock Photos.
Fig. 1: Drought Resilience, Adaptation and Management Policy (DRAMP) Framework. Adapted and redrawn by LJ
4.2 Success stories from around the world: from local to global
Regional and global initiatives enhancing cooperation
Drought represents a global threat and as such it needs global actions and efforts. In 2013, after the High Level Meeting on Drought Policy, the World Meteorological Organisation and the Global Water Partnership launched the Integrated Drought Management Programme (IDMP) to have a broad global partnership working on drought monitoring and forecasting, drought risks and impacts in all different socio-economic sectors as well as ecosystems, effective drought mitigation and response. After more than 10 years, the IDMP community has been growing and moving its vision towards achieving a drought resilient future for all. In 2022, to
support actions on achieving drought resilience an international coalition was also launched: IDRA - International Drought Resilience Alliance. IDRA aims at building political momentum, exploring innovative ways to mobilise resources, enhance knowledge sharing and effective sustainable actions. In the European Union, the importance of enhanced cooperation, knowledge sharing, communities' engagement was well recognised and led to the establishment of the EU working group on water scarcity and drought as well as the EDORA initiatives to build an EU Drought Risk Atlas and an EU Drought Impact Database.
Establishing National Drought Management Plans, lessons from the Dominican Republic
The Dominican Republic, which shares the island of Hispaniola (also known as Quisqueya or Bohio by the Taino Indigenous peoples) with Haiti in the Caribbean, faces significant challenges due to recurrent droughts. Impacts are widespread across the nation's agricultural and water resource systems, which cascade into the economy. Decreased crop yields during past drought events have threatened food security and the livelihoods of farmers, who make up 14 % of the country’s workforce. Droughts strain the availability of clean drinking water, exacerbating health issues and creating conflicts over water usage. These impacts have prompted the need for better drought management plans across the country. In 2018, the Government of Dominican Republic developed a National Drought Management Plan with support from UNCCD’s drought initiative (see Section 4.3 for more) The objective of the plan is to "achieve water security to supply the population and meet the needs of users and productive sectors, and mitigate the effects of water scarcity and the social, economic and environmental impacts of droughts"
To achieve this, three areas of work have been identified which are:
1. Enhancing drought preparedness,
2. Increasing regional efforts to reduce drought vulnerability and risks, and
3. Developing a toolbox to increase the resilience of people and ecosystems to drought.
To develop this comprehensive plan, an eight-step flexible methodology was followed:
1. Appoint a Working Group for the National Drought Plan
2. Define the Goals Objectives of the Drought Plan
3. Seek stakeholder involvement
4. Inventory situational analysis
5. Prepare write the National Plan
6. Identifying unmet needs and filling institutional gaps
7. Communicate / Educate
8. Evaluate the Plan
The published plan details the results of a drought risk assessment, focusing notably on agricultural impacts across different regions, as well as how current and new drought management measures can align with existing plans and policies. A stakeholder assessment details organisational responsibilities of different private and public actors to carry through different measures and hazard monitoring and early warning communication plans are given to ensure timely responses when drought occurs. Institutions across the country have agreed to implement drought risk management and adaptation measures. These include protecting natural water systems (rivers, lakes, aquifers), land regeneration measures such as reforesting river banks, protecting agricultural soils and natural parks, improving irrigation efficiency and increasing the regulation capacity or volume stored by reservoirs or dams, among others. Through developing their National Drought Management Plan with support from the UNCCD Drought Initiative, the Dominican Republic will shift from reactive impact management and response to a more comprehensive approach that fosters proactive and prospective drought risk management and adaptation.
The role of Farmer Managed Natural Regeneration
Nancy is a smallholder farmer living in in Baringo County, Kenya. This is an area where rainfall patterns are becoming more erratic due to climate change, resulting in prolonged, multi-year droughts which mean insufficient food, pasture and water for communities and their livestock. In such extreme climatic conditions, livestock starve and die. However, Nancy has been able to withstand these challenges. During periods of severe drought, her livestock may become weak, but none of them die. She attributes this to practicing Farmer Managed Natural Regeneration (FMNR), a low-cost practice for regenerating trees and fostering land restoration that involves using a system of pruning sprouting tree saplings to encourage rapid tree-growth.
World Vision Kenya has been successfully working with farmers like Nancy to help them adapt to climate change for over ten years now. The primary approach for doing this is supporting communities to restore the health of their landscapes using low-cost restoration approaches like FMNR. This is supplemented by community committees who make proactive plans for how they will respond to potential disasters. As with all of World Vision’s work, the aim is for communities to lead the restoration of their environment. In Nancy’s case she has been able to opt into which practices are most appropriate for her farm – from FMNR to farm ponds. Nancy now generously shares her time and wisdom with her community by running demonstrations in FMNR and the other practices she uses. She is also working alongside Kenya Forestry Research Institute to use research to validate and share findings about the power of FMNR.
"Before practicing the farmer-managed natural regeneration approach, this land was bare. The soil was eroded and we used to walk for long distances to get firewood. Now, with the regenerated trees, we have a beautiful environment, shade, herbal medicine, fresh air, soothing sounds of birds chirping, increased pasture yields and fodder from trees," Nancy says.
Maharashtra State and beyond, India
Maharashtra has faced repeated droughts which are escalating due to climate change, resulting in a water crisis across the state.
Despite implementing the Maharashtra Groundwater Development and Management Act in 2014, groundwater resources are still rapidly depleting due to unsustainable agricultural extraction.
This has led to dependence on water tankers for drinking and agricultural use in some villages and is driving outward migration in search of income. Women disproportionately feel the effects of these impacts. One barrier to effective management of groundwater is that it is considered private property and the lack of local water governance among communities. Recognising the urgent need for localised water management strategies, the Watershed Organisation Trust (WOTR) launched its Water Stewardship Initiative in 2015. The Initiative fosters climate-smart water governance through community engagement, viewing local water users as 'water stewards' rather than mere beneficiaries. The work aims to build capacities among communities to understand drivers of water scarcity and create agency to adopt efficient water harvesting practices through participatory water governance mechanisms. It adopts three key focuses:

In preparation for the dry season, Nancy usually harvests surplus pasture. She then dries and grinds it and proceeds to store the pasture for use during the dry season.
During long dry spells or in times of drought, the pasture may be depleted. In such situations, Nancy usually uses the leaves and barks of trees on her farm to supplement the animal feed. The over 30 species of regenerated acacia trees on her farm, as well as other tree species, offer a diversified source of nutrition for her livestock. The regenerated trees have also provided a favourable environment for beekeeping to thrive, thus enabling Nancy to gain extra household income from selling honey. From these proceeds, she can buy additional animal feed for her livestock in the dry season.
In March 2023, she hosted guests from 11 countries who represent the first cohort of World Vision staff that has been trained on the organisation’s Regreening Communities Project Model. This is a community-led environmental restoration project model based on the work of communities and individuals like Nancy. It provides opportunities for communities to actively restore and protect their landscapes using various regreening approaches such as FMNR.

T he Water Stewardship Initiative also tackles the gendered dimension of water scarcity in the region. Trainings are given to volunteering women, equipping them with the knowledge and agency to actively participate in water management. One of those volunteers is Janki Maravi, a 21-year-old from Karhaiya village in Madhya Pradesh's Mandla district. Having to walk long distances to fetch water, Janki was driven to act, becoming a water steward in 2021. Inspired by the success of neighbouring Kamariya village, she rallied her own community – a task initially met with resistance. With WOTR’s support, she established a Village Development Committee and launched water management initiatives. With the backing of the committee, she has effectively motivated local farmers to adopt sustainable practices, including methods for improving rice cultivation, multi-layer farming and organic farming practices. Under Janki's leadership, 30 families have initiated kitchen gardens, 35 farmers have adopted System of Rice Intensification techniques and 21 farmers have engaged in multi-layer farming. Furthermore, Janki
Community-led Water Budgeting: empowering community members to lead in the creation of annual water budgets, detailing water availability and usage patterns to inform decision-making about water conservation and allocation.
• Capacity Building: providing training in water-efficient agricultural practices, rainwater harvesting techniques and sustainable groundwater management.
Stakeholder Engagement: promoting dialogue between diverse water users (farmers, households, industries) to establish equitable water use guidelines.

Good practices from Nuwakot, Nepal
In many low- and middle-income countries women still have a disproportionate share of responsibilities for household water and food security. These responsibilities involve having to travel long distances, often on foot, to collect water. These efforts are under-acknowledged, go unpaid and affect health and social networks as they take time away from other community activities. During drought periods, these responsibilities are made harder, as competition for access to water sources increases, making it necessary to cover longer distances. Despite being responsible for household water security, women are often not involved in decision-making spaces around water resource management. It is important to acknowledge the critical role that women and other marginalised groups play in drought risk management and adaptation. One community that has been doing this is Charghare VDC, situated in the upper Gandaki River Basin in mid-hills of Nuwakot District, Nepal. Springs are the main source of water for communities in the mid-hills, with around 80 % of people depending on them for drinking, domestic and agricultural uses. The drying up of springs due to climate change and the shifting of spring locations due to seismic activity after the 2015 earthquake have resulted in water scarcity for many communities. More wealthy individuals and companies have been purchasing spring-immersed land, which has aggravated competition for water resources. People have been forced to walk longer distances to fetch water, which has been particularly burdensome for women. Furthermore, there has been increased discrimination against Dalit communities, a marginalised caste in Nepal, when using communal spring taps.
To overcome these challenges, the International Centre for Integrated Mountain Development (ICIMOD), with its partners, developed a "6-step spring revival protocol" to map spring hydrogeology and facilitate community governance of springs in Nuwakot, placing emphasis on building capacity for women and Dalits. From the protocol, risk management and adaptation measures have been undertaken by communities, including afforestation, cleaning campaigns, construction of ponds and repair of water tanks and pipes around springs and locals have been trained to keep a log of bi-monthly spring discharge and daily rainfall data. Durga Khadka, a representative for the female community in Charghare VDC explained to ICIMOD researchers, "with sufficient access to water in nearby springs, women don’t have to travel as far a distance to fetch water, even during night". Kamala Paneru, another female community representative, said, "we formed a women's water management committee and have carried out conservation measures, such as planting trees and digging trenches and pits to collect water and promoted a sanitation campaign, for which we have received a conservation award from local government". According to Dhanmaya Sunwar, a Dalit community representative, these activities have reduced competition and waiting times for accessing springs in Charghare VDC. Ambika Sunuwar, a local government representative, told ICIMOD, "we have targeted a one household/one tap policy under government schemes to ease water access. The community has come forward with concerns and wants to carry out more spring revival activities in the area", highlighting the successful upscaling of the protocol.
Story 2: National Drought Management Plans
Story 1: International cooperation
Story 3: Adapting to reducing rainfall in Kenya
Story 4: Community water stewardship
Story 5: Intersectionality in drought risk management and adaptation
Fig.
4.3 National drought management plans: How UNCCD and UNFCCC can help
Number of countries engaged in developing National Drought Management Plans with UNCCD
Number of countries with National Adaptation Plans validated by UNFCCC
Number of countries engaged in both processes (National Drought Management Plans with UNCCD & National Adaptation Plans validated by UNFCCC)
Effective drought risk management requires national and regional plans and policies. However, many countries that are affected by drought do not have comprehensive drought management and adaptation plans in place. This has been acknowledged by UN organisations, including UNCCD and UNFCCC, which have made considerable efforts to support countries establishing drought management and climate adaptation plans. Against this backdrop, UNCCD has established the Drought Initiative to support countries in developing and implementing National Drought Management Plans, which include strengthening of comprehensive drought monitoring, preparedness and early warning systems. In addition, UNFCCC has established the National Adaptation Plan (NAP) process, which supports countries to identify medium- and long-term priorities and implement plans for adapting to climate change. Both these processes aim to reduce vulnerability to the impacts of climate change (including drought) by building adaptive capacity and resilience. These processes have primarily been set up to support least-developed, low- and middle-income countries in establishing drought risk management and adaptation plans, but provide useful guidance for all countries who are experiencing or projected to experience drought impacts.
UNCCD Drought Initiative
Fig. 1: Number of countries with National Drought Management Plans and National Adaptation Plans, developed in support with and validated by UNCCD & UNFCCC. At the time of accessing the data (Oct 2024), 29 countries have capitalised on both of these processes (the Drought Initiative & NAPs), which can be highly useful for strengthening national drought resilience and adaptation.
Data source: https://www.unccd.int/land-and-life/drought/drought-initiative & https:// napcentral.org/about (accessed 08/10/2024).
The objectives of the Drought Initiative of the UNCCD are:
• Setting up drought preparedness systems, particularly national drought plans
• Working together at the regional level to reduce drought vulnerability and risk
• Providing a toolbox that stakeholders can use to boost the drought resilience of both people and ecosystems. Countries that express interest in developing a national drought plan under the Drought Initiative receive assistance from the UNCCD secretariat. The secretariat provides a drought expert who assists in reviewing current drought management plans, ensuring they are proactive and comprehensive and capture the needs of vulnerable populations most affected by drought. These experts help parties prepare a national drought plan that identifies gaps in the current national drought preparedness and planning and indicates measures to be implemented as soon as the possibility of drought is signaled by meteorological services. A central part of the Drought Initiative is the Drought Toolbox which countries can use to develop and strengthen their national drought plans.
The Toolbox developed by the UNCCD, together with its partners (including the Food and Agriculture Organization of the United Nations, Global Water Partnership and World Meteorological Organization) features a number of technical and policy options. Another key component of the Drought Initiative is the regional strategic frameworks, which facilitate data sharing, early warning, monitoring, vulnerability and impact mapping as well as drought risk mitigation measures across regions.
UNFCCC National Adaptation Plans
The objectives of National Adaptation Plans are to:
• Reduce vulnerability to the impacts of climate change by building adaptive capacity and resilience
• Facilitate the integration of climate change adaptation, in a coherent manner into relevant new and existing policies, programmes and activities, in particular development planning processes and strategies, within all relevant sectors and at different levels, as appropriate. Countries that express interest in formulating and implementing National Adaptation Plans receive technical support. This includes analysing current and future climate change scenarios, assessing climate risks, and setting up systems across key sectors to make adaptation an integral part of a country’s development planning, decision-making and budgeting. Support is provided by the least-developed country expert group, other bodies under the UNFCCC, United Nations organisations and bilateral and multilateral agencies.
Financial support for establishing National Drought Management Plans and National Adaptation Plans
As well as gaining support in expert technical guidance, countries establishing National Drought Management Plans and National Adaptation Plans can access new domestic and international finance streams from public and private sources for implementing drought management and adaptation measures.
The Global Mechanism of the UNCCD and the Green Climate Fund play an important role in accessing finance for Drought Management Plans and National Adaptation Plans, respectively.
pages 158 – 161 have cobenefits that are also effective for flood regulation. For example, effective management of storage capacity in lakes and reservoirs and preserving or creating new blue infrastructure that retains water, such as wetlands, can reduce both flood and drought risks. Land regeneration and agroforestry measures reduce runoff and increase stormwater retention, improving soil quality, providing shade for livestock and reducing evapotranspiration, which strengthens vegetation's resilience to drought4 Risk management and adaptation measures that are effective for floods and droughts should not be seen as a ‘silver bullet’ for hydrological extremes and still require careful, context-specific planning. However, if the right measures are implemented in the right place and robust monitoring, evaluation and learning is followed to ensure that benefits are being provided as designed, risk management and adaptation can reduce feedback effects and response risks, strengthening resilience to both hydrological extremes.
The main goal of drought Early Warning Systems (EWS) is to provide actionable data and information on the onset of droughts and their evolution in space and time to allow different stakeholders to prepare, act and become more resilient to the impacts across all phases of drought. Forecasting, a key aspect of EWS, is fundamental to managing and planning water resources to minimise impacts on natural and human systems reliant on water availability. Drought forecasting systems depend on a wide range of modelling approaches that vary from dynamical, statistical, machine learning to hybrid methods5 Typically, drought forecasts provide information on the future evolution of a given hazard indicator (e.g. standardised precipitation index). This information may cover a wide range of temporal scales, from weeks to decades and can be provided with varying degrees of anticipation, from a week to a year6 Novel seamless prediction frameworks are envisaged to address the complexity of drought as it evolves across the different time scales, building on seamless subseasonal, seasonal and decadal climate forecasts. The longer the forecast the less it focuses on single events and the more it focuses on changes in likelihood of occurrence of a certain type of event. There is a growing awareness that, in order to make warnings more informative and effective in triggering early actions on the ground, data and information on drought hazards needs to be complemented by information on exposure and vulnerability. This would facilitate the shift in not only warning about when and where to expect a drought, but also what the impacts could be by moving from hazard-based forecasts to impact-based forecasts and early warnings. These novel EWS should be built around multi-sectoral/ecosystem integrated drought risk approaches to effectively reach the whole spectrum of stakeholders (see Fig. 2, below)
Knowing in advance the drought risk for the months or years ahead makes it possible to apply dynamic strategies such as the sowing of crop varieties having an optimal growing period length related to the estimated risks for the season ahead, or the implementation of watersaving strategies to avoid disruptions on public water supply. These services can provide important benefits and alleviate the negative effects of climate change, especially when coupled with economic and financial tools reducing volatility7 Cooperation is essential at the regional and global scale to identify and use common methods enabling fast comparisons, integrations, and cross-borders response in all key socio-economic sectors.
To address the need to provide impact-based early warnings to everyone on the planet, the United Nations initiative “Early Warning for All” or EW4All was launched in 2022 to “guarantee people’s access to effective, risk-informed, gender-responsive and people-centred EWS” by 2027 The EW4All initiative is built around four pillars, namely: pillar 1: disaster risk knowledge, led by UNDRR, pillar 2: detection, observations, monitoring, analysis and forecasting of hazards, led by WMO, pillar 3: warning dissemination and communication, led by the International Telecommunication Union (ITU) and pillar 4: preparedness to respond, led by the International Federation of Red Cross and Red Crescent Societies (IFRC).
Examples of drought-related EWS
There are numerous operational drought EWS across various regions of the World. For example, the European and Global Drought Observatories (EDO and GDO, respectively), part of the Copernicus Emergency Management Service (CEMS) and the Anomaly hotSpots of Agricultural Production (ASAP) are drought-related EWS managed by the European Commission’s Joint Research Centre. ASAP focuses on the agricultural impact of droughts by identifying cropland and rangeland areas with sub-optimal agro-meteorological conditions and/or biomass development problems to inform multistakeholder global agricultural monitoring (like the GEOGLAM Crop Monitor for Early Warning) and food security analysis (like the Integrated Food Security Phase Classification). Within-season agrometeorological and Earth Observation based biomass data are also used to forecast the impact of drought on croplands (i.e. crop yield forecasting) using data-driven machine learning models. EDO and GDO are drought monitoring and forecasting web-based tools designed to provide near real-time information to stakeholders with different needs,
Fig. 2: Conceptual representation of a multi-hazard EWS. Adapted from WMO, 2020.

Source: https://drought.emergency.copernicus.eu/tumbo/gdo/map/
Drought forecasting, early warning systems and tailored climate services
4.4 Drought management and adaptation measures
For drought risk management to be proactive and prospective, diverse sets of management and adaptation measures are needed. Diversity of measures is important to realise the direct benefits and co-benefits across different sectors, thus strengthening systemic resilience of economies, ecosystems and society. No single agronomic, ecological or economic practice can be universally applied or ensures significant advantages in all contexts. Rather, approaches, combining different practices are more promising. To achieve more sustainable agriculture, different integrated approaches have been proposed. Some, for example are inspired by
nature-based solutions and input reduction (e.g. agroecology and circular agriculture) while others leave more space for technological innovation (e.g. climate-smart agriculture, sustainable intensification and conservation agriculture).
In the following table, twelve drought risk management and adaptation measures are presented. This table is not meant to be exhaustive, or cover all possible drought management and adaptation measures, but is included to give inspiration and a broad overview of various types of actions that can be implemented. The measures in the table are not mutually exclusive. They can and should be part of integrated approaches
(e.g. soil conservation, water conservation, crop diversification and agroforestry are all part of an agroecological approach).
The table also provides information about each measure on:
• Co-benefits Additional positive outcomes of the implemented measure beyond the direct intended benefit (i.e. the main purpose or objective of the measure)
Trade-offs Intended or unintended negative outcomes of an implemented measure, for example, by transferring the risk to another sector, community, ecosystem, or individual (i.e. the negative spill-over effect)
Enablers Conditions or actions that support and ease implementation of the measure
Barriers Conditions or actions that may reduce supporting the implementation of the measure
Scalability and transfer The ability to effectively expand and implement measures across different scales and contexts, ensuring that successful approaches can be replicated and adapted.
1
of groundwater, recharge and conservation will be critically needed in many regions, but will require significant adaptation across water using sectors. Recharge and conservation schemes can range from the village to transnational scale
2 Improved water retention infrastructure (green, blue & grey)
Green and blue infrastructures are multi-functional and use natural or semi-natural systems for water retention (e.g. green spaces in cities or wetlands).
Grey infrastructures are in human-built systems for water retention (e.g. dams or drainage systems). The three can be engineered in combination with each other
Ecosystems
• Agriculture Water supply Inland navigation
• Hydropower
3 Lake, reservoir & wetland management Maintaining and improving the water quality, quantity and ecological health of these aquatic ecosystems Ecosystems Agriculture
• Water supply Inland navigation Hydropower
4 Wastewater reuse & desalination Water reuse reclaims used water, for example from a sewerage, and treats it to remove impurities so that it can be used again. Desalination removes impurities from brackish or saltwater to produce potable water. These processes can provide a stable source of useable water during droughts.
Desalination is particularly important in arid and semi-arid climates, coastal cities and small island states
Water supply
Agriculture
• Ecosystems
Also effective for groundwater recharge
Habitat creation for species (green & blue)
Regulates flooding through reducing runoff & stormwater retention
Can enhance water and air quality
5 Improved irrigation efficiency Practices and technologies that aim to minimise the amount of water used and wasted to sufficiently irrigate crops Agriculture
• Water supply
Hydropower Ecosystems
Also effective for groundwater recharge Regulates flooding Improves water quality
Wetlands provide climate change mitigation benefits
Other social benefits including income diversification, recreation health and cultural benefits
Habitat preservation & creation for species
Consistent and reliable water source
Can reduce pollution at the source by removing contaminants from wastewater
Recovers valuable by-products for agricultural use such as nitrogen, phosphorus and potassium
High potential for expansion with population growth in urban areas
Increased yield, productivity and income for farmers
Supports poverty alleviation for poor farmers
Enhances soil-water infiltration
Cooling effects & reduction of extreme heat reported
Not effective in regions with low precipitation
• Can damage biophysical and hydrological processes if implemented incorrectly Possibility to seal soils and bury natural streams
Large-scale infrastructure can use a lot of land
• Reduces waterflow downstream
Can reduce waterflow downstream Possible to exacerbate flood risk if too much water is retained during wet periods
Urban planning to integrate water retention infrastructure into building regulations
• Government investment and subsidies for both new constructions and integrating with existing infrastructure
Enhanced coordination on sharing best practice across sectors
Blending finance from different sources
Capacity building and recruitment of staff with knowledge of how to maintain aquatic systems
Regulation on water use, pollution control and land use practices
• Water quality and ecosystem monitoring
Potential risk to public health if not properly treated
High electricity use, which currently not from renewable sources
• High projected increase in carbon emissions if not coupled with renewable energy
Desalination produced high amounts of polluting waste product
Agriculture can cover more area due to increased efficiency, reducing return flows, giving no change in water depletion or raising it via increased evapotranspiration (irrigation efficiency paradox)
• Potential for more groundwater depletion due to increased pull factor for farmers to irrigate (and maladaptation) if over extracted (irrigation efficiency paradox)
Limitations to expansion in some regions due to a lack of renewable water resources
Strengthening regulatory standards
Funding research & development for technological advancements
• Investment in sewage infrastructure and processing plants
Public awareness campaigns to increase acceptance
Irrigation is already one of the most widely applied adaptation responses in agriculture
• Groundwater monitoring to avoid response risks/ maladaptation
Public and private (blended) investment programmes
Cross farm support through sharing of equipment and best practice
Can have high construction costs and environmental costs if water flow is fragmented, particularly for grey infrastructure
• Currently a lack of best practice knowledge exchange
More research is needed on effectiveness under different conditions and their potential co-benefits compared with other measures
Fragmented water management and land ownership landscape
Competing actor interests and conflict on water usage
• Prioritisation of development near urban areas
High operational costs
Requires accurate water quality monitoring which is expensive to implement at larger scales
• Public acceptance for using recycled water as a source of supply
Moderate to High: Costs dependent on scale of infrastructure, not effective in low precipitation regions
Moderate to High: Many countries and regions already have policies in place. Stakeholder agreement and shared goals are important for effective implementation
Moderate: High cost, effective for urban, industrial and coastal areas
Uncertainties in regional climate projections and agricultural models limit understanding of potential expansion
• Needs good water quality
Financial barriers for access to equipment
Lack of institutional support to provide technical knowledge for farmers
• Diversity of techniques and the differences in effects across regions are often underreported
Limited availability of fresh water sources High: Irrigation is already widely adopted and improving efficiency is highly applicable across many agricultural settings
6 Land regeneration & agroforestry measures
Land regeneration involves restoring degraded land to its natural state. Agroforestry is a land-use management measure combining trees and shrubs with crops and livestock. Successful agroforestry restores degraded land
Ecosystems • Agriculture Water supply
Effective for achieving land degradation neutrality
Climate change mitigation benefits
Regulates flooding through reducing runoff & stormwater retention
Improves water & air quality
Erosion control
Habitat creation for species
Low cost compared to infrastructural measures
Currently limited evidence of effectiveness in highly sensitive ecosystems
• Choice of location to be restored will influence other economic activities in that area
Need close management to ensure trees do not encroach into other biomes
Protection of land from large scale agriculture and deforestation
• Securing land tenure rights for farmers and communities to incentivise longer-term land management
Market incentivisation for agroforestry products
Investment for provision of saplings and tools for planting and management
• Institutional support to provide technical knowledge for farmers & land managers
Difficult to monitor and evaluate all benefits
High: If regulatory and capacity building enablers are taken, measures can be low cost when considering co-benefits if they are well implemented
11
Pricing & trading schemes for water usage
Building capacities and creating agency for local communities to manage and adapt to their own water resources risks, tailored to their specific needs emphasising local context, knowledge and values
• Agriculture Water supply Ecosystems
Assigning direct and indirect costs to water extraction and use and enabling an exchange of water use between actors until a cap is reached with the aim of ensuring an affordable 'water for all' baseline which then exponentially increases in price for higher use
• Water supply Hydropower Agriculture
12 Migration away from droughtimpacted area The movement of people away from a drought affected area, relocating to avoid adverse impacts on living conditions, livelihoods or safety Agriculture
Acknowledges need for localised strategies which are more flexible to changing climate conditions Builds capacities and creates agency for local communities Increased yield and income for farmers
Often includes gender dimensions and reduces intersectional inequalities
Key enabler for many other risk management and adaptation measures
Low cost with minimal trade-offs
Balances negative externalities on other water users in the catchment (internalises costs for extractive actors)
Removes imbalances in access determined by location (i.e. up streamers)
Creates financial capital which can be used for other measures
• Water supply Inland navigation Increase in remittances to beneficiaries Reduced income inequalities Can be transformational for individuals and remittance beneficiaries
Lack
• Can lead to overreliance on external support and dependency
• Can be influenced by local power dynamics and upstream communities
Public and private subsidies for coverage
• Regional cooperation and combining funds for ‘risk pooling'
Supporting countries and sectors to create an enabling environment
Embedding insurance schemes with wider comprehensive risk management strategies Requires up front
• Trust between local communities and other capacity building partners
Understanding of the local context, needs, culture and values of community
Co-creation and inclusive decision-making processes
• Strong understanding of basin scale hydrological dynamics
• Lack of farmer awareness or capacity to capitalise on schemes
Not understanding who/what is at risk, where and why
Lack of recognition for the informal economy
• Lack of coordination across multiple communities at the basin scale
Lack of consideration of the power dynamics between communities and other partners
High: Communities can pass on knowledge and skills learned to others in surrounding areas
Lack of time
• Risk that richer actors hold more purchasing power and can simply buy more, which does not manage drought impacts and exacerbate access imbalances
Environmental costs often not accounted for in many contexts
Is not available to everyone - age, gender, health attachment to place and socioeconomic status play a significant role in chances of successful migration
• Can be seen as a substitute for investing in adaptive capacity through other adaptation measures
Potential integration challenges for inward migrating people to new communities
• Robust governmental policy frameworks
Platforms and agencies that ensure fair oversight
Research to understand and price both direct and indirect costs of water use across sectors (including environmental impact)
Economic capital for those migrating
• Bilateral government agreements to integrate migrants into formal and informal labour markets
Proactive investments in health, social and physical infrastructure for migrating communities to strengthen social networks
Effective government-backed planned relocation schemes
• Units of water in the system greatly vary which complicates pricing
Strict regulation and monitoring needed Can create an incentive for illegal/unregulated abstractions
Stricter migration laws between countries
• Vulnerable populations can become trapped due to lack economic and social capital
Lack of consideration towards attitudes of residents in migrant-receiving areas when formulating policies
Moderate: Requires strong regulatory and legal frameworks and government oversight to ensure fair implementation
Moderate to High: Highly dependent on international cooperation and regulatory frameworks. In many contexts forced migration (i.e. displacement) will not become a choice
4.5 Pathways towards tackling systemic drought risk
Risk management and adaptation measures can have positive cascading effects across systems and sectors.
In order to successfully adapt to systemic drought risks, which are uncertain and non-linear (see Fig. 1, Chapter 1, pages 14 – 15), flexible decision-making is needed that is anticipatory to climate change as well as societal and environmental water demand. Single management and adaptation measures that are implemented with a focus on one sector alone are not sufficient to address the challenges. Cross-sectoral collaboration that synergises efforts, maximises co-benefits and provides a full picture for understanding tradeoffs are more effective. Pathways are a planning approach that can support these needs, through the identification and progressive implementation of risk management and adaptation measures, supporting decision making under uncertainty1,2 Pathways incorporate flexibility and multiple perspectives into planning and are considered a useful tool to stimulate longer-term, more aspirational and collaborative thinking among decision makers and wider stakeholders3 Here we show how different risk management and adaptation measures can cluster and be effective solutions for more than one sector impacted by drought (see Fig. 1, right)
We then demonstrate how different clusters of measures can combine in a pathways approach, facilitating joined-up and cross-sectoral decision making that can take societies further in adapting under conditions of increasing drought risks and uncertainty (see Fig. 2, pages 164 – 165)
This graphic builds on the cross-sectoral conceptual model (see Section 2.6) aiming to demonstrate that, while a risk management or adaptation measure may be designed for a specific system or sector, it can have positive effects across different systems and sectors. This is in part because a measure can have positive impacts on shared risk drivers (third ring from the outer) and root causes (central ring) and because when combined, measures can synergise, becoming more effective.
For example, while improved irrigation efficiency (no. 5) may initially be designed to reduce inefficient irrigation methods in rainfed and irrigated agricultural systems, the measure has further positive impacts beyond that original purpose through influencing shared drivers. Synergies can be created, further propagating positive impacts across different sectors and systems when measures are not taken in isolation. For example, improved irrigation efficiency (no. 5), drought resistant crop varieties and adjusting cropping and livestock patterns (no. 7) and community-based water resource management (no. 10), could tackle root causes of inequality in access to resources if cross-sectoral and comprehensive planning is taken. Taking this perspective can inform more joined-up thinking about the positive systemic effects of risk management and adaptation.
Fig. 1: Positive cross-sectoral effects of risk management and adaptation measures.
4.5 Pathways towards tackling systemic drought risk (cont'd)
Many different measures and tools exist for managing drought risks. A pathways approach, as demonstrated here, can be one effective tool for managing uncertainty and systemic risks.
Pathways approaches require customisation to the decision and drought risks context. Integrating risk management and adaptation measures through a pathways approach allows for more robust decision-making and progressive, flexible implementation4 When measures are implemented, in how far they will be effective under increasing drought risks and global warming and when a shift to a new pathway is needed should all be informed through a continuous and iterative process of monitoring, evaluation and learning3 This is a critical factor that informs the pathways process. Engaging with values and aspirations of stakeholders affected by drought risks informs more equitable decision making around pathways. Individual efforts in one sector alone will not be enough to manage drought risks in a world affected by climate change. Joinedup, cross-sectoral decision making is needed for systemic drought risk management, and a pathways approach presents a promising option to synergise these needs.
risks.
Different measures exist to reduce drought risks: There are many different measures that can be effective for managing droughts, each having benefits, co-benefits and trade-offs in different ways and for different components and drivers of drought risks and impacts (see Fig. 1, Section 1.3) Which measures will be effective and if they can be implemented is highly dependent on local biophysical and socio-economic factors. Here we have clustered the twelve measures into water resource management (further divided into water supply and water use), land-use management and governance based measures. Below each measure indicated by the number and icon are the main sectors which they are used in and have positive affects for.
Measures can and should be combined and implemented together: With modest warming, measures can be taken individually to manage drought depending on local conditions. However, with increased warming certain measures will not continue to be effective, and will reach limits sooner (see no. 1). When combined, synergies can be created and co-benefits of measures can be capitalised upon which can take us further in managing and adapting to drought risks. Different combinations of measures can be more synergistic, for example managed groundwater recharge and conservation and land regeneration and agroforestry (see nos. 1 & 6). Combining measures and creating synergies can occur both sooner and later in the pathway depending on how socioeconomic and climate conditions change, allowing for more flexible planning that avoids lock-in. However, measures will still reach limits even when combined (see nos. 1, 2, 3, 5, 7 & 9), yet at the present day, it is hard to know when this will happen due to uncertainty of their effectiveness under increased risks (here indicated by the coloured dotted lines).
INCREASING DROUGHT RISKS
The timing of when measures should be considered for implementation will vary: Some measures should be considered now or soon while drought risks are less (see nos. 1 – 10), while some may be taken later when drought risks are higher (see nos. 11 & 12, indicated by the grey dashed line). These measures may be less desirable, or taken only after others have been implemented first, for example forced migration away from a drought impacted area. Some measures will also have a longer lead time to become effective (see nos. 1, 2, 3 & 6).
In a highly warmed and drought risk affected future, prospective risk management and adaptation will be necessary to avoid the most severe impacts: Most or even all measures may have to be combined and implemented in consideration of one another and risk decision making must be mainstreamed into planning and policies. However, some locations will run into adaptation limits and unavoidable losses and damages will occur regardless, and trade-offs will need to be made, for example regarding water allocation choices for irrigation.
& livestock patterns
PART 4: Managing and adapting to drought risks
4.1 Managing and adapting to drought risks (pp152 – 153)
[1] Crossman, N.D. (2018). Drought Resilience, Adaptation and Management Policy (DRAMP) Framework https://www. humanitarianlibrary.org/sites/default/ files/2022/06/DRAMP_Policy_Framework.
[2] Lempert, R.J. (2019). Robust Decision Making (RDM), in: Marchau, V.A.W.J., Walker, W.E., Bloemen, P., Popper, S.W. (Eds.), Decision Making under Deep Uncertainty: From Theory to Practice. Springer Cham, Switzerland.
[3] Borgomeo, E., Mortazavi-Naeini, M., Hall, J.W., Guillod, B.P., (2018). Risk, Robustness and Water Resources Planning Under Uncertainty. Earth’s Future 6 468–487. doi:10.1002/2017EF000730
[4] Di Baldassarre, G., Sivapalan, M., Rusca, M., Cudennec, C., Garcia, M., Kreibich, H., Konar M., Mondino, E., Mård, J., Pande, S., Sanderson, M.R., Tian, F., Viglione, A., Wei, J., Wei, Y., Yu, D.J., Srinivasan, V., Blöschl, G., (2019). Sociohydrology: Scientific Challenges in Addressing the Sustainable Development Goals. Water Resources Research 55 6327–6355. doi:10.1029/2018WR023901
[5] Foster, T., Adhikari, R., Adhikari, S., Justice, S., Tiwari, B., Urfels, A., Krupnik, T.J., (2021). Improving pumpset selection to support intensification of groundwater irrigation in the Eastern Indo-Gangetic Plains. Agricultural Water Management 256 107070. doi:10.1016/j.agwat.2021.107070
[6] Nature Climate Change – Editorial (2019). Scientific uncertainty. Nat. Clim. Chang. 9 797–797. doi:10.1038/s41558-0190627-1
[7] Schmidt, G., do Ó, A., Markowska, A., Benítez-Sanz, C., Tetelea, C., Cinova, D., Stonevicius, E., Kampa, E., Vroom, I., Fehér, J., Rouillard, J., Valjataga, K., Navas, L., Blanka, L., De Stefano, L., Jones, M., Dekker, M., Gustafsson, O., Lundberg, P., Pengal, P., Geidel, T., Dworak, T., Zamparutti, T., Lukacova (2023). Stock-taking Analysis and Outlook of Drought Policies, Planning and Management in EU Member States (Report) Publications Office of the European Union. doi:10.2779/21928
[8] Athey, S., Bayati, M., Imbens, G., Qu, Z. (2019). Ensemble Methods or Causal Effects in Panel Data Settings (Working Paper No. 25675) National Bureau of Economic Research. doi:10.3386/w25675
[9] Saltelli, A., Pereira, Â.G., van der Sluijs, J.P., Funtowicz, S. (2013). What do I make of your Latinorum? Sensitivity auditing of mathematical modelling. IJFIP 9 213. doi:10.1504/IJFIP.2013.058610
[10] HEPEX (2023). Hydrologic Ensemble Prediction EXperiment HEPEX [WWW Document]. URL https://hepex.inrae.fr/ (accessed 1.9.23).
[11] Korteling, B., Dessai, S., Kapelan, Z. (2013). Using Information-Gap Decision Theory for Water Resources Planning Under Severe Uncertainty. Water Resour Manage 27 1149–1172. doi:10.1007/s11269-0120164-4
[12] Taner, M.Ü., Ray P., Brown, C. (2017). Robustness-based evaluation of hydropower infrastructure design under climate change. Climate Risk Management 18 34–50. doi:10.1016/j.crm.2017.08.002 [13] Prudhomme, C., Wilby R.L., Crooks, S., Kay, A.L., Reynard, N.S. (2010). Scenario-neutral approach to climate change impact studies: Application to flood risk. Journal of Hydrology 390 198–209. doi:10.1016/j. jhydrol.2010.06.043
[14] Gorissen, B.L., Yanıkoğlu, İ., den Hertog, D. (2015). A practical guide to robust optimization. Omega 53 124–137. doi:10.1016/j.omega.2014.12.006
[15] Steinschneider, S., Brown, C. (2012). Dynamic reservoir management with real-option risk hedging as a robust adaptation to nonstationary climate. Water Resources Research 48 doi:10.1029/2011WR011540
[16] UNDRR. (2022). Global Assessment Report on Disaster Risk Reduction 2022: Our World at Risk: Transforming Governance for a Resilient Future (No. 9789212320281). UNDRR. [17] IUCN. (2020). Global Standard for Nature-based Solutions: A user-friendly
framework for the verification, design and scaling up of NbS doi:10.2305/IUCN. CH.2020.08.en
[18] Yimer, E. A., Trift, L. de, Lobkowicz, I., Villani, L., Nossent, J., & van Griensven, A. (2024). The underexposed nature-based solutions: A critical state-of-art review on drought mitigation. Journal of Environmental Management 352, 119903. doi:10.1016/j. jenvman.2023.119903
[19] Sudmeier-Rieux, K., Arce-Mojica, T., Boehmer H. J., Doswald, N [N.], Emerton, L., Friess, D. A., Galvin, S., Hagenlocher, M., James, H., Laban, P., Lacambra, C., Lange, W., McAdoo, B. G., Moos, C., Mysiak, J., Narvaez, L [L.], Nehren, U [U.], Peduzzi, P., Renaud, F. G., Walz, Y [Y.] (2021). Scientific evidence for ecosystem-based disaster risk reduction. Nature Sustainability, 4(9), 803–810. doi:10.1038/s41893021-00732-4
[20] Vigerstol K., N. Karres, S. Kang, N. Lilly, M. Massey-Bierman. (2023). ACCELERATING ADAPTATION: The promise and limitations of Nature-based Solutions in the race to adapt to increasing floods and droughts The Nature Concervancy.
[21] Walz, Y., Janzen, S., Narvaez, L., Ortiz-Vargas, A., Woelki, J., Doswald, N., & Sebesvari, Z. (2021). Disaster-related losses of ecosystems and their services. Why and how do losses matter or disaster risk reduction? International Journal of Disaster Risk Reduction, 63 102425. doi:10.1016/j. ijdrr.2021.102425
[22] Walz, Y., Nick, F., Higuera Roa, O., Nehren, U., & Sebesvari, Z. (2021). Coherence and Alignment among Sustainable Land Management, Ecosystem-based Adaptation, Ecosystem-based Disaster Risk Reduction and Nature-based Solutions doi:10.53324/MWGP9896
4.3 National drought management plans: How UNCCD and UNFCCC can help (pp156 – 157)
[1] Matanó, A., Ruiter, M. C. de, Koehler, J., Ward, P. J., & van Loon, A. F. (2022). Caught Between Extremes: Understanding Human-Water Interactions During Drought-To-Flood Events in the Horn of Africa. Earth's Future, 10(9), Article e2022EF002747. doi:10.1029/2022EF002747
[2] Schlumberger, J., Haasnoot, M., Aerts, J. C. J. H., Bril, V., van der Weide, L., & Ruiter, M. de (2024). Evaluating Adaptation Pathways in a Complex Multi-Risk System. Earth's Future, 12(5), Article e2023EF004288.
doi:10.1029/2023EF004288
[3] Ward, P. J., Ruiter M. C. de, Mård, J., Schröter, K., van Loon, A., Veldkamp, T., Uexkull, N. von, Wanders, N., AghaKouchak, A., Arnbjerg-Nielsen, K., Capewell, L., Carmen Llasat, M., Day, R., Dewals, B., Di Baldassarre, G., Huning, L. S., Kreibich, H., Mazzoleni, M., Savelli, E., Wens, M. (2020). The need to integrate flood and drought disaster risk reduction strategies. Water Security, 11 100070. doi:10.1016/j. wasec.2020.100070
[4] Caretta, M.A., A. Mukherji, M. Arfanuzzaman, R.A. Betts, A. Gelfan, Y. Hirabayashi, T.K. Lissner, J. Liu, E. Lopez Gunn, R. Morgan, S. Mwanga, and S. Supratid (2022): Water. In: Climate Change 2022: Impacts, Adaptation and Vulnerability. Contribution of Working Group II to the Sixth Assessment Report of the Intergovernmental Panel on Climate Change [H.-O. Pörtner, D.C. Roberts, M. Tignor, E.S. Poloczanska, K. Mintenbeck, A. Alegría, M. Craig, S. Langsdorf, S. Löschke, V. Möller, A. Okem, B. Rama (eds.)]. Cambridge University Press, Cambridge, UK and New York, NY, USA, pp. 551–712, doi:10.1017/9781009325844.006.
[5] Fung, K. F., Huang, Y. F., Koo, C. H., & Soh, Y. W. (2020). Drought forecasting: A review of modelling approaches 2007–2017. Journal of Water and Climate Change, 11(3), 771-799. doi:10.2166/ wcc.2019.236
[6] Ruti, P. M., Tarasova, O., Keller, J. H., Carmichael, G., Hov, Ø., Jones, S. C., ... & Yamaji, M. (2020). Advancing research for seamless Earth system prediction. Bulletin of the American Meteorological Society, 101(1), E23-E35. doi:10.1175/ BAMS-D-17-0302.1
[7] Toreti, A., Bassu, S., Asseng, S., Zampieri, M., Ceglar A., & Royo, C. (2022). Climate service driven adaptation may alleviate the impacts of climate change in agriculture. Communications Biology, 5(1), 1235.
doi:10.1038/s42003-022-04189-9
[8] World Meteorological Organization (WMO). (2022). Early Warnings for All: Executive Action Plan 2023-2027 Retrieved from https://library.wmo.int/idurl/4/58209
4.5 Pathways towards tackling systemic drought risk (pp162 – 165)
[1] Werners, S. E., Wise, R. M., Butler, J. R., Totin, E., & Vincent, K. (2021). Adaptation pathways: A review of approaches and a learning framework. Environmental Science & Policy, 116 266–275. doi:10.1016/j.envsci.2020.11.003 [2] Muccione, V., Haasnoot, M., Alexander, P Bednar-Friedl, B., Biesbroek, R., Georgopoulou, E., Le Cozannet, G., & Schmidt, D. N. (2024). Adaptation pathways for effective responses to climate change risks. WIREs Climate Change, 15(4), Article e883. doi:10.1002/wcc.883 [3] Sparkes, E., & Werners, S. E. (2023). Monitoring, evaluation and learning requirements for climate-resilient development pathways. Current Opinion in Environmental Sustainability, 64 101329. doi:10.1016/j.cosust.2023.101329
[4] Haasnoot, M., Kwakkel, J. H., Walker, W. E., & Maat, J. ter (2013). Dynamic adaptive policy pathways: A method for crafting robust decisions for a deeply uncertain world. Global Environmental Change, 23(2), 485–498. doi:10.1016/j.gloenvcha.2012.12.006
Appendices
Methodology – drought hazard computations (pp166)
[i] Van Beek, L. P. H., & Bierkens, M. F. P. (2008). The Global Hydrological Model PCR-GLOBWB: Conceptualization, Parameterization and Verification Utrecht University. Retrieved from https://vanbeek. geo.uu.nl/suppinfo/vanbeekbierkens2009. pdf
[ii] Sutanudjaja, E. H., Van Beek, R., Wanders, N., Wada, Y., Bosmans, J. H., Drost, N., ... & Bierkens, M. F. (2018). PCR-GLOBWB 2: a 5 arcmin global hydrological and water resources model. Geoscientific Model Development 11(6), 2429-2453.
[iii] Hersbach, H., Bell, B., Berrisford, P., Hirahara, S., Horányi, A., Muñoz-Sabater, J., ... & Thépaut, J. N. (2020). The ERA5 global reanalysis. Quarterly Journal of the Royal Meteorological Society, 146(730), 1999-2049.
Conventions and acronyms for individual copyright notices (pp176)
[i] Publications Office of the European Union, Licences named authority lists (2015). http://europa.eu/!FD34mJ.
[ii] Free Software Foundation, Free Software Directory (Free Software Foundation, Boston, USA, 2012), pp. 6958+. http:// directory.fsf.org/wiki?curid=6958.
[iii] Creative Commons, CC0 1.0 Universal (CC0 1.0) Public Domain Dedication, Creative Commons, Mountain View, California, USA (2015).
[iv] Free Software Foundation, Free Software Directory (Free Software Foundation, Boston, USA, 2015), pp. 8722+. http:// directory.fsf.org/wiki?curid=8722.
[v] Creative Commons, About The Licenses, Creative Commons, Mountain View, California, USA (2015). https:// creativecommons.org/licenses/
[vi] Creative Commons, Creative Commons
Attribution 2.0 Generic (CC BY 2.0), Creative Commons, Mountain View, California, USA (2015).
[vii] Free Software Foundation, Free Software Directory (Free Software Foundation, Boston, USA, 2015), pp. 7031+. http:// directory.fsf.org/wiki?curid=7031.
[viii] Creative Commons, Creative Commons
Attribution 3.0 Unported (CC BY 3.0), Creative Commons, Mountain View, California, USA (2015).
[ix] Free Software Foundation, Free Software Directory (Free Software Foundation, Boston, USA, 2012), pp. 7034+. http:// directory.fsf.org/wiki?curid=7034.
[x] Creative Commons, Creative Commons
Attribution 4.0 International (CC BY 4.0), Creative Commons, Mountain View, California, USA (2015).
[xi] Free Software Foundation, Free Software Directory (Free Software Foundation, Boston, USA, 2015), pp. 12289+. http:// directory.fsf.org/wiki?curid=12289.
Specific third-party content (e.g. artistic work) may be subject to different copyright and licensing. Throughout the Atlas, information on these aspects is provided in the caption of each artistic work (e.g. photos, graphs, drawings, ...) which is subject to conditions specified in individual copyright notices.
The information on specific third-party content is structured by providing the name of the author or copyright holder and licensing conditions and – where available – a URL pointing to further online information:
Author name, acronym of the licensing conditions URL where the following acronyms and abbreviations are used:
AP Atlas permission PD Public domain
• CC Creative Commons Attribution license
The following sections describe these terms.
Atlas Permission (acronym: AP)
The copyright holders of the individual document (which may be e.g. an individual image, diagram, ...) for which this permission is granted give the European Union specific permission to modify and combine the aforementioned document with the Soil Atlas of Asia, published by the Publications Office of the European Commission.
Public Domain (acronym: PD)
Works in the public domain are not covered by a license [ii]
The specific material in the public domain is not copyrighted and no license is associated with it. Licenses exist which formally dedicate a work to the public domain, also providing a fallback license for cases where that is not legally possiblei-iv Works released under these licenses are indicated with the acronym associated with the specific licenses (e.g. CC).
Creative Commons licenses
Works covered by a Creative Commons license are provided, along with the legal code, also with a Commons
Deed which is "the ‘human readable’ version of the license [...] a handy reference for licensors and licensees, summarising and expressing some of the most important terms and conditions"v In the following, a summary is provided from the Commons Deed associated with the Creative Commons Public Domain Dedication and the Creative Commons Attribution license. For completeness, the full legal code is also provided.
Creative Commons Attribution (acronym: CC)
A variety of versions exist for the Creative Commons Attribution licensevi-xi. Common elements characterise their Commons Deed and provide users of the licensed work with the freedom to:
• Share - copy and redistribute the material in any medium or formatvi,viii,x
• Adapt - remix, transform, and build upon the material for any purpose, even commerciallyvi,viii,x
The licensor cannot revoke these freedoms as long as users follow the license terms, under the following terms:
• Attribution - users must give appropriate credit, provide a link to the license, and indicate if changes were made. Users may do so in any reasonable manner, but not in any way that suggests the licensor endorses them or their usevii,ix,xi
The aforementioned summary "highlights only some of the key features and terms of the actual license. It is not a license and has no legal value". Users "should carefully review all of the terms and conditions of the actual license before using the licensed material"vi,viii,x
Credit is given. No changes have been made to any of the images provided. Relevant licenses are listed in the table below:
C1
BY-SA 1.0
C2 CC BY 2.0
Attribution-ShareAlike 1.0 Generic https://creativecommons.org/licenses/by-sa/1.0/
Attribution 2.0 Generic https://creativecommons.org/licenses/by/2.0/
C2a CC BY-SA 2.0 Attribution-ShareAlike 2.0 Generic https://creativecommons.org/licenses/by-sa/2.0/
C2b CC BY-NC 2.0 Attribution-NonCommercial 2.0 Generic https://creativecommons.org/licenses/by-nc/2.0/ C2c
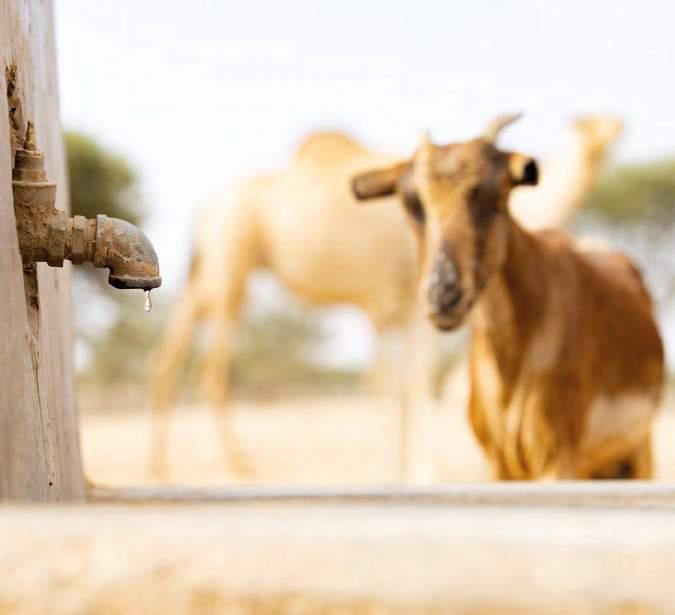
Lokoyo, Turkana Central, Kenya.
Source: Pape Mamadou Camara UNCCD.
Drought resilience is development, drought resilience is peace.
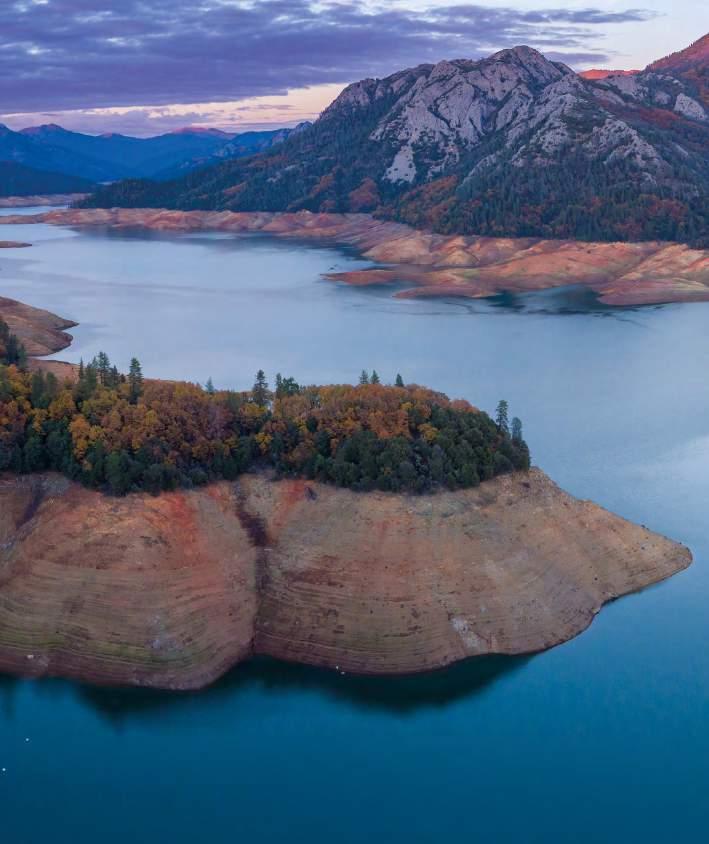
ANDREA MEZA
Deputy Executive Secretary of the United Nations Convention to Combat Desertification, Drought Resilience +10 Conference, Geneva, 2024
ISBN 978-92-68-21788-7
