
20 minute read
Welcome new members


the ciqs would like to welcome the following new members (including reinstatements):
A
Solomon Agbede, Winnipeg, MB Mark Agius, Flynn Canada Ltd, Toronto, ON Sunday Alabi, Lagos, Nigeria Samar Allahham, North York, ON Roxanne Auray, Calgary, AB Luay Azzam, Oldcastle, ON
B
Elilvathany Balathas, Markham, ON Muhammadh Arshath Bazeer, Nintavur,
Sri Lanka Francis Beaujault, Pomerleau, Montréal, QC Brahim Bedahouche, Montréal, QC Andrea Bellisomo, Axiom Builders Inc.,
Coquitlam, BC Samuel Bilow, NorthYork, ON Jean-Pierre Brisson, Strategia Conseil inc.,
Québec, QC
C
Paul Cann, Port Mc Neill, BC Mark Ceccolini, Sudbury, ON Eddy Charles Romain, Stouffville, ON Xingquan (Sean) Chen, SNCLAVALIN,
Markham, ON Adrian Coleman, Davis Langdon,
Mississauga, ON
D
Westley Davidson, Altus Group,
Vancouver, BC Ravindra Ranjan Dayarathna, Kurunegala,
Sri Lanka Jaroslaw Derylo, Net Elecric Ltd.,
Toronto, ON Fabien Dessureault, Laval, QC Arlo Duffy, L.A. Brayer Industries Ltd.,
Edmonton, AB Joseph Dy, United Wrecking Inc.,
Scarborough, ON
F
Janos Farkas, Ibrany, Hungary Shane Flynn, Altus Group, Toronto, ON Pouyan Foroughi, Toronto, ON
G
Stéphane Gagnon, Pomerleau inc.,
Gatineau, QC Jeffrey Gaudet, Marco Maritimes Limited,
Halifax, NS Daniel Gonzalez, Mississauga, ON Jean-François Gosselin, Pomerleau Inc.,
Val-des-Monts, QC
H
Keith Ho, Toronto, ON Sean (Xu Ren) Hou, Whitemud Ironworks
Group Inc., Vancouver, BC
I
Mohomed Infaz, Dehiwala, Sri Lanka
J
Ahmed Jabri, Toronto, ON Chris Johnson, Nagercoil, TX, India Brady Jonker, Paris, ON
K
James Keane, Altus Group, Toronto, ON
L
Billy Lai, CMS Building Consultants Inc.,
Markham, ON Sherry Lam, Vancouver, BC Chaminda Liyanage, Abu Dhabi, United
Arab Emirates
M
William Mackay, Toronto, ON Gary MacKenzie, SilverLine Group Inc., St.
Catharines, ON Kishwer Mallik, Hamilton, ON Amasihemwen Martins, Port Harcourt,
Nigeria Gerard McGroggan, Brampton, ON Justin McManus, Acciona Infrastructure
Canada Inc., Windsor, ON Manali Mehta, Brampton, ON Matthew Miniotas, Canberra,
ACT, Australia Siddique Mohamed, ASCON, Abu Dhabi,
United Arab Emirates Maryam Mohammad Amin, East York, ON Shahbaz Mukhtar, Lancashire,
United Kingdom
N
Keerthika Nadarajah, Scarborough, ON Hung Chuong Nguyen, Scarborough, ON
O
Olatunde Oretan, Lagos, Nigeria
P
Joachim Parant, Isolation Confort, Montréal,
QC Igor Pejicic, Metrolinx/GO Transit,
Toronto, ON Celso Pereira-Pena, Castlewall Marble and
Tile, Toronto, ON Ashley Perry, Vancouver, BC Lance Plamondon, Ledcor Construction
Limited, Saskatoon, SK Jason Pocock, Graham Construction,
Okotoks, AB Skaria Pothen, Clair Randall Smith
Pendlebury, Markham, ON t-303.pdf 1 11-12-15 8:14 AM
R
Roy Rabanal, V.K.M. Steel Limited,
Toronto, ON Hiran Randeniya, Kadawatha, Sri Lanka Cornell Rowe, Skyline Roofing, Calgary, AB André Roy, Groupe André Roy, Montréal, QC
S
Rey Sasuman, BTY Group, Burnaby, BC Dany Savard, Dany Savard, Burnaby, BC Brian Shedden, Asset Project Managment
Inc., Ajax, ON 0rson Smith, Freeport, Bahamas Jason Snider, Toronto, ON Neil Stevenson, Toronto, ON Matt Stewart, London, ON
T
Laurent Thom, Pomerleau inc., Gatineau, QC
V
Sumit Verma, Khetri, India Huong Vu, Toronto, ON
W
Nalin Walisundara, Maharagama, Sri Lanka Adrian Walsh, Concosts, Vancouver, ON Sagara Weeratunga, Markham, ON Patrick Wheeler, Newman Bros. Limited, St.
Catharines, ON Andrew White, Aurora, ON Nelson Wong, WEQ Britco LP,
Vancouver, BC
Construction Integrity and Reliability
• Single Point of Contact and Responsibility • Comprehensive and Strategic Advice • Innovative Project Solutions • Collaborative Partnering Approach/ Integrated Project Delivery
23 Years of23 Years of
Proven on-time and Proven on-time and on-budget delivery on-budget delivery
Our area of expertise is Integrated Project Delivery
• public recreation facilities • aquatic centres • arenas • performing arts • conference centres • resorts.
Contact us today for information on how we can deliver for you! www. taskcm.com/construction-economist
1.800.845.8275
Managing Projects ~ Building Trust
Industrial Product Price Index,
selected Construction Materials Series
the second quarter of 2011, the four largest quarterly price changes among the main commodities used in construction were all increases: one in the mechanical group, one in the architectural group, one in the ‘other’ group and one in the structural group. The largest increase was in pipe fittings, rubber or plastic (+6.9%), followed by carpets in rolls (+5.8%), diesel fuel (+4.7%) and sheet, strip and plate, carbon steel, hot rolled (+4.1%).
After declines in the last three quarters, the prices of pipe fittings, rubber or plastic, rose 6.9% in the second quarter of 2011. Prices decreased 2.5% in the third quarter, no change in the fourth quarter of 2010 and fell 1.8% in the first quarter of 2011.
The prices of carpets in rolls, which had not advanced in the previous two quarters, climbed 5.8% in the second quarter of 2011.
The price of diesel fuel was up for a third consecutive quarter (+4.7%). However, the increase was not as large as in the previous two quarters, where the price of diesel fuel rose 13.5% in the first quarter of 2011 and 13.7% in the fourth quarter of 2010.
Prices for sheet, strip and plate carbon steel, hot rolled, advanced 4.1% in the second quarter of 2011, after rising 4.1% in the first quarter of 2011 and falling 4.2% in the fourth quarter of 2010.
The four largest year-over-year changes among the main commodities used in construction were an increase in the ‘other’ group and three decreases: two in the architectural group and one in the structural group. The changes were in diesel fuel (+33.4%), plywood softwood excluding Douglas fir (-20.4%), plywood Douglas fir (-16.0%) and particleboard and waferboard (-12.0%).
Posting its sixth consecutive yearover-year increase, the price of diesel fuel continued to climb, with a 33.4% jump in the second quarter of 2011. Year-over-year comparisons of the price of diesel fuel in 2010 showed steady quarterly increases, with gains of 17.1% in the first quarter, 16.1% in the second quarter, 7.2% in the third quarter and 12.9% in the fourth quarter. In the first quarter of 2011, the price increased by 25.7% on a year-over-year basis.
On a year-over-year basis over the last 12 months, prices for plywood softwood excluding Douglas fir were down for a fourth consecutive quarter, having fallen 12.8% in the third quarter of 2010, 8.4% in the fourth quarter of 2010, 10.4 % in the first quarter of 2011 and 20.4% in the second quarter of 2011.
Prices for plywood Douglas fir also declined, on a year-over-year basis, for a fourth consecutive quarter, with a 16.0% drop in the second quarter of 2011. Prices had fallen 13.6% and 3.8%, respectively, in the third and fourth quarters of 2010, and 6.2% in the first quarter of 2011.
Particleboard and waferboard prices were down on a year-over-year basis for a third consecutive quarter, with decreases of 2.1% in the fourth quarter of 2010, 3.4% in the first quarter of 2011 and 12.0% in the second quarter of 2011.
In Construction Union Wage Rates Index
In the second quarter of 2011, the Canada Total Construction Union Wage Rates Index (including supplements) increase by 0.6% compared with the previous quarter. It was 1.6% higher compared with the second quarter of 2010. On a regional basis, the index for the Quebec Region registered the highest quarterly change (+1.6%), followed by the Atlantic Region (+1.0%), the Ontario Region (+0.5%) and the Prairie Region (+0.3%). Only the British Columbia Region remained unchanged from the previous quarter.
New Housing Price Index
The New Housing Price Index (2007=100) increased 0.8% in the second quarter of 2011, up from the previous quarterly increase of 0.7%. Québec (+0.6%), Ontario (+1.5%), the Prairie Region (+0.2%) and British Columbia (+0.4%) all posted increases, while the Atlantic Region remained unchanged from the last quarter. Charlottetown (+1.0%) posted the only increase in the Atlantic Region in the second quarter. The primary reason for the increase was higher land development costs. The metropolitan areas of Saint John, Fredericton and Moncton (-0.2%) as well as St. John’s (-0.1%) posted decreases while Halifax remained unchanged from last quarter. In Montréal (+0.9%), prices increased in the second quarter, as a result of good market conditions. Québec (-0.1%) registered a decrease due to lower land development costs.
Competitive market conditions as well as increased material and labour costs contributed to the increases in Ontario in the second quarter. The metropolitan regions of Toronto and Oshawa (+1.8%), KitchenerCambridge-Waterloo (+1.2%), Ottawa-Gatineau (+1.0%), London (+0.5%), Hamilton (+0.4%) as well as St. Catharine’s-Niagara and Greater Sudbury and Thunder Bay (both +0.1%), recorded increases, while Windsor (-0.5%) recorded a decrease during the same time period.
Increased material and labour costs as well as higher land development costs were the primary reasons for the increases in the Prairie Region in the second quarter. Regina (+1.9%), Winnipeg (+0.8%) and Edmonton (+0.2%) all experienced increases while Saskatoon and Calgary were unchanged from last quarter.
In British Columbia, Vancouver (+0.5%) posted an increase as builders reported improved market conditions, while Victoria (-0.7%) saw a decrease as builders reduced their prices in order to stimulate sales.
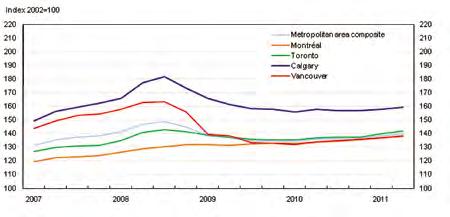
Apartment Building Construction Price Index
The composite price index for apartment building construction increased 1.1% in the second quarter compared with the previous quarter. The quarterly advance was mainly a result of wage increases and the continued strength of construction material prices.
All seven of the census metropolitan areas (CMAs) surveyed reported quarterly increases between 0.7% and 1.4%. Toronto (+1.4%) and Calgary (+1.2%) posted the largest quarterly advance while Montréal (+0.7%) reported the smallest increase.
Year over year, the composite price index for apartment building construction was up 2.9% in the second quarter. Of the seven CMAs surveyed, Ottawa–Gatineau, Ontario part (+3.8%) reported the largest year-over-year increase, while Calgary (+1.2%) showed the smallest advance. Chart 1 Apartment building construction price indexes, composite and selected Census Metropolitan Areas
Non-residential Building Construction Price Index
The composite price index for nonresidential building construction increased by 1.2% in the second quarter compared with the previous quarter. The quarterly advance was mainly a result of wage increases and the continued strength of construction material prices.
All seven of the census metropolitan areas (CMAs) surveyed reported


Chart 2 Non-residential building construction price indexes, composite and selected census metropolitan areas (CMAs)
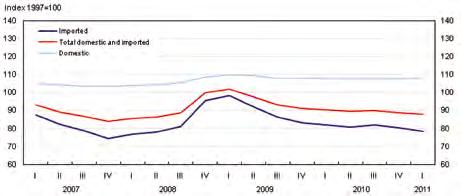
Chart 3 Machinery and equipment price indexes

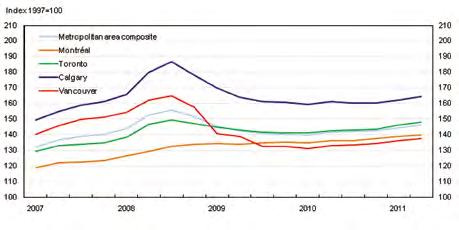
quarterly increases ranging from 0.6% to 1.5%. Ottawa–Gatineau, Ontario part (+1.5%) and Toronto (+1.4%) recorded the largest gains.
Year over year, the composite price index for non-residential building construction was up 3.2%. Of the CMAs surveyed, Ottawa–Gatineau, Ontario part (+4.4%) and Toronto (+3.9%) recorded the largest increases while Calgary (+1.9%) registered the smallest gain.
Machinery and Equipment Price Index
The Machinery and equipment price index (MEPI) declined by 0.8% in the second quarter compared with the previous quarter; the import component declined by 1.4% over this period while the domestic series was unchanged. Compared with the second quarter of 2010, the total MEPI decreased by 2.5%, with the import component declining 4.4% while the domestic component increased by 0.7%.
Except for fishing, hunting and trapping (+0.2%) and warehousing and storage (+0.1%), all other industries posted decreases in the prices of machinery and equipment purchased in the second quarter. The largest contributor to the total MEPI decline were the finance, insurance and real estate industries (-1.0%), led by the real estate and rental and leasing services subcomponent (-1.0%). The second largest contributor to the quarterly decline of the total MEPI were manufacturing industries (-0.7%), led by a price decline in transportation equipment manufacturing (-0.5%) and a 0.7% decrease in both the primary metal and fabricated metal product manufacturing and the paper manufacturing sectors.
Almost all commodities posted price decreases in the second quarter. Among these, computers and peripherals equipment such as terminals, printers and storage devices (-3.5%) and other industry specific machinery (-1.3%) contributed the most to the quarterly decline of the total MEPI.
The Canadian dollar appreciated by 1.9% against the US dollar in the second quarter compared with the previous quarter and also gained 6.2% year over year. Variations in exchange rates can have a strong influence on the MEPI given the high weight that imported machinery and equipment has in the index.
Electric Utility Construction Price Index
Annual 2010 (revised) and first half 2011 (preliminary)
Construction costs for electric utility distribution systems series increased by 2.9% during the first half of 2011 compared with the 2010 annual index. Higher costs for labour (+6.2%) and construction indirects (+2.9%), which includes engineering, administration and overheads, were the major contributors to the advance in the index.
In the first half of 2011, construction costs for the transmission line system series rose 2.0%, while the transmission line component increased 3.6%, largely as a result of installation labour (+6.2%). The substation component increased by 1.0% in the first half of 2011, led by a 2.7% increase in the construction indirects component.
Compared with 2009 final data, the revised 2010 data showed increases for the distribution systems series (+2.4%) and the transmission line system series (+0.7%). The transmission line component increased by 1.7% and the substation component rose slightly (+0.1%).
Consulting Engineering Services Price Index
2009 (preliminary data)
The Consulting Engineering Services Price Index (CESPI) is now available for 2009. The Consulting Engineering Services Price Index measures the change in the total price of engineering and consulting services, as well as changes in the wage rate and realized net multiplier components. Detailed indexes are available for fields of specialization and for regional, domestic and foreign markets.
The Canada total Consulting Engineering Services Price Index increased 0.4% in 2009 compared with 2008.
Infrastructure Construction Price Index
An analytical price index series measuring annual changes in the cost of municipal infrastructure construction funded by development charges has been developed by Statistics Canada on behalf of the City of Ottawa. The annual index for 2010 was 140.6 (2001 =100), an increase of 2.9% over the revised annual index of 136.7 for 2009. The indexes for 2008, 2007, 2006, 2005, 2004, 2003 and 2002 were 133.3, 125.0, 120.0, 113.1, 107.8, 104.8 and 102.3 respectively.
Note: In 2009, all indexes were revised back to 2001. Calendar year averages of each input index are now used in the calculations. Also, revisions were made in the selection of a small number of inputs in order to improve the quality of the index. Source (Adapted from): Statistics Canada, October 2011, Capital Expenditure Price Statistics, Catalogue no 62-007-x, vol. 27, no. 2, quarterly.

CB ROSS
COST CONSULTING
JOB OPPORTUNITIES
- Project Monitor - Junior/Intermediate Cost Planner
C.B. Ross Cost Consulting is a consulting firm located in Toronto, Ontario offering consulting services to a wide spectrum of clients from project inception through to completion. We have job opportunities in our Project Monitoring and Cost Planning/Estimating departments. Candidates must have:- - relevant experience in the construction industry - strong communication skills - time management skills - be working towards (or have interest in) RICS and CIQS membership. In return, we offer an extensive employee package commensurate with expertise, qualifications and skills. If you are interested, please submit your resumé by email: mail@cbross.ca or by fax: (416) 487-3017 Only select candidates whose resumés best match our requirements will be contacted.
AutomAting the takeoff

there are many options available in applying information technology to the takeoff and estimating process. What software is available? What criteria should you use in evaluating software? Which system is best for your operations? This paper tries to shed some light on your options.
AutomAting the tAkeoff process Takeoff is the process of obtaining quantity measurements from plans and specifications. Estimating, on the other hand, is applying costs to these quantities. We first discuss automating the takeoff, quantity surveying process before reviewing estimating software.
Manual takeoff methods involve calculating quantities from known dimensions or using an architectural scale. If your organization spends more than eight hours per month manually calculating quantities, you probably should investigate automating this activity. Rates of returns on takeoff software solutions can be substantial. For example, if your company spends 100 hours per month performing manual takeoffs, what is the value if the same amount of work can be done in 30 hours?
Digitizer bAseD tAkeoff of pAper plAns Digitizer based takeoff systems replace your scale and greatly speed up the takeoff process, especially for irregular areas. Digitizing quantities can also eliminate potential errors resulting from digit transposition, non-standard scales and miscalculations. A digitizer is a hardware device that is placed on a tabletop. Blueprints are then placed on top of the digitizer, and by using an electronic pointing device, a signal is sent through the plans and an X,Y coordinate is generated by the digitizer. As you click or trace around areas and lengths, X,Y coordinates provided by the digitizer are used by the takeoff software to draw and calculate quantities.
In order to implement a digitizer solution, you will need to have a digitizer tablet along with software that turns the digitizer coordinates into quantity measurements. There are two types of digitizers: rigid, hard digitizers or roll-up tablets. If you need portability the roll-up digitizers are ideal. If you will digitize the takeoffs at one location, a rigid board may be better. There are two manufacturers of largeformat digitizer tablets: Numonics and GTCO/CalComp. Digitizer tablets are usually not sold by the manufacturers to the end user, but rather are resold by companies that provide a digitizing software solution. Manufacturers list prices of large format digitizer tablets are often over $1,700 before adding the cost of the takeoff software.
There are two kinds of digitizing software applications: 1) simple digitizer software that calculates quantities and often sends the quantities to spreadsheet programs, such as Microsoft Excel or 2) digitizing software that is integrated with a database, assembly driven estimating program. Once you decide to implement a digitizer, you will then need to evaluate which type of estimating software is best for applying costs to the digitized quantities.
When selecting a digitizer solution ask these basic questions: • How much time do you spend calculating quantities from paper plans? • Do you currently use spreadsheet software for estimating?
If yes, do you want to continue using the spreadsheet software? • Do you need the digitized takeoff integrated with your assembly, database driven estimating software? • Does the digitizer communicate with the software using the industry standard Wintab driver?

• Are the digitized drawings saved? • Can the drawing be edited and printed? • Is there a clear audit trail between the quantity measurement and the digitized drawing? • If using with Microsoft Excel is the digitizer interface added directly into Excel or is it a separate application?
Are the digitized drawings saved with the Excel file? • Is the software easy to use? • How fast can you learn the software? • Will you need a lot of support? • Is there a satisfaction guarantee? • Who is using the system successfully and unsuccessfully? • What does it cost? to establish standards for promoting effective means of exchanging information among all software platforms and applications serving the Architectural, Engineering and Construction Community. The goal is to share data, enter it once and seamlessly transfer the data between platforms and among applications. Regarding the takeoff function, the engineers and architects will automatically generate the takeoff quantities during the design phase and the contractor will have this information readily available from a shared project model. The aim is to reduce errors and omissions and save time and money.
This model, in theory, is the ideal way to generate takeoff quantities. However at best it will take many years, if ever, before it becomes fully operational. The aecXML and IFC standards are still being developed and many competing software companies will need to develop software that utilize these still developing standards. Keep your eyes open however, to see if these developing standards become a reality and fulfill the dreams of the A/E/C community.
and estimAting process.
on-screen tAkeoff of DrAwing files Distribution of drawing files is increasing in popularity. Drawing files of various types are currently distributed either on a compact disc, via email or through the World Wide Web. Distribution of drawing files offers significant efficiency and cost advantages in comparison with distributing paper blueprints. As more and more companies utilize electronic plan distribution, software for performing the quantity takeoff on-screen from drawing files is also increasing in popularity.
On-Screen takeoff programs allow the user to view a variety of drawing files and electronically measure items using your mouse rather than a scale or digitizer tablet. No additional hardware is required. As items are measured, the on-screen takeoff software should offer a choice of colors, line styles, count symbols and area fill patterns of the items measured. If working with a spreadsheet such as Microsoft Excel, ideally the on-screen takeoff software should automatically record the quantities and drawings into the spreadsheet cell.
AutomAtic tAkeoff from A shAreD project moDel In association with the Building Technologies Department of the Lawrence Berkeley National Laboratory, the International Alliance for Interoperability (IAI) was created AutomAting the estimAting process A variety of estimating software, written specifically for the construction industry, is available. Some programs focus on specific divisions and sub trades such as site excavation, mechanical and electrical. Others, written for highway and infrastructure contractors such as HCSS and Hard Dollar, are focused more on bid item, crew based, unit price estimating. For commercial building the leading developers include Timberline, MC2, WinEst and Vertigraph.
All of the commercial building programs involve use of a costing database in which many items are quantified and priced through the use of ‘high-level assemblies.’ A highlevel assembly enables you to break down the estimate into logical elements. For each high level assembly you will enter, digitize or select a variety of information pertaining to a construction activity and a collection of cost items are automatically generated and priced. Depending on the software program, these high level assemblies are called various names: work records, work packages, systems, models and assemblies.
The other option in automating any estimating process other than a database, assembly driven program is to utilize a spreadsheet application such as Microsoft Excel. We have
SpreadSheetS verSuS databaSe, aSSembly driven eStimating Software Disadvantages of database, assembly based estimating software includes: • Harder to learn and customize. • Requires higher level of support from the developer, resulting in higher support and maintenance costs. • More expensive and often more difficult to find adequate training. • Often does not give you the flexibility, Excel provides. • Can change the way you think through and develop the estimate. • Often provides more detail and complexity than required. • More detail, more maintenance, and possibly more room for error. • If resources are not dedicated to implementing and customizing the database, the estimating benefits are often not realized. Many estimating programs sit on the shelf and are never successfully implemented.
other consiDerAtions in selecting estimAting softwAre In selecting a computerized estimating system, factors to consider include: • How much more productive, knowledgeable and accurate will you become by implementing a new system? • Will the takeoff, estimating, accounting, scheduling and project management activities be integrated? • What is the cost? What are the benefits? Do benefits greatly exceed costs? What is the projected rate of return? • Do you have the personnel with the time and capabilities to implement and operate a new system? • Is the new system easy to implement and use? • What resources are required for training? • How much support and maintenance is required by the system vendor and at what cost? • Who is using the software successfully and unsuccessfully?
summAry If implementing a computerized estimating system, strong consideration should be given to the development of Excel estimating templates to perform the task. You should be looking at database, assembly driven commercially available takeoff and estimating programs only if the features you are seeking are not provided by a well-designed Excel, or other spreadsheet, estimating template. Digitizer based takeoff should be considered if you spend more than ten hours per month calculating quantities from paper plans. On-screen takeoff is increasing in popularity and can reduce costs and increase efficiencies in comparison with paper plan distribution.
About the author Erich M. Schoenkopf president of Vertigraph, Inc. a Dallas, Texas based company incorporated in 1991. Vertigraph is dedicated to providing information technology for the takeoff and estimating process. Erich can be reached at 800989-4243, info@Vertigraph.com or at www.vertigraph.com.
Digitize Directly on your screen from fi les with . . .
eTakeoffs of ePlans in Microsoft Excel. The drawing and measurement are saved with any cell. Calculate cuts & fills by digitizing on your screen.
You don’t work for our software, it works for you.
www.vertigraph.com
On-Screen Site Excavation Software
Our Canadian distributor Interworld Electronics 800-663-6001


