
27 minute read
Operating Projects


Debt Principles
The City’s debt policy, included in Appendix 6, provides a framework for utilizing this scarce resource in the most efficient and strategic manner. The core use of debt per the policy endorsed by Council is for asset renewal for core capital infrastructure including facilities, roads, storm water, sewer, and water assets. This ensures that the City’s focus is on maintaining core service levels for the community.
The City, like most others in North America, has a capital infrastructure deficit with many assets that are coming to end of their useful lives. Consequently, the focus in the 10-year financial plan is directed toward asset renewal. A secondary purpose of debt financing for the City is to fund capacity building programs for the significant growth the City is continuing to see within the community, to supplement the Development Cost Charges collected from developers to increase capacity of core infrastructure.
The borrowing limit in the policy as guided from BC legislation is on a percentage of stable ongoing City controlled revenues, 10 per cent for general funds which provides up to $50 million of borrowing, and 15 per cent for utility funds which provides up to $10-15 million of borrowing for each of sewer and water funds. The City’s overall borrowing limit is $65 million; therefore the use of debt financing must be strategic and ensure that debt capacity is available for upgrades most necessary across all City departments. The debt term recommended in the policy is 15 years, with a range of 10-20 years depending on the project. Variables to consider for each project are the estimated useful life of the underlying asset, the amount of debt funding required for the project, and the interest rates at the time of borrowing.
The longer the borrowing term, the greater the costs of borrowing which reduces future flexibility. A longer term does however provide for lower annual debt repayments. A shorter borrowing term reduces the overall costs of borrowing. The higher debt servicing costs associated with shorter borrowing terms reduces flexibility in the short-term, but the faster retirement of debt allows the City to better handle future changes in service needs. The City’s external borrowing agency, the Municipal Finance Authority (MFA) provides 10 year terms, with any terms greater receiving five year renewals. The City’s policy recommends 15 year terms to reduce the interest rate risk.
Budget Process
The City has a comprehensive budget process that includes significant strategic planning with Council, senior management, department managers and finance. Budgeting is essentially a continual, year-long process with various steps throughout the year.
Budget Debrief and Timeline
Following financial planning deliberations, the Finance Department performs outreach to the organization to debrief the budget process and determine what went well and what could be improved upon. In 2020, the COVID-19 pandemic quickly shifted the City’s focus from normal operations to emergency response operations and budget preparations were delayed.
While financial planning in 2021 was accelerated due to unknowns with the COVID-19 pandemic, 2022 financial planning returned to a typical budget schedule with formal Council deliberations beginning November 29th.
Council Pre-Budget Finance Meetings
The City held two pre-budget finance Committee of the Whole (COW) sessions for Council on November 2 and November 16. The first meeting summarized the current state of the City’s continued zero-based budgeting approach and provided some context as to how the continuation of such a policy would severely impact City operations in the near-term future. The second pre-budget COW provided an in depth exploration of how the City’s purchasing power has been eroded over several years of zero-base budgeting and recommended that Council consider an additional 0.75% tax increase to provide much-needed increases to operating budgets that had not seen an increase since before 2016. The second pre-budget COW gave Council the opportunity to review proposed permanent decreases in service levels provided to the community in order to maintain the base operating budget within policy guidelines as earlier directed.
Budget Planning and Direction
In late spring 2021, budget documents were rolled forward to 2022 and distributed to the organization under the theme “build back better”. This theme was designed to strengthen the City’s core operating budget to ensure adequate financial resources were available to withstand significant increases in the cost of providing City services as we continue our emergence from the pandemic.
At the initial budget planning meeting held with the City’s management group, the City Manager updated the management team on the budget theme and re-affirmed the need to focus on completion of existing projects and only adding absolutely essential new projects to the 10year plan.
Budget Building
September to October are core months for the Finance Department in compiling the budget documents submitted by department managers, and confirming funding sources. There are various meetings along the way to receive direction from senior management and to finalize recommended priorities for Council’s consideration. Under normal budget timelines, the entire management team is gathered to review budgets and determine where synergies may exist between projects, however with no new capital or operating projects being contemplated, and the COVID-19 pandemic limiting the group’s ability to meet in person there were fewer strategy and synergy meetings held.
Budget Finalization
Following the first pre-budget COW, Finance finalized the budget package. Council was presented the proposed financial plan package on November 19, in advance of the second pre-budget COW. This timeline ensured that Council had two full weekends to review the proposed budget.
Financial Planning deliberations are held over three days, normally in early December. This year, the deliberations began on November 30. First two readings of the 10year financial plan bylaw were given on December 7, 3rd reading was given on December 13 and final adoption occurred on January 10, 2022.
Public Input
Members of the public are invited to provide their comments on the proposed financial plan to Council by way of newspaper advertisements that run preceding budget deliberations. Members of the public are also able to make in-person comments or presentations to Council on the opening day of budget deliberations. The feedback process ensures that community members can provide valuable feedback to Council on the budget that is being considered. Additionally, all decisions made at Council meetings throughout the year and leading up to deliberations are publicly available on the City’s webcast of Council meetings, on the City’s website for agendas and meeting minutes, and Council meeting highlights of key decisions are posted to all media outlets after each meeting.
Monday, November 30
Tuesday, December 1
Wednesday, December 2
Time
9:30-3:30
9:30-3:30
9:30-3:30
Topic
-Public Feedback -Financial Planning Overview -Base Budget/Capital Budget -Capital Budget -Operating Projects -Ongoing New Service Levels -Ongoing New Service Levels -Financial Planning Summary
Budget Timeline – January to September 2021
January – June
January (continuous throughout the year)
Business cases are provided to senior management for consideration of new or enhanced services and/or significant capital project needs for financial planning
March
COVID-19 pandemic quickly changes City’s day-to-day focus to emergency response
June
City Hall and other facilities reopens to the public.
The Finance department’s primary focus during this time is on property tax collections.
July-August September
July
Council approves an accelerated budget timeline with deliberations to be held during the last week of October.
July 20
Budget documents are distributed to the organization on July 20.
August 14
All completed budget documents returned to Finance.
September
Weekly meetings between Finance budget staff and Senior Management begin
Sept. 11
Surplus projections are sent to management for updates.
Sept. 17
Surplus projections due back to Finance
Budget timeline for 2022-2031 financial planning is prepared, with a recommendation to accelerate financial planning.
Budget Timeline - October 2021 to January 2022
October 2021 November 2021 December 2021 January 2022
October 6
First pre-budget Committee of the Whole meeting, focussing on anticipated declining revenues in 2021 and base budget parameter.
October 15 and 19
Proposed 2022-2031 Budget Package presented to Council and then published for the public on October 19.
October 20
Second pre-budget Committee of the Whole meeting, focussing on permanent service reductions and Q&A for the budget package.
October 26-28
Financial planning deliberations with Council.
November 16
First three readings of 2020-2029 Financial Plan Amendment Bylaw.
November 30
Council meeting to review Non-Market Change (NMC) revenues following the release of NMC assessments from the BC Assessment Authority.
2020-2029 Financial Plan Amendment Bylaw Adopted.
December 7
First two readings of 20222031 Financial Plan Bylaw
December 14
Third reading of 2022-2031 Financial Plan Bylaw
January 10
Adoption of 2022-2031 Financial Plan Bylaw
Budget Amendments
Under Section 165 Financial Plan of the Community Charter Council must annually adopt a five-year financial plan that details:
• Objectives and policies respecting funding sources, the distribution of the municipal property taxes, and permissive tax exemptions;
• Proposed expenditures (including interest and principal payments on debt, capital expenditures, and other expenditures);
• Proposed funding sources (including municipal property taxes, parcel taxes, fees, other revenues, proceeds from borrowing); and
• Proposed transfers to or between funds (for each statutory reserve separately, surplus).
The Financial Plan Bylaw must be adopted prior to the adoption of the annual Property Taxation Bylaw. Section 165(9), commonly referred to as the “no deficit rule,” requires that the total of proposed expenditures and transfers to funds must not exceed the total of funding sources and transfers from funds.
Public consultation is required per section 166 of the Community Charter, prior to the proposed financial plan amendment being adopted.
Amendments to the budget can occur throughout the year due to unforeseen circumstances or emerging opportunities. The City’s Financial Plan is very detailed and itemizes each project and funding source, therefore Council will approve amendments to the Financial Plan as issues arise. These are communicated to the public through the Council meeting minutes available on the City’s website and subsequent “Council Meeting Highlights” that the City’s Communication department issues to all media contacts. The City strives, under normal circumstances, to have all amendments on individual projects or services presented for approval by Council by the last Council meeting in September, which is generally not a concern as that provides department managers three quarters of the year to identify any budget variances. This timeline allows the Finance department to provide an official Financial Plan Bylaw amendment to be presented to Council in early October for formal approval. Additionally, this allows updated values to be presented in the third quarter financial report presented at the end of October and provides updated funding figures for the budget package for the subsequent year to be presented to Council in late November for early December deliberations.
The City advertises the Financial Plan Bylaw amendment in the local newspaper providing opportunity for public input at the respective meeting where Council provides first three readings of the amendment. Depending on the feedback received, generally the bylaw amendment will be presented to Council for final approval at the next Council meeting.
For 2021, the COVID-19 pandemic set the City back in its preparations for a formal financial plan amendment. The amendment was adopted by Council on December 13.
Performance Measures
The City uses various tools to measure its performance, as can be seen in Appendix 8.
City Scorecard
The inaugural City Scorecard was included in the 2018 annual report. The City Scorecard provides measures and statistics about what is important to City operations and service delivery. The City uses these key performance indicators to guide corporate decision making; department measurement is continuously evaluated to ensure that it best reflects the measurement of community benefits and service delivery.
Community Survey
Monitoring and measuring community satisfaction is key to successful service delivery. As such, the City issues a community survey biannually to evaluate citizen satisfaction. A recent survey was completed in September 2019 with quality of life, satisfaction with City services and programs and excellent customer service among the high scores.
Citizens also said the most important issue facing Campbell River is homelessness and addiction issues, a change from the last survey, when the local economy was the top concern.
Top marks for services went to trails, water supply, sewage system and recreation programs. Services with lowest satisfaction ratings were bylaws and enforcement, public washrooms, transportation and traffic flow and snow and ice removal.

Quarterly Financial Reporting
The City prepares a quarterly financial report to Council explaining the actuals to budget for each base operating segment, as well as actuals to budget and status on operating and capital projects. Appendix 7 includes the fourth quarter report for 2021, which includes the base operating summary, segment graphs and variance explanations, and project appendices. This reporting provides accountability to department managers to deliver on initiatives approved by Council and to identify any variances as compared to budget on the base operating budgets or project budgets.
This comprehensive report also provides transparent and timely information to the community members, being presented within 6 weeks of the quarter end. This provides enough time for period cut-off, compilation of the information, correspondence with department managers, and review before being provided to Council.
With the early approval of the budget in recent years in December prior to the start of the budget year, and with regular financial reporting the City’s budgeting and accomplishment of approved work plans has increased substantially. The status chart is used for operating and capital projects to identify the status of the project. additional narratives for additional information are summarized below. The expectation is that most projects are in the “On Track” or “Completed” stage by the third quarter report, or they will be identified as a carry forward to the subsequent year with the CFWD column on the report.
(Grey circle) - Status Pending (Green circle) - On Track (Yellow circle) - Some Disruption (Red circle) - Major Disruption (Blue circle) - Completed
The report also includes a colour indicator in the appendices, green is the project is tracking as expected including multi-year projects, yellow means the project is facing some disruption to its planned timeline, red means the project has a major disruption to its planned timeline and may be cancelled. The delayed and canceled projects would have been presented to Council ahead of the quarterly reporting.
Regular quarterly reporting is resulting in the City’s budget process becoming more and more refined, and ensures that City staff are accountable to Council and the community for the delivery of approved work plans and operating within their approved budgets.
Financial Plan

Basis of Budgeting Basis of Accounting
The consolidated financial statements of the City are prepared on a modified accrual basis. All revenue is recognized on an accrual basis. Property taxes are recognized in revenue in the year they are levied. Utility charges are recognized as revenue in the period earned. Expenses are recorded in the period in which the goods or services are acquired and the liability is incurred.
Basis of Budgeting
The City’s Financial Plan is also prepared on a modified accrual basis. All revenue is recognized on an accrual basis. Property taxes are recognized as revenue in the year in which they are levied. Utility charges are recognized as revenue in the period earned. Expenses are recognized in the period in which the goods or services are planned.
Differences between the Basis of Budgeting and the Basis of Accounting
The City includes a budget for amortization expense, however does not tax for this expense and therefore the Financial Plan Bylaw includes an operating revenue line item for “Amortization offset”. The City’s financial statements (Appendix 7.2) include the amortization expense for actuals and budget but excludes the “amortization offset” revenue as this is considered a transfer.
Debt proceeds and principal repayments are included in the Financial Plan expenses, however for the City’s financial statements these are excluded from the Statement of Operations and instead are an increase or reduction to the Statement of Financial Position debt liabilities. Capital expenses for capital projects are included in the Financial Plan however are excluded from the City’s Statement of Operations and instead result in an increase to the City’s tangible capital assets on the Statement of Financial Position.
Any transfers to or from reserves and unappropriated surplus accounts as revenues or expenses to balance the Financial Plan are not included in the Statement of Operations in the City’s financial statements.
Following Public Sector Accounting Standards, the City’s financial statements in note 15 of Appendix 7.2 includes a note disclosure reconciling the annual surplus to the financial statements to the balanced net zero Financial Plan Bylaw. The adjustments include amortization offset revenue transfer, debt proceeds, debt principal repayments, capital expenses, and net transfer to or from reserves and unappropriated surplus.
Three Year Consolidated Fund Financial Schedules
REVENUE
Taxes & Parcel Taxes Payments in lieu of taxes Sale of services Services provided to other governments Transfers from other governments Investment and other income Other revenue Development Cost Charges Recognized Contributed tangible capital assets Gain/(loss) on disposal of tangible capital assets
Total EXPENSES
Wages & Benefits Contracted Services Other Operating Expenses Amortization Expense Utilities Insurance Debt Servicing
Total
2019 Actual 2020 Actual 2021 Budget 2022 Budget
34,213,916 35,854,588 37,897,588 38,440,387 683,089 711,370 703,700 714,300 25,065,270 23,816,603 24,438,051 31,429,748 1,545,783 1,596,147 1,728,034 2,222,422 4,961,949 13,423,631 5,862,941 7,540,321 1,869,796 338,391 921,336 1,823,923 2,345,745 285,472 321,863 413,948
248,992 1,351,905 10,227,164 2,639,297 (46,126) (311,012)
-
79,108,224 80,289,337 72,776,100 83,106,872
24,766,557 25,196,012 26,481,818 28,218,681 17,763,116 17,037,502 17,411,796 17,550,657 7,243,454 6,947,563 6,710,845 7,643,068 10,637,391 10,323,551 9,380,800 10,296,551 2,406,005 2,307,721 2,429,531 2,672,250 542,581 525,724 520,417 454,851 597,520 412,844 637,691 403,071
63,884,828 62,787,616 63,425,154 67,421,969
NOTE: Funds do not reconcile as some non-cash items, debt proceeds, principal repayment, transfers to and from reserves and unappropriated surplus are not included above. Year-end financial statements reconcile the difference between the statement of operations and the financial plan.
2022 - 2031 Financial Plan and Funding

2022 Base Operating Budget Summary
The focus for base budget is maintaining base service levels with a zero base increase directive that only provides cost increases for contractual obligations, insurance, utilities, and collective wage and benefit agreements. Providing for base budget inflationary costs ensures financial stability for taxpayers, while maintaining existing service levels to ensure sustainable service delivery to the community. This mandate has been set to ensure that base service levels remain the same as prior years while staying within reasonable parameters to account for inflationary increases.
The City provides a variety of services to the community including:
‒ Top quality drinking water and sewer services
‒ Garbage, recycling and yard waste collection
‒ Streets, sidewalks and traffic control ‒ Transit and airport services
‒ Parks, recreation and culture programs and facilities
‒ Planning, development and building inspection
‒ Policing and fire protection services ‒ Sustainability and green initiatives
‒ Economic development and downtown revitalization The City’s mandate is to provide services to its citizens and therefore the primary driver of the City’s expenses are staff wages and benefits to provide those services. The City does contract out some core services including RCMP, Transit, and Solid Waste. The collective agreement wage increases for staff, as well as these core services contracts, are the key drivers of the base operating budget increases.
The proposed net operating budget for the general fund provides for $1,632,600 of taxation funding need. This amount includes $549,000 of non-market change revenues, $228,800 for capital infrastructure, and $574,800 for ongoing new services. As per the Financial Stability and Resiliency Policy, Non-Market Change (NMC) must first be applied to the base budget to ensure it stays within the 1.5-2 per cent budget parameter. In 2022, all of the anticipated NMC has been applied to the base budget. The major drivers of the base budget increase relate to increases in the RCMP contract, declining revenues at the airport and contractual increases for service provision, namely transit and solid waste collection.
See Appendix 1 for the detailed base budgets by segment and department.
2022 Base Operating Budget Summary Continued
A summary of the consolidated budget by fund is summarized below. The detailed department base budget information before consideration of approved new service levels can be referenced in Appendix 4.
Column1 Revenue
Expense
Airport Operating General Operating Sewer Operating Water Operating 2021 Budget 2022 Approved Budget
Revenues
Revenue is budgeted based upon trend analysis from prior years and estimates based on analysis of projected activity. Main sources of revenue for the City include taxation and fees and charges.
The budget’s key assumption includes:
‒ That user fees will grow by an estimated 0.5 per cent -1 per cent per year.
‒ Water, sewer, and solid waste user fee rates are increasing an average of 3.2 per cent from 2020 until 2022 as per the User Fee and Charges Bylaw.
This ensures sustainable service delivery with ongoing capital renewal and enhancements across the community.
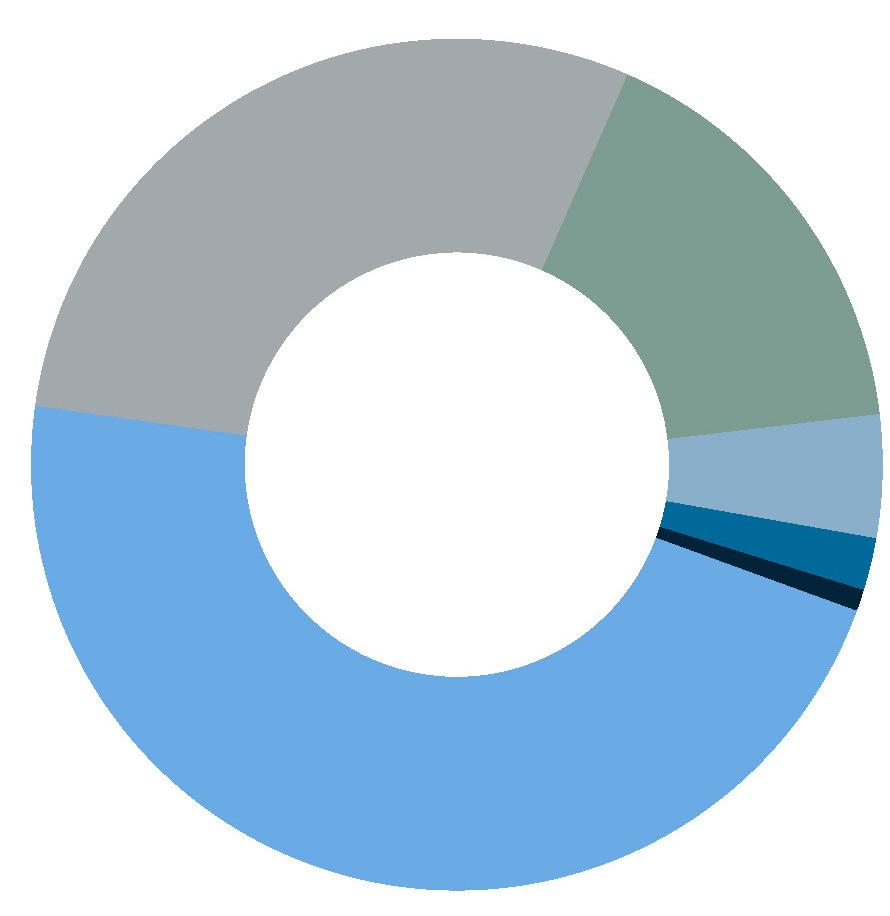
Revenues by Type
Fees and Charges
$25,407,009 • 29%
Taxes
$40,382,372 • 47% Transfers from own funds
$14,297,317 • 17%
Other Revenue
$4,038,125 • 5%
Sales of Goods and Services
$1,728,808 • 2%
Investment Income
$666,423 • 1%
Each municipality is different in the types of services it offers, and which services the relative Regional District provides versus the municipality within each community. This high level chart identifies that the City’s 2021 taxes and user fees are within the average as compared to its similar sized municipalities in both in BC and across Vancouver Island.
2021 Taxes and User Fees on an Average House
BC AVG $4,639 CR $4,668
Langford Port Alberni North Cowichan Penticton Courtenay Vernon Campbell River Mission West Kelowna
Municipal Taxes & User Fees Provincial & Regional Taxes Average $4,639 Port Moody
*Average house in Campbell River $455,600; Source Ministry Municipal Affairs
Taxation — Comparison to other Communities
Each community offers a variety of different services, has a variety of different taxpayer class distributions, and has various other source revenues and grants that drive the need for taxation revenue. Campbell River taxes continue to compare favourably with similar communities in size and service make up within the Province for municipal and parcel taxes as summarized in the charts below.
2021 Total Taxes and User Fees on an Average House (for Communities with Population between 15,000 - 50,000)
$12,000
$10,000
$8,000
$6,000
$4,000
$2,000
$0
BC AVG $5,158 CR $4,668
Municipal Taxes & User Fees Provincial & Regional Taxes BC Average $5,158
*Average house in Campbell River $455,600; Source Ministry Municipal Affairs
Property Taxation Policy
Property taxation is the single largest revenue source for the City of Campbell River, similar to almost all Canadian municipalities.
Property taxes are levied based on rates set in accordance with Council Policy as noted in the Financial Plan Bylaw Schedule, with different property classes paying different rates.
The purpose of the Tax Policy is to outline the proportions of revenue sources, the distribution of property taxes among property classes, and the communication of any tax changes from the prior fiscal year.
‒ To provide City taxpayers with stable, equitable, and understandable property taxation while providing high quality services.
Policies
1. Tax rates will be adjusted annually to eliminate the impact of increases or decreases in assessment due to market changes, as identified by the British
Columbia Assessment Authority.
2. Class 1 (Residential) – the City will strive to maintain a residential tax rate that provides for average municipal taxation on a representative household with its comparator communities of similar size and of those Vancouver Island communities with a population between 10,000 and 50,000.
All data used to compare Campbell River against other communities shall be sourced from Local
Government Statistics provided by the
Province of BC. 3. Class 3 (Supportive Housing) – the City will maintain a tax rate equal to Class 1 (Residential).
4. The City will strive to ensure all other classes of property receive an equal allocation of the percentage change in the annual tax levy.
5. The City may review its tax rates by property class as compared to the provincial average on a minimum three year basis to ensure rates are comparable and reasonable given assessed values in Campbell River as compared to other communities. 6. When necessary, tax class realignments will occur incrementally over a multi-year period.
7. New tax revenues related to the City’s downtown revitalization tax exemption bylaw will be allocated to the downtown capital program.
8. The City’s tax increase will be communicated as a percent increase over the prior year’s general municipal revenue collected and calculated based on total taxes required to balance the budget.
Taxation – Tax Class Distribution
The British Columbia Assessment Authority provides property value market assessments to all municipalities in BC and determines what taxation class each property belongs to. Tax rates are set at a dollar amount for each $1,000 of assessed value as provided by the BC Assessment Authority.
Find the City’s history on the distribution of municipal property taxes on the next page.
The preliminary estimates indicate the City’s tax distribution between classes will be similar to prior years. The final figures will be provided by BC Assessment in March 2022 and will be considered when building the City’s Tax Rate Bylaw, including principles from the City’s Property Taxation policy, which will be presented to Council in April 2022.
Class 1 - Residential Class 2 - Utilities Class 4 - Major Industry Class 5 - Light Industry Class 6 - Business & Other Class 7 - Managed Forest Class 8 - Recreation / Non-Profit Class 9 - Farm Total
2020 Budget 2021 Budget 2022 Approved Budget
25,336,837 73.2% 26,446,760 73.5% 27,921,454 74.1% 1,176,902 3.4 1,187,406 3.3 1,243,466 3.3 69,230 0.2 71,964 0.2 37,681 0.1 346,148 1.0 359,820 1.0 339,127 0.9 7,269,103 21.0 7,520,235 20.9 7,799,920 20.7 346,148 1.0 287,856 0.8 263,765 0.7 69,230 0.2 107,946 0.3 113,042 0.3 1,178 0.0 1,178 0.0 1,178 0.0
34,614,774$ 100% 35,983,165 $ 100% 37,719,633 $ 100%

Taxation – Non-Market Change
The City is provided Non-Market Change (NMC) assessment value estimates annually by the BC Assessment Authority in mid-November. NMC reflects changes in assessed values that are unrelated to market influences and is more commonly referred to as “new construction” assessments. New construction typically constitutes the majority of the City’s NMC values, however other factors can lead to NMC increases or decreases. Some of these changes include:
• Properties which change assessment class – e.g. an industrial property changes to a business property.
This would result in an NMC decrease to Class 5 (Light Industry) and a corresponding NMC increase to Class 6 – Business. The net effect on taxation would be based on class tax rates.
• Revitalization Tax Exemption programs – when a property is under construction over a multi-year period, the BC Assessment Authority will increase its value as construction occurs. Once construction is complete, and a revitalization tax exemption commences, there is negative NMC generated because the formerly taxable value on construction is removed from the tax roll.
• Demolitions will result in a reduction to NMC.
NMC is generally positive and tends to follow development cycles; when development is at high levels, the City can expect higher NMC amounts which the City has seen for a number of years per the table on the next page. The Financial Stability and Resiliency policy states that NMC will first be applied to the base budget to ensure it falls within the 1.5 to 2.0 per cent base budget parameter. Subsequently, remaining NMC can either be utilized to offset base budget increases and/or support ongoing new service levels (Appendix 4). The strong revenues the City has realized in recent years has offset some of the financial burden from previous years, however Council is ensuring that they are incremental in increasing service levels, replenishing previously cut services, and looking to ongoing service needs for the growing community to ensure sustainable service delivery in the future.
Non-Market Change
Total Estimated
7,800 - 19,100 4,800
- - (2,400)
641,800$
-
635,700$
-
566,200$
(100)
544,800$

Property Taxation
Property and parcel taxation is the single largest revenue source for the City of Campbell River (similar to most Canadian Municipalities). Taxation revenue is decided upon by Council each year during the annual financial planning budget process and is reflective of the City’s base operating and capital needs.
Components of taxation includes:
• 0.5 per cent for capital investment in infrastructure.
• 1 per cent of revenue from utility companies. • Parks parcel tax of $37 per parcel. • Storm parcel tax of $60 per parcel; increasing to $60 in 2021, and $72 in 2022.
• Payments in lieu of taxes for 5 provincial properties and 2 federal properties.
• Local service taxes for local improvements per bylaw and Business Improvement Areas per agreement.
Fees and Charges
Fees and charges represents the next largest source of revenue for the City below taxation. As expenses continue to increase due to inflation and rising costs there will be additional fee reviews performed in 2022 for recreation user fees.
• Administration fees.
• Third party shared services contract fees (e.g.
Animal Control, Transit, Fire, Water).
• Bylaw enforcement fees and fines. • Freedom of Information requests.
• Fire permit fees.
• Property tax searches.
• Development and building license, permit, and application fees.
• Transit fares.
• User fees for garbage, recycling, water and sewer.
• Airport improvement, landing and parking fees.
• Recreation programming and centennial pool fees. The table below summarizes the City’s major utility user fees for single family residences from 2017 to 2022 with the utility rates approved for five years in the fall of 2017:
Column1
Sewer Water
Transfers from Own Funds
Transfers from own funds includes transfers to and/or from reserves to offset taxation required for services.
Services include:
‒ Community energy efficiency programming. ‒ Funding for operating projects (one-time service level requests), if funds are available from prior year surplus.
‒ Repayment to capital lending reserve for past projects such as the Airport Fueling Station.
‒ Transfer of Gaming funds from reserve to fund operating projects funded by Gaming, such as
Council Contingency and previously approved ongoing service level requests (e.g. downtown façade, downtown signage incentive programming, downtown small initiatives funds).
‒ Transfer of annual Gaming revenues to reserve.
‒ Carbon Neutral Reserve contribution.
‒ Annual ongoing capital reserve contributions.
‒ Capital allocation per net funding model contributions.

Other Revenue
Other Revenues are often reliant on third party and or market conditions. They are comprised of the following:
‒ Grants.
‒ Strategic Community Investment Funds (SCIF) from the Province based on traffic fine sharing revenue. ‒ Property leases.
‒ Airport concession fees.
‒ Gains on disposals of assets.
‒ Administration fees.
‒ Donations.
‒ Fortis franchise fees.
‒ The Municipal and Regional District Tax (MRDT) for the City’s hotel tax, which started in 2017, is utilized for tourism services.
‒ Sales Of goods and services.
‒ Garbage tags and recycling blue boxes.
‒ Disc golf rentals.
‒ Criminal record checks.
‒ Zoning application fees.
‒ Aviation fuel sales.
‒ Cemetery plots grave liners and internments.
Investment Income
Investment income represents a small portion of revenue for the City. The City currently has an investment policy; however, a review was completed in 2021 so that the City can maximize and leverage investment income earning opportunities.


