
6 minute read
Figure 16: Exile Bay Sub-surface Drainage Network


Figure 16: Exile Bay Sub-surface Drainage Network
8.MODEL CALIBRATION & VALIDATION
Advertisement
8.1 Overview
Prior to using a model for design flood estimation, verification of the model’s suitability is required. For the current study this has been completed via:
• Calibration: using recorded rainfall data and confirming modelled flood behaviour against observed flood behaviour (see Section 8.2); and • Validation: undertaking a comparison to nearby and similar catchments which have been calibrated/validated (see Section 8.3).
Due to a lack of stream gauges in the study area, calibration relies heavily on the collection of relevant historic flood data. This data includes:
• Historic flood observations, photos and videos from long-term residents, newspapers and
Councils records; and • Observed rainfall data and pluviometer data from historic flood events (see Section 3.4.2).
This information is then used in the calibration process as a basis for adjusting parameters, such as losses, percentage impervious and Manning’s ‘n’ values, to achieve agreement between recorded and simulated flood behaviour.
Following calibration, model validation is undertaken to build confidence in the flood modelling system. This process has been carried out by comparison of known unit flow rates for the 1% AEP 2 hour event (ARR 1987) with similar catchments in the Sydney Metropolitan area. Further, comparison of known local flood locations in the study area (based on community feedback and Council knowledge) for preliminary design flood events is also undertaken.
8.2 Confirmation of Flood Behaviour
Two flood events occurred in Exile Bay during the community consultation period in late 2018. These events occurred in October 2018 and November 2018. Rainfall analysis and discussion of these events are provided in 3.4.2. The community submitted observations, photos and videos of flooding for these events. This observed data was used to calibrate the model by adjusting parameters such as losses and Manning’s ‘n’ value.
The following sections will provide a comparison between observed and modelled flood behaviour in the November 2018 and October 2018 flood events. The November 2018 event was a larger magnitude event than the October event. Residents submitted data for both events and as such both events have been calibrated to.
8.2.1 November 2018 Event
Rainfall data from the Greenlees Park Bowling Club gauge (566064) (discussed in Section 3.4.2) was input into the flood modelling system for the November 2018 event. Modelled flood behaviour was matched to the following images and observations by adjusting the rainfall losses and Manning’s roughness values (discussed in Sections 6.5 and 7.4 respectively).
Figure 17 presents the peak flood depths for the 28th November 2018 event and the calibration points and their respective identification numbers.
ID 01 – McCarthy Lane
Photos were submitted via the community consultation which depicted a pit on McCarthy Lane surcharging approximately 45 minutes after the storm peak on the November 2018 event (6:46 am photo taken, storm peak 6:00 am). Results were extracted from the flood model at the time that this photo was taken. The following images provide a comparison between observed flood behaviour and the modelled flood behaviour.
Image 3: McCarthy Lane, Observed Flood Behaviour
Image 4: McCarthy Lane, Modelled Flood Behaviour
Red arrow indicates the location of the photograph.


The observed flood behaviour (Image 3) depicts the extent of flooding to roughly the tree on the left side of the image. Similarly, the modelled flood behaviour (Image 4) reproduces this extent. Given the extent match a depth match is assumed. As such, this result indicates a clear match between modelled and observed flood behaviour.
ID02 – Brewer Street and Majors Bay Road
Photos depicting the flood affectation experienced at Brewer Street and Majors Bay Road were obtained through the community consultation for the November 2018 event. These photos were taken approximately 50 minutes after the peak of the rainfall event. As such, results were extracted from the flood model at the time the photograph was taken and are presented below.
Image 5: Brewer Street and Majors Bay Road, Observed Flood Behaviour
Image 6: Brewer Street and Majors Bay Road, Modelled Flood Behaviour
Black arrows depict flood velocity
Red arrow indicates the location of the photograph.

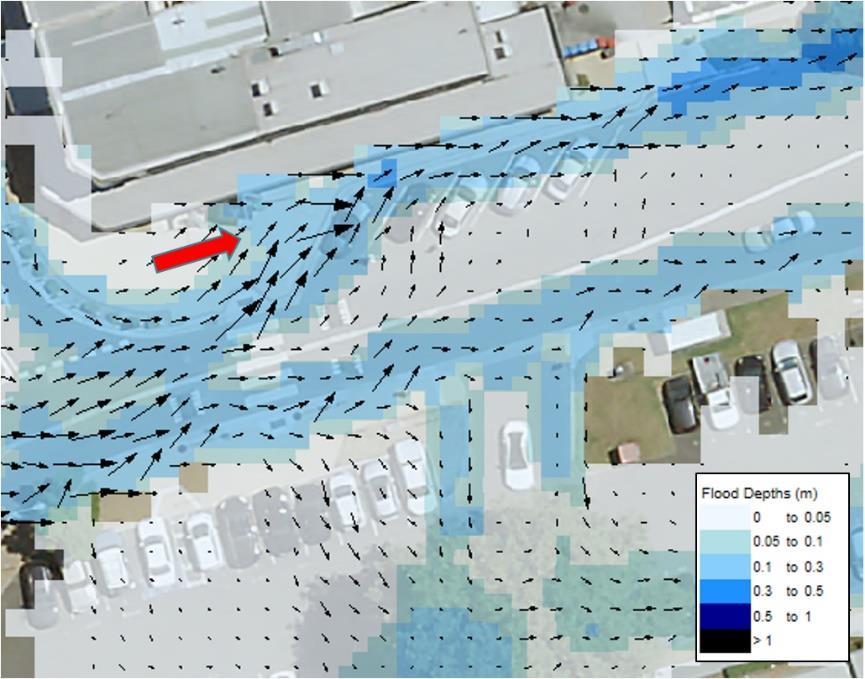
The observed flood behaviour at this location (Image 5), depicts flood depths which have exceeded the level of the kerb and fast moving water, flowing down Brewer Street. This flood behaviour has been replicated in the modelled flood behaviour (Image 6), as flood depths are approximately 0.2 m and flood velocities reach up to 2 m/s at this time.
ID03 – Davidson Avenue and Majors Bay Road
Photographs of the flood affectation at the intersection of Davidson Avenue and Majors Bay Road were submitted though the community consultation. As with ID01 and ID02, flood results were extracted from the flood model at the time that the photograph was taken. A comparison of observed and modelled flood behaviour is provided below.
Image 7: Davidson Avenue and Majors Bay Road, Observed Flood Behaviour
Image 8: Davidson Avenue and Majors Bay Road, Modelled Flood Behaviour
Black arrows depict flood velocity
Red arrow indicates the location of the photograph.


The observed flood behaviour (Image 7) shows fast moving water entering Majors Bay Road from Davidson Road. In the foreground of Image 7, flood levels are shallower and becoming deeper (~0.5 m) toward the Majors Bay Road roundabout. The modelled flood behaviour (Image 8) similarly
reproduces this flood behaviour of fast-moving water becoming deeper up to 0.5 m on Majors Bay Road.
ID04 – Davidson Avenue
A video depicting fast moving water moving along Davidson Avenue in the November 2018 event was submitted by a community member. The images below provide a comparison between this observed and modelled flood behaviour.
Image 9: Davidson Avenue, Observed Flood Behaviour
Image 10: Davidson Avenue, Modelled Flood Behaviour
Black arrows depict flood velocity
Red arrow indicates the location of the photograph.


The observed flood behaviour, presented in Image 9, and the video submitted by a resident showed fast moving water flowing along Davidson Avenue with deeper depths occurring in the road gutters and shallow depths at the centre of the road. This flood behaviour has been reproduced in the flood model, with flood depths of up to 0.3 m in the gutter and velocities of up to 1.5 m/s.
It is important to note that while the modelled flood behaviour (shown in Image 10) is notably more extensive than the observed flood behaviour (in Image 9), a key reason for this is the unknown video timestamp. The video submitted by the resident did not have a timestamp and as such, comparison was made using the modelled flood peak. It is likely that the video was not taken during the flood peak and therefore, some extent differences can be seen.

