Durham County 2021 Digital Inclusion Profile

Prepared by:
Roberto Gallardo, Ph.D.
February 2023


Prepared by:
Roberto Gallardo, Ph.D.
February 2023
The objective of this digital inclusion profile is to provide communities an overall understanding of their digital landscape. While this landscape is not meant to be comprehensive, it does utilize multiple sources including the U.S. Census, Bureau of Economic Analysis, Lightcast (formerly known as Economic Modeling Specialists or EMSI), and the author’s regional development and digital inclusion expertise. 2021 Census tracts as well as county-level data were utilized. Most variables were divided into three equal groups (same number of Census tracts per group) based on all tracts in the state: low (lighter color, moderate, and high (darker color)).
The profile should be interpreted along three main sections. The first section (slides 3-11) provides socioeconomic and specific internet and device information under which digital inclusion is taking place. These are important to keep in mind as research shows that these characteristics impact technology adoption and use.
The second section focuses on broadband availability (slides 12-16) including number of 100/20 megabits per second (Mbps) providers, percent population with 100/20 Mbps and 100/100 Mbps, and average download and upload speeds in Mbps.
The third section (slides 17-30) includes covered population characteristics as specified in the Digital Equity Act. The objective is to identify “hotspots” in the community with an above average share of individuals or homes with these characteristics.
The last section (slides 31-35) include variables that should improve as the community becomes more digitally inclusive over time with a focus on workforce and economic development. However, as efforts are underway, metrics included in section 2 should also improve over time.
Four innovative metrics developed by the author are included to help “summarize” this complex issue.
The first variable is called the Internet Income Ratio or IIR (slide 28). A higher IIR denotes a higher inequality based on internet access and income. The IIR is the share of homes making less than $35k with no internet divided by the share of homes making $75k with no internet. An IIR of 2 means the share of lower income homes with no internet is 2x higher than the wealthier homes.
The second is digital distress (slides 11 & 29). Digital distress refers to an area with an above average share of homes with no internet access or relying only on cellular data as well as homes with no computing devices or relying only on mobile devices. The share of homes for the county, region, state, and nation in high digital distress was included as a point of reference. The map should help identify these “hotspots” (darker color).
The third innovative metric is the digital divide index or DDI (slide 30). The DDI consists of three scores: infrastructure/adoption, socioeconomic, and the overall digital divide index. For simplicity purposes, only the overall DDI was included in this profile. The higher the score, the larger the divide. The share of homes in tracts with the highest digital divide index score was included as well as a map identifying digital divide index “hotspots” (darker color).
The fourth metric refers to the remote work potential (slide 33). This metric is still being researched to tease out its specific implications, but the idea is simple; the more digital inclusive a community, the lower the difference between remote work friendly occupations in the community and the share of those working from home.
Once these digital inequalities are addressed, the idea is that the community’s overall quality of place, economic, and workforce development situation will improve.
United States North Carolina Triangle J Durham County
Source: Census Population Estimates
Note: 1990 = 1
Less than High School High School Some College Bachelor's or Higher
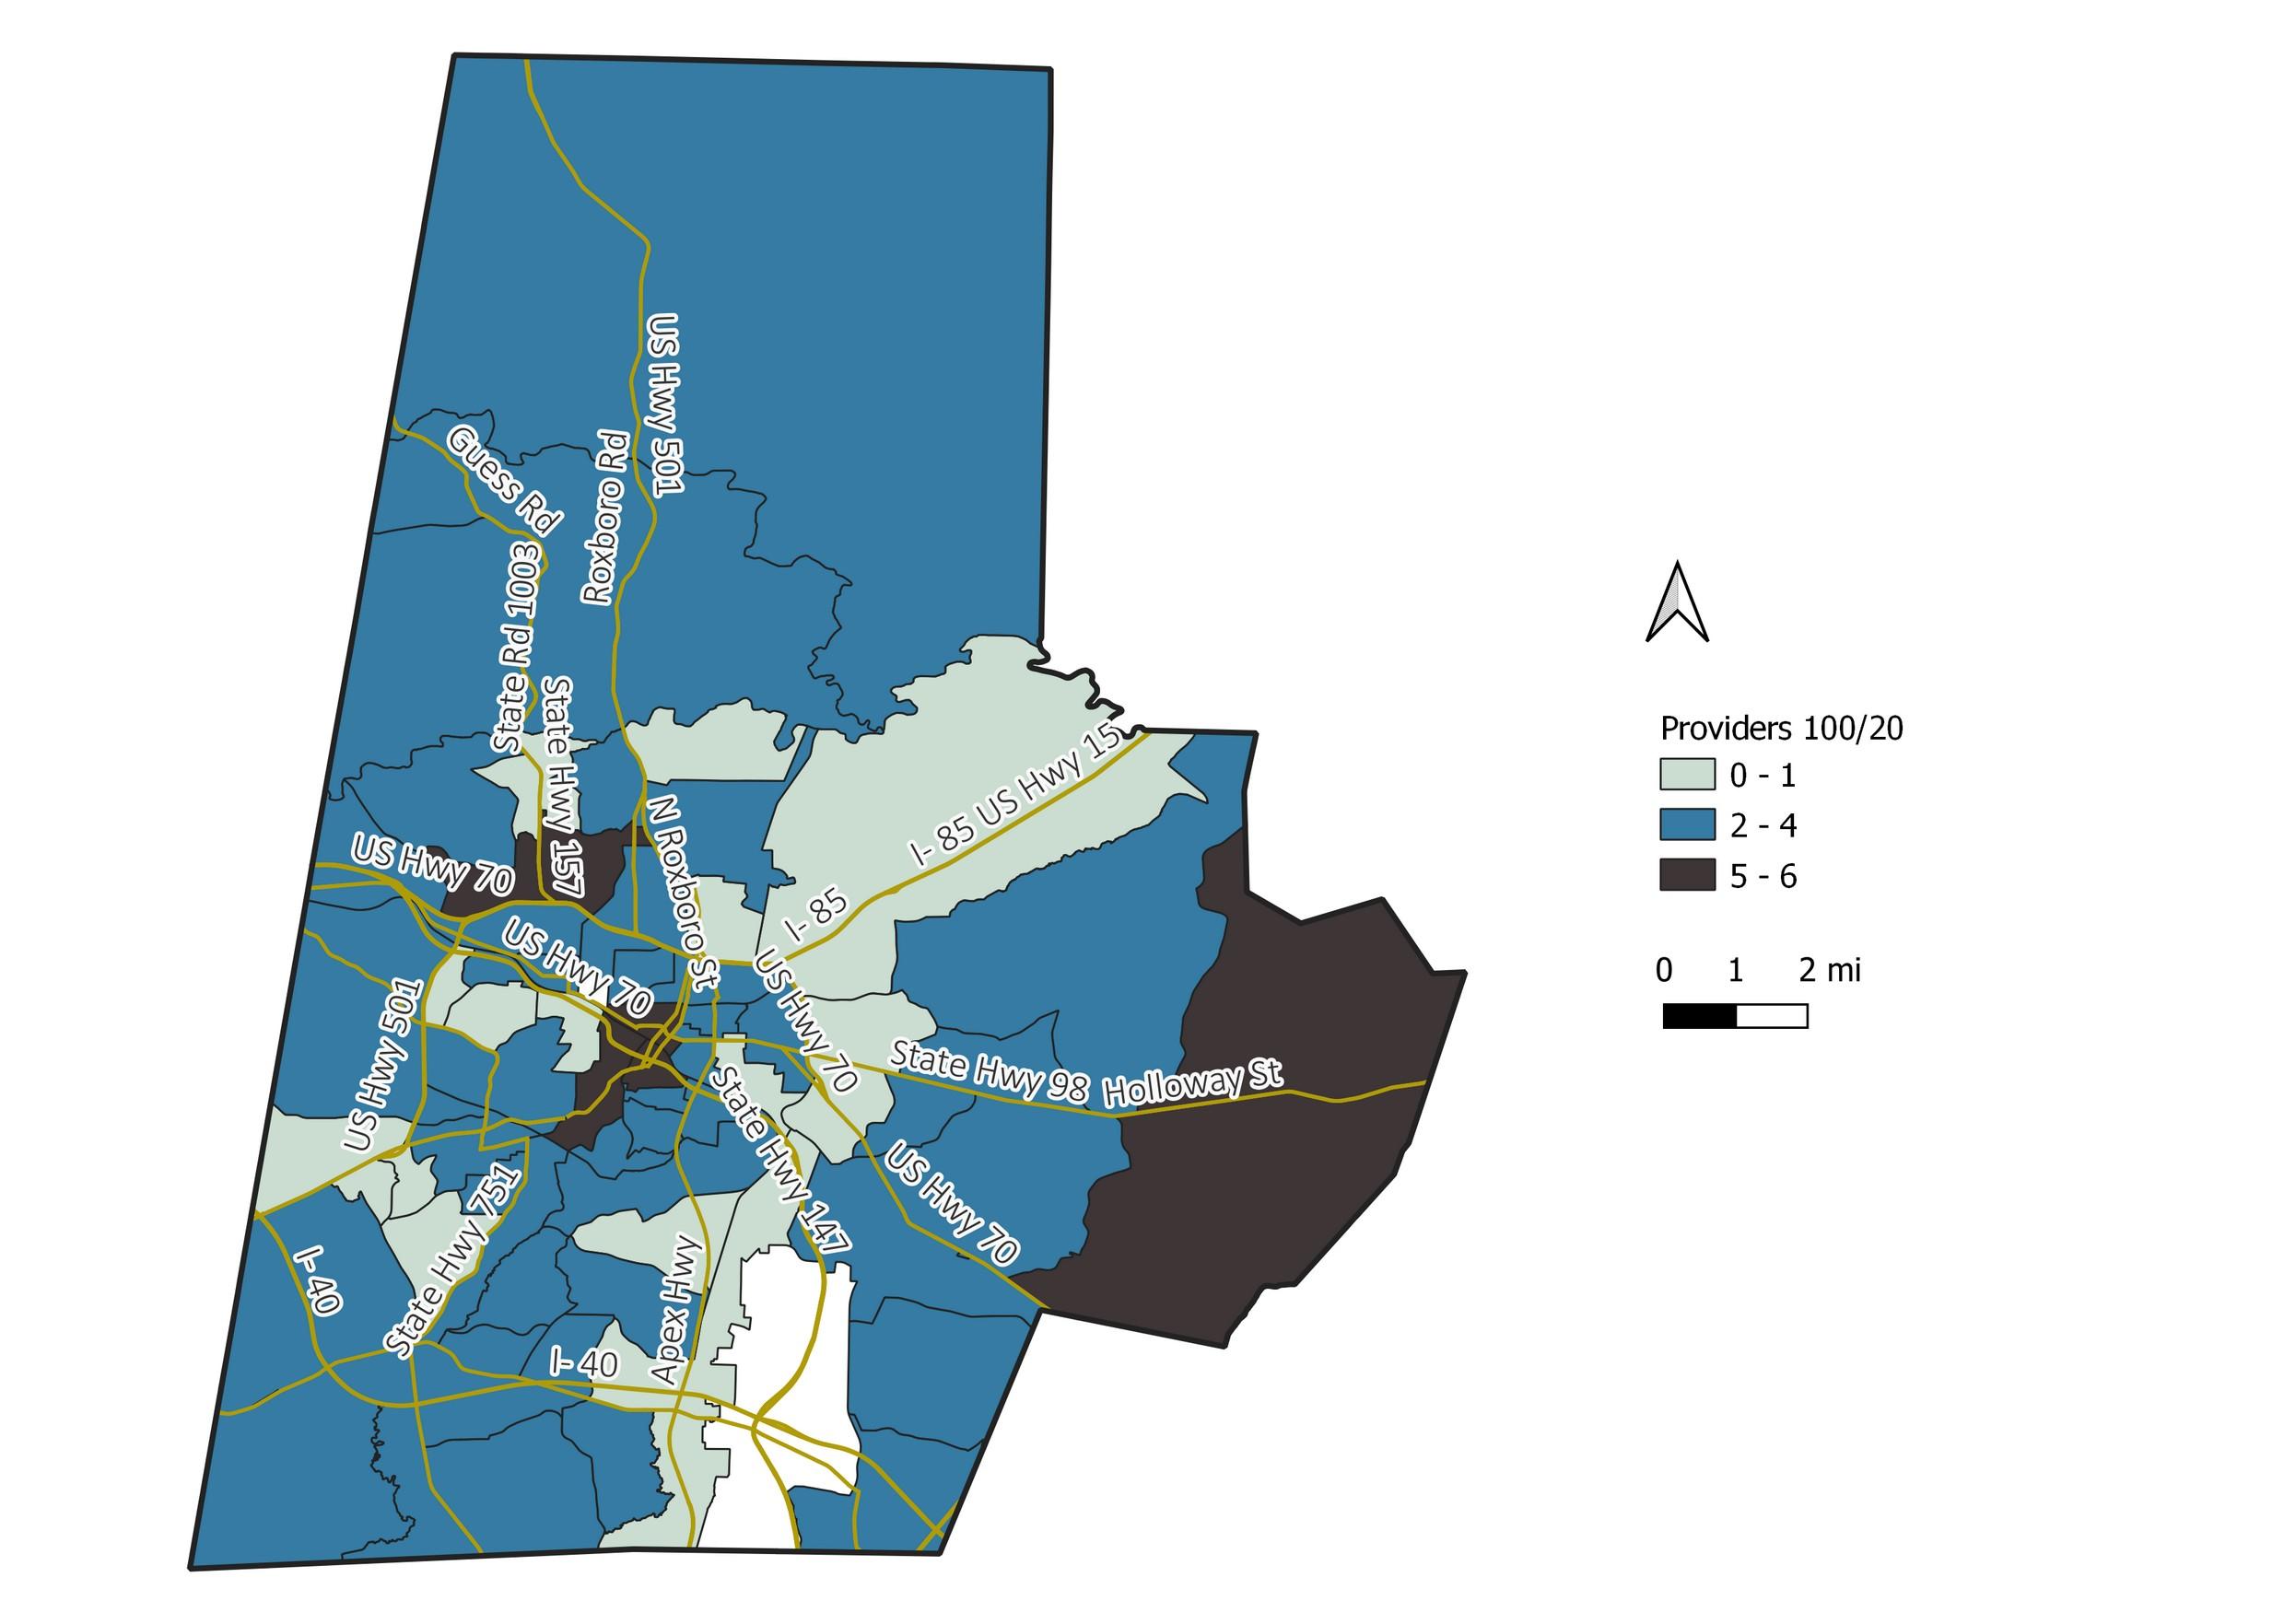

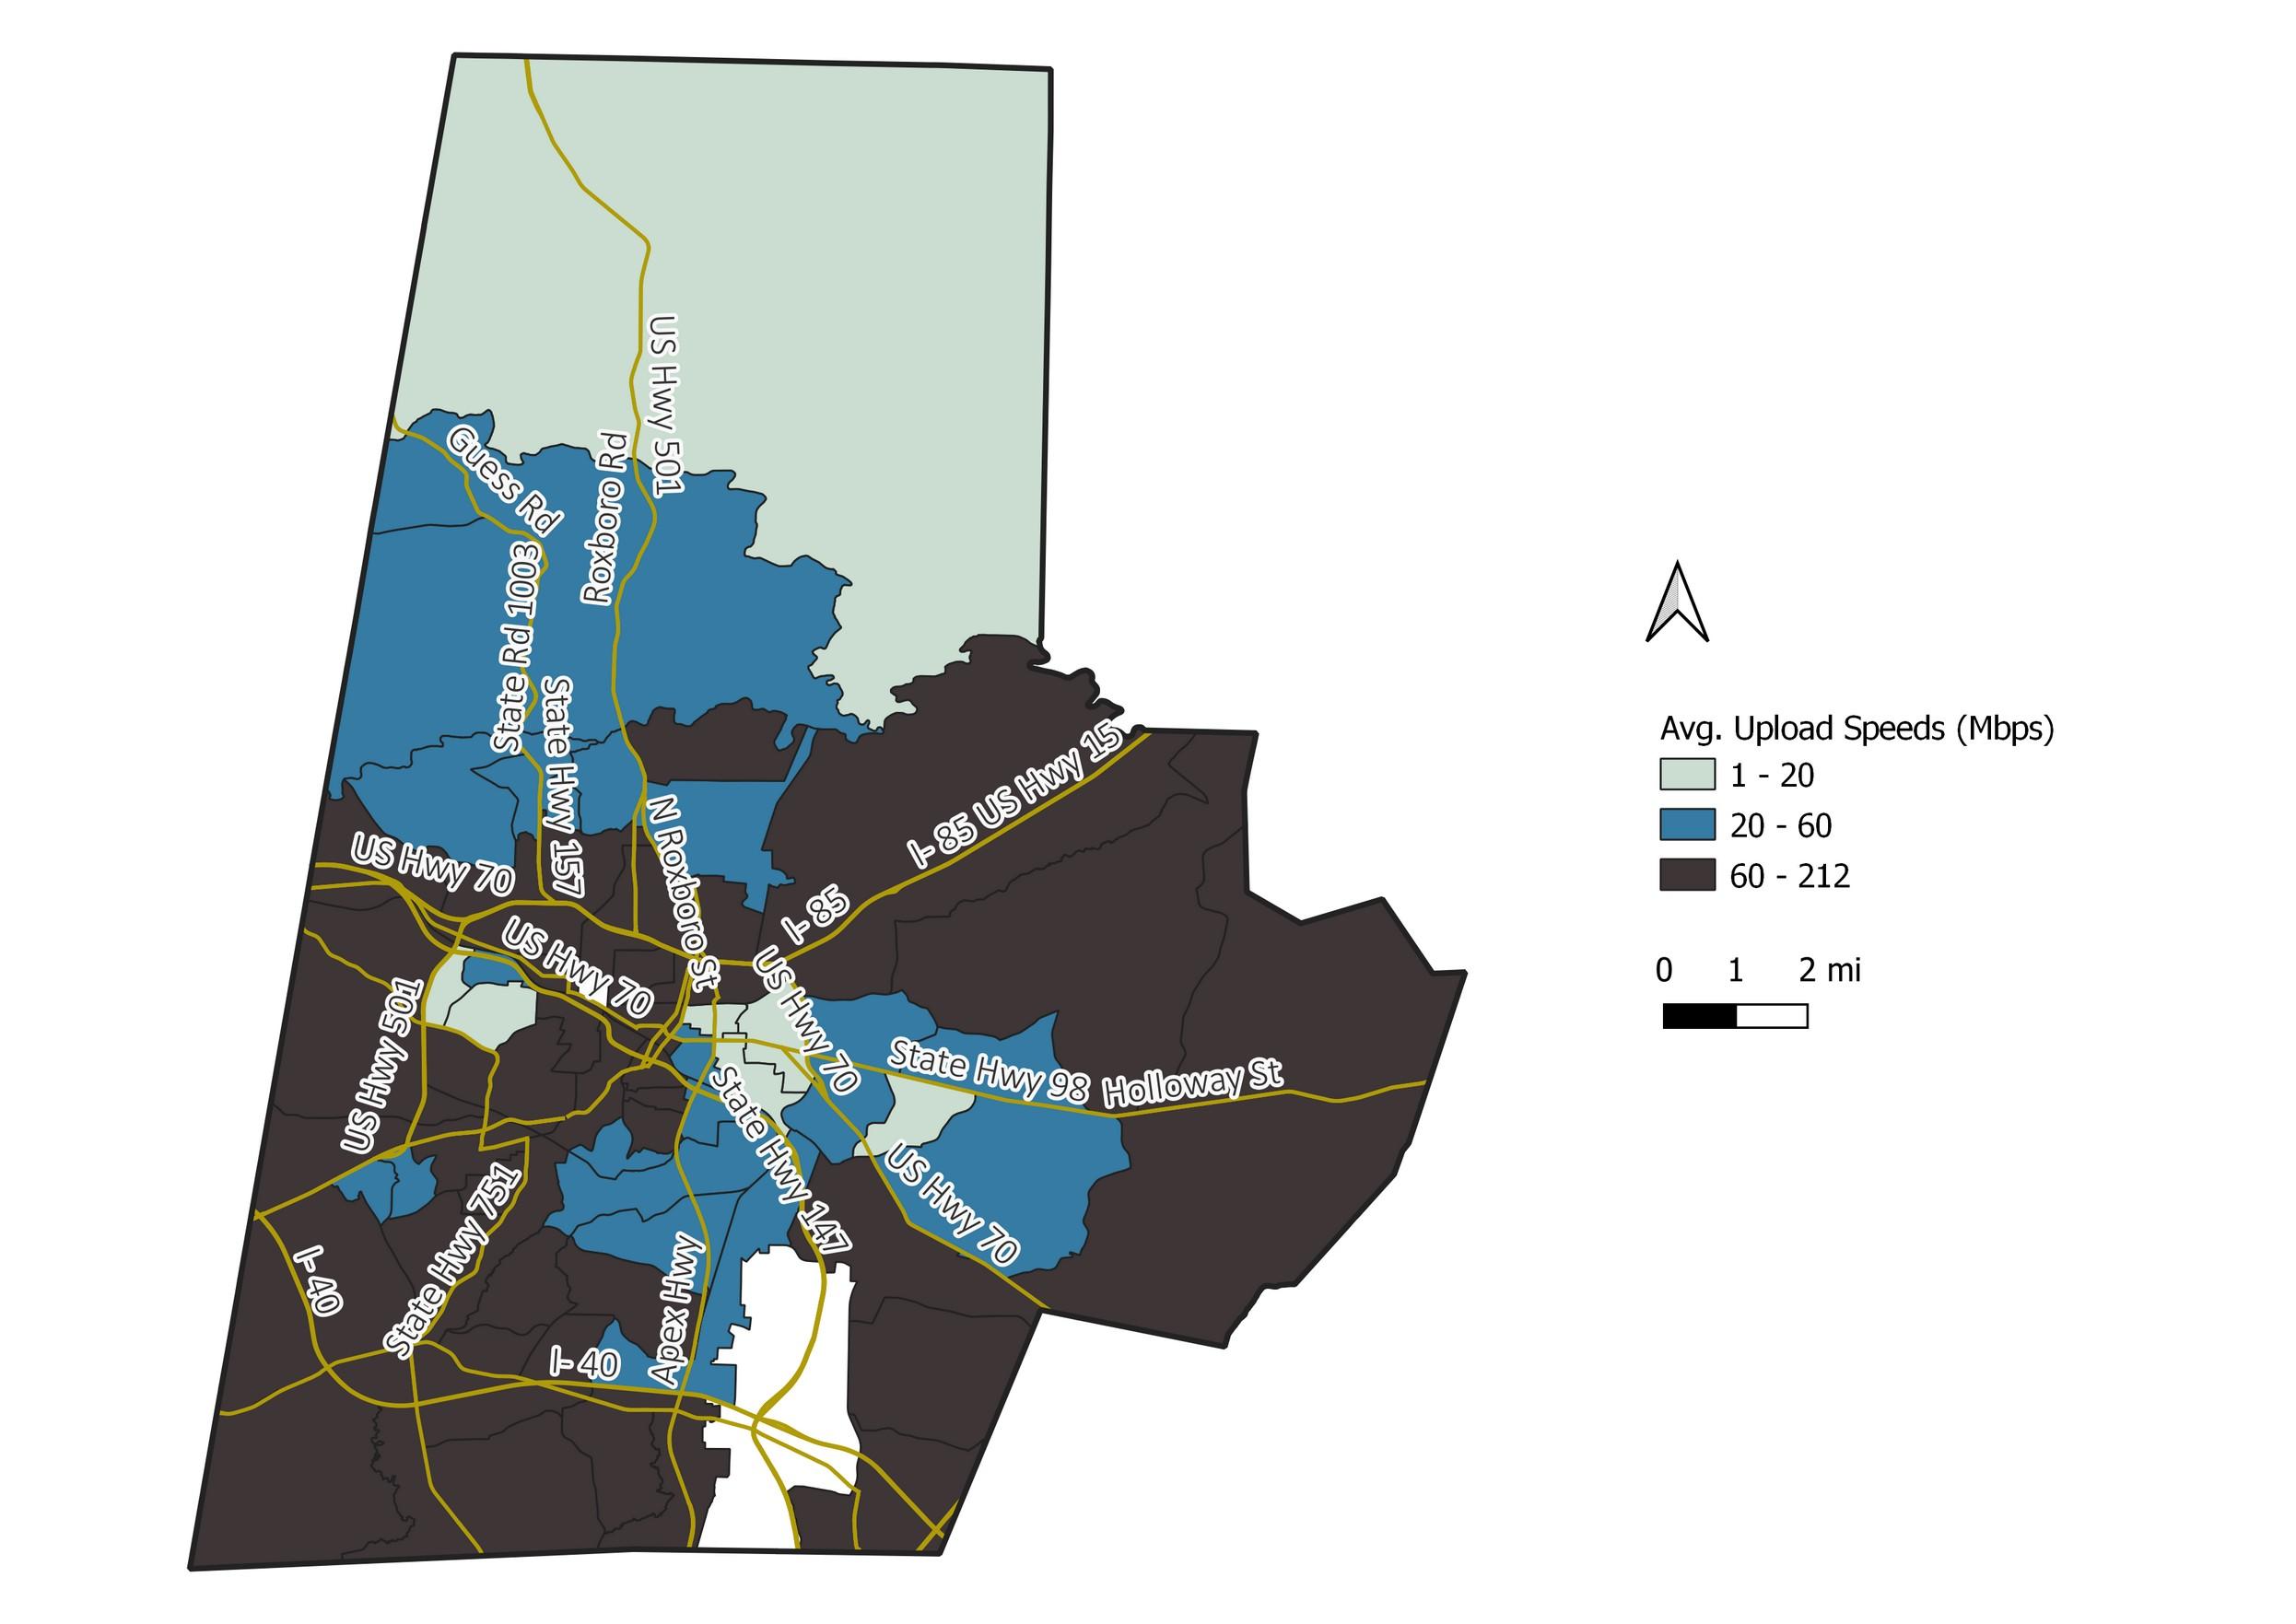

Source: Q1-Q4 2021 Speedtest® by Ookla® Global Fixed Network Performance Maps

Source: Q1-Q4 2021 Speedtest® by Ookla® Global Fixed Network Performance Maps

Source: 2017-2021 Census 5-Year ACS
*Preliminary figures based on 425 housing units per square mile
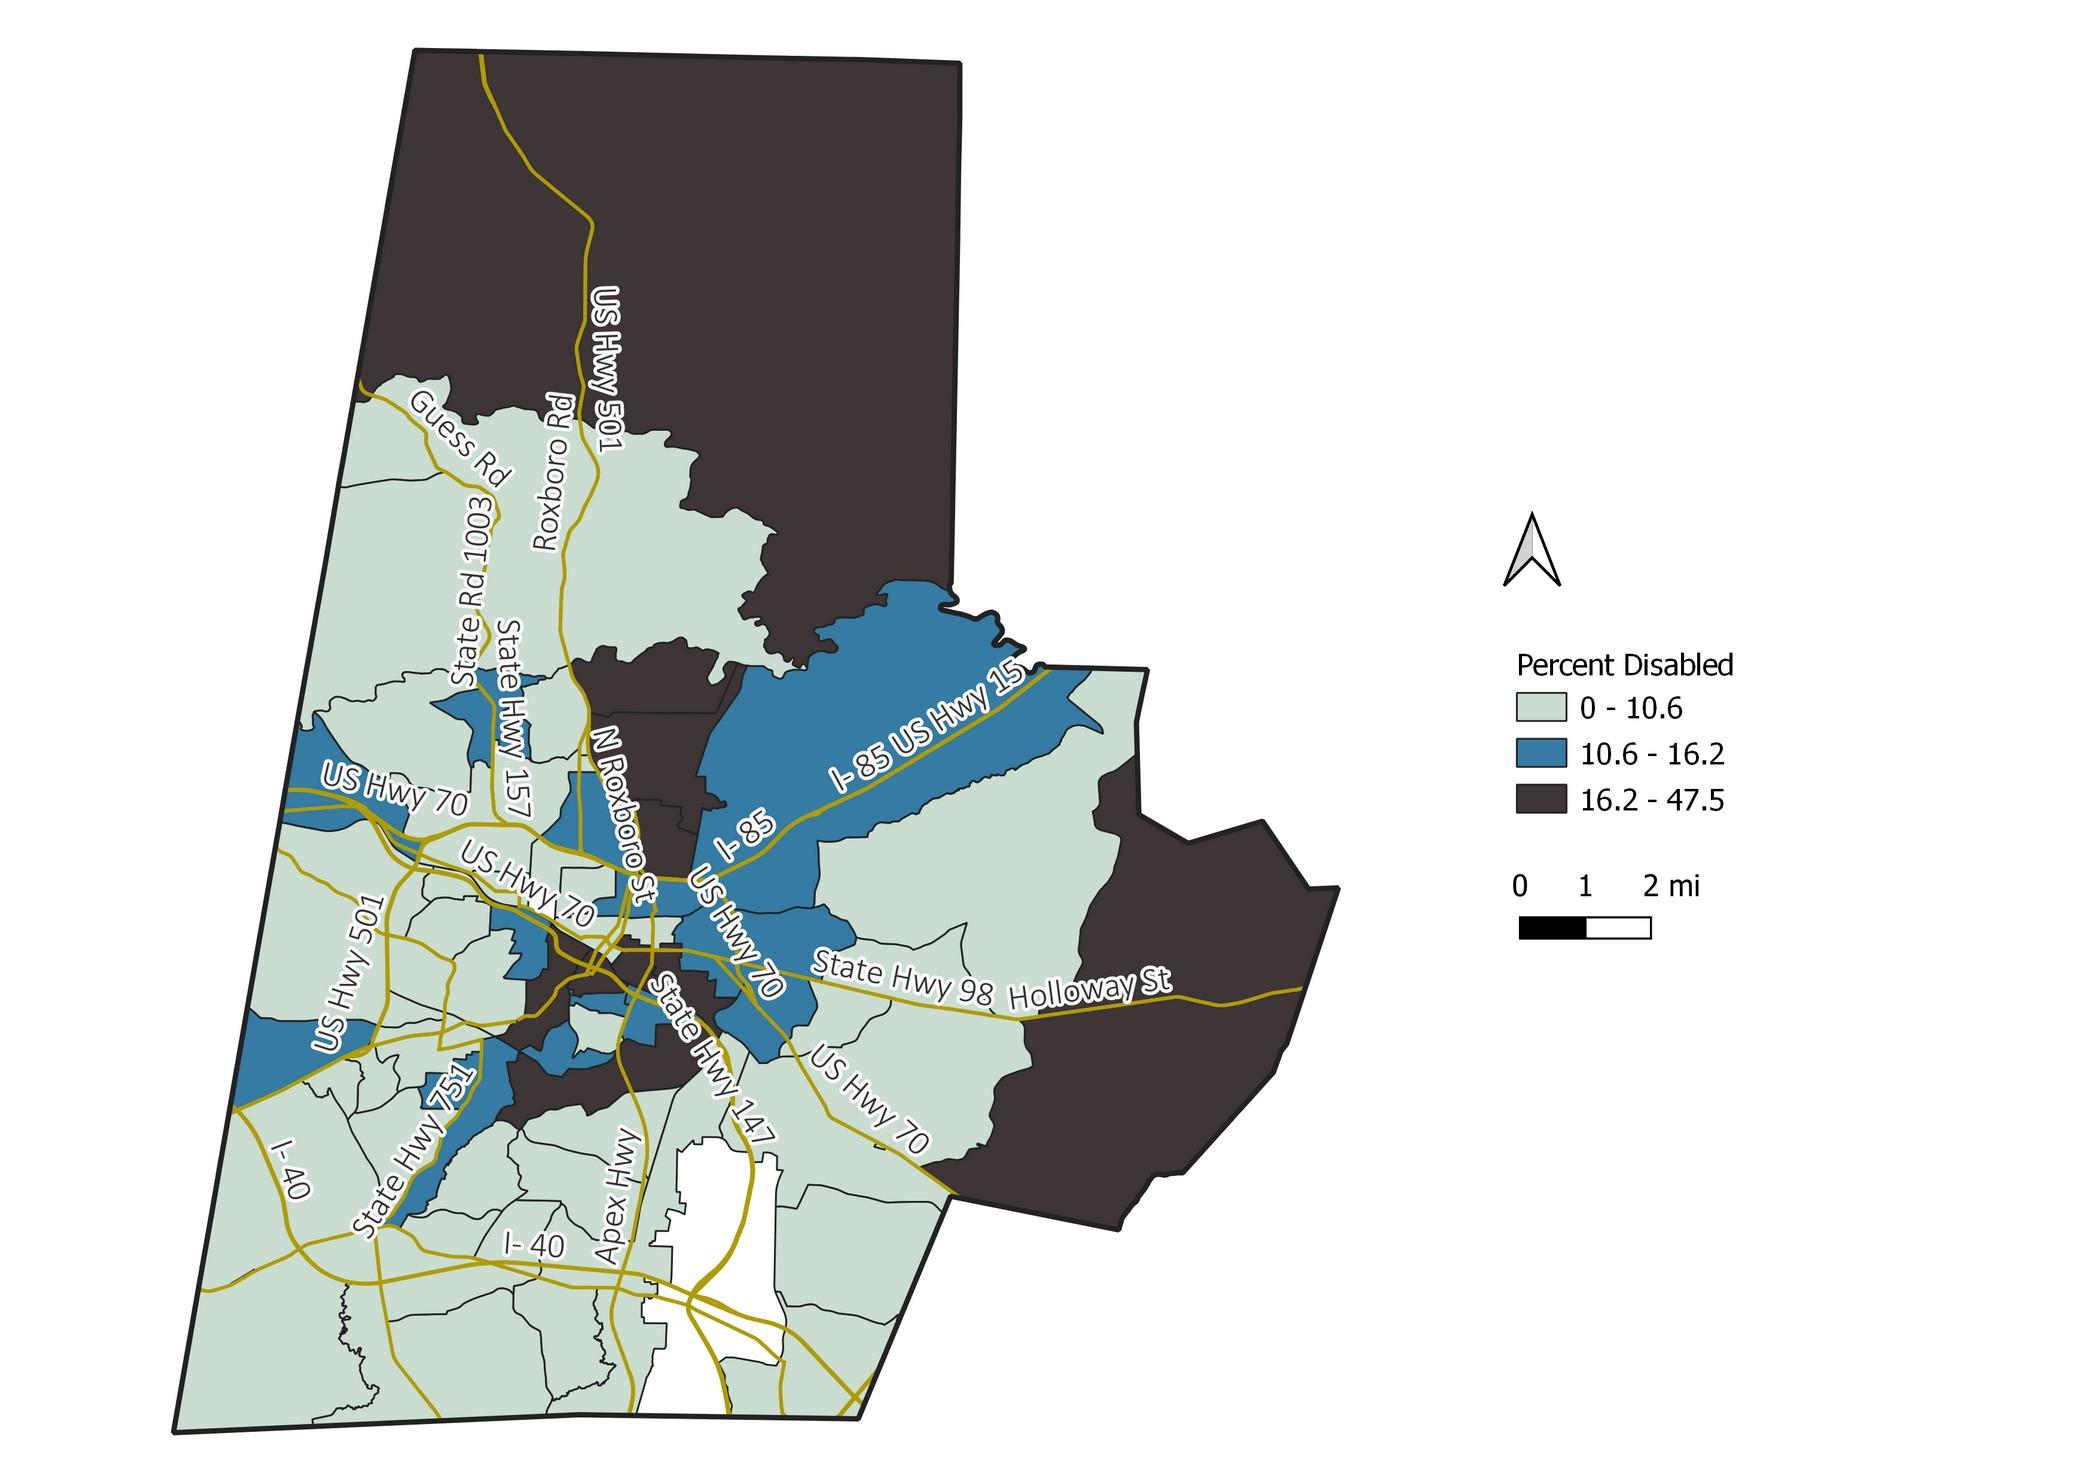
Source: 2017-2021 Census 5-Year ACS
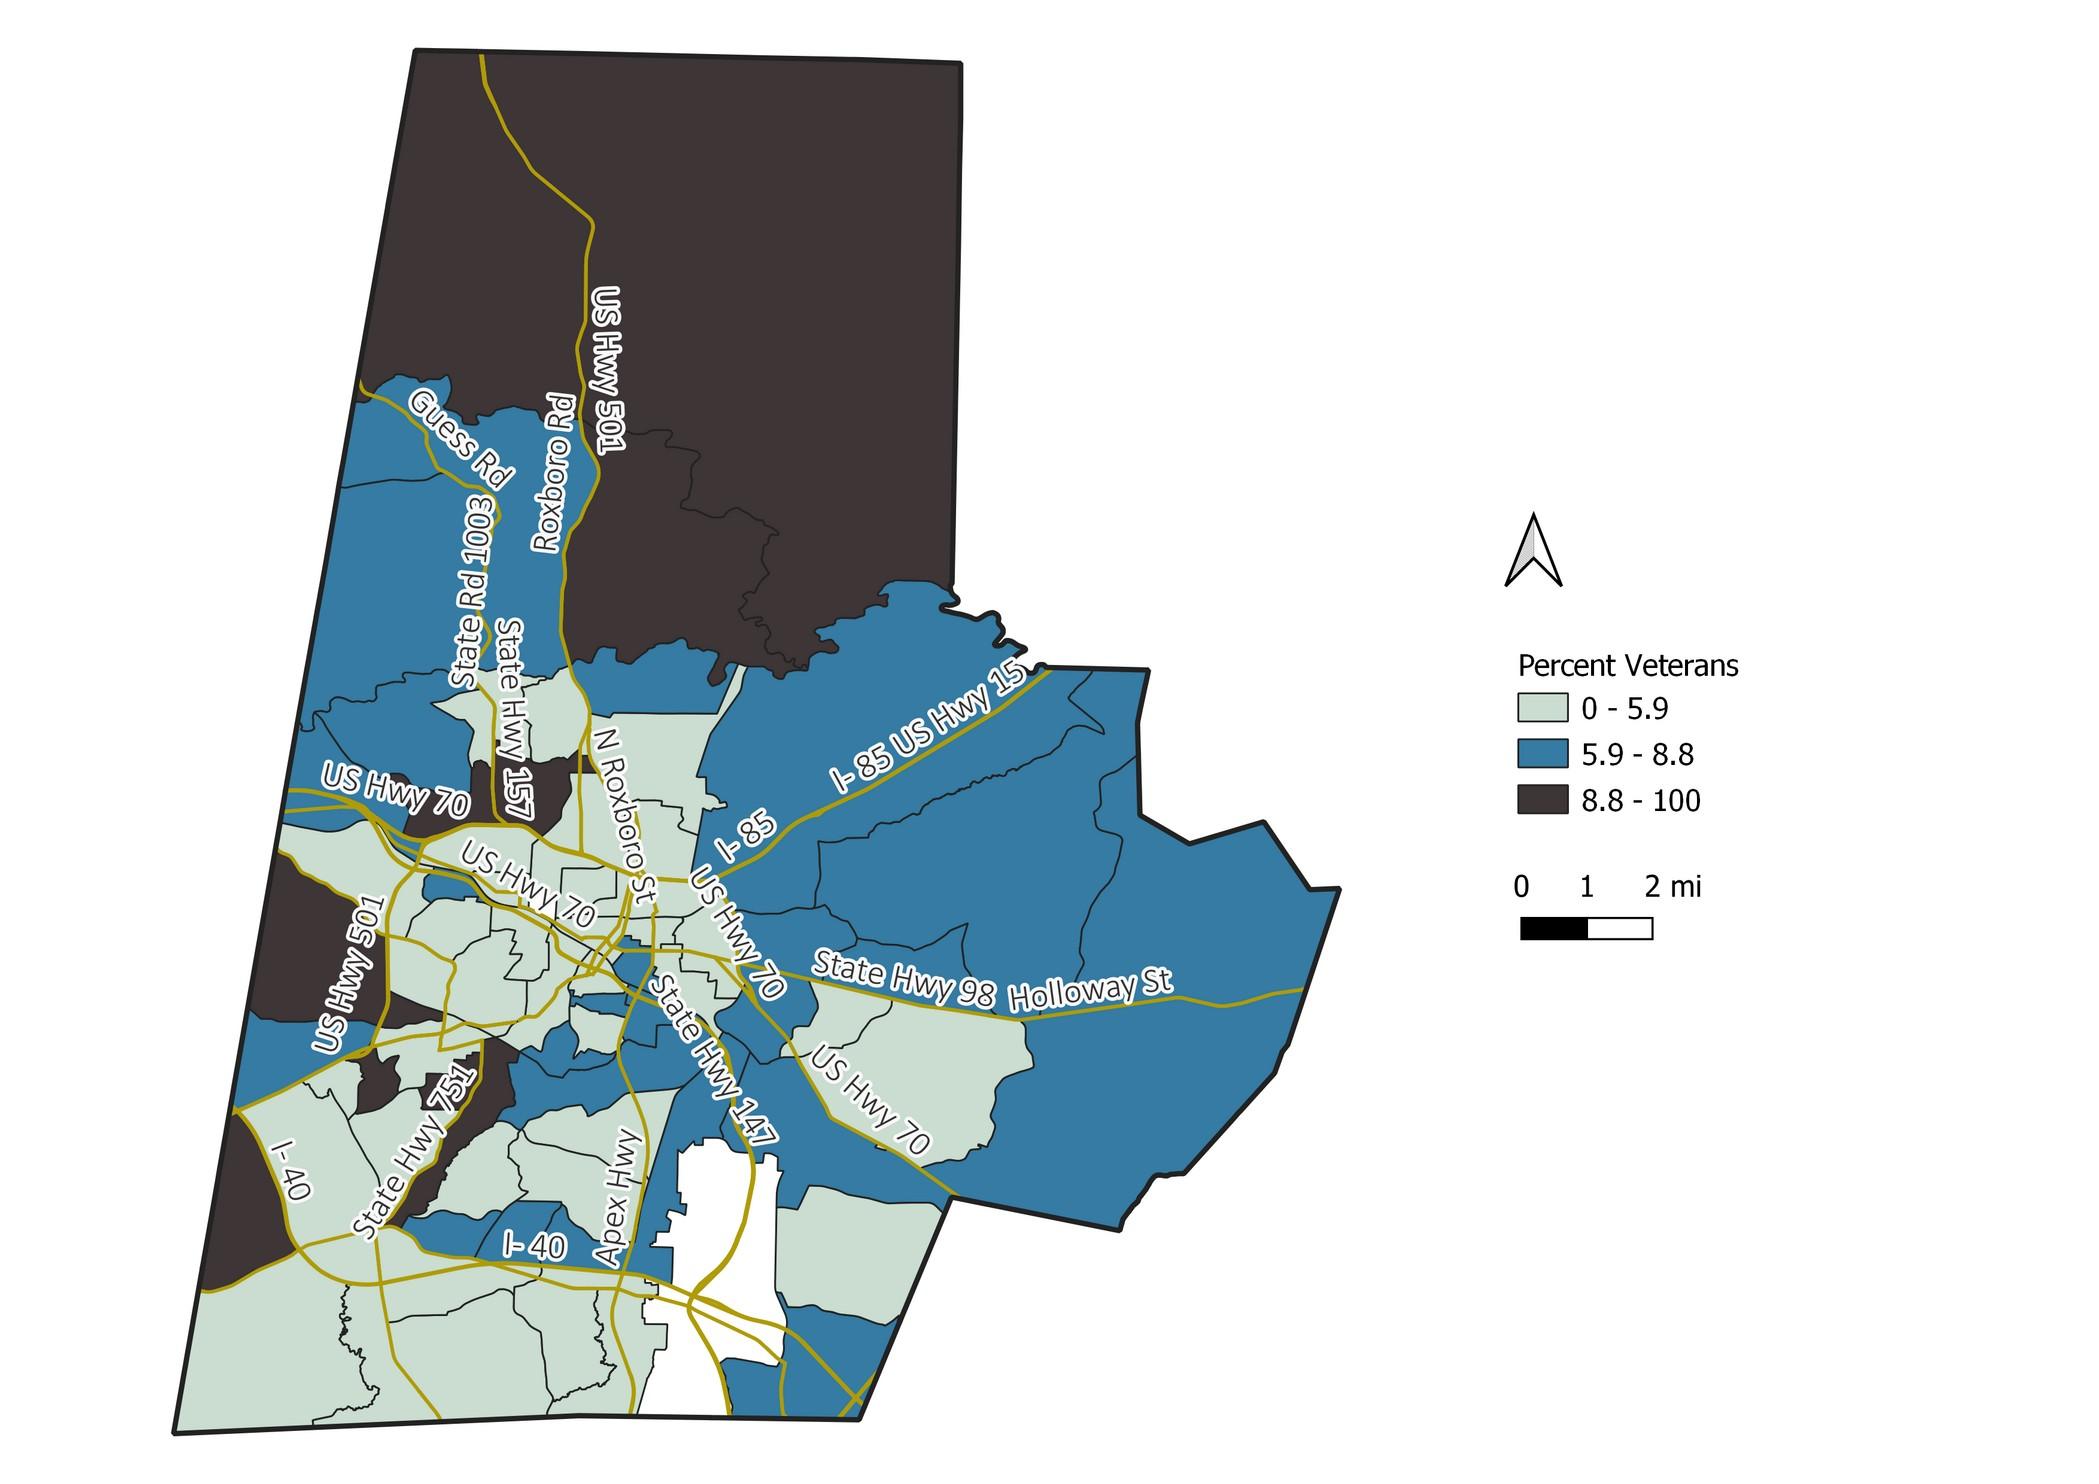
Source: 2017-2021 Census 5-Year ACS
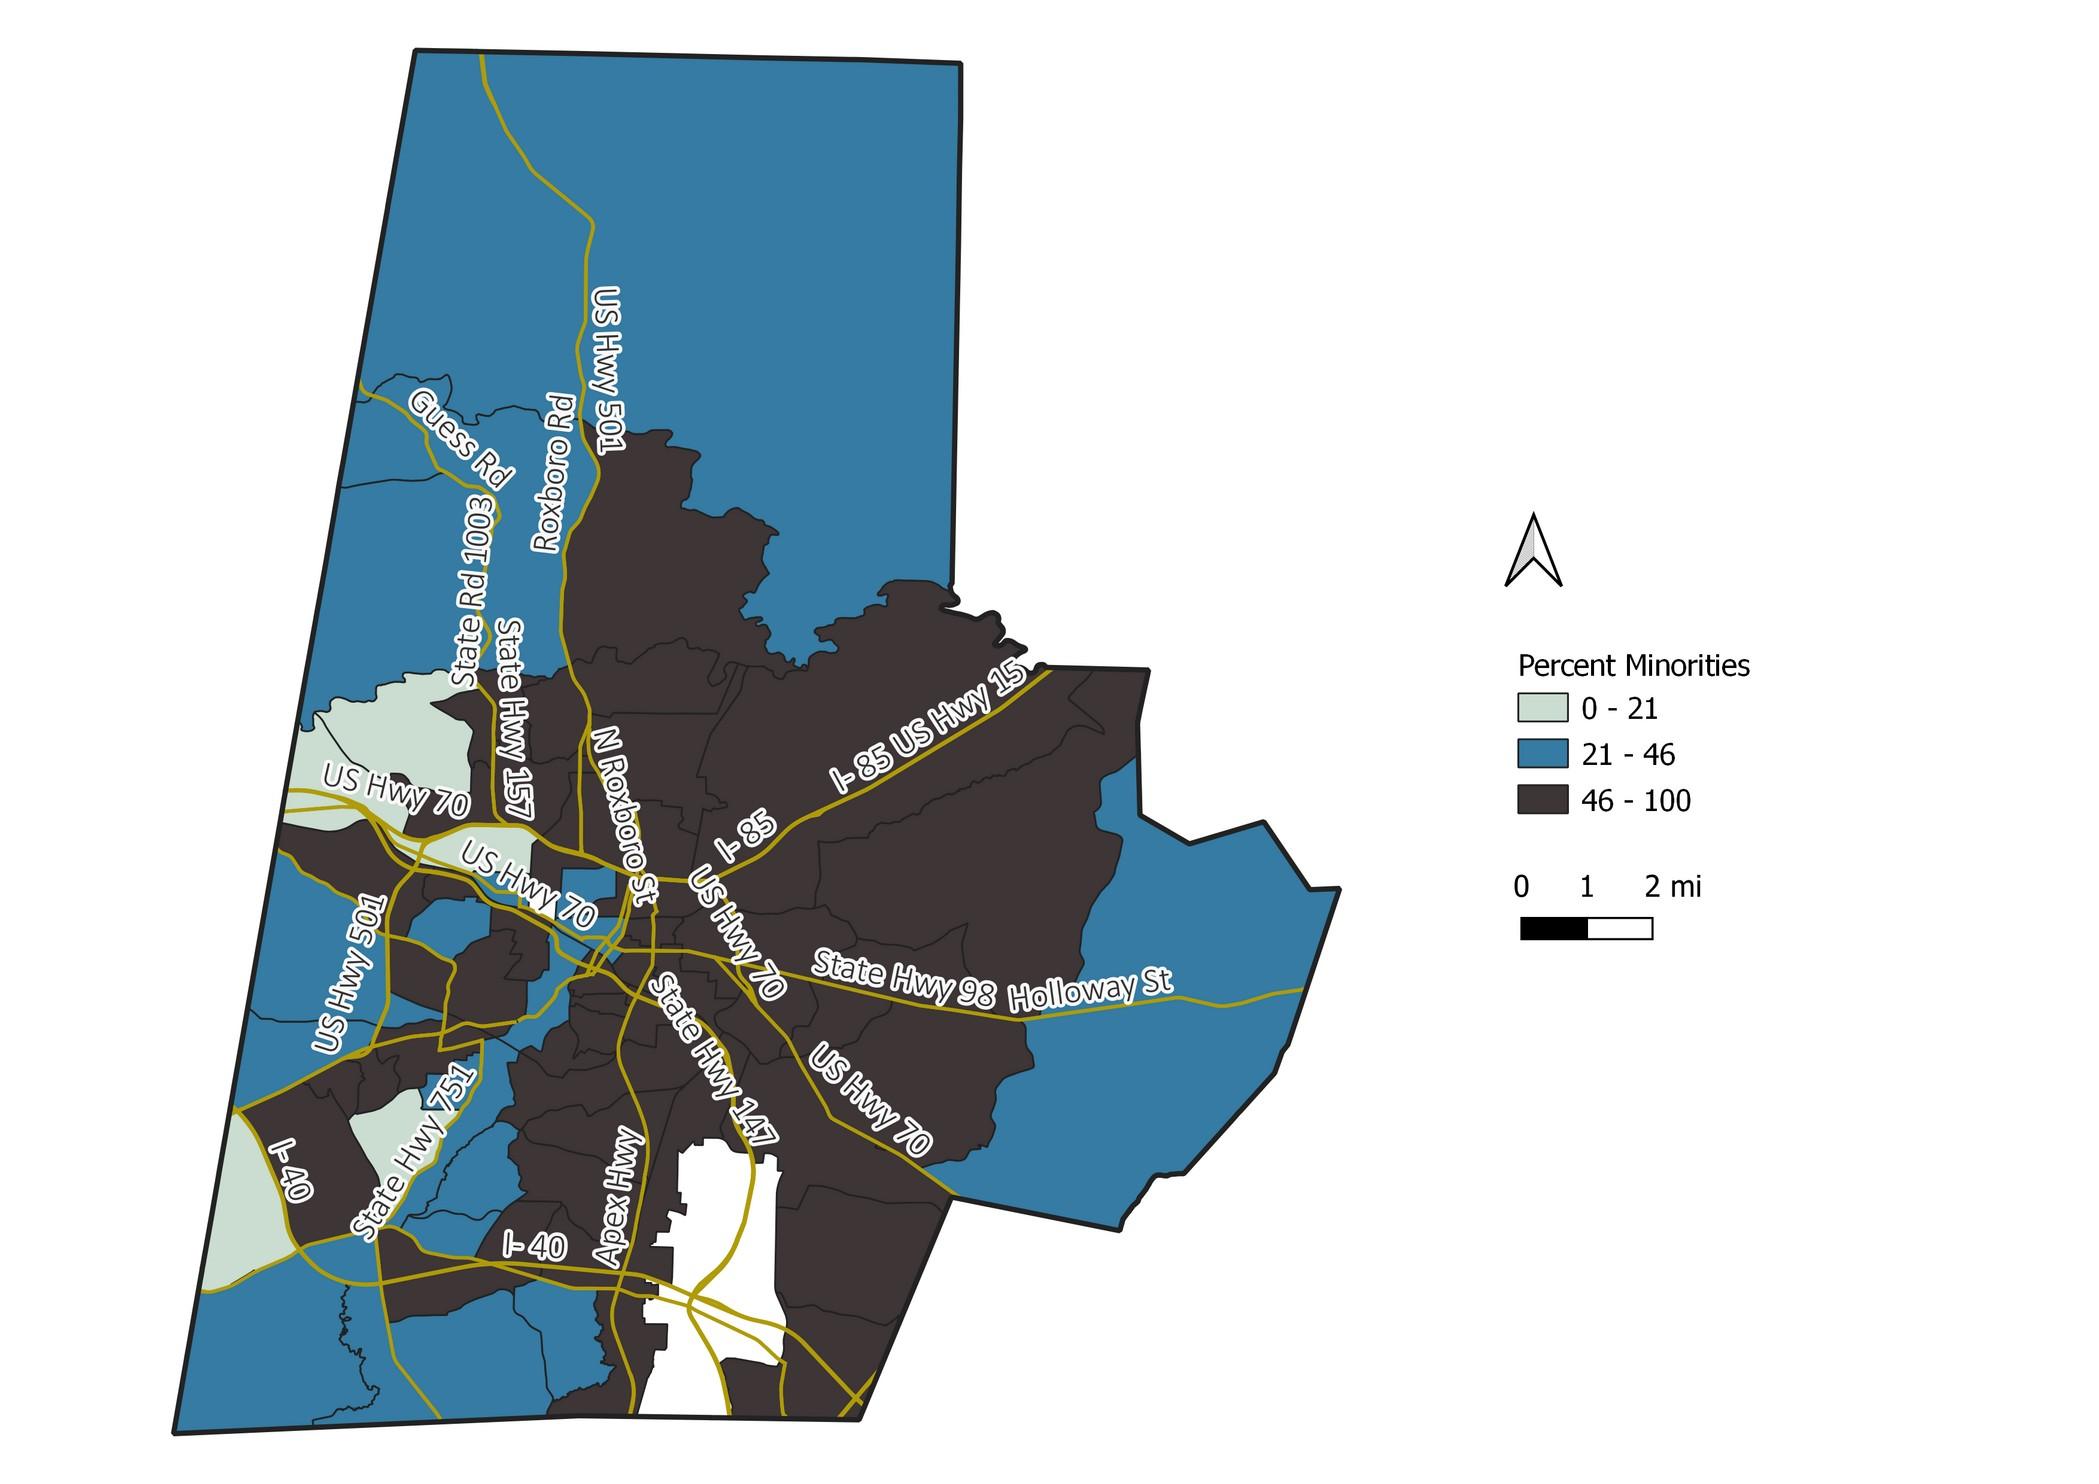
Source: 2017-2021 Census 5-Year ACS

Source: 2017-2021 Census 5-Year ACS

Source: 2017-2021 Census 5-Year ACS
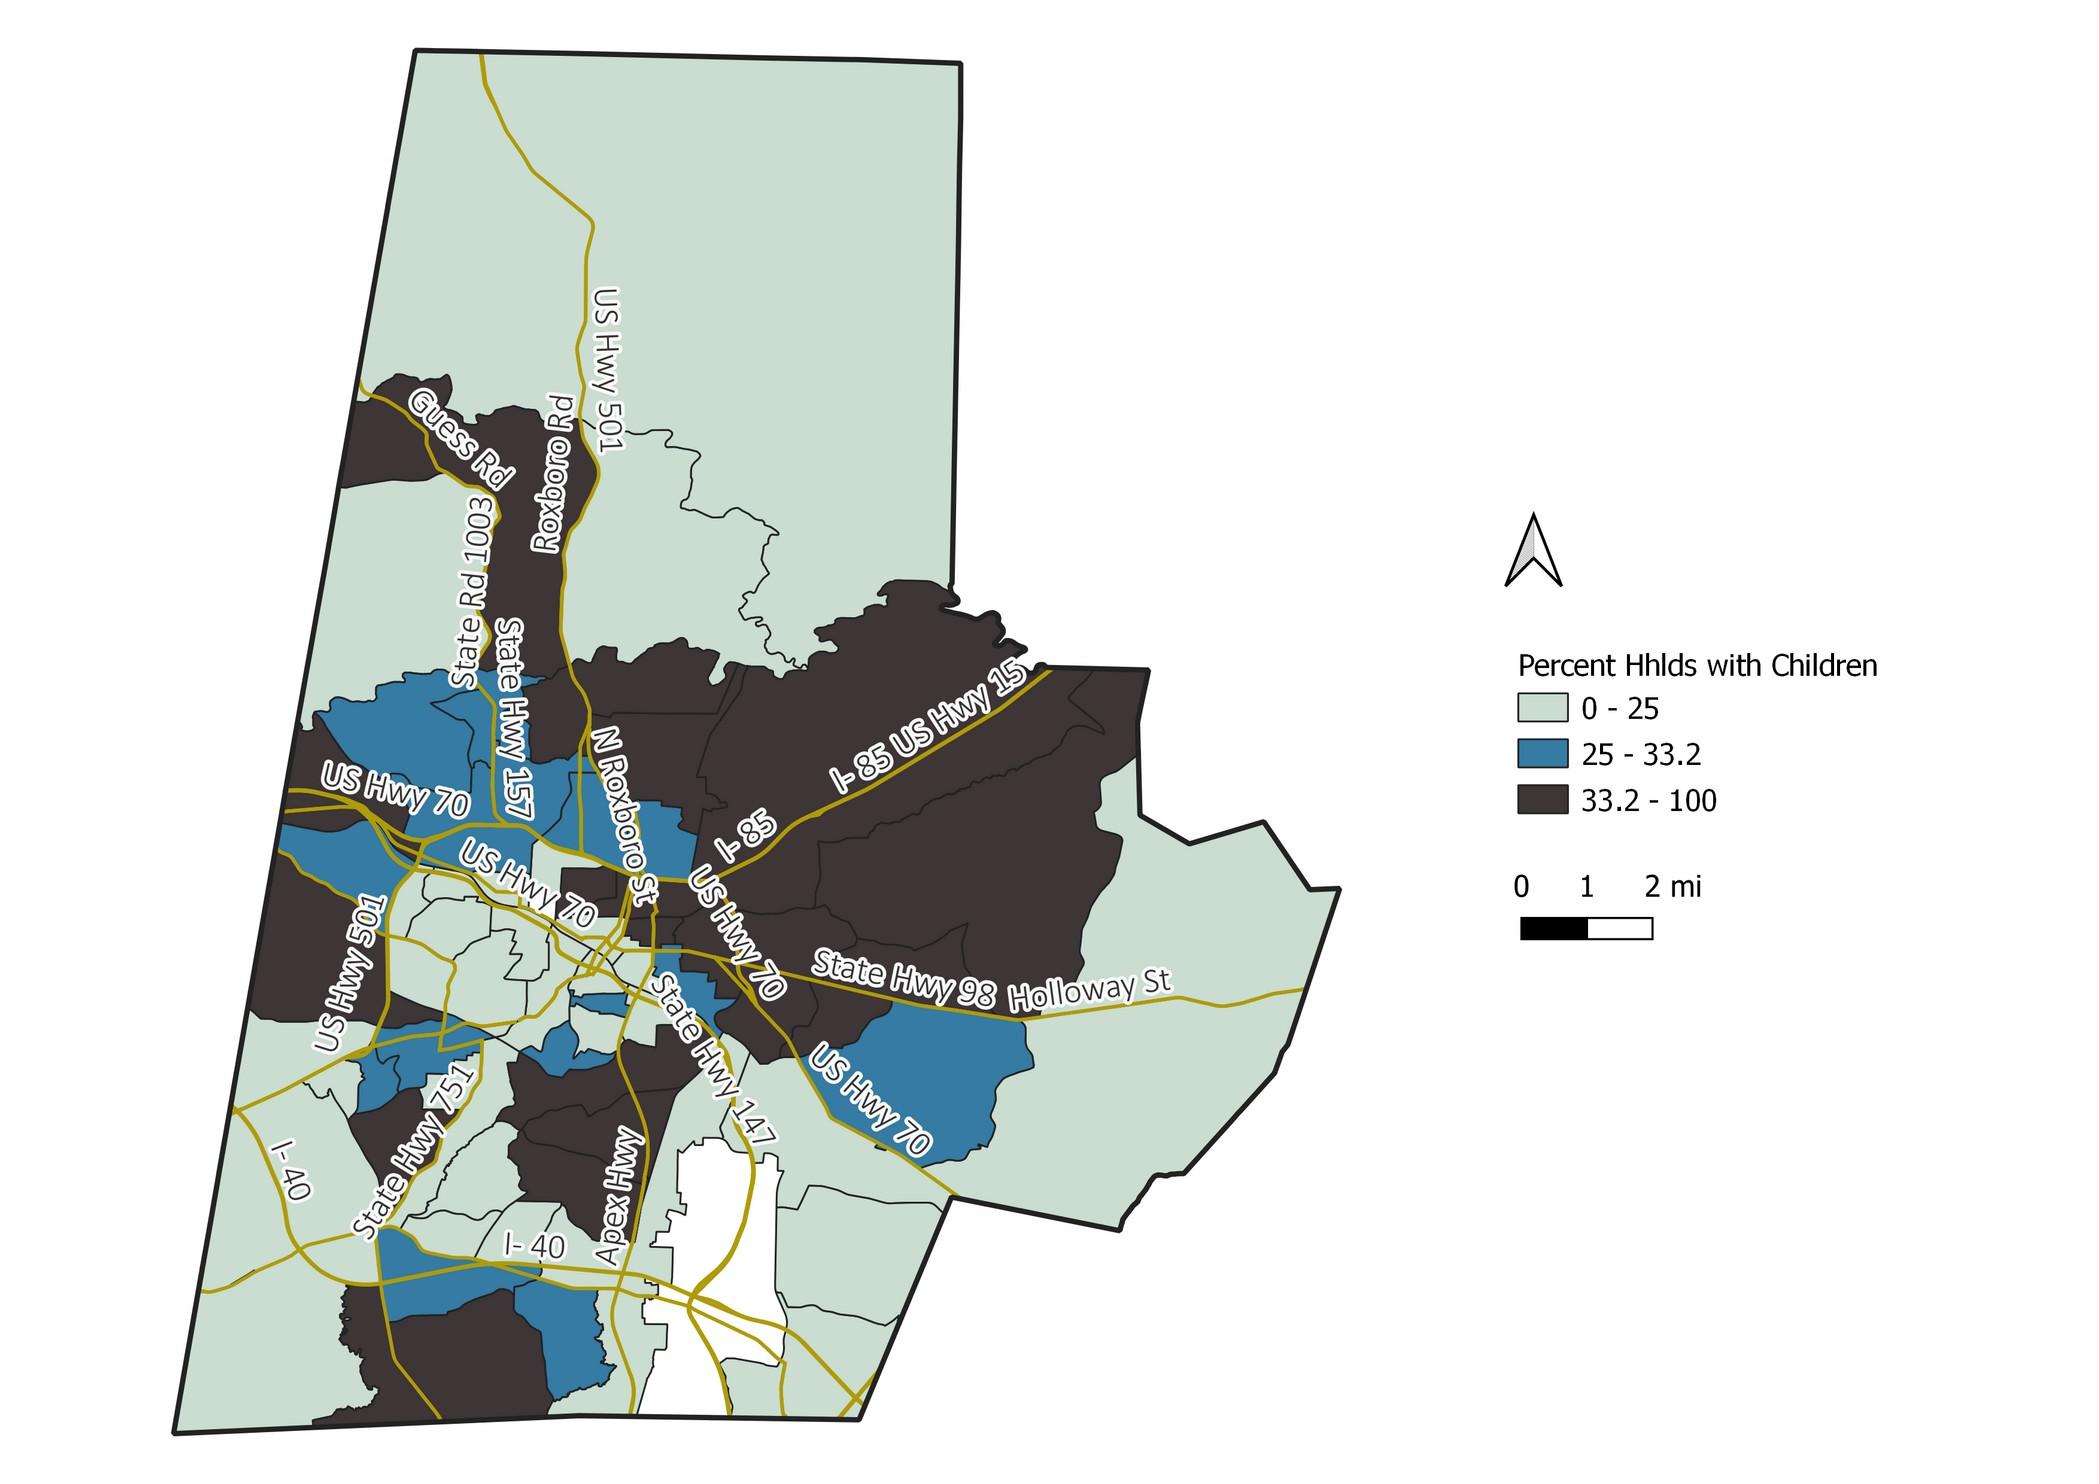
Source: 2017-2021 Census 5-Year ACS

Source: 2017-2021 Census 5-Year ACS
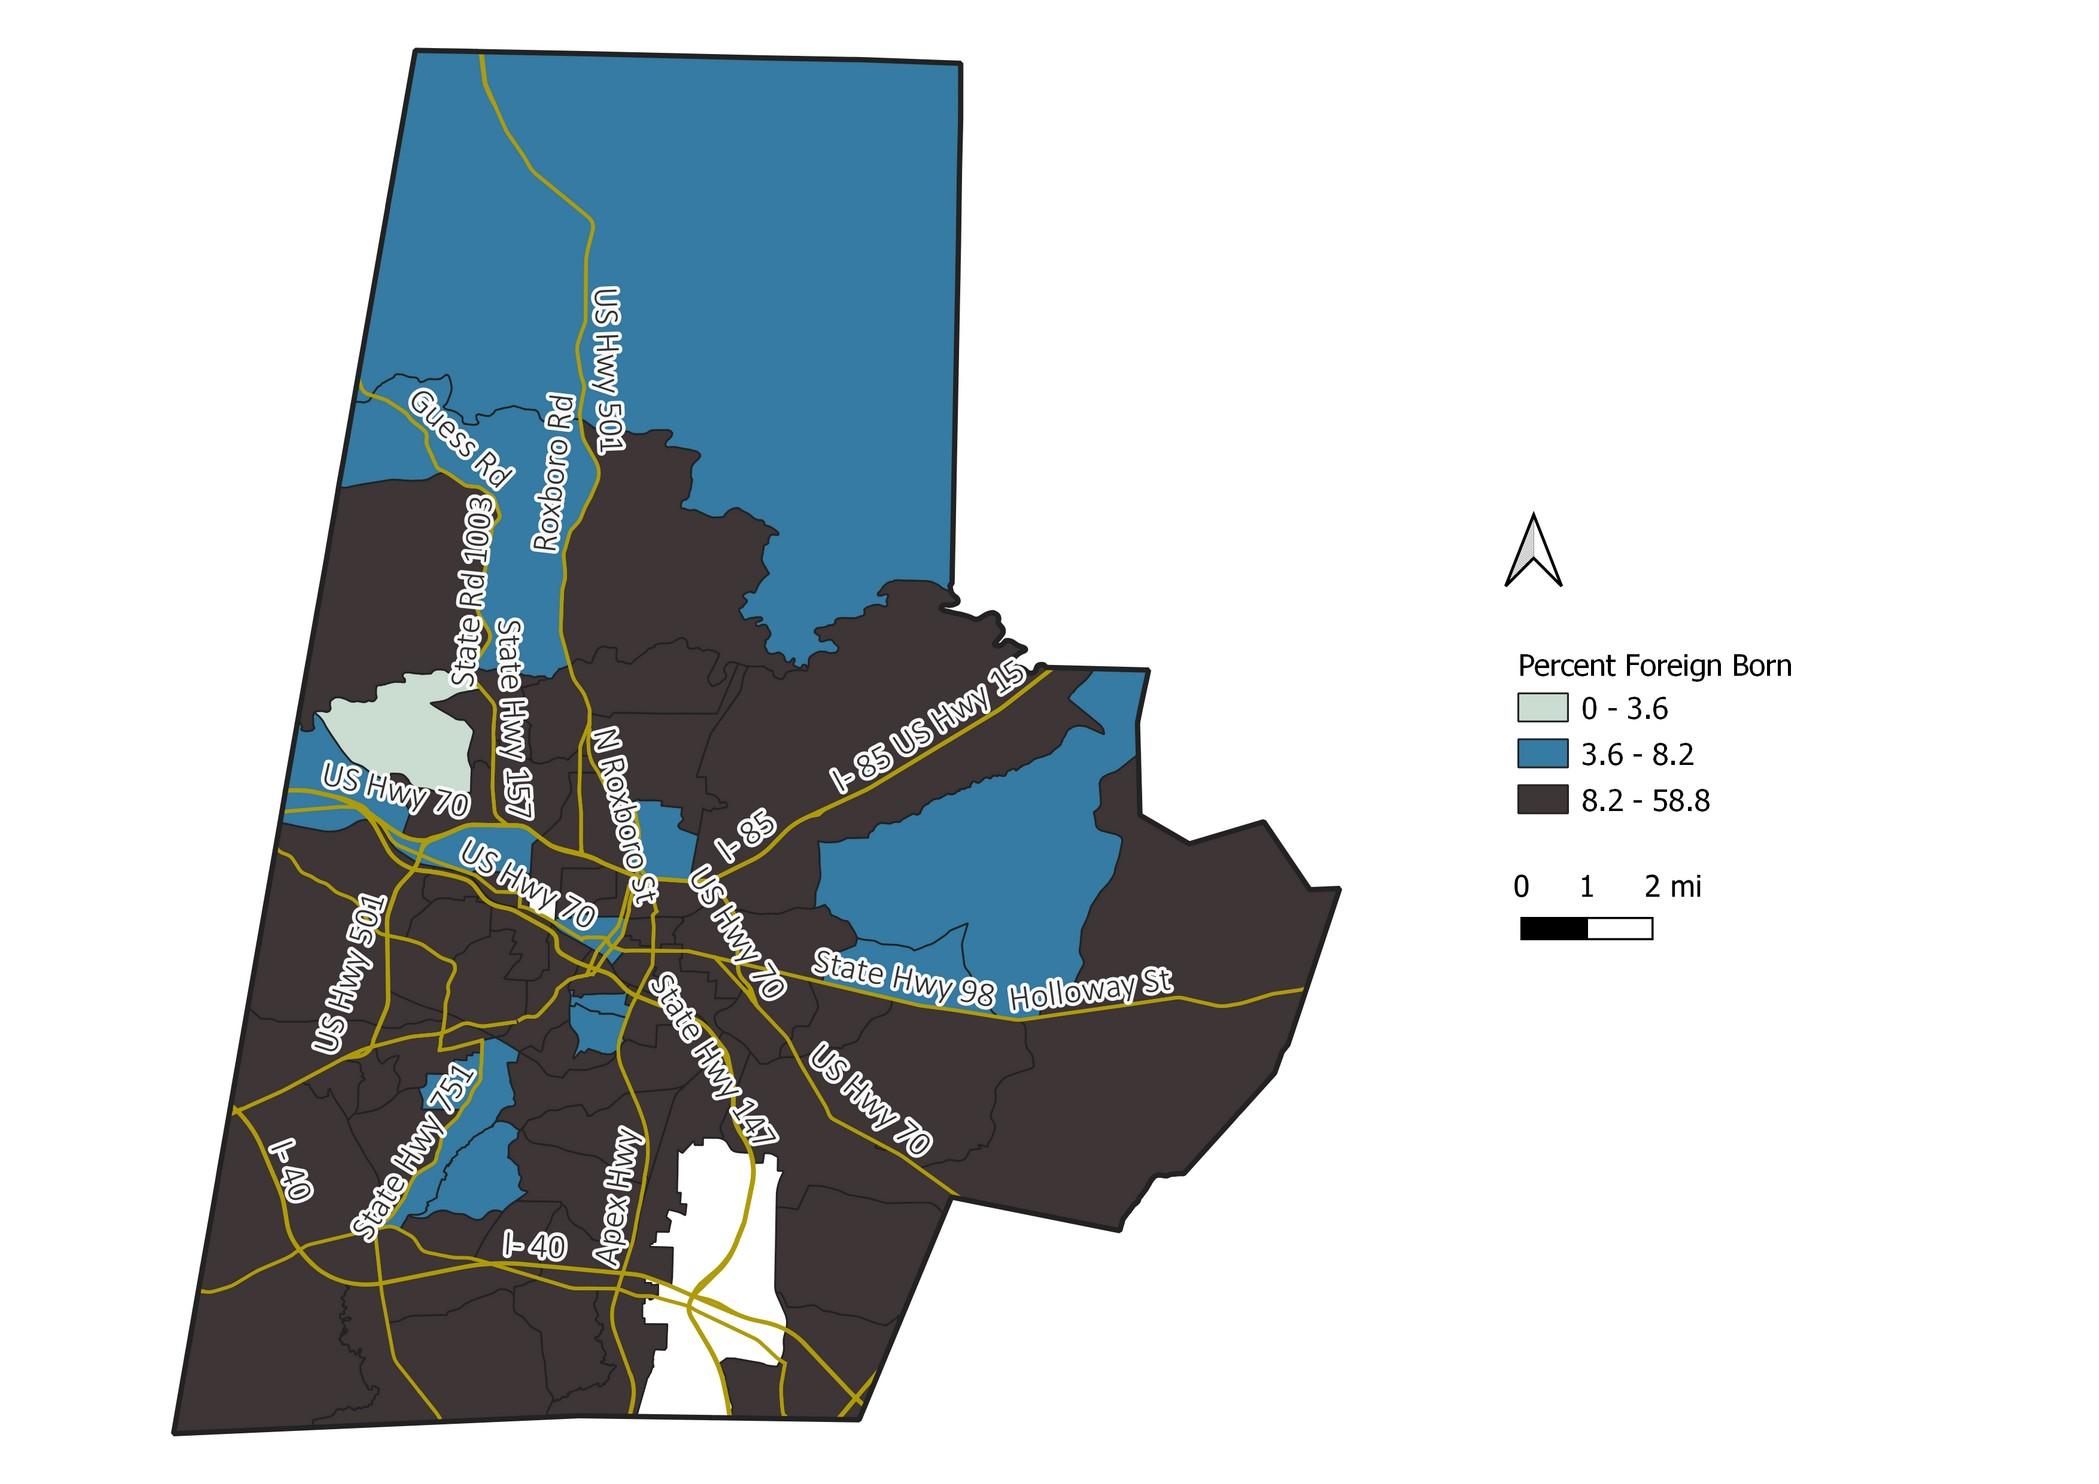
Source: 2017-2021 Census 5-Year ACS

Source: 2017-2021 Census 5-Year ACS
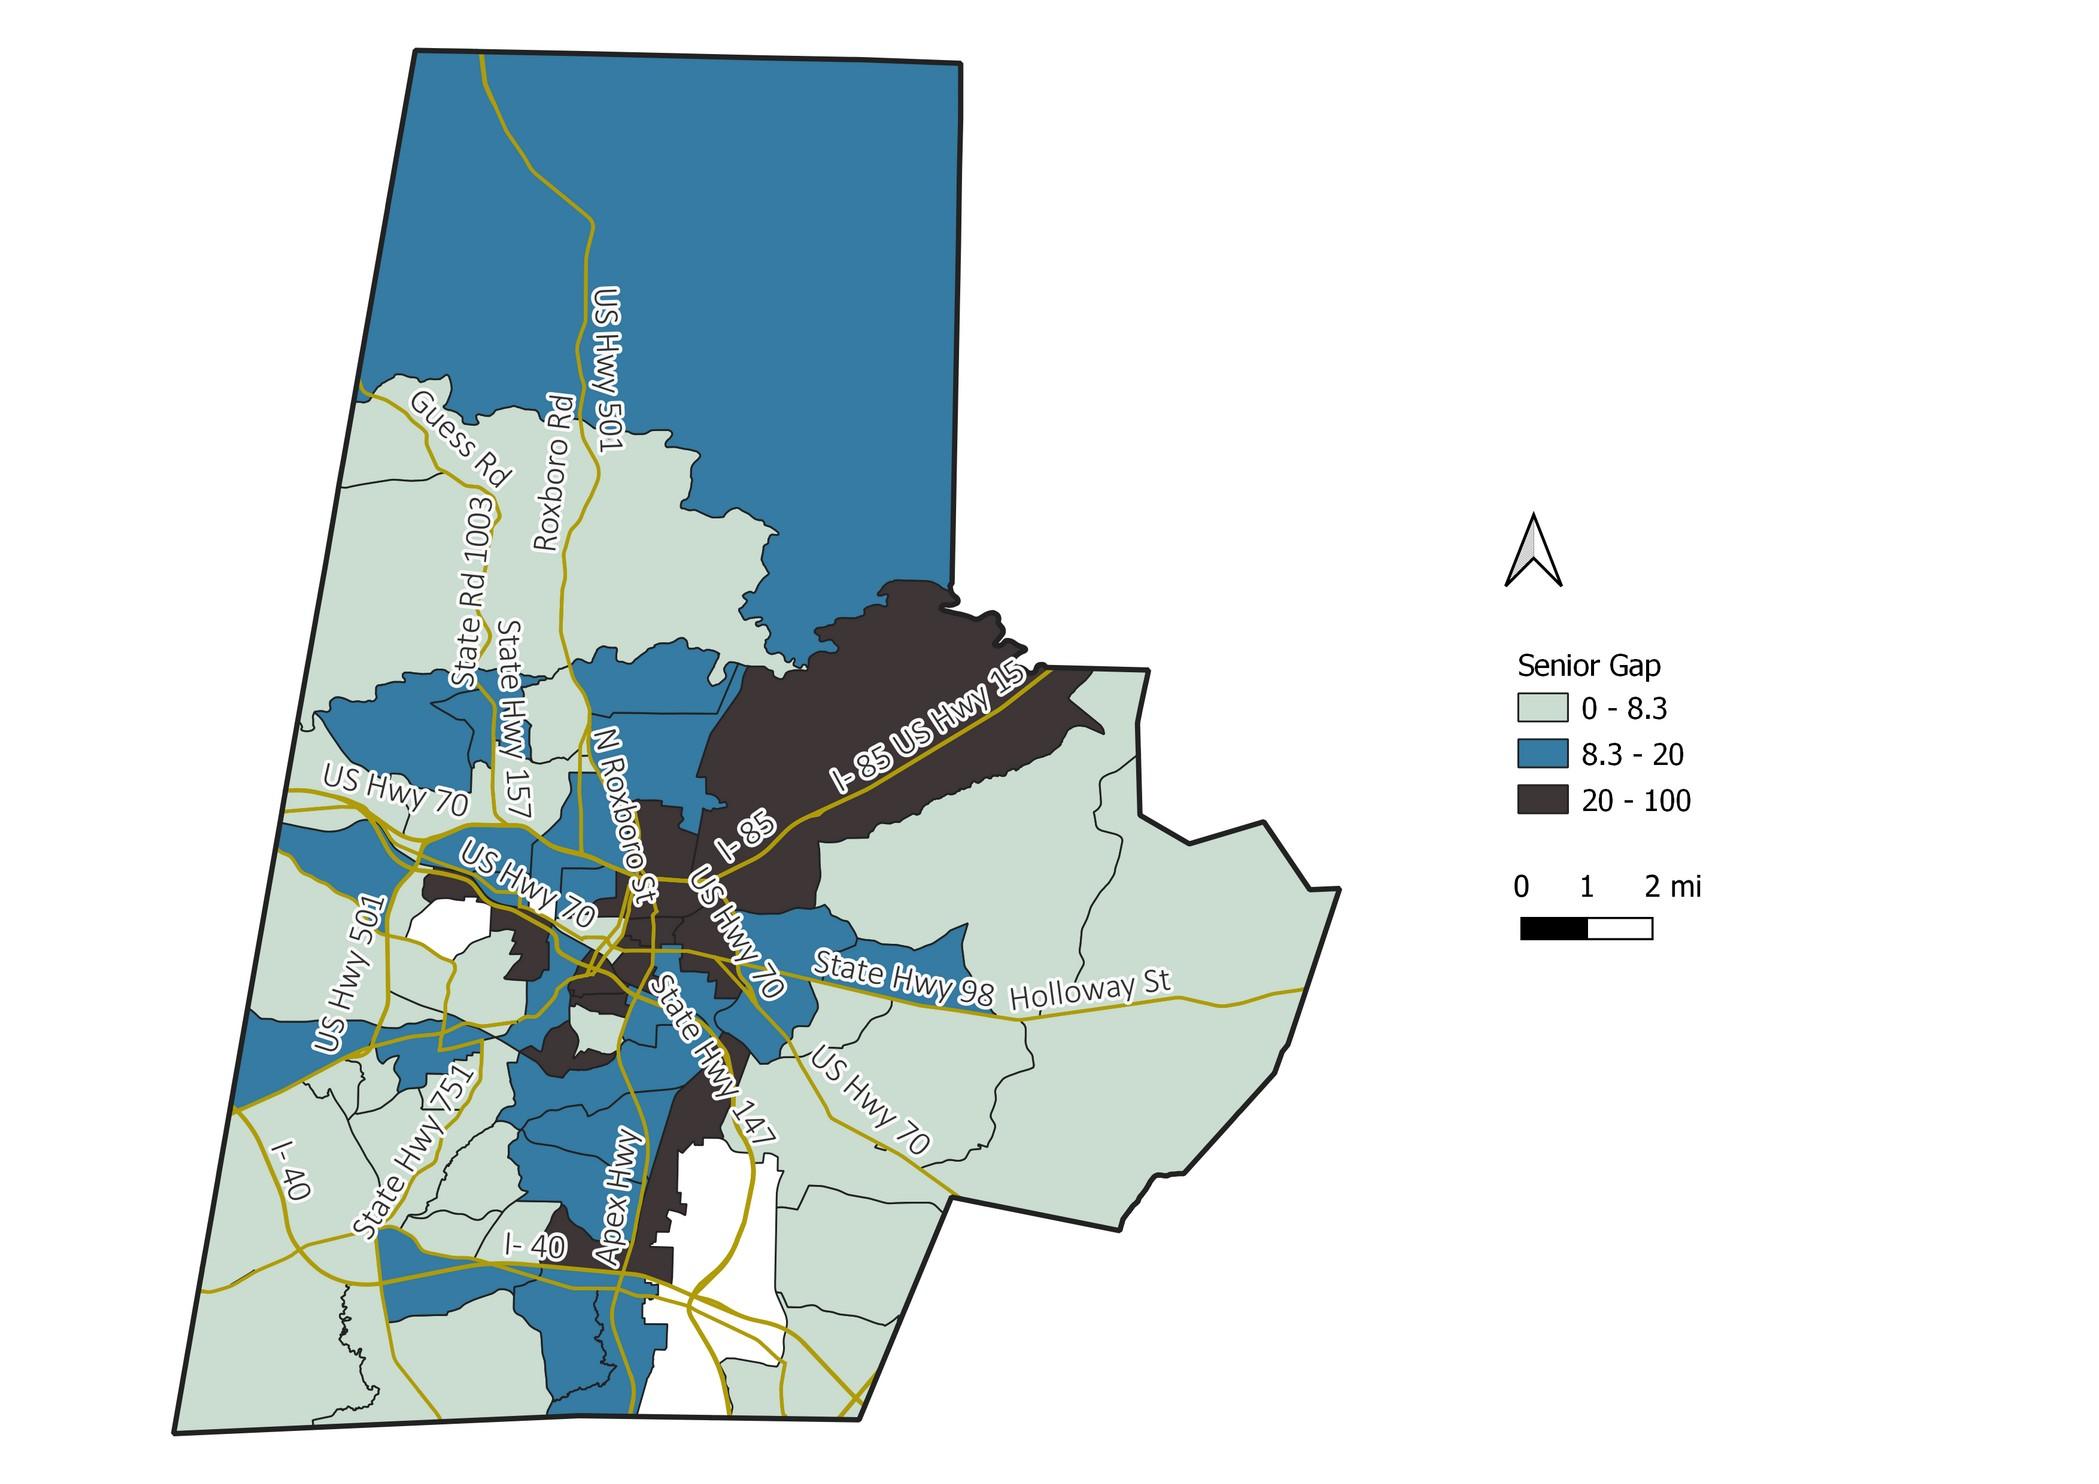
Source: 2017-2021 Census 5-Year ACS
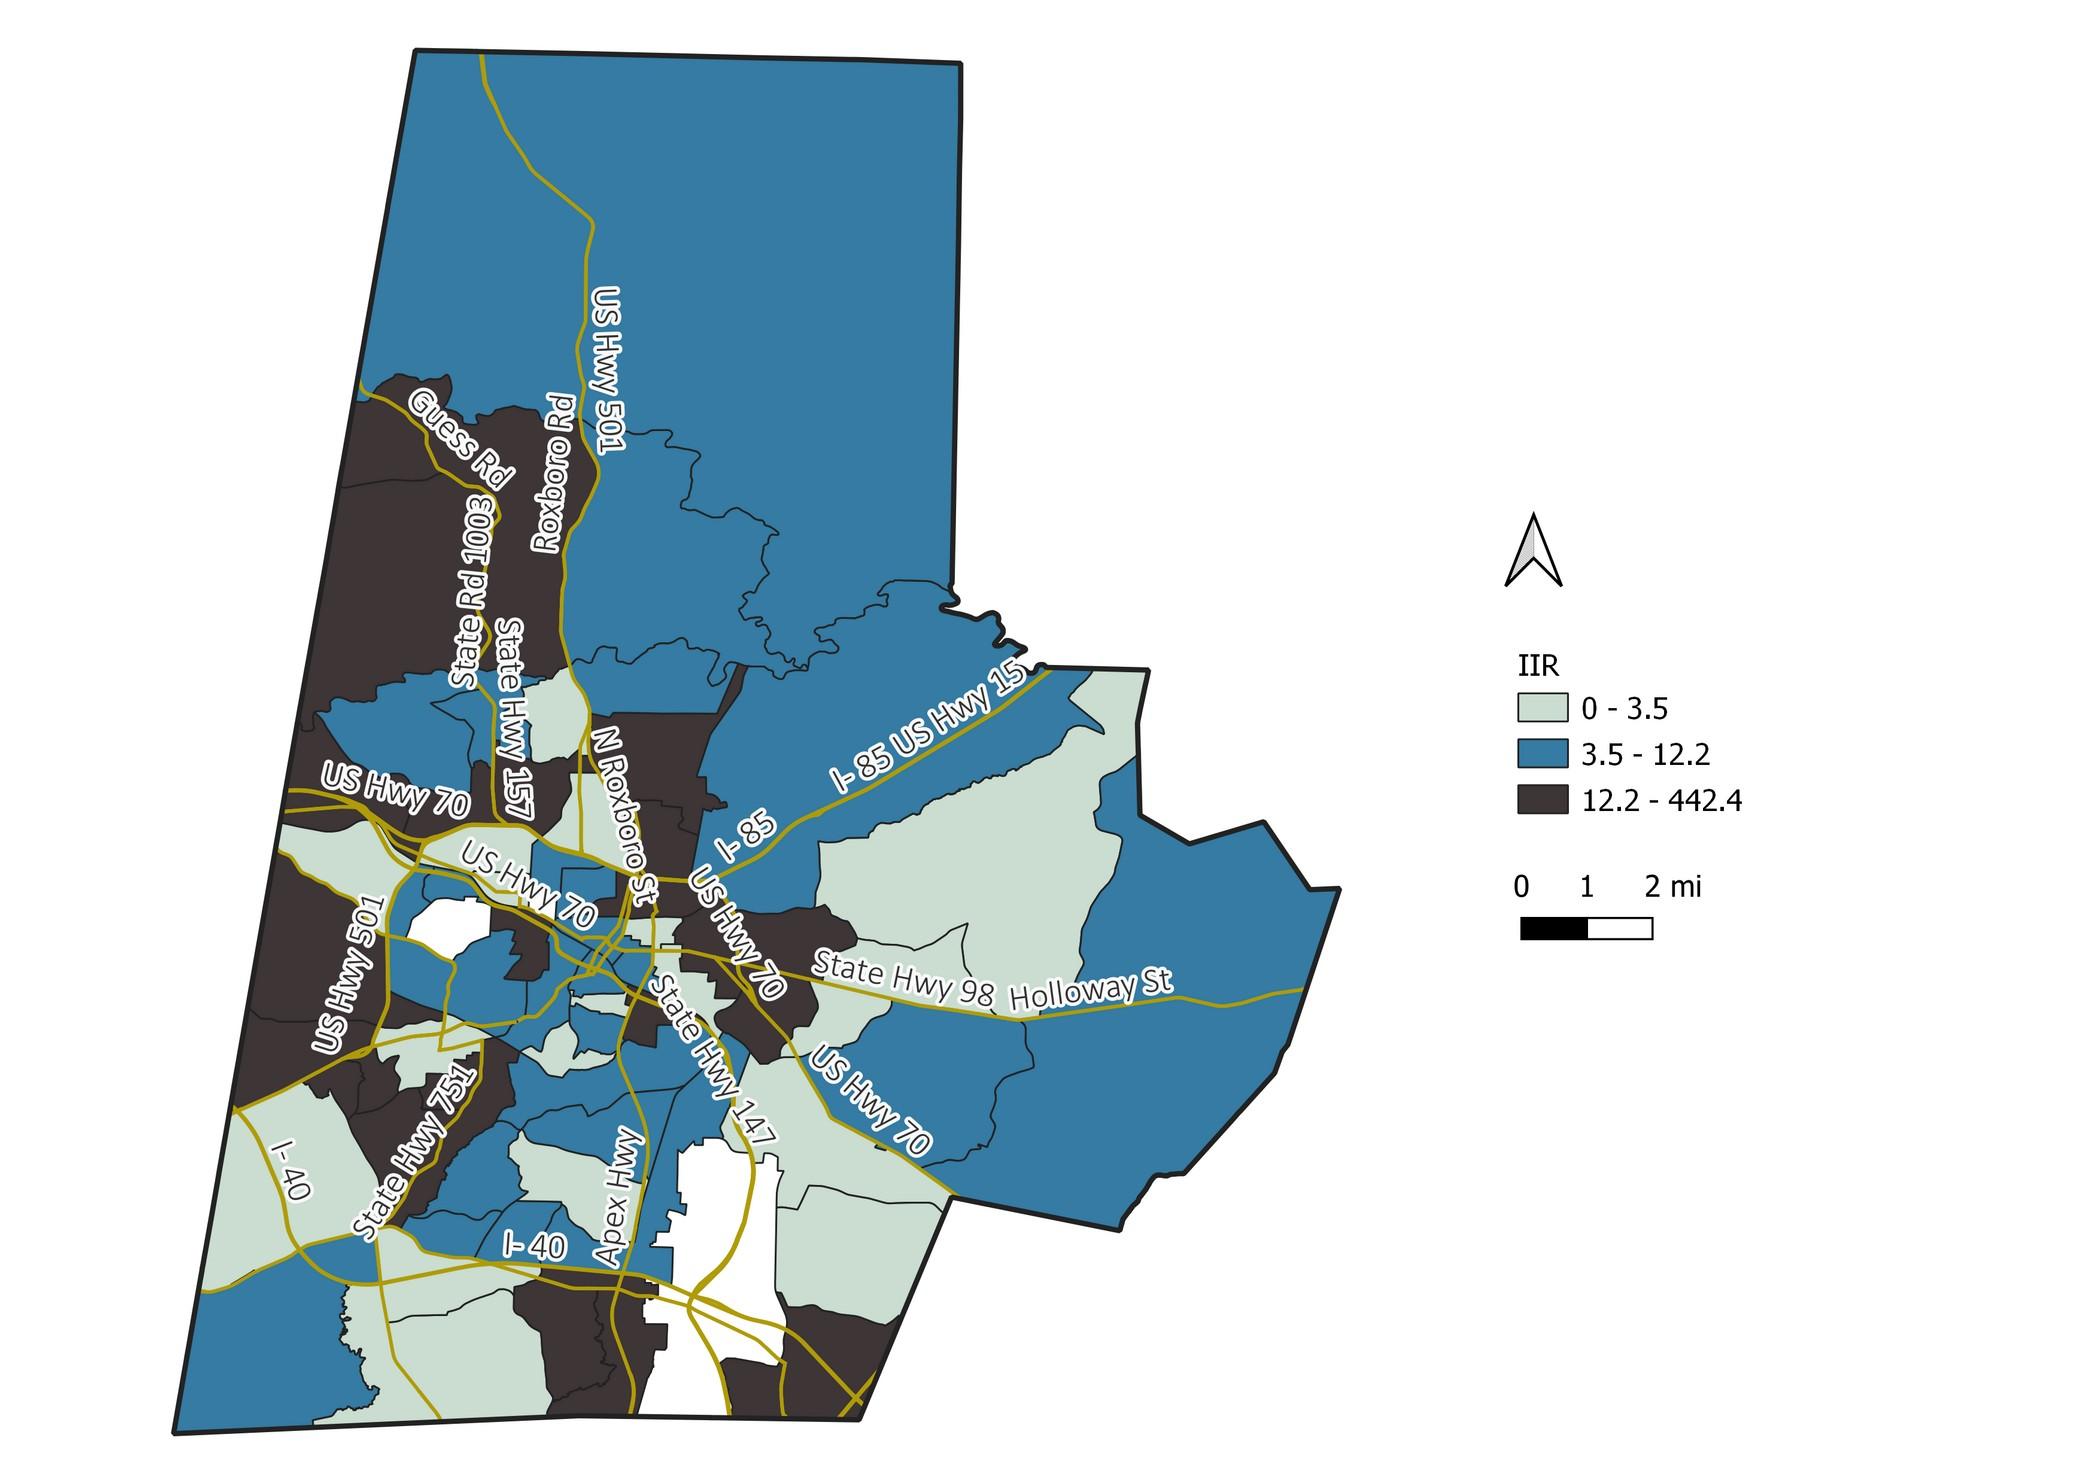
Source: 2017-2021 Census 5-Year ACS; Purdue Center for Regional Development
A higher IIR denotes higher inequality. The IIR is the share of homes making less than $35k with no internet divided by the share of those making $75k or more with no internet.

Source: 2017-2021 Census 5-Year ACS; Purdue Center for Regional Development Digital distress refers to a situation where homes rely on mobile devices only or have no computing devices as well as no internet access or rely on cellular data only.
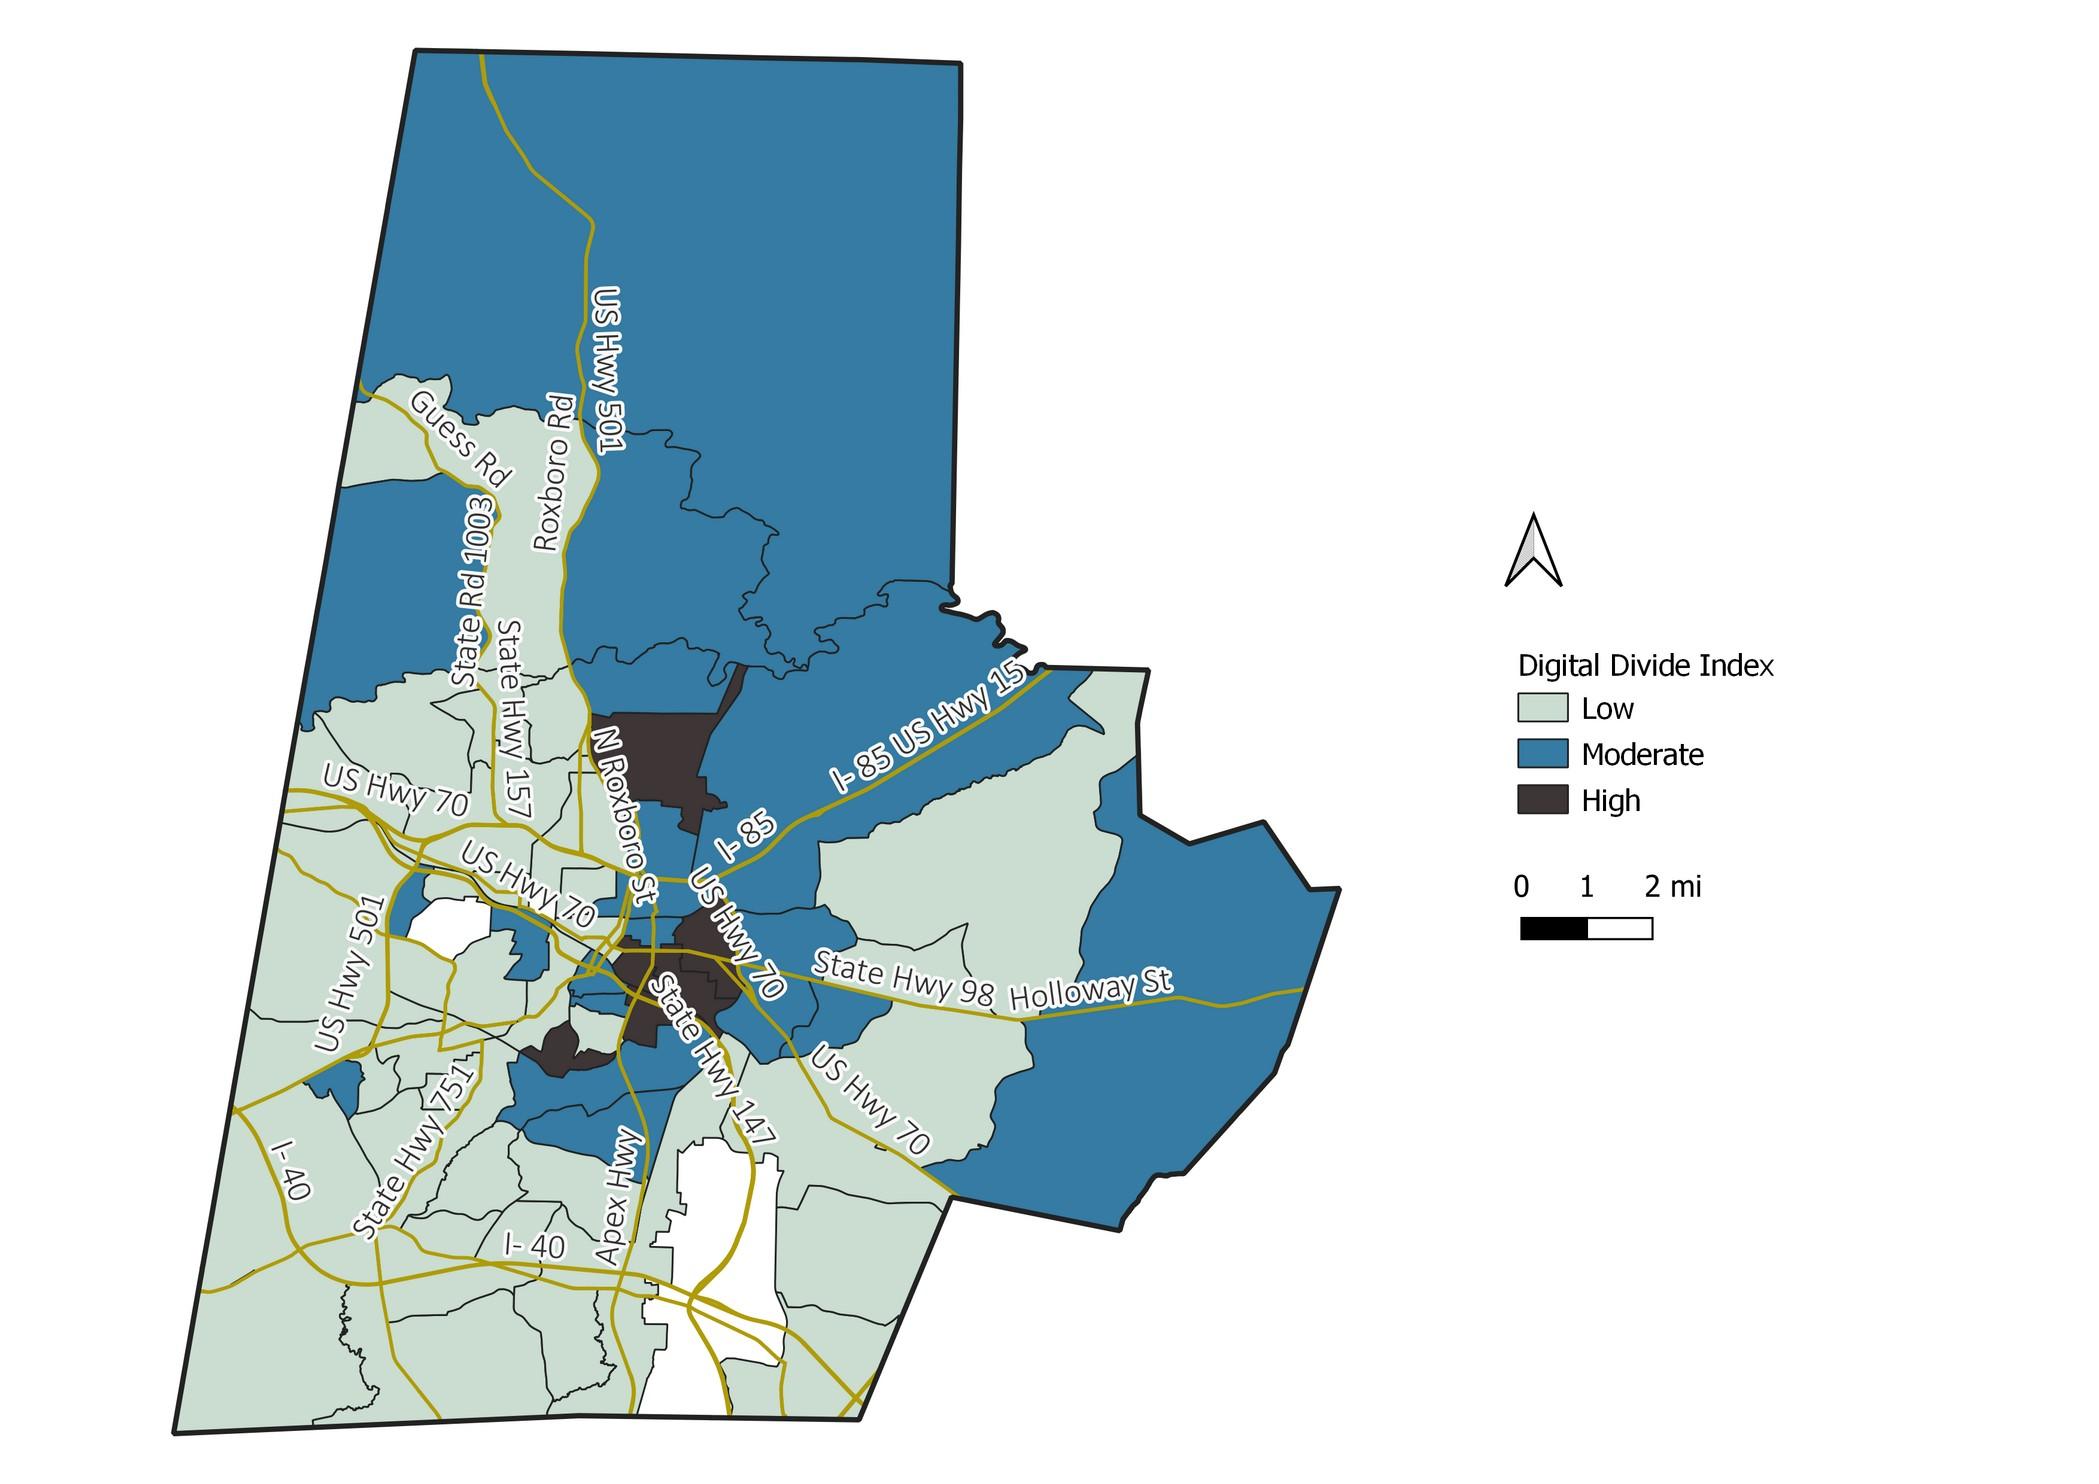
Source: 2017-2021 Census 5-Year ACS; Purdue Center for Regional Development
Includes 10 variables related to the digital divide including infrastructure, devices, and demographic characteristics.
Source: GoDaddy Venture Forward
United States North Carolina Triangle J Durham County
Source: 2017-2021 Census ACS 5-Year; Lightcast; Purdue Center for
*Potential is in percentage points and is the difference between the share of remote work friendly occupations minus the share working from home (non-agriculture). A digitally inclusive community works towards leveraging this potential by reducing this number.
Source: Lightcast; Bureau of Economic Analysis
*Includes 44 industries considered to be “fully” part of the digital economy ranging from hardware & software to data processing; does not include warehousing or retail associated with e-commerce
Source: Lightcast; Brookings