2022-26 Analysis of Impediments to Fair Housing Choice

For CDBG & HOME Programs
Prepared by
Crystal & Company for the City of Independence, MO
May 2, 2022
Ordinance Number 19326
2022-26 Analysis of Impediments to Fair Housing Choice
May 2, 2022
City of Independence, Missouri City Council
Rory Rowland, Mayor
John Perkins, District 1
Brice Stewart, District 2
Michael Steinmeyer, District 3
Dan Hobart, District 4
Jaren Fears, At-Large
Vacant, At-Large
Zachary Walker, City Manager
TABLE OF CONTENTS Starts On Page 1.0 Executive Summary..................................................................................1 2.0 Study Purpose and Methodology.............................................................4 3.0 City Of Independence Data Analysis .......................................................7 Demographic Data Incidence Of Disability Analysis Income & Poverty Assessment Education Assessment Employment Assessment Housing (Distress) Assessment Environmental Health Hazard Exposure Assessment Home Lending From HMDA Assessment 4.0 Evaluation of City Of Independence Current Fair Housing Legal Status...............................................................................24 5.0 Identification of Impediments To Fair Housing Choice 32 6.0 FY 2022-2026 City of Independence Analysis of Impediments.............38 7.0 Conclusions, Recommendations and the City Of Independence Fair Housing Action Plan.........................................................................42
1.0 Executive Summary
The City of Independence secures an entitlement allocation of Community Development Block Grant (CDBG) and HOME funds each year. CDBG and HOME funding continues to assist low-income people in the community. A mandate in the past on the receipt of CDBG and HOME resources is the requirement that Independence have a current Consolidated Plan that incorporates citizen participation in establishing local priorities for spending such funds (rule remains in effect) as well as a current Assessment Of Fair Housing (AFH) that is synonymous with the Analysis of Impediments to Fair Housing Choice (AI) Study term used throughout this report Certifications in the Consolidated Plan indicate that Independence will “affirmatively further fair housing HUD has recently issued new, Interim Federal Rule (AFFH Rule, 86 FR 30779) that took effect July 31, 2021 regarding planning rules associated with fair housing. Under the new IFR, a HUD program participant may determine how best to engage in the fair housing planning process, so long as it can appropriately certify that it is meeting the affirmative furthering fair housing (AFFH) obligation, consistent with the restored definition of AFFH. Towards this end, the City of Independence elected to generate and implement this new Analysis of Impediments To Fair Housing Choice (AI) report covering FY 2022 to 2026 to be in compliance with federal regulations.
In the course of preparing the City of Independence AI, two citizen participation meeting were held on November 8, 2021 and April 6, 2022 to elicit input and secure comments on the draft. In addition, the draft AI document was subjected to a 30-day formal comment period from March 21, 2022 to April 21, 2022. The aforementioned actions were taken in collaboration with the preparation of the City‟s FY 2022-‟26 Consolidated Plan, FY 2022-‟23 Action Plan and FY 2022-‟26 Citizen Participation Plan.
The HUD Office of Fair Housing and Equal Opportunity often utilizes the AI as the basis for review of efforts by Independence to affirmatively further fair housing. Independence understands that:
Every act of housing discrimination is harmful to the individual and to the community;
It will endeavor to identify those areas where people in constitutionally protected classes have faced discrimination in housing in any number and at any level; and,
It will continue to develop programs, processes or solutions to eliminate the discrimination.
Independence‟s AI is intended to assess problems associated with people‟s ability to choose a place to live with the only condition on that choice being affordability. The AI seeks to identify legitimate problem areas experienced by people in constitutionally protected classes and establishes a prudent approach to foster opportunities in Independence for fair housing choice. Impediments are defined in this process as any actions, omissions, or decisions taken because of race, color, religion, sex, disability, familial status, or national origin that restricts housing choices of these protected classes. The term “fair housing choice” means: “The ability of persons of similar income levels in the same housing market area to have a like range of choices available to them regardless of race, color, religion, national origin, sex, and disability”.
Page 1
Understanding the functional relationship between income level and fair housing choices are important because lower income persons are often members of protected classes.
Summary of Independence Impediments Identified
The following general impediments were identified and refer to detailed information in Section 6.0 of the report for more information
Evidence of Housing Discrimination – A survey of Independence residents and other stakeholders reveals that housing discrimination does exist. Increased public support and awareness is needed. Additionally, the results of the housing discrimination survey indicate that there is a need for more community education.
A Range Of Affordable Housing Needed - Evidence that increased resources are needed to support the production of a range of affordable housing given the incidence of housing distress in the locality motivating the need for more affordable housing units.
Equitable Receipt of Public Assisted Housing Resources – In the past, Hispanics in Independence have not received an equitable share of housing vouchers and this needs to be consistently tracked and mitigated going forward.
Need for Community Education - The number and nature of the fair housing complaints being received from Independence residents continues to remain comparatively low.
Minority/Poverty Concentrations - Minority and poverty concentrations exist in the central and western part of the city.
Disability Accessibility - Disability access was the major factor motivating fair housing complaints in Independence according to the current and past volume of fair housing complaints filed with HUD. About 48% to 62% of fair housing complaints filed were for disability issues.
Independence's Unified Development Ordinance and City Code - A review of the policies and practices of the City of Independence Zoning and Planning Codes indicates that these Codes do make specific reference to the accessibility requirements contained in the 1988 amendments to the Fair Housing Act. Municipal consideration be given to the adoption by Independence of a formal reasonable accommodation policy via ordinance for housing that informs and provides clear direction to persons with disabilities on the process for making a reasonable accommodation request.
Independence Fair Housing Action Plan, FY 2022-2026
Delineated in Section 7.0 of this report, general provisions of the Independence Fair Housing Action Plan are briefly summarized below. Refer to Section 7.0 for specific details.
Increase the volume of affordable housing in Independence, improve the quality of that inventory, continue to offer a range of affordable housing types, ensure Hispanics secure their fair share of rental vouchers/public housing and work with area non-profits and housing organizations to tap homeownership opportunities.
Page 2
Prepare and publish a series public notices relating to aspects of fair housing in addition to the continuing participation with key organizations and sponsorship of events. Sustain usage of fair housing logos, referrals to key organizations, etc.
Accelerate the level of community fair housing education through the distribution of flyers, city publications, transit advertisement, television media, training seminars and city internet facilities.
Sustain a Limited English Policy in the Community Development Department
Collaborate with the local fair housing and other relevant entities to discourage discriminatory and predatory activities in the community. Continue to refer clients to appropriate non-profits, state and federal agencies for support.
Partner with local and regional affordable housing/disability organizations to facilitate community education regarding fair housing in addition to how it pertains to disability issues
Continue to offer fair housing training to targeted Independence staff concerning ordinance review to further federal fair housing statutes.
Continue to work with the local and regional lending and real estate entities to discourage predatory lending practices within the City of Independence
Continue to commit a variety of municipal programs for targeted infrastructure, public improvements, transportation and economic development endeavors to assist disadvantaged and minority persons.
Enhance public transit opportunities in central and western Independence consistent with the city‟s adopted Comprehensive Plan for enhanced minority and disadvantaged population access to area employment opportunities.
Derived from the 2016-2021 MARC Analysis of Impediments
To Fair Housing
Choice, consider the adoption by Independence of a formal reasonable accommodation policy via ordinance for housing that informs and provides clear direction to persons with disabilities on the process for making a reasonable accommodation request.
Foster affordable and accessible housing in a range of unit sizes for disabled persons pursuant to the City of Independence Comprehensive Plan.
Continue to implement the City of Independence Imagine Independence 2040 Comprehensive Plan through the strategic targeting of housing and community development resources projects for disadvantaged and minority persons in the locality as well as guidance in addressing fair housing mitigation issues via land use policies and regulations.
Page 3
2.0 Study Purpose and Methodology
Who Conducted The Study?
The Independence Analysis of Impediments To Fair Housing Choice, 2022-„26 was prepared by the firm of Crystal & Company for the City of Independence, Missouri (MO) The firm is a specialist in planning and program development for affordable housing in the west. To date, the firm has prepared over 100 Consolidated Plans and affordable housing strategies for states, entitlement jurisdictions, HOME Consortium, Participating Jurisdictions and nonprofit agencies. The firm has also designed a host of affordable housing programs for state and local governments that include state small cities CDBG and HOME programs, mortgage revenue bonds and mortgage credit certificates, housing trust fund programs, low income housing tax credit qualified plans, the creation of state and local public housing authorities and assisted housing programs, single- and multi- family project underwriting standards, neighborhood and downtown financing initiatives, homeless and supportive housing programs as well as specific residential, commercial and mixed-use project design, development and finance for affordable and market-rate projects. The firm also conducts Arizona real estate brokerage and is licensed in Arizona. Refer to www.crystco.com for further information on the firm.
Participants & Methodology Employed
To assess the state of fair housing in Independence in 2021/‟22, the following assessments were conducted:
1) community attitudes through public input meeting held on November 8, 2021 and April 6 of 2022 (input on the draft AI);
2) Independence fair housing online survey conducted in the Fall and Winter of 2021/‟22;
3) enforcement data from the Fair Housing Assistance Program (FHAP) and Fair Housing Initiatives Program (FHIP agencies) were analyzed;
4) analyzed statistical data from public reporting sources that included the American Community Survey (ACS) from the US census, 2010 Independence census tract data, current Home Mortgage Disclosure Act (HMDA) data, Comprehensive Housing Affordability Strategy (CHAS) data used for HUD Consolidated Planning, and extensive information from CPD maps and policymap,com, etc;
5) analyzed previous AI and related studies/surveys undertaken in and for Independence, Specifically, these documents included the Metropolitan Kansas City Affirmatively Furthering Fair Housing Plan prepared by the MidAmerican Regional Council (MARC) in November of 2016 and the Kansas City Regional Analysis of Impediments To Fair housing Choice prepared by BBC Research & Consulting in 2011;
6) prepared a regulatory review assessment through the completion of a formal survey by the locality; and,
7) other research conducted by Crystal & Company.
Page 4
Statistical Analysis
Statistical analyses were undertaken from a host of public reporting sources that included the recent American Community Survey (ACS) from the US census, varying 2010 to 2019 Independence census tract and block group data, recent HMDA data, CHAS data used for HUD Consolidated Planning and mapping information derived from policymap.com, etc. Information collected and analyzed from these sources included the following:
The tabular and spatial distribution of population by race and ethnicity within the City of Independence by census tract (2019 American Community Survey {ACS}) and the determination of minority concentrations for purposes of this report;
The distribution of HMDA data and a comparison of such to the distribution of minority households in the community;
The analysis of HUD fair housing related indicators initially noted in HUD AFH document guidelines and drawn from policymap.com.
Recent (2019) demographic comparisons between the City of Independence and Jackson County and the State of Missouri concerning the distribution of the population by age and sex as well as race and ethnicity.
Recent demographic comparisons between the City of Independence and Jackson County and the State of Missouri concerning inflation adjusted median income by race/ethnicity, household type and tenure and disability by age and sex.
The analysis of housing needs (the incidence of cost burden and market affordability gaps) drawn from policymap.com and HUD CHAS data.
Review of Previous Studies
A host of studies were reviewed by the consultant in preparing the City of Independence AI, FY 2022-‟26. They included the reports itemized below:
Kansas City Regional Analysis of Impediments To Fair housing Choice prepared by BBC Research & Consulting in 2011
Metropolitan Kansas City Affirmatively Furthering Fair Housing Plan prepared by the Mid America Regional Council (MARC) in November of 2016
City of Independence Consolidated Plan, FY 2017-‟22
City of Independence Annual Action Plan, FY 2020
City of Independence Draft Annual Action Plan, FY 2021
Input from public hearing held November 8th, 2021 and April 6th, 2022
Input from Independence online fair housing survey conducted in the Fall and Winter of 2021/2022
Etc.
Regulation, Policy and Ordinance Review
A component of the Independence AI focused on regulations, policies and ordinances with potential impact on Fair Housing in the community. The assessment and analysis was done by completing a municipal survey with municipal staff by the Community Development Department within Independence municipal government. The survey
Page 5
instrument was secured from HUD and completed by the Community Development Department Director
Fair Housing Enforcement and Complaints
The City of Independence Fair Housing Coordinator, US Department of HUD District VII FH&EO and the Missouri Department of Labor - Missouri Commission On Human Rights (MCHR) were contacted concerning fair housing enforcement and complaint data evident in Independence from the period 2016 to date All of this information was analyzed to establish any applicable trends and salient issues that appear to be surfacing in the community.
Targeted Resident Survey
An online survey of personal experience associated with fair housing was disseminated in the Winter of 2021/‟22. The online survey was not intended to be scientific or statistically valid. It was intended to see if anecdotal experience would shed light on issues identified in the areas of inquiry and to give people an opportunity to identify other problems that limited choice in securing a place to live in Independence. The survey asked people to target their comments to their experience in Independence. The online survey was generated for distribution by the city in both English and Spanish.
Page 6
3.0 Jurisdictional Data Analysis
Demographic Assessment
A host of demographic data was compiled and analyzed for this report from the US Census. Analyses at the census tract level were derived from American Community Survey estimates from 2019
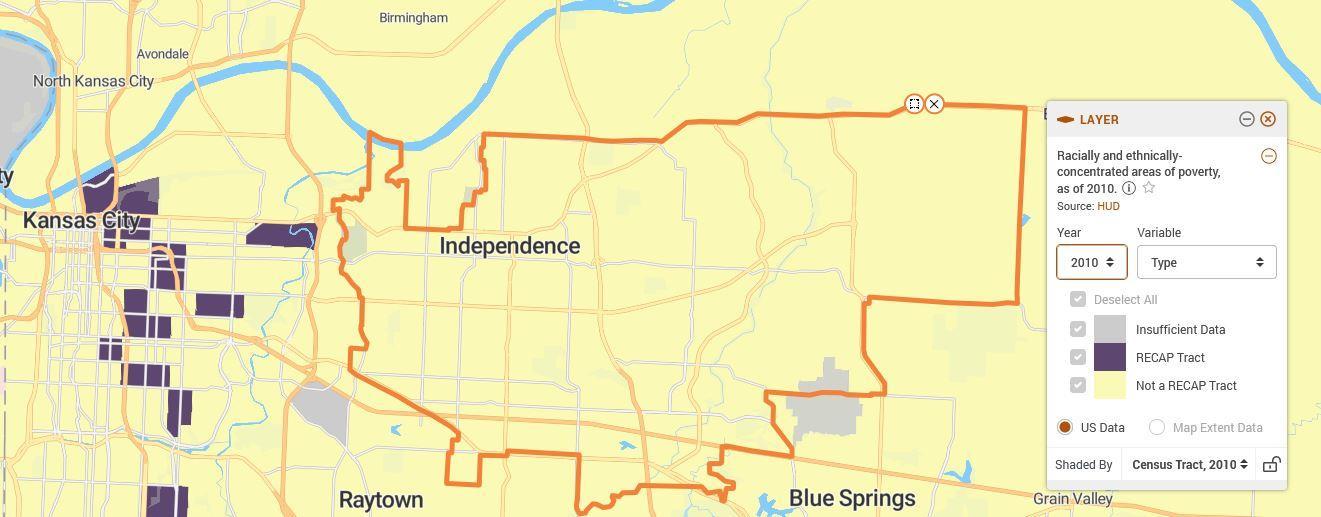
Race and ethnicity analyzed at the census tract level offer insights into concentrations of minorities within Independence One of the data items most pertinent are racially/ethnically concentrated areas of poverty (R/ECAP) R/ECAP areas are census tracts where more than half the population is non-White and 40% or more of the population is in poverty OR where the poverty rate is greater than three times the average poverty rate in the area (with revisions to these formula for non-urban areas). This designation is derived from Assessment of Fair Housing (AFH) standards. Census
Page 7
IndependenceCensus Tract(2010Tracts) Total Population Total Minority Percent Minority TractsW More% Minorities ThanThe %City Average Anglo Hispanic Black Native American Asian NativeHawaiian andOtherPacific Islander OtherRace TwoorMore Races CensusTract110 4,961 1,413 28.5% Yes 3,548 776 455 36 28 0 0 118 CensusTract112 3,056 996 32.6% Yes 2,060 190 235 30 24 147 266 104 CensusTract113 5,424 1,010 18.6% No 4,414 375 298 14 32 84 0 207 CensusTract114.01 7,835 1,812 23.1% No 6,023 515 420 73 118 399 39 248 CensusTract114.05 3,940 1,738 44.1% Yes 2,202 531 704 37 0 163 265 38 CensusTract114.06 5,670 1,169 20.6% No 4,501 343 532 19 23 83 147 22 CensusTract115 5,884 2,201 37.4% Yes 3,683 493 966 0 0 380 267 95 CensusTract116 5,181 848 16.4% No 4,333 314 191 0 29 0 0 314 CensusTract117 3,755 1,267 33.7% Yes 2,488 656 424 0 78 0 18 91 CensusTract118 4,476 1,163 26.0% Yes 3,313 433 345 13 0 0 0 372 CensusTract119 3,361 957 28.5% Yes 2,404 382 197 31 106 0 179 62 CensusTract120 3,492 1,066 30.5% Yes 2,426 385 292 7 54 0 278 50 CensusTract121 5,512 1,745 31.7% Yes 3,767 987 448 72 92 0 0 146 CensusTract122 6,386 1,665 26.1% Yes 4,721 865 460 0 65 0 26 249 CensusTract123 3,513 259 7.4% No 3,254 41 134 0 3 0 0 81 CensusTract124 3,945 1,124 28.5% Yes 2,821 397 460 20 97 0 0 150 CensusTract145.01 3,801 643 16.9% No 3,158 99 368 29 28 0 0 119 CensusTract145.02 4,268 418 9.8% No 3,850 161 149 0 12 0 0 96 CensusTract146.01 5,276 907 17.2% No 4,369 164 501 0 0 0 216 26 CensusTract146.03 3,597 685 19.0% No 2,912 197 106 0 217 14 0 151 CensusTract147.01 3,883 832 21.4% No 3,051 283 332 0 66 117 0 34 CensusTract147.02 4,939 700 14.2% No 4,239 170 170 0 188 8 0 164 CensusTract148.04 2,955 397 13.4% No 2,558 88 124 19 90 0 52 24 CensusTract156 2,371 1,341 56.6% Yes 1,030 903 276 65 34 0 0 63 CensusTract177 5,003 461 9.2% No 4,542 156 30 30 70 50 45 80 IndependenceTotal 112,484 26,817 23.8% 85,667 9,904 8,617 495 1,454 1,445 1,798 3,104 PercentofTotal 23.8% 76.2% 8.8% 7.7% 0.4% 1.3% 1.3% 1.6% 2.8%
Source:USCensus,ACS,2019.
information from 1990 – 2010 was also evaluated. No R/ECAP areas were evident in Independence for 1990 through 2010. The 2010 R/ECAP map is presented below and 2020 data is not yet available.
The segregation or Theil index that follows was generated by HUD and offers an insight into the incidence of such in 2010 (2020 not yet available). If neighborhoods within Independence exhibit a very different racial composition than the city as a whole the Index will be higher, suggesting a higher level of segregation and vice-versa. So the Independence tracts in the west in darker blue represent segregation hotspots
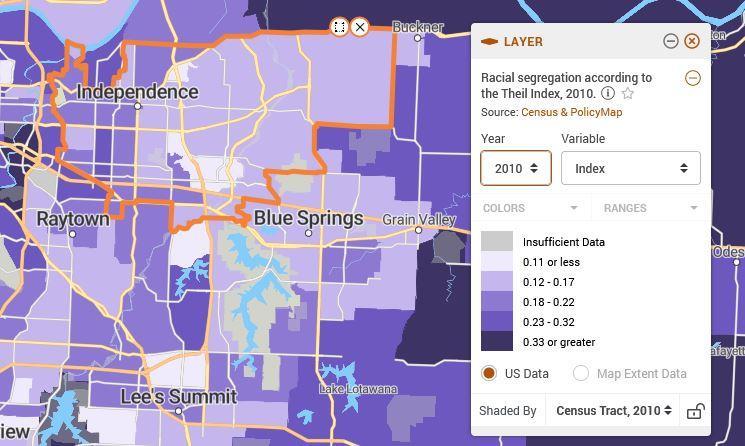
Page 8
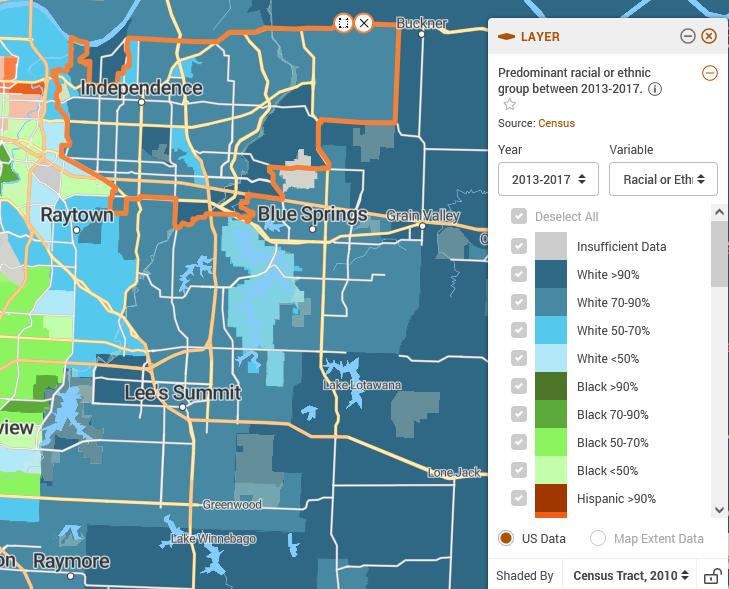
Presented in the table on page 7, those census tracts with minority populations exceeding the Independence citywide average of 23.8% are highlighted in red as „Yes‟. African Americans constitute the highest percentage of any single minority group in Independence at 10.7% of total population in 2019 The spatial distribution of racial and ethnic groups in Independence from 2013-2017 is depicted in the following map.
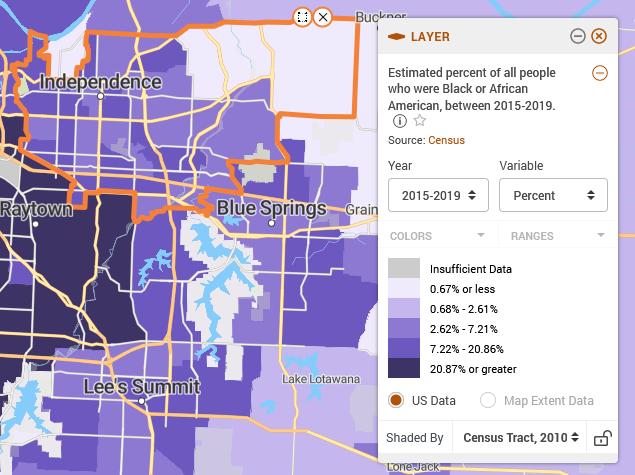
The chart below offers insight into the distribution of the primary minority group of African Americans in Independence. The western part of the community sees somewhat higher concentrations of African Americans.
Page 9
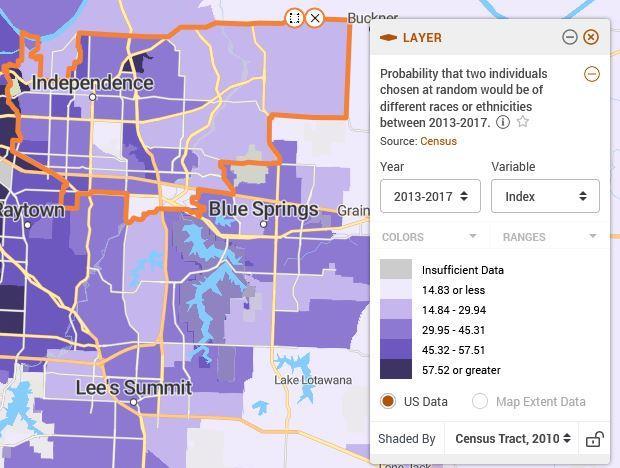
The HUD Diversity Index for Independence is defined as the probability that two individuals chosen at random would be of different races or ethnicities is presented below for 2013-2017 (latest data available). The diversity index measures racial segregation and integration, or diversity, at the regional level based on variation within jurisdictions. This approach compares the population of Whites and African Americans relative to each other and uses local data to measure jurisdictional diversity relative to the total population of both groups, thus allowing a national picture of regional segregation patterns within jurisdictions to emerge. In Independence, the index simply reinforces more diversity (not Anglo) in the western portion of the community with the most evident near the northwest border of Independence.
Compared with Missouri and Jackson County in 2019, Independence‟s population tends to contain a similar age distribution and more minorities than Missouri but less than Jackson County.
Page 10
DemographicItem Missouri % Jackson County % Independenc e % TotalPopulation 6,137,428 100.0% 703,011 100.0% 116,673 100.0% Male 3,008,169 49.0% 339,789 48.3% 55,897 47.9% Female 3,129,259 51.0% 363,222 51.7% 60,776 52.1% Under 5 365,451 6.0% 45,151 6.4% 9,669 8.3% 5to9 380,818 6.2% 43,550 6.2% 8,408 7.2% 10to14 391,770 6.4% 48,381 6.9% 7,801 6.7% 15to19 398,235 6.5% 42,557 6.1% 5,959 5.1% 20to24 394,992 6.4% 42,657 6.1% 6,503 5.6% 25to34 823,722 13.4% 109,697 15.6% 17,853 15.3% 35to44 756,709 12.3% 89,807 12.8% 13,472 11.5% 45to54 730,645 11.9% 82,061 11.7% 12,367 10.6% 55to59 420,294 6.8% 47,408 6.7% 7,857 6.7% 60to64 416,849 6.8% 43,770 6.2% 6,889 5.9% 65to74 609,250 9.9% 63,069 9.0% 10,649 9.1% 75to84 327,032 5.3% 32,258 4.6% 5,896 5.1% 85andup 121,661 2.0% 12,645 1.8% 3,350 2.9% MedianAge 39 na 37 na 37 na Race 6,137,428 100.0% 703,011 100.0% 116,673 100.0% White 5,022,939 81.8% 472,083 67.2% 85,899 73.6% Black 703,058 11.5% 161,954 23.0% 12,491 10.7% Native American 25,516 0.4% 2,283 0.3% 513 0.4% Asian 127,154 2.1% 13,066 1.9% 2,915 2.5% Native Hawaiin/Pac. Islander 10,214 0.2% 2,485 0.4% 1,752 1.5% Other 76,294 1.2% 28,513 4.1% 9,786 8.4% Twoor More 172,253 2.8% 22,627 3.2% 3,317 2.8% TotalHispanicor Latino(Any Race) 264,334 4.3% 64,986 9.2% 10,919 9.4% Not Hispanicor Latino 5,873,094 95.7% 638,025 90.8% 105,754 90.6% White Alone,Not Hispanicor Latino 4,854,400 79.1% 435,027 61.9% 82,881 71.0% TotalMinorityPopulation 1,283,028 20.9% 267,984 38.1% 33,792 29.0% Source: AmericanCommunitySurvey,2019
Further demographic information from 2019 regarding housing tenure by race/ethnicity and household type reflected a similar incidence of housing tenure as Missouri and Jackson County and a slightly lower proportion of African American renters and homeowners. Independence also includes a higher proportion of households comprised of females with no husband present. These households typically tend to be more at-risk of distress.
Incidence Of Disability Assessment
In terms of persons with a disability and not institutionalized, the incidence of such in Independence was somewhat more than Missouri and Jackson County in 2019 and a bit more prevalent among young men (5 to 17) and working age women (36 to 64).
Page 11
Item Missouri % Jackson County % Independence % Total Population 6,137,428 n/a 703,011 n/a 116,673 n.a PersonsPer Household 2.50 n/a 2.40 n/a 2.47 n/a Households 2,458,337 100.0% 292,571 100.0% 47,329 100.0% Families 1,546,045 62.9% 169,941 58.1% 28,617 60.5% With Children Under 18 692,909 28.2% 79,227 27.1% 14,324 30.3% Female householder, no husband present 175,288 7.1% 24,630 8.4% 5,810 12.3% Occupied Housing Units 2,458,337 100.0% 292,571 100.0% 47,329 100.0% Owner Occupied 1,650,019 67.1% 169,643 58.0% 27,257 57.6% Renter Occupied 808,318 32.9% 122,928 42.0% 20,072 42.4% Renter Occupied UnitsBy Race 808,318 100.0% 122,928 100.0% 20,072 100.0% White 574,872 71.1% 72,134 58.7% 14,207 70.8% Black 173,634 21.5% 40,181 32.7% 3,544 17.7% Native American 5,648 0.7% 721 0.6% 0 0.0% Asian 19,948 2.5% 1,799 1.5% 352 1.8% All Other 34,216 4.2% 8,093 6.6% 1,969 9.8% Hispanic of Any Race 35,926 4.4% 9,281 7.5% 1,369 6.8% Owner Occupied UnitsBy Race 1,650,019 100.0% 169,643 100.0% 27,257 100.0% White 1,481,955 87.4% 134,468 89.1% 24,481 91.0% Black 107,414 2.1% 26,474 2.4% 912 1.5% Native American 5,073 2.6% 722 0.8% 0 0.6% Asian 26,559 2.0% 2,332 2.4% 305 2.8% All Other 29,018 5.8% 5,647 5.2% 1,559 4.0% Hispanic of Any Race 37,447 10,697 1,616 Source: American Community Survey, 2019. Item Missouri % Jackson County % Independence % TotalPopulation(Non-Institionalized) 6,020,665 n/a 695,889 n/a 115,509 n/a PercentofPopulationWithA Disability&NotInstitutionalized 14.7% n/a 13.3% n/a 15.8% n/a TotalNon-InstitutionalizedPersons WithADisabilitry 887,896 n/a 92,647 n/a 18,200 n/a Non-InstitionalizedMalesWithA Disability 435,510 100.0% 43,377 100.0% 9,357 100.0% UnderAge 5 819 0.2% 57 0.1% 0 0.0% Age 5to17 40,509 9.3% 3,986 9.2% 1,489 15.9% Age 18to34 59,676 13.7% 6,797 15.7% 1,222 13.1% Age 35to64 167,536 38.5% 17,335 40.0% 2,920 31.2% Age 65to74 81,870 18.8% 6,976 16.1% 1,617 17.3% Over75 85,100 19.5% 8,226 19.0% 2,109 22.5% Non-InstitionalizedFemalesWithA Disability 452,386 100.0% 49,270 100.0% 8,843 100.0% UnderAge 5 1,282 0.3% 340 0.7% 0 0.0% Age 5to17 22,974 5.1% 2,441 5.0% 212 2.4% Age 18to34 48,984 10.8% 5,240 10.6% 519 5.9% Age 35to64 183,467 40.6% 21,132 42.9% 4,184 47.3% Age 65to74 80,952 17.9% 8,024 16.3% 1,615 18.3% Over75 114,727 25.4% 12,093 24.5% 2,313 26.2% Source: AmericanCommunity Survey, 2019.
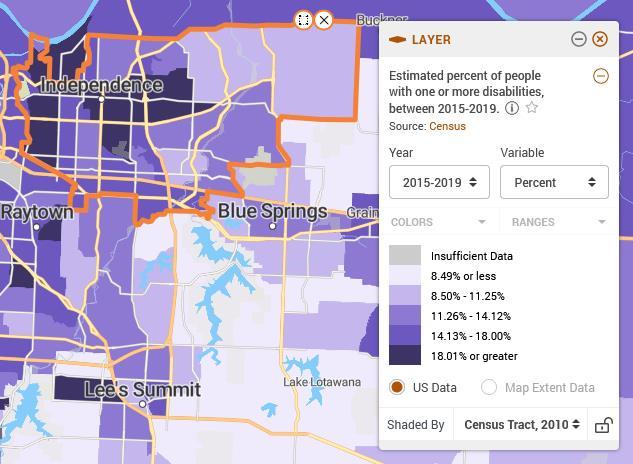
The population with a disability that were not institutionalized in 2019 is depicted in the following map, with central and west Independence indicating the highest concentrations.
Drawn from the Mid-America Regional Council (MARC) Affirmatively Furthering Fair Housing Plan in 2016, “Independence has 18,562 persons with disabilities”. By age, 5.9 percent of all children and youth age 5-17 years have a disability; 14.6 percent of the working age (18-64) population have a disability, and 38.9 percent of elderly persons (>65) have a disability. Of the city‟s persons with disabilities, those with an ambulatory disability numbered 10,857, followed by cognitive disability affecting 7,320 persons. 54 percent of the city‟s population resides in neighborhoods with high concentrations of persons of color and those in poverty, and a slightly higher 57 percent of the disabled reside in these neighborhoods. The Independence Citizens with Disabilities Advisory Board conducted a survey in 2013 of transit service routes and bus stops along five routes in the city of Independence. Improvements needed for some stops were identified, including concrete waiting areas with wheelchair ramps, need for shelters and benches. The city of Independence, Missouri, operates paratransit services within its city limits. While 31.7% of the region‟s public housing occupants were disabled in 2016 (and somewhat less for other HUD housing programs), Independence does offer publically supported housing for disabled persons in need.”
Going forward, Independence will continue to foster access to proficient schools, publically supported housing and transportation for disabled persons, mitigate inaccessible structures, public infrastructure and governmental services, strengthen the availability/accessibility of affordable dwellings in a variety of sizes, enhance the easy transition from institutional to integrated dwellings, enhance needed supportive services and be cognizant of regulatory barriers that adversely affected disabled persons.
Page 12
Income & Poverty Assessment
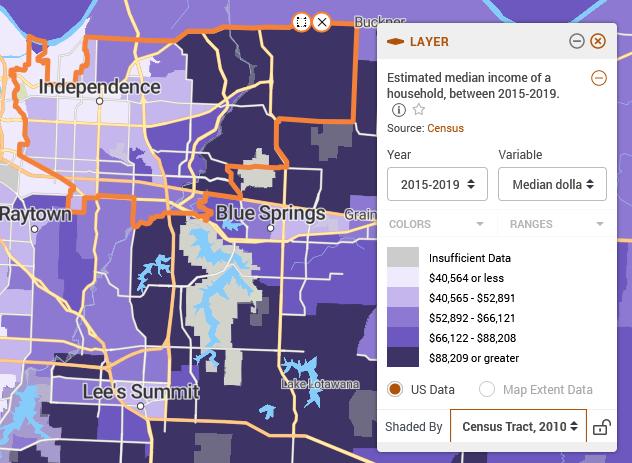
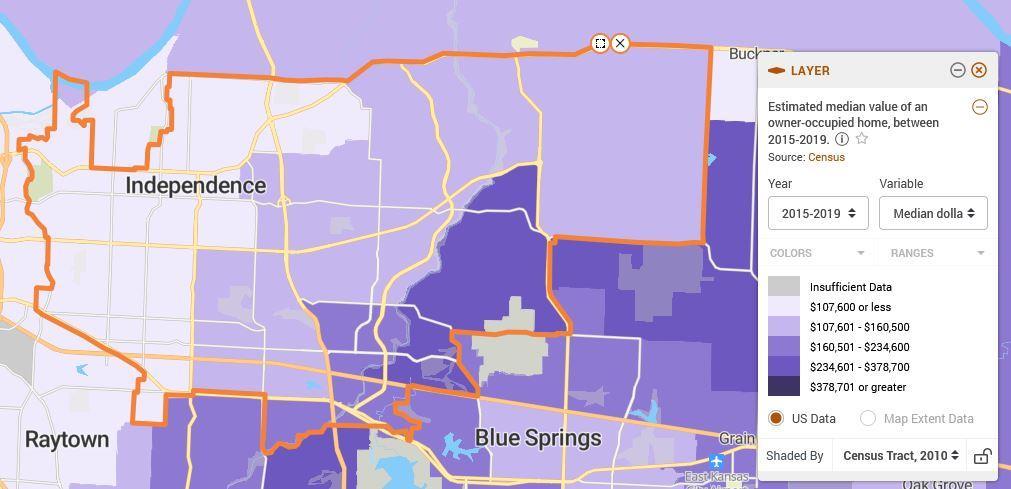
The distribution of median household income in 2019 follows for Independence Again, portions of western and central Independence evidence lower income regions consistent with information presented earlier.
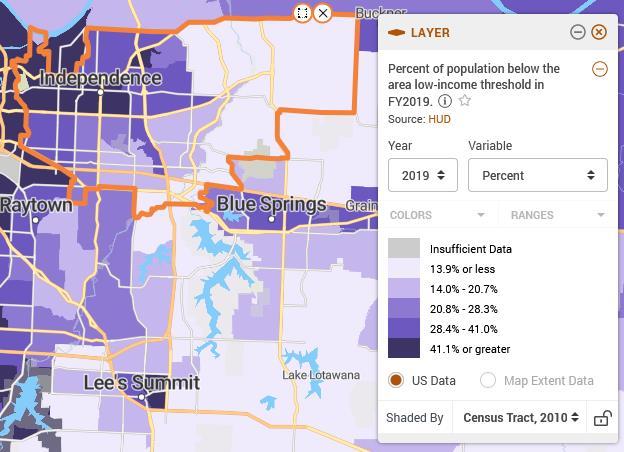
Refer to the map below evidencing the incidence of low income households in 2019 which obviously correlates with the incidence of heightened distress in some of the western and central portions of Independence.
Page 13
In 2019, the median income of $53,235 was about 8% less than both Missouri and Jackson County. For the African American population, median income in Independence was almost 20% less than Missouri and Jackson County.
The distribution of households in poverty in Independence in 2019 is depicted in the following map and appears to be concentrated in the western and central sections of the community
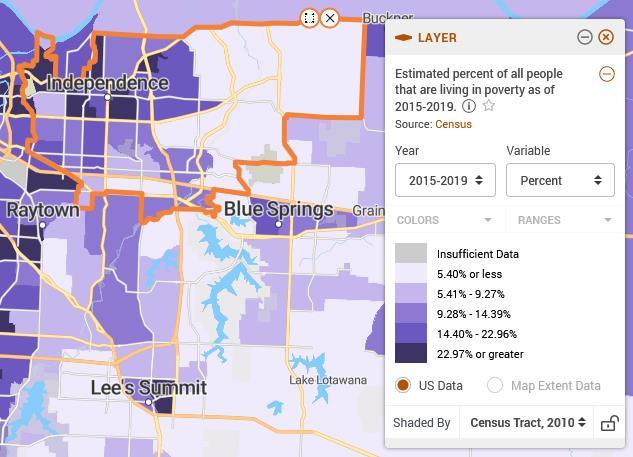
Page 14
Median Income By Race/Ethnicity Missouri Jackson County Independence Total $57,409 $57,936 $52,325 White $60,756 $66,087 $56,459 Black $39,102 $38,885 $31,440 Native American $31,186 $60,986 n/a Asian $75,505 $42,183 $49,934 Hawaiin & Pacific Islander $48,300 n/a n/a White, Not Hispanic $60,954 $68,024 $55,322 Hispanic (any race) $50,839 $47,260 $51,945 Source: American CommunitySurvey, 2019
As expected, the incidence of families in poverty in Independence in 2019 is more than Missouri and Jackson County with significantly higher concentrations among at-risk households comprised of single women with and without children under age 18.
Education Assessment
Drawn from the 2106 MARC fair housing study noted earlier, “The city is primarily served by the Independence School District, with 71 percent free and reduced lunch and 38 percent non-white. The school proficiency index is low across races, with somewhat higher scores for Asian and white students. According to HUD-provided data, the level of school proficiency is lower in Independence and Leavenworth than the region as a whole, but consistent across races. This is the result of having a single school district, or very few school districts, within each city. Both Blue Springs and Independence share relatively low levels of disparity in access to proficient schools by race. This dynamic is likely explained by the relative homogeneity of their populations, the relative lack of segregation within their boundaries (as distinct from segregation between those cities and the surrounding area)… The one major caveat to this overall pattern is that Hispanic residents and persons of Mexican national origin have modestly but noticeably less access to proficient schools than do members of other groups in Independence. Additionally, the disproportionately high level of access to proficient schools for Native American residents in Independence would appear to be a product of the very small population of Native Americans in the area rather than a reflection of something deeper. Independence falls somewhat below regional school proficiency scores, but is fairly even across races.”
Page 15
Item Missouri % In Poverty Jackson County % In Poverty Independence % In Poverty TotalFamilies 1,546,045 n/a 169,945 n/a 28,617 n/a FamiliesInPoverty 136,052 8.8% 15,466 9.1% 4,035 14.1% MarriedCouples 1,160,554 n/a 119,016 n/a 19,230 n/a MarriedCouplesinPoverty 47,583 4.1% 3,570 3.0% 769 4.0% MarriedCouplesWithKidsAged LessThan18 450,010 n/a 48,418 n/a 7,906 n/a MarriedCouplesWithKidsAged LessThan18InPoverty 23,400 5.2% 1,839 3.8% 435 5.5% FemalesWithNoHusbandPresent 274,071 n/a 38,729 n/a 8,051 n/a FemalesWithNoHusbandPresent InPoverty 70,710 25.8% 12,006 31.0% 3,148 39.1% FemalesWithKids< 18WithNo HusbandPresent 175,288 n/a 24,630 n/a 5,810 n/a FemalesWithKids< 18WithNo HusbandPresent 61,350 35.0% 10,492 42.6% 2,981 51.3% TotalPopulationFor WhchPoverty isDefined 5,953,025 n/a 691,159 n/a 115,075 n/a PopulationInPoverty 770,175 12.9% 93,256 13.5% 19,820 17.2%
Source:2019AmericanCommunitySurvey.
As noted repeatedly in this study and affirmed by MARC, “The city of Independence has some concentration of people of color in its western reaches, and becomes increasingly white to the east where there are more job opportunities and services. However, because it is served by a single school district, children across the city have access to better educational opportunities”.
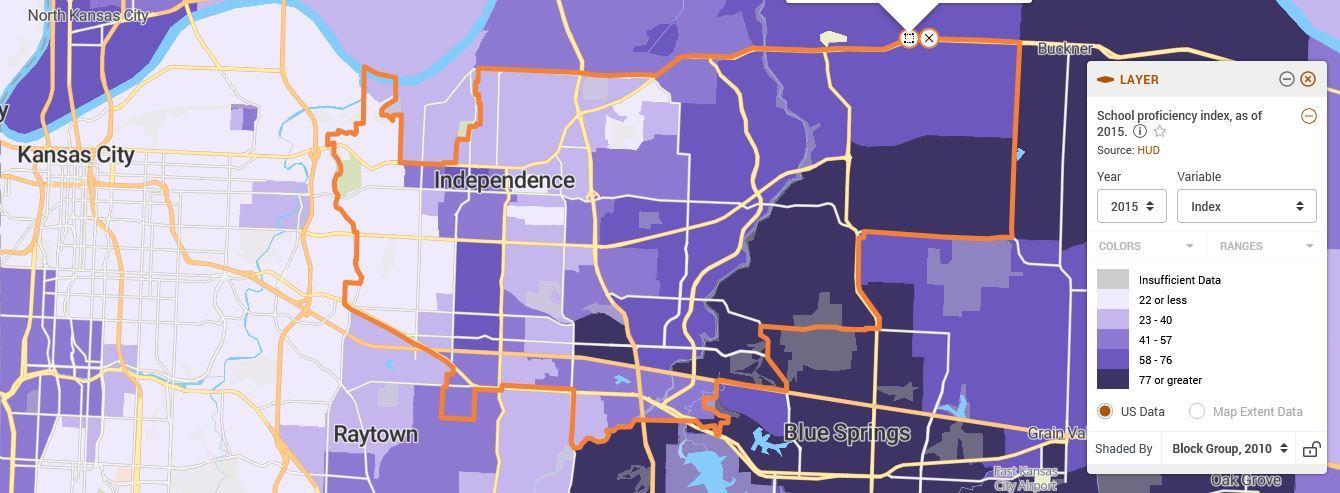
Refer to the 2015 school proficiency index below. Generated by HUD, it uses schoollevel data on the performance of 4th grade students on state exams to describe which neighborhoods have high-performing elementary schools nearby and which are near lower performing elementary schools. The school proficiency index is a function of the percent of 4th grade students proficient in reading and math on state test scores.
Note
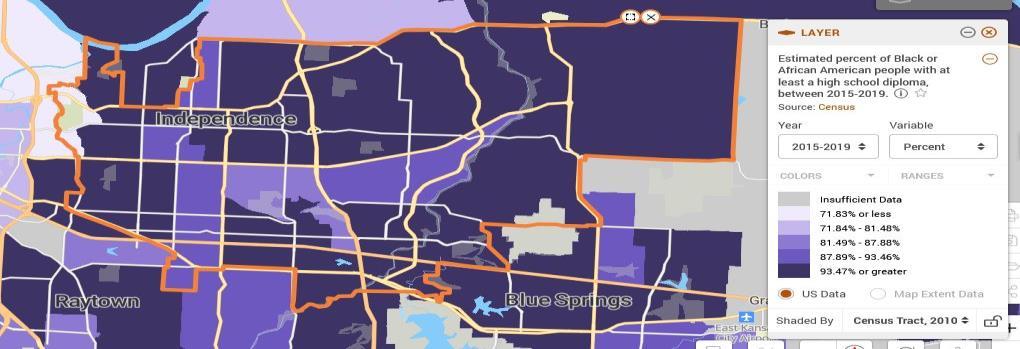
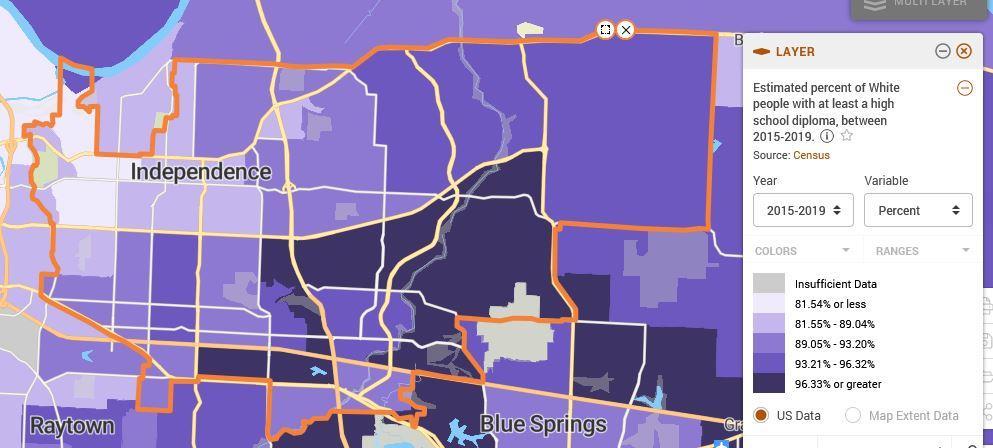
Page 16
the following distributions of high schools graduates plus for Anglos and African Americans.
Employment Assessment
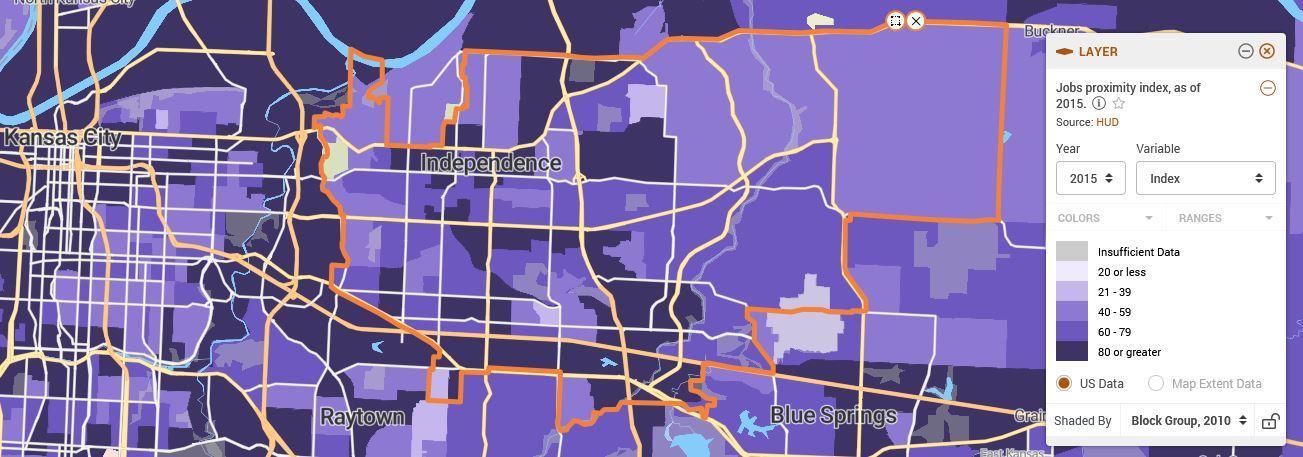
The HUD jobs proximity index quantifies the accessibility of a given residential neighborhood as a function of its distance to all job locations within a CBSA (aka metro area), with larger employment centers weighted more heavily. Drawn from the MARC study noted earlier, “the population center of Independence has access to 22 percent of the region‟s jobs within a 10-mile radius. Both Independence and Blue Springs are relatively job-poor. In each city, nearly 11,000 or more residents leave to work elsewhere in the region than there are people working within their city.” Note the HUD jobs proximity index below. Some central and western portions of Independence hold higher indices.
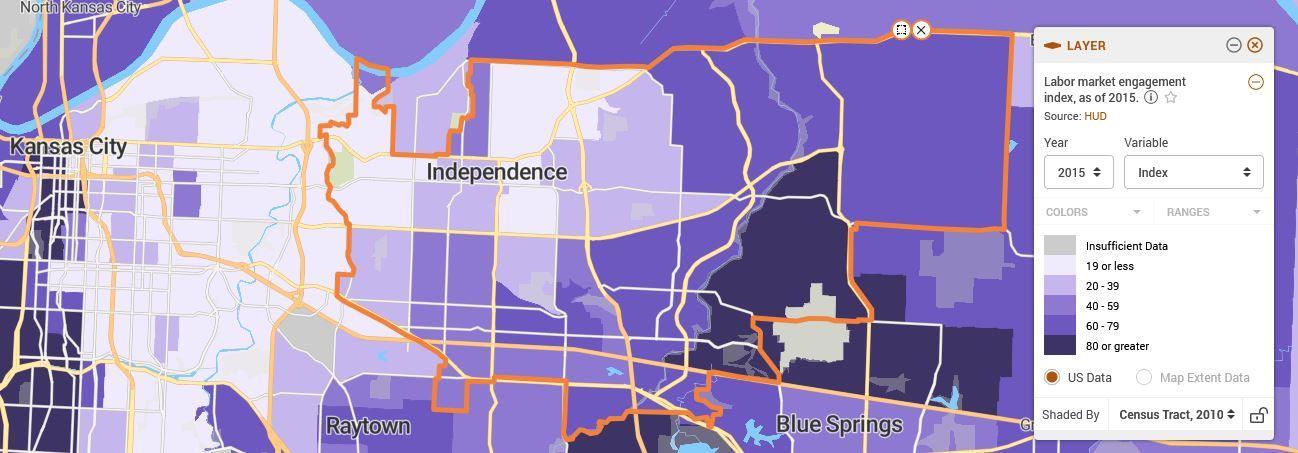
The HUD Labor-Market Engagement Index provides a summary description of the relative intensity of labor market engagement and human capital in a neighborhood. This is based upon the level of employment, labor force participation, and educational attainment in a census tract. The highest levels of the labor market engagement index were evident in the southeast portions of the locality and the lowest in the central and western portions.
Page 17
Housing (Distress) Assessment
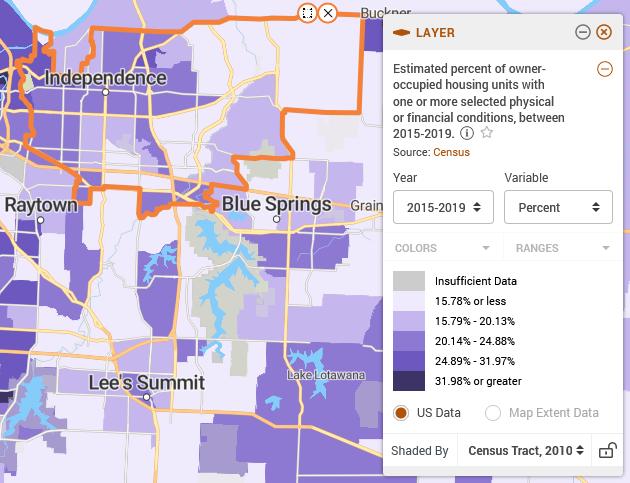
Housing distress for both owners and renters is presented by the incidence of problems defined as households paying more than 30% of their income for housing and/or lacking plumbing and/or lacking kitchen facilities and/or containing more than 1.01 persons/room (overcrowded) The location of such problems are consistent with other relevant demographic indices and indices of distress evident in the central and western portions of the jurisdiction

Page 18
Information compiled for Independence produced the following general findings covering housing distress (aka households with problems) for the period covering 2013-2017:
U.S.Dept.ofHUD CHAS dataderivedfrom specialcensus runs,2013-2017.
1) Oneoffour problems includepayingmorethan30%ofincomefor housingand/or unitlacks plumbingand/or unitlacks kitchenfacilities and/or unitcontains more than1.01personper room (overcrowded).
2/ Excludes units/households wherecostburdennotavailableandnoother problems.
Regardless of ethnicity in Independence, note the following:
6,110 or 76% of households earning less than 30% of the area median (very low income) had problems;
4,080 households or 55% earning from 31 to 50% of the area median (low income) had problems;
2,685 households or 25% earning from 51 to 80% of the median (median income households) had housing problems of some sort.
Overall, about 30% of Independence households (13,975) had housing problems;
About 20% of owner households (5,990) had problems; and
A very sizable 42% of renter households (7,985) had problems.
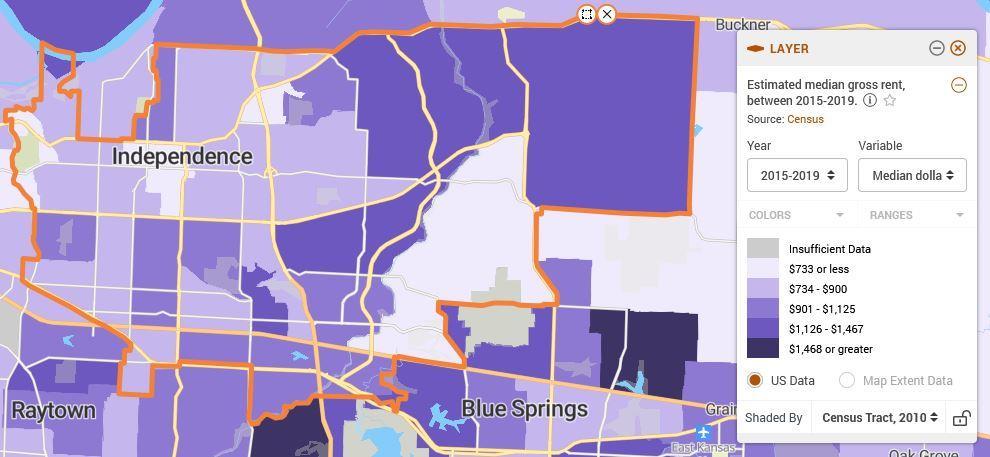
The distribution of home valuations and rent levels in Independence reinforce where those households with problems are situated as indicated below.
Page 19
Owner Renter Total HouseholdsByIncomeBracket Households Households Households TotalHouseholds 29,440 18,755 48,195 HouseholdIncome<= 30%HAMFI 2,580 5,500 8,080 HouseholdIncome>30%to<=50%HAMFI 3,715 3,735 7,450 HouseholdIncome>50%to<=80%HAMFI 6,410 4,300 10,710 HouseholdIncome>80%to<=100%HAMFI 4,000 2,195 6,195 HouseholdIncome>100%HAMFI 12,740 3,020 15,760 TotalHousehold DistressHaving OneOfFourProblemsByIncome 1/ HouseholdIncome<= 30%HAMFI 1,990 4,120 6,110 HouseholdIncome>30%to<=50%HAMFI 1,560 2,520 4,080 HouseholdIncome>50%to<=80%HAMFI 1,585 1,100 2,685 HouseholdIncome>80%to<=100%HAMFI 420 110 530 HouseholdIncome>100%HAMFI 435 130 565 Total 2/ 5,990 7,985 13,975 PercentageOfTotalHousehold Distress Having OneOfFourProblemsByIncome 1/ HouseholdIncome<= 30%HAMFI 6.8% 22.0% 12.7% HouseholdIncome>30%to<=50%HAMFI 5.3% 13.4% 8.5% HouseholdIncome>50%to<=80%HAMFI 5.4% 5.9% 5.6% HouseholdIncome>80%to<=100%HAMFI 1.4% 0.6% 1.1% HouseholdIncome>100%HAMFI 1.5% 0.7% 1.2% Total 2/ 20.3% 42.6% 29.0% Source:
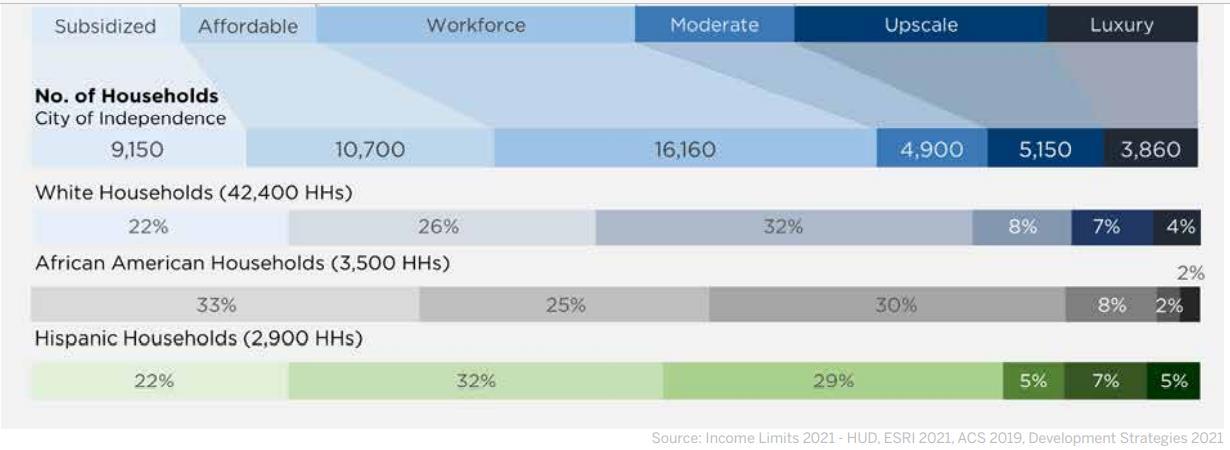
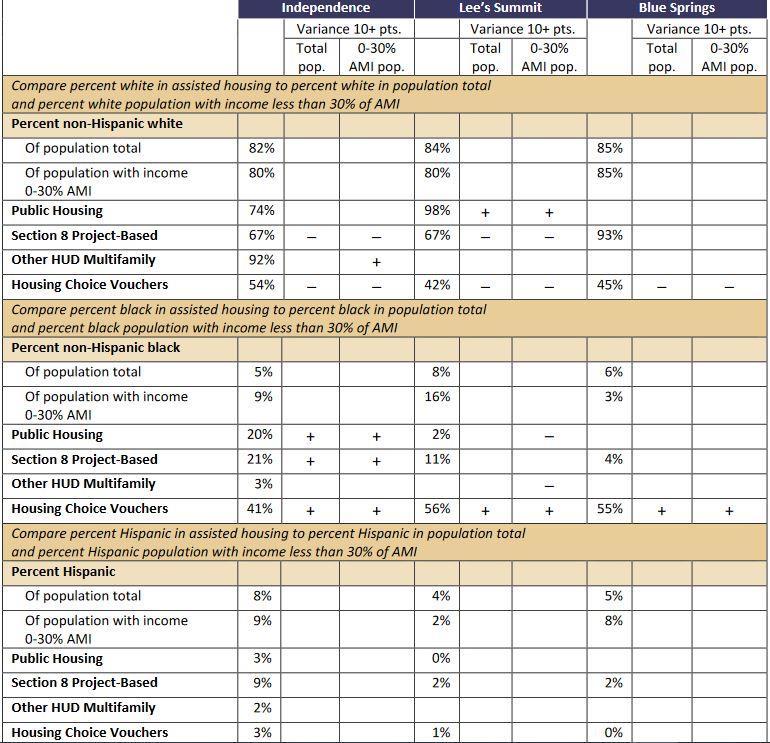
Drawn from the MARC study in 2016, the following table indicates the incidence of households and persons securing governmental housing support compared with their
Page 20
proportion of the total Independence population. While African Americans were securing resources beyond their percentage composition of the total and lower-income population of Independence, Hispanics were generally not.
The housing assessment conducted herein reinforce local and regional issues identified in the 2016 MARC study. Independence will continue to assess the following items in addition to others:
Page 21
Drawn from the Independence Housing Study in 2022, note the following distribution of housing being provided by race/ethnicity.
Admissions and occupancy policies and procedures, including preferences in its publicly supported housing
The ongoing quality of its affordable housing information programs
Opportunities to preclude landlords from discriminating against HCV households attempting to use vouchers as a source of payment for rent.
Foster land use and zoning laws conducive to affordable housing
Mitigate community opposition to affordable housing
Continue to foster convenient and affordable public transit options for poor households who are transit dependent.
Foster public investment in targeted neighborhoods, including services and amenities
Continue to foster siting selection policies, practices and decisions for publicly supported housing, including discretionary aspects of Qualified Allocation Plans and other programs
Transportation Assessment
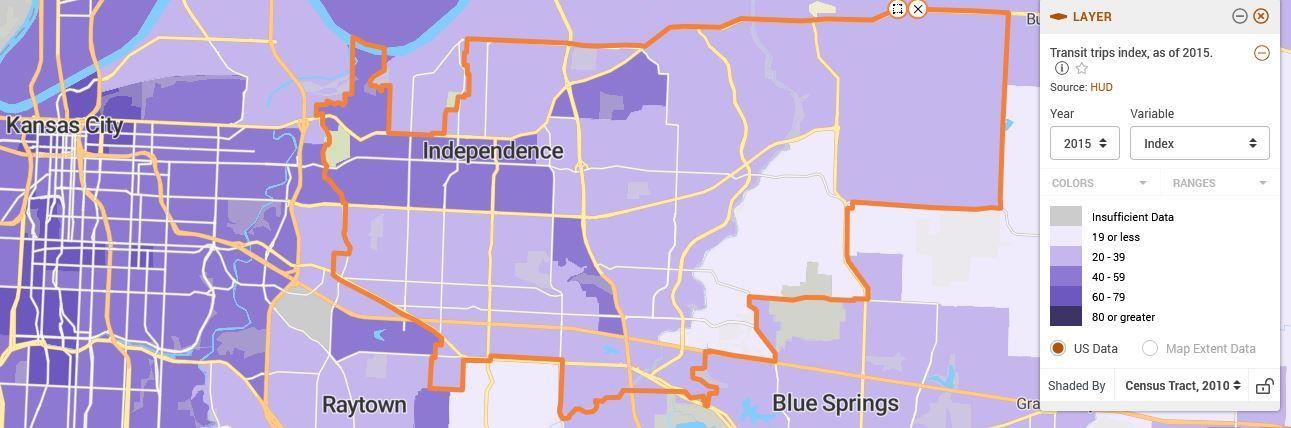
The HUD Low Transportation Cost Index is based on estimates of transportation costs for a family that meets the following description: a 3-person single-parent family with income at 50% of the median income for renters in the region (i.e. metro area). The central part of the community appears the most impacted here. Also note the transportation trips index (commuter related).
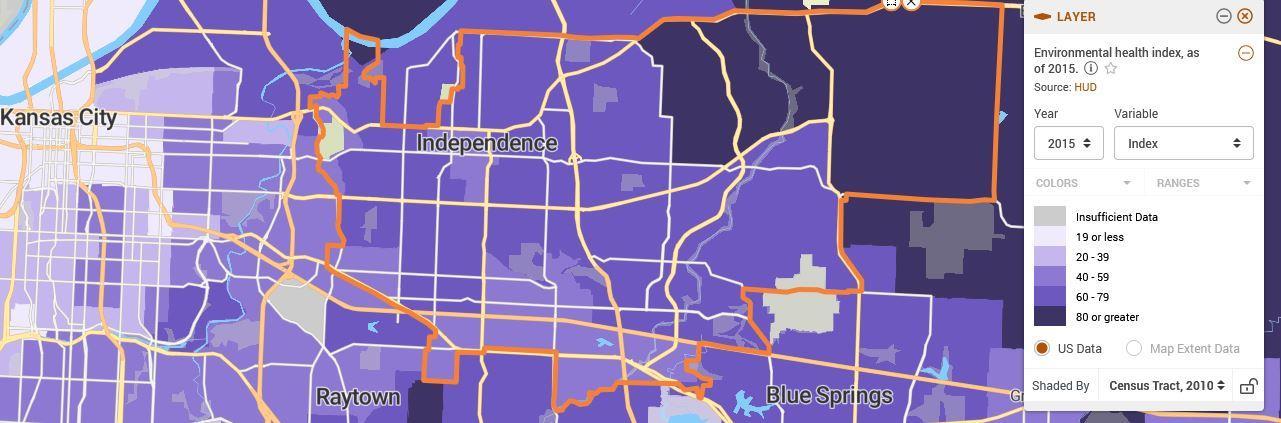
Environmental Health Hazard Exposure Assessment
The HUD Environmental Health Hazard Exposure Index summarizes potential exposure to harmful toxins at a neighborhood level. The northern and central portions of Independence appear less affected than the northeast quadrant of the locality.
Page 22
Home Lending From HMDA Assessment
Information derived from HMDA was analyzed relative to lending patterns evident in Independence as of late (2017) More recent information was sought but none available by tract.
Generally speaking, when the incidence of loan denials for new FHA/VA and conventional loans in 2017 were compared with the incidence of minorities by census tract in 2019, no correlations were evident. For refinancing and home improvement loan denials, no coherent correlations were also apparent. Realize refinancing and home improvement origination loan data appeared somewhat questionable.
HOMEMORTGAGEDISCLOSUREACT(HMDA)LOANACTIVITY,2017 LOANAPPLICATIONSANDDENIALS BYCENSUSTRACTININDEPENDENCE COMPAREDWITHMINORITYINCIDENCEIN2019
Page 23
Independence CensusTract(2010 Tracts) FHA Loans Originated FHA Loans Denied Percent Denied Conventional Loans Originated Conventional LoansDenied Percent Denied Refinancing Loans Originated Refinancing Loans Denied Percent Denied HOME Improvement Loans Originated HOME Improvement LoansDenied Percent Denied Percent Minority (In2019) TractsW More% Minorities ThanThe %CityIn 2019 CensusTract110 21 4 16% 19 2 10% 9 15 63% 4 2 33% 28.5% Yes CensusTract112 26 6 19% 15 2 12% 17 12 41% 1 0% 32.6% Yes CensusTract113 32 10 24% 18 4 18% 32 23 42% 3 3 50% 18.6% No CensusTract114.01 69 9 12% 97 9 8% 94 44 32% 8 7 47% 23.1% No CensusTract114.05 13 1 7% 10 1 9% 9 8 47% 1 1 50% 44.1% Yes CensusTract114.06 51 7 12% 24 3 11% 22 18 45% 5 3 38% 20.6% No CensusTract115 30 9 23% 24 3 11% 22 18 45% 5 3 38% 37.4% Yes CensusTract116 20 4 17% 19 4 17% 21 11 34% 1 3 75% 16.4% No CensusTract117 6 1 14% 18 1 5% 22 10 31% 1 3 75% 33.7% Yes CensusTract118 20 8 29% 30 1 3% 13 13 50% 1 3 75% 26.0% Yes CensusTract119 29 4 12% 24 3 11% 38 12 24% 2 4 67% 28.5% Yes CensusTract120 34 8 19% 22 8 27% 30 14 32% 2 3 60% 30.5% Yes CensusTract121 36 6 14% 40 3 7% 52 26 33% 2 3 60% 31.7% Yes CensusTract122 50 13 21% 42 10 19% 61 31 34% 4 11 73% 26.1% Yes CensusTract123 27 2 7% 31 0% 39 29 43% 5 4 44% 7.4% No CensusTract124 52 9 15% 33 3 8% 42 21 33% 12 6 33% 28.5% Yes CensusTract145.01 28 4 13% 34 1 3% 48 20 29% 5 4 44% 16.9% No CensusTract145.02 12 0% 35 7 17% 40 23 37% 6 6 50% 9.8% No CensusTract146.01 50 6 11% 42 6 13% 54 38 41% 4 0% 17.2% No CensusTract146.03 34 2 6% 28 1 3% 48 14 23% 9 4 31% 19.0% No CensusTract147.01 18 6 25% 28 3 10% 40 8 17% 6 0% 21.4% No CensusTract147.02 42 1 2% 33 1 3% 83 35 30% 8 6 43% 14.2% No CensusTract148.04 16 0 0% 52 3 5% 67 15 18% 7 5 42% 13.4% No CensusTract156 1 0% 5 1 17% 2 5 71% 56.6% Yes CensusTract177 54 7 11% 52 12 19% 75 35 32% 11 2 15% 9.2% No Total 771 127 14% 775 92 11% 980 498 34% 113 86 43%
Source:FFIEC,2017,ACS2019.
4.0 Evaluation of Jurisdiction’s Current Fair Housing Legal Status
Prepared by the Mid-American Regional Council (MARC) in 2017, The Kansas City Regional Analysis Of Impediments To Fair Housing Choice Study indicated the following fair housing complaints filed with the HUD Region VII Fair Housing & Equal Opportunity Office (FH&EO) in the region from Oct 1, 2010 to Sept 30, 2015
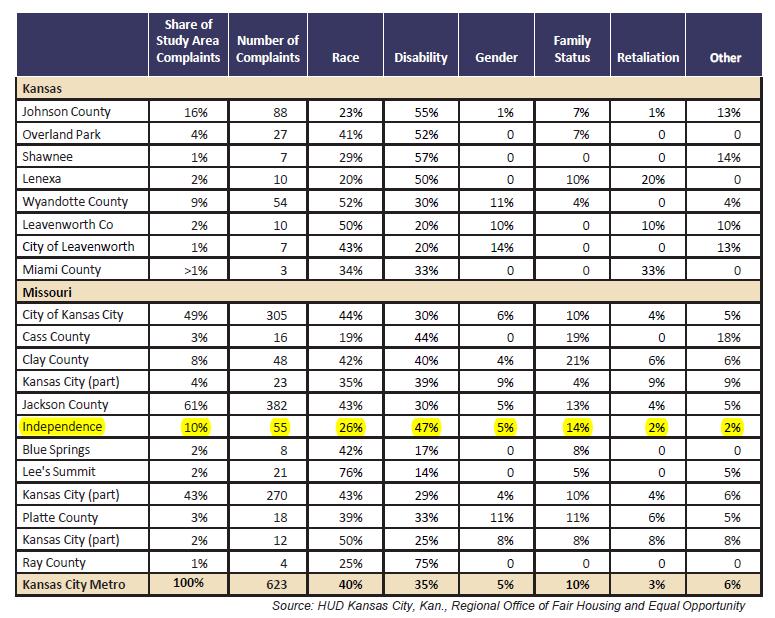
Noted above, annual averages (2010 to 2015) of approximately 11 complaints were filed with HUD for the following reasons. No trends of any consequence appear evident from the data with the exception of the significant incidence of disability
Disability at 47% of the total;
Race at 26%;
Familial status at 14%; and,
Gender, retaliation and other from 2.0 to 5% each
Drawn from the 2017 MARC Fair Housing Study, “Note that in April 2015, the HUD Office of Fair Housing & Equal Opportunity (FHEO) reached two Voluntary Compliance Agreements (VCAs) with the Housing Authority of Independence (HAI), Missouri, resolving HUD findings which showed that the agency failed to provide persons with disabilities and individuals with limited English proficiency meaningful access to its HUDfunded housing programs. HAI owns and operates 522 public housing units and administers more than 1,600 Housing Choice Vouchers. The two agreements are the result of a HUD compliance review of the housing authority‟s operations, which found that the agency was not fulfilling its obligation to provide access to services for persons with disabilities and individuals with limited English proficiency, as required by Section
Page 24
504 of the Rehabilitation Act of 1973 and Title VI of the Civil Rights Act of 1964.” http://portal.hud.gov/hudportal/HUD?src=/press/press_releases_media_advisories/2015/HUD No_15-042
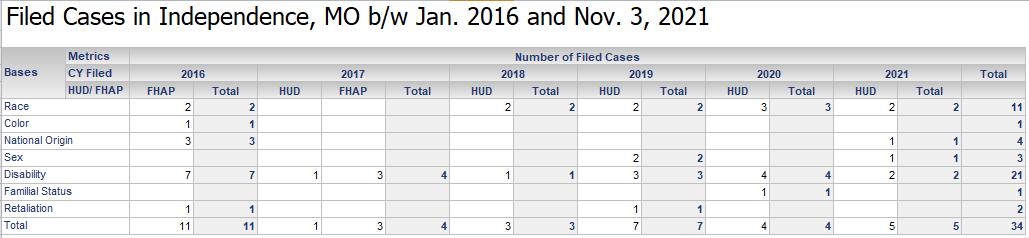
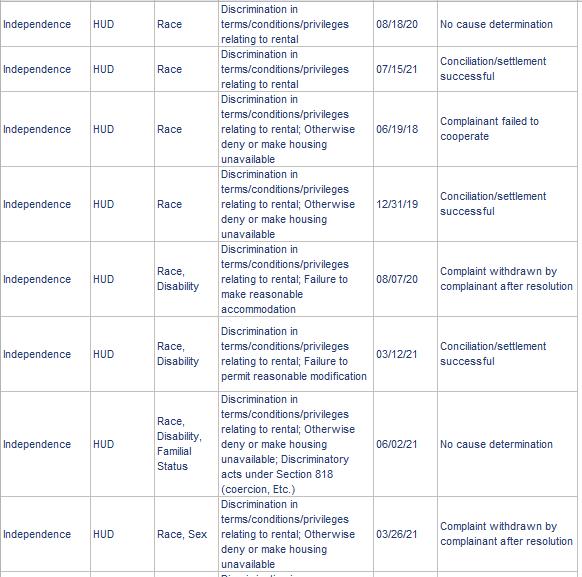
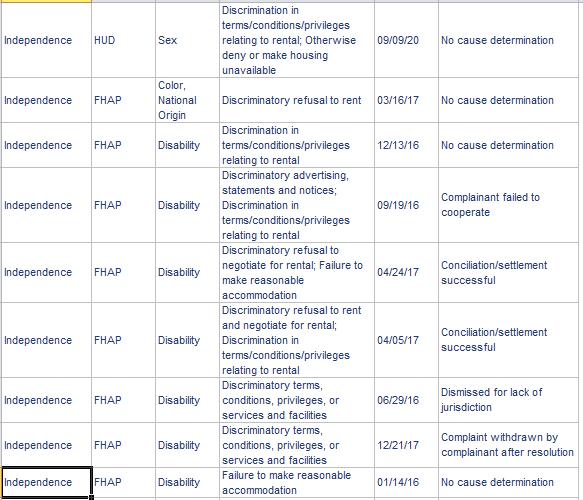
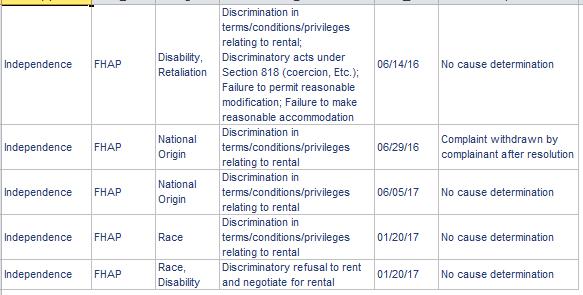
Contact was made with the HUD Regional FH&EO Office and the State Of Missouri Department of Labor Commission On Human Rights (MCHR) in October of 2021 to collect information on the number, type and disposition of fair housing complaints evident from Independence from 2016 to date. The US Department of Housing and Urban Development Region VII FH&EO Office all information on the complaints filed. MCHR was contacted in 10/‟21 and indicated they were getting a new computer system and referred us to HUD FHEO Region VII. In addition, per HUD FHEO, Missouri state law changed around 2016/‟17 and any complaints filed with them related to state statute that is not equivalent with federal law. Thus, of the 34 total complaints filed, the largest category by far was for disability (21) with the second being race (11). From information contained within the prior AI prepared by MARC, HUD brought compliance reviews with the City of Independence Housing Authority (HAI). Per MARC, “HAI owns and operates 522 public housing units and administers more than 1,600 Housing Choice Vouchers. The two agreements (reached with the HAI) are the result of a HUD compliance review of the housing authority‟s operations, which found that the agency was not fulfilling its obligation to provide access to services for persons with disabilities and individuals with limited English proficiency, as required by Section 504 of the Rehabilitation Act of 1973 and Title VI of the Civil Rights Act of 1964.
Note: The numbers don‟t add up since persons filing complaints may fall (and do) in more than one of the categories mentioned.
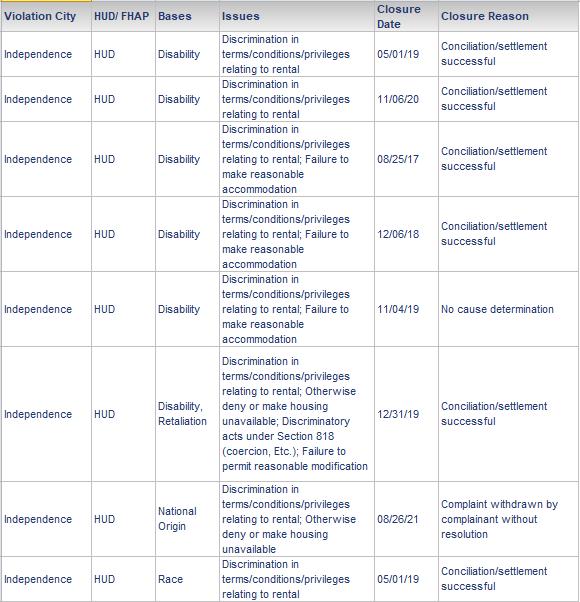
The resolution of the cases filed with HUD Region VII FHEO from January of 2016 to date (November, 2021) are noted below. This information was also provided by HUD FHEO.
Page 25
Page 26
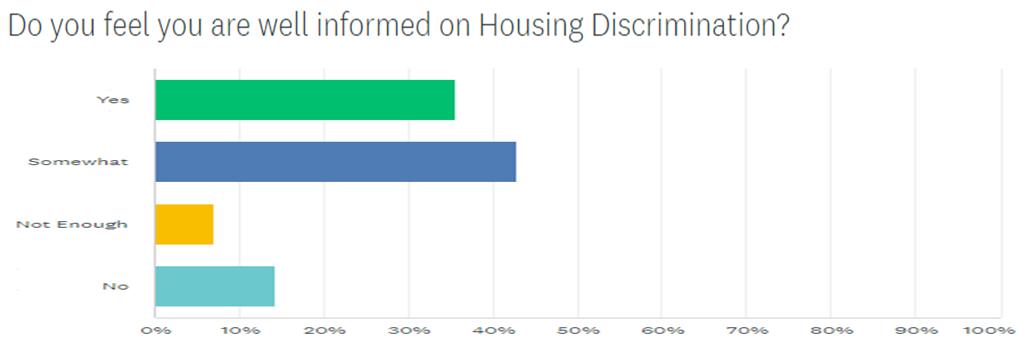
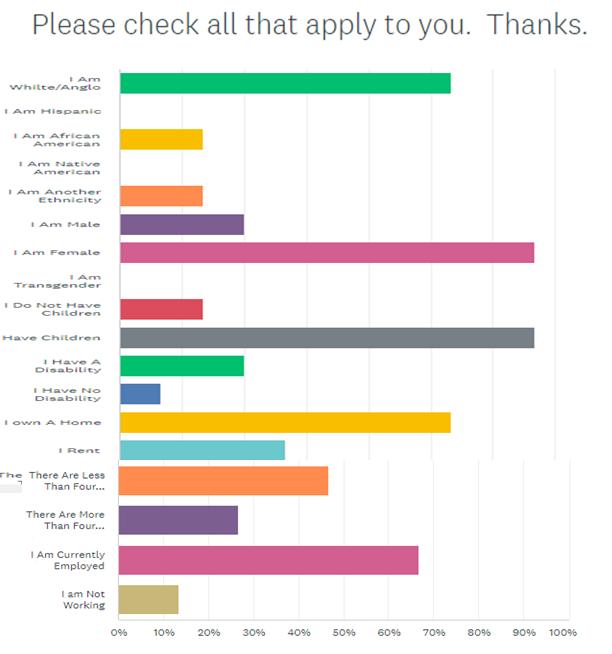
An online fair housing survey was conducted in the Fall/Winter of 2021 and ‟22 attempting to secure insight into the incidence of fair housing problems in Independence. The survey was generated in both English and Spanish and distributed to the public by city staff. Survey results follow.
Page 27
Page 28
Page 29
CITY OF INDEPENDENCE FAIR HOUSING DIVISION ANALYSIS OF IMPEDIMENTS TO FAIR HOUSING CHOICE, 2021
November 8, 2021 Community Input Meeting Notes
FY 2022-2026 Analysis Of Impediments To Fair Housing Choice Findings
Overall Top Fair Housing Needs/Priorities – People really don‟t understand what their rights are. Education of both tenants and landlords is key.
Incidence of Fair Housing Discrimination Experienced
Are you aware of any housing discrimination that occurs? If so, what kind?
Not rent or sale to certain racial demographics
Not rent to individuals with children
Not rent to someone that has a disability
What are some of the things that can be done to overcome discrimination?
Housing authorities are required to review the 4 Factor Analysis of the Safe Harbor Rule by HUD that looks at the top used languages in the area that we serve and provide documents in those languages or interpreters. It is the LEP policy – Limited English Proficiency.
I think the City needs to coordinate with the County and work together on the Fair Housing topic. We all love the new term AFFH.
Housing Market/Supply Conditions Affecting Housing Choice
Is there an adequate supply of livable ownership and rental housing for residents regardless of their income? If not, what is needed?
There is not an adequate of supply of affordable rentals. I think we need to expand in all areas, owner, rental, we need homes that are under $125,000 for low-income individuals to be able to purchase. Section 8 vouchers can be used to assist in payment of mortgages for Homeownership programs.
The supply of affordable housing that is adequate and meets housing standards needs to be expanded. I feel there are stereotypes and misinformation about lowincome housing units and a desire to not have them built as they will impact “resale value” or overall value of a neighborhood.
Supply of Housing for Persons with Disabilities
Is there an adequate supply of housing that is accessible to people with disabilities? If not, what is needed?
I don‟t specifically have housing for disabled but I do have preferences on our application for Elderly and for people with disabilities to help get them into housing quicker. I only have 528 units with a waiting list of 4,000 – we need more affordable units.
Page 30
Neighborhood Resident Access to Public Amenities
Are public resources (e.g. parks, schools, roads, police and fire services, etc.) invested equitably throughout neighborhoods? If not, what is needed and where?
Transit services have decreased their service areas and need to expand and not decrease.
Infrastructure needs attention in certain areas of the City.
Police response in certain areas of the City.
I would agree that certain areas of the City need more attention/repair than others. Expand public transit options and availability.
We need more retail, businesses in certain areas of the city. Maybe incentives to bring those businesses in to provide jobs close to the low-income developments. Then transportation would not be an issue. Parts of the City that are blighted with manufacturing buildings or warehouses, businesses, houses that are abandoned.
Fair Housing Resources and Mitigation
What type of fair housing services (education, complaint investigation, testing) are in the area?
Fair housing complaints go to the HUD KC Field Office in KC, KS.
Our direct service providers in our housing programs educate clients on their housing rights and landlords are given info on VAWA housing rights for tenants. If a client feels they are experiencing an issue and want to file a complaint, they are assisted by their advocate or case manager.
Other Issues
Are there other issues or recommendations related to our discussion you would like to raise?
We issue all applicants with Violence Against Women Act (VAWA) housing rights as well as our current tenants at their Annual Re-examination for Continued Services. They sign a form showing they received the information. We also hand out Fair Housing Materials and flyers for both Public Housing and Section 8. We do a Fair Housing Training once a year for all employees.
Page 31
5.0 Identification of Public Impediments to Fair Housing Choice
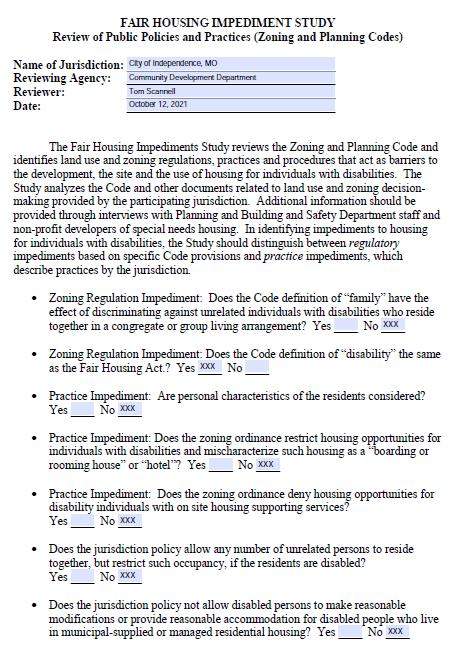
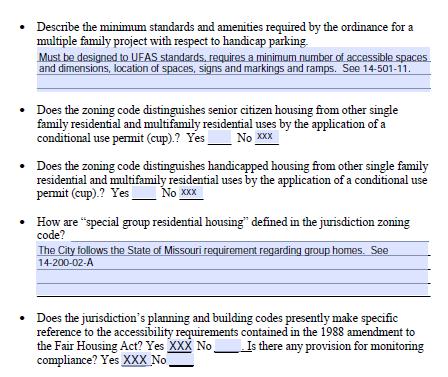
A variety of efforts were undertaken to assess the public sector in the City of Independence with respect to zoning and site selection. Consistent with past FHEO suggestions, the following HUD adopted survey was provided to officials of the City of Independence Planning and Development Services functions years back regarding zoning, building codes and accessibility issues In 2021, the City of Independence commissioned its AI and the city zoning ordinance, building codes and public policies were examined to reveal any public policies and ordinances that impede fair housing No concerns were noted then as a result.
Page 32

Page 33
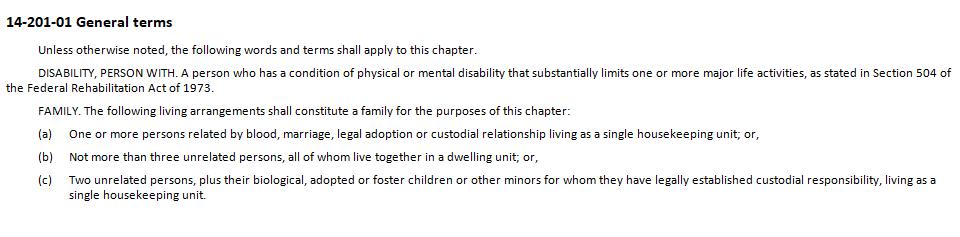
Noted below are the definitions of family and disabled from the city‟s Unified Development Ordinance (UDO) (relevant to first two survey questions on page 32).
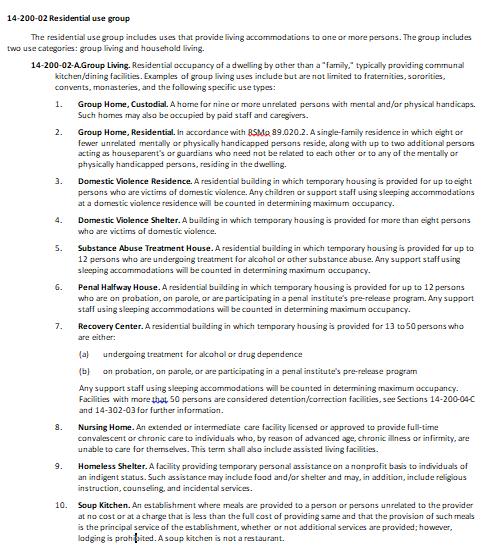
With respect to items 4 through 7 on page 32 of the survey, the City of Independence follows the State of Missouri requirements regarding Group Homes that follow.
Page 34
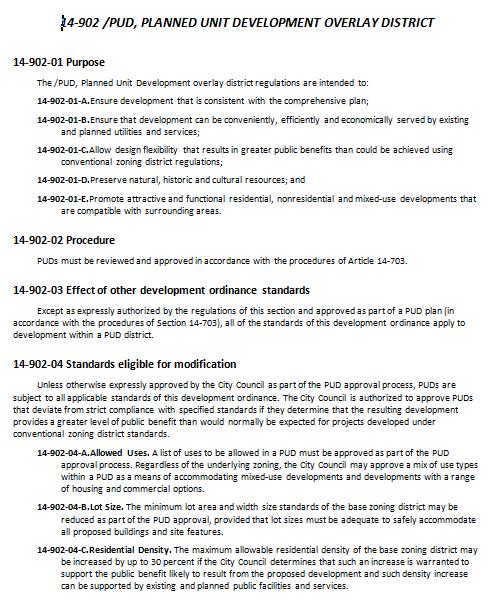
With respect to item 2 on page 33 of the survey, note the Planned Unit Development (PUD) section of the city‟s UDO. The PUD allows for mixed-unit developments.
Page 35
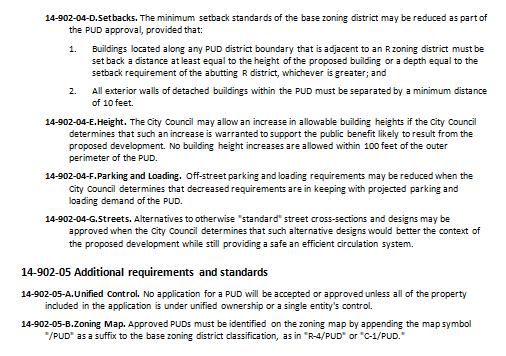
Page 36
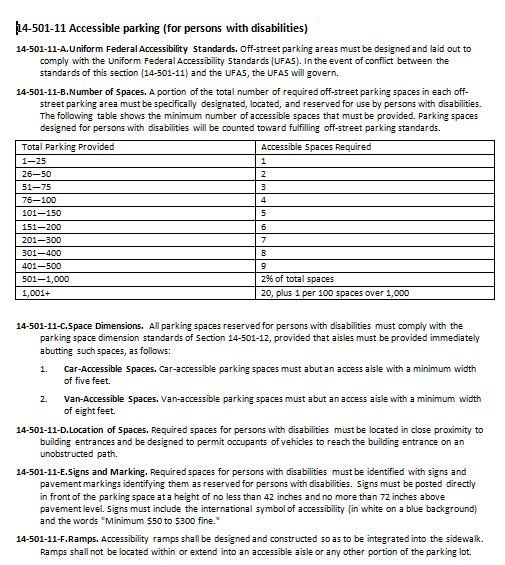
With respect to item 1 on page 34 of the survey, note the accessible parking section from the city‟s UDO that follows.
With respect to item 5 on page 34 of the survey, note that the UDO doesn‟t make reference other than that in the accessible parking section. However, the City has adopted ANSI 2009 and chapter 11 of 2018 IBC states, “The provisions of the I codes are intended to meet or exceed the federal requirements in the federal accessibility requirements found in the Americans With Disabilities Act and Fair Housing Act”.
Page 37
6.0 Assessment of Current Public And Private Fair Housing Programs And Activities in Independence Findings on Impediments to Fair Housing Choice
Evidence of Insufficient Income Is Causing Housing Distress And Impeding Fair Housing Choice
The incidence of cost burden and other indices of housing distress faces approximately 12,875 households or 49% of the population in Independence earning less than 80% AMI (2017)
About 12,705 owner households, or 43% of total households, are earning under 80% AMI and are cost burdened or face other indices of housing distress.
Approximately 7,740 renter households, or 42% of total households, are earning under 80% AMI and are cost burdened or face other indices of housing distress
The incidence of cost burden and other indices of housing distress are most apparent in the central and western portions of Independence in 2019.
The public distribution of Independence housing vouchers was assessed by MARC in 2016 and Hispanics were not receiving their fair share given their proportion of thee city‟s total population (8.8%). Recent (2021) discussions with the Independence IHA indicated that presently the Section 8 rental assistance wait list consists of 8% Hispanics and 6% of actual beneficiaries (recipients). For public housing, Hispanics comprise 13% of the wait list and 7% of actual beneficiaries. Thus, Hispanics have substantively increased their proportion of securing assisted housing assistance in Independence. Proportionate allocations to Hispanics are encouraged going forward.
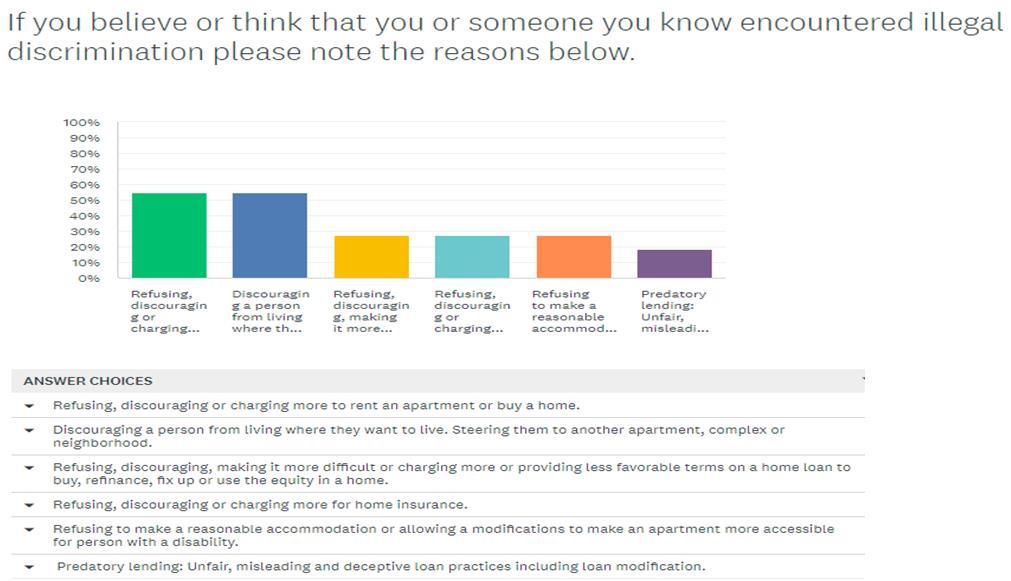
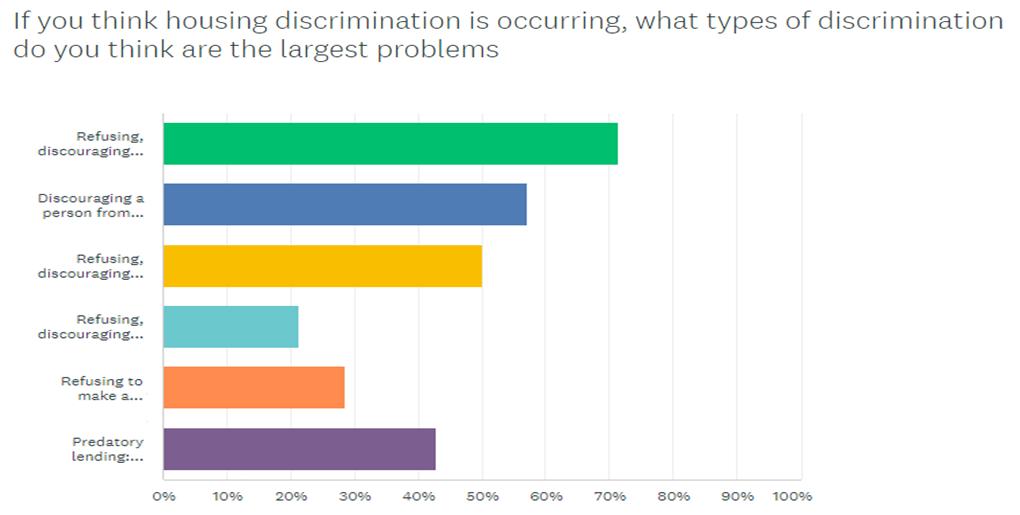
Evidence of Housing Discrimination
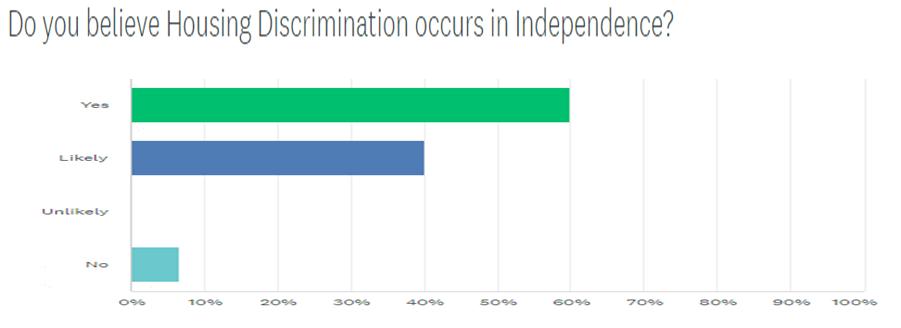
About 60% of residents surveyed on housing discrimination believe that discrimination “is” or is “likely” occurring in Independence.
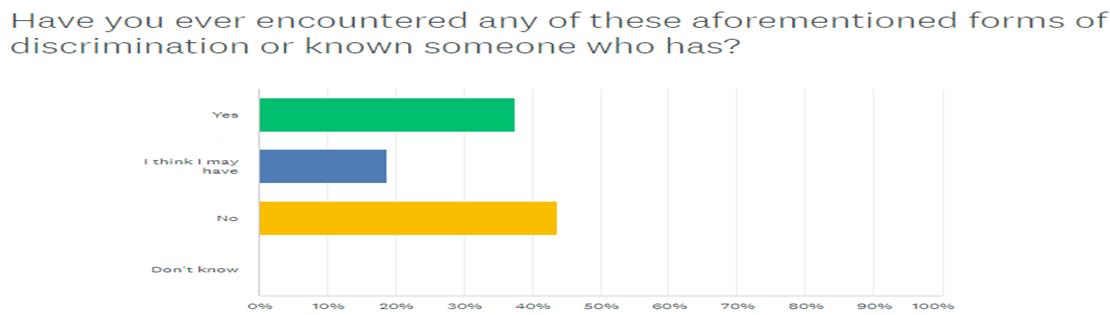
A little less than 60% of those residents surveyed on housing discrimination feel they have been discriminated against or may have been.
Need for Community Education
The community needs to be more informed. Only about 6 fair housing complaints were filed with HUD annually on average in Independence. More than half involve persons with disability with the balance comprised of national origin, race, religion or retaliation.
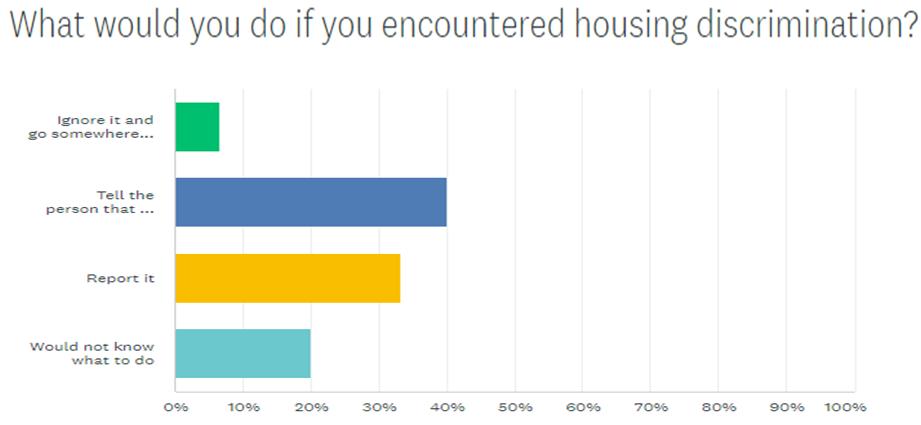
Between 25 to 40% of those residents surveyed on housing discrimination feel they could be better informed.
Minority/Poverty Concentrations
Presently (2019), minorities comprise about 23.7% of the Independence population African Americans constitute 7.7% of the Independence population and Hispanics at 8.8%, with five other minority groups ranging from .4 to 2.4% of the total population
Minority concentrations exist in the northern and western parts of the city. About 12 census tracts have minority populations exceeding the citywide average of 23.7%
Page 38
In 2019, the poverty rate of 17.2% in Independence is higher than Missouri at 12.9% and Jackson County at 13.5%
In 2019, the distribution of households in poverty in Independences to be concentrated in the western half of the community. This distribution did not generate any minority concentrations warranting HUD R/ECAP designated areas. R/ECAP areas are census tracts where more than half the population is non-White and 40% or more of the population is in poverty OR where the poverty rate is greater than three times the average poverty rate in the area (with revisions to these formula for non-urban areas).
HMDA Mortgage Origination
Generally speaking, when the incidence of loan denials for new FHA/VA and conventional loans in 2017 were compared with the incidence of minorities by census tract in 2019, no correlations were evident whatsoever.
For refinancing and home improvement loan denials, no coherent correlations were apparent due to data limitations.
Disability Accessibility
Disability access is a major type of discrimination that exists in Independence according to the actual Title VIII complaints filed (>50%) on housing discrimination.
In 2019, 15.8 percent of Independence‟s population has a disability (not institutionalized). This is slightly more than the State at 14.7% and Jackson County at 13.3%; however it was a bit more prevalent among young men (ages 5 to 17) and working age women (ages 36 to 64). The highest concentrations of persons with a disability are located in the central and western parts of Independence.
Education Accessibility
As noted repeatedly in this study and affirmed by MARC, “The city of Independence has some concentration of people of color in its western reaches, and becomes increasingly white to the east where there are more job opportunities and services. However, because it is served by a single school district, children across the city have access to better educational opportunities”.
The HUD Labor-Market Engagement Index provides a summary description of the relative intensity of labor market engagement and human capital in a neighborhood. The highest levels of the labor market engagement index were evident in the southeast portions of Independence and the lowest in the central and western portions.
Transportation & Employment Accessibility
Drawn from the MARC study, “the population center of Independence has access to 22 percent of the region‟s jobs within a 10-mile radius and Independence exported about 11,000 residents daily to work elsewhere in the region.
For a 3-person single-parent family with income at 50% of the median income for renters in the region (i.e. metro area), residents in the portion of Independence are the most negatively impacted per the HUD Low Transportation Cost Index
Page 39
Public Policies and Zoning
The City of Independence Zoning Code does not not make specific reference to the accessibility requirements contained in the 1988 amendments to the Fair Housing Act yet does define disability as the Federal Fair Housing Act
While the City of Independence zoning ordinance does not contain any special provisions for making housing accessible to persons with disabilities, the city‟s building code does have guidelines for accessibility.
Municipal consideration be given to the adoption by Independence of a formal reasonable accommodation policy via ordinance for housing that informs and provides clear direction to persons with disabilities on the process for making a reasonable accommodation request.
Assessment of Current Public and Private Fair Housing Programs and Activities in Independence
The City of Independence continues to do a fine job completing a variety of activities aimed at furthering fair housing Key accomplishments since the preparation of the last regional AI in 2016 continue to include:
Sustained fair housing training for city staff.
Maintenance of a fair housing page on the city‟s web page.
Maintenance of a direct link from the city‟s web page to the HUD fair housing website
Maintenance of a call log for fair housing complaints and referrals.
Ongoing fair housing complaint referrals to the HUD Fair Housing & Equal Opportunity (FH&EO) Division and Missouri Commission On Human Rights (MCHR)
Sustained engagement of the professional housing community in discussion of fair housing issues.
Continuing review of local ordinances for compliance with the Fair Housing Act and ADA.
Continuing fair housing posters displayed in public buildings.
Continuing purchases and distribution of fair housing marketing materials.
Maintenance of the Fair Housing logo on business cards, local brochures and program marketing information.
Sustained monitoring of sub recipients for compliance with fair housing and affirmative marketing requirements.
The city continues to update/maintain its fair housing web page which includes web links to the HUD Fair Housing & Equal Opportunity (FH&EO) and State Of Missouri Commission On Human Rights (Consumer Guide) web pages for filing fair housing complaints along with other information on a wide variety of other information and resources available. Fair housing brochures and information in Spanish continue to used and distributed throughout public locations in the city including the public library.
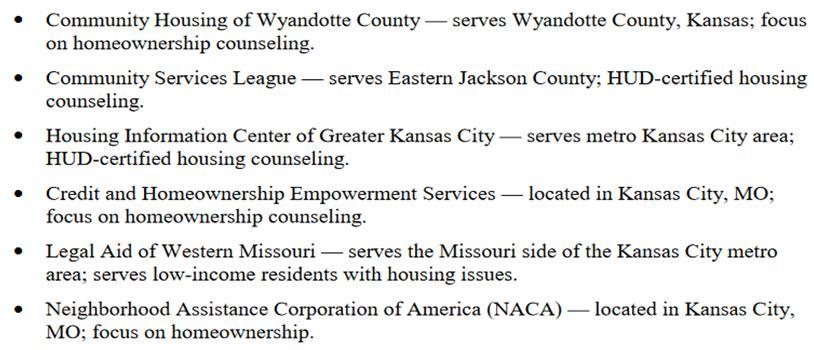
According to HUD, the following entities render fair housing information, outreach and counseling services in the Kansas City region.
Page 40
The City of Independence‟s Fair Housing Coordinator continues to collaborate with relevant local and regional fair housing and affordable housing entities. The city‟s Fair Housing Coordinator and the ADA Accessibility Specialist continue to meet with Community Development Department staff about continuing to provide ongoing education to housing facility property owners and neighborhood associations on the importance of integrating people with disabilities into the entire community. The ADA Accessibility Specialist continues to render training to Community Development Department staff about accessibility and the need for increased accessible units in the City of Independence.
Page 41
7.0 Conclusions, Recommendations and Independence Fair Housing Action Plan
Issue #1: Insufficient income for housing that continues to impede fair housing choice in Independence. Current data suggests that approximately 12,875 households or 49% of the population in Independence earning less than 80% AMI are cost burdened and likely facing other issues (i.e. overcrowding and substandard dwellings, etc) associated with the lack of affordable housing in the community.
Objective #1: Support the production of a range of affordable housing
Objective #2: Improve the quality and maintain the current Inventory of affordable housing in Independence.
Objective #3: Continue to offer a range of affordable housing opportunities to those in need in Independence.
Objective #4: Utilize The Independence Housing Needs Assessment & Report, 20222042 as a guide concerning the investment of housing and community development resources and projects for affordable housing for disadvantaged and minority persons
Objective #5: In concert with other jurisdictions and MARC, investigate a regional housing locator service to assist voucher holders find suitable housing.
Objective #6: Continue to administer the Rental Ready property inspections program going forward.
Objective #7: Continue to identify and mitigate deteriorated and abandoned properties in Independence
Objective #8: On a continuing basis, ensure Hispanics are receiving their fair share of Section 8 vouchers and public housing resources given disparities identified in Independence from the MARC Analysis of Impediments To Fair Housing Choice, 20162021 report.
Objective #9: Continue to work with the lending community to discourage predatory lending practices within the City of Independence.
Objective #10: Continue to encourage and refer residents to attend classes on homebuyer education and foreclosure prevention held by providers.
Issue #2: Evidence of Housing Discrimination – A survey of Independence residents reveals that housing discrimination does exist. Increased public support and awareness, along with more documented evidence is needed.
Page 42
Objective #11: Continue participation with local and regional fair housing organizations and consider sponsoring a local fair housing awareness event annually.
Objective #12: Continue to ensure that the fair housing Logo is on business cards, local brochures and program marketing information.
Objective #13: Continue to maintain a call log for all fair housing complaints and referrals via the city‟s landlord/tenant existing complaint procedures and sustain the city‟s fair housing website.
Objective #14: Continue to make fair housing complaint referrals to HUD Region VII FH&EO and the Missouri Commission On Human Rights.
Objective #15: Encourage Fair Housing Enforcement Agencies to target fair housing testing for multifamily properties.
Issue #3: Need for Community Education - The number and nature of the fair housing complaints being received from Independence residents continues to remain low. There is a need for more community education.
Objective #16: Continue to annually place ads in the “Independence City Scene, The Examiner and The Star” that goes out to all Independence households regarding the fair housing services provided by the City of Independence Community Development Department.
Objective #17: Annually, continue to sponsor or put on fair housing training for Independence residents. Specific information is provided in the Independence LandlordTenant Guide and continue to update that document as needed.
Objective #18: Continue to maintain a fair housing page on the City of Independence‟s web page that includes a direct link to the HUD fair housing website and community resources associated with filing complaints, fair housing advisory services and education, etc.
Objective #19: Continue to display fair housing posters and make fair housing materials available in City of Independence public facilities.
Objective #20: Continue to assess the need for local and CDBG public services funding for agencies effectively addressing fair housing issues and associated educational needs in the community.
Objective #21: Continue to foster fair housing education for landlords, realtors and lenders in the locality through the commitment of community resources.
Issue #3: Minority/Poverty Concentrations - Minority and poverty concentrations exist in the central and western part of the city.
Page 43
Objective #22: Continue to implement the 24 Highway Fairmount Business District Plan completed in 2017 that has resulted in the funding of projects for area disadvantaged and minority persons through resources for targeted infrastructure, public improvements, transportation and economic development endeavors.
Objective #23: Continue to foster redevelopment in distressed neighborhoods of central and western Independence.
Objective #24: Enhance public transit opportunities in central and western Independence consistent with the city‟s adopted Comprehensive Plan for enhanced minority and disadvantaged population access to area employment opportunities
Objective #25: Foster the receipt of CDFI and NMTC in the central and western portions of the City of Independence to strengthen area employment opportunities for lower income households.
Objective #26: Advocate for and update the regional transit plan consistent with the Independence Comprehensive Plan to connect affordable housing residents with area employment opportunities.
Objective #27: Continue to undertake targeted efforts to have Spanish fair housing brochures distributed to specific areas with concentrations of Hispanic minority populations.
Objective #28: Continue to implement a Limited English Policy for the City of Independence‟s Community Development Department.
Objective #29: Continue to provide education on fair housing to individuals/families for whom English is not their first language who come into the City of Independence‟s Community Development Department and Public Housing Authority for assistance.
Objective #30: Continue to encourage minorities and lower-income families to seek housing counseling that will help find housing outside areas of concentration.
Issue #4: Disability Accessibility - In addition to race and poverty, disability access was raised as the other major type of discrimination that exists in Independence according to residents surveyed on housing discrimination.
Objective #31: Derived from the 2016-2021 MARC Analysis of Impediments To Fair Housing Choice, consider the adoption by Independence of a formal reasonable accommodation policy via ordinance for housing that informs and provides clear direction to persons with disabilities on the process for making a reasonable accommodation request.
Page 44
Objective #32: Foster affordable and accessible housing in a range of unit sizes for disabled persons pursuant to the City of Independence Comprehensive Plan and investigate universal design initiatives
Objective #33: Continue to refine and distribute the Independence Landlord-Tenant Guide which offers guidance on the process and rules for persons with disabilities to make a reasonable accommodation request.
Objective #34: Annually, continue to partner with other local and regional fair housing and other agencies to sponsor and facilitate a community education event about fair housing and how it pertains to disability issues.
Objective #35: Continue to provide a part-time ADA Accessibility Specialist in the Independence Community Development Department
Objective #36: Continue to encourage the development of handicapped accessible or adaptable housing on all projects receiving federal funds.
Issue #5: Public Policies, Land Use and Zoning - A survey of the policies and practices of the City of Independence Zoning and Planning Codes indicates general compliance with federal Fair Housing legislation but undertake sustained reviews going forward to ensure conformity.
Objective #37: Continue to implement the City of Independence Revised Comprehensive Plan in 2017 through the strategic targeting of housing and community development resources projects for disadvantaged and minority persons in the locality as well as guidance in addressing fair housing mitigation issues via land use policies and regulations.
Objective #38: Continue to set Independence affordable and fair housing goals consistent with its Consolidated Plans and Comprehensive Plans.
Objective #39: Encourage Development of a Variety of Housing Types per the provisions of the Independence Comprehensive Plan and consider compact use zoning provisions
Objective #40: Continue to provide fair housing training to City of Independence staff, particularly targeting Community Development Department staff.
Objective #41: Continue to review of Zoning and Planning Codes to determine if there are any guidelines that may discourage affordable housing.
Issue #6: Advocate for the sustained implementation of regional fair housing initiatives generated by and in the most recent MARC Analysis Of Impediments To Fair Housing Choice for metro Kansas City.
Objective #42: Continue to advocate for and assist MARC with the regional housing locator initiative, universal design incentive policies, Kansas City rising
Page 45
education and job training initiatives, transportation option partnership, the alignment of regional transit to jobs initiatives, the generation of regional affordable housing education initiatives and the continuing generation of fair housing goals and metrics.
Oversight and Monitoring
The Analysis of Impediment process has been conducted under the oversight and coordination of the City of Independence Community Development Department (CDD) The City of Independence Community Development is the lead agency for the City of Independence with responsibility for ongoing oversight, self-evaluation, monitoring, maintenance and reporting of the City‟s progress in implementing the applicable actions and other efforts to further fair housing choice. The Community Development Department, as the designated lead agency, will therefore provide oversight, as applicable, of the following activities.
The CDD will evaluate each of the recommendations and remedial actions presented and ensure consultation with appropriate City Departments and outside agencies to determine the feasibility of implementation.
The CDD will continue to ensure that all sub-grantees receiving CDBG, HOME and other grant funds have an up-to-date Affirmative Fair Housing Marketing Plan; display a Fair Housing poster and include the Fair Housing Logo on all printed materials as appropriate; and provide beneficiaries with information on what constitutes a protected class member and instructions on how to file a complaint.
The CDD will ensure that properties and organizations assisted with federal, state and local funding are compliant with uniform federal accessibility standards during any ongoing physical inspections or based on any complaints of noncompliance received by the City.
The CDD will continue to support Fair Housing outreach and education activities through its programming for sub-recipients and its participation in community fairs and workshops; providing fair housing information brochures at public libraries and City facilities; and sponsoring public service announcements with media organizations that provide such a service to local government.
The CDD will continue to refer fair housing complaints and or direct person persons desiring information or filing complaints with the United States Department of Housing and Urban Development Fair Housing and Equal Opportunity Regional Office in Kansas City, MO and the Missouri Commission On Human Rights in Jefferson City
Maintenance of Records
In accordance with Section 2.14 in the HUD Fair Housing Planning Guide, the CDD will maintain the following data and information as documentation of the City‟s certification that its efforts are affirmatively further fair housing choice.
Copies of the Analyses of Impediments to Fair Housing Choice and any updates will be maintained and made available upon request.
Page 46
Efforts taken as part of the implementation of this report and other relevant endeavors associated with the remediation of impediments to fair housing choice.
Page 47
