2024 Snapshot

Irving,

Irving,
Learn about the population, climate, education and physical characteristics of the City of Irving.
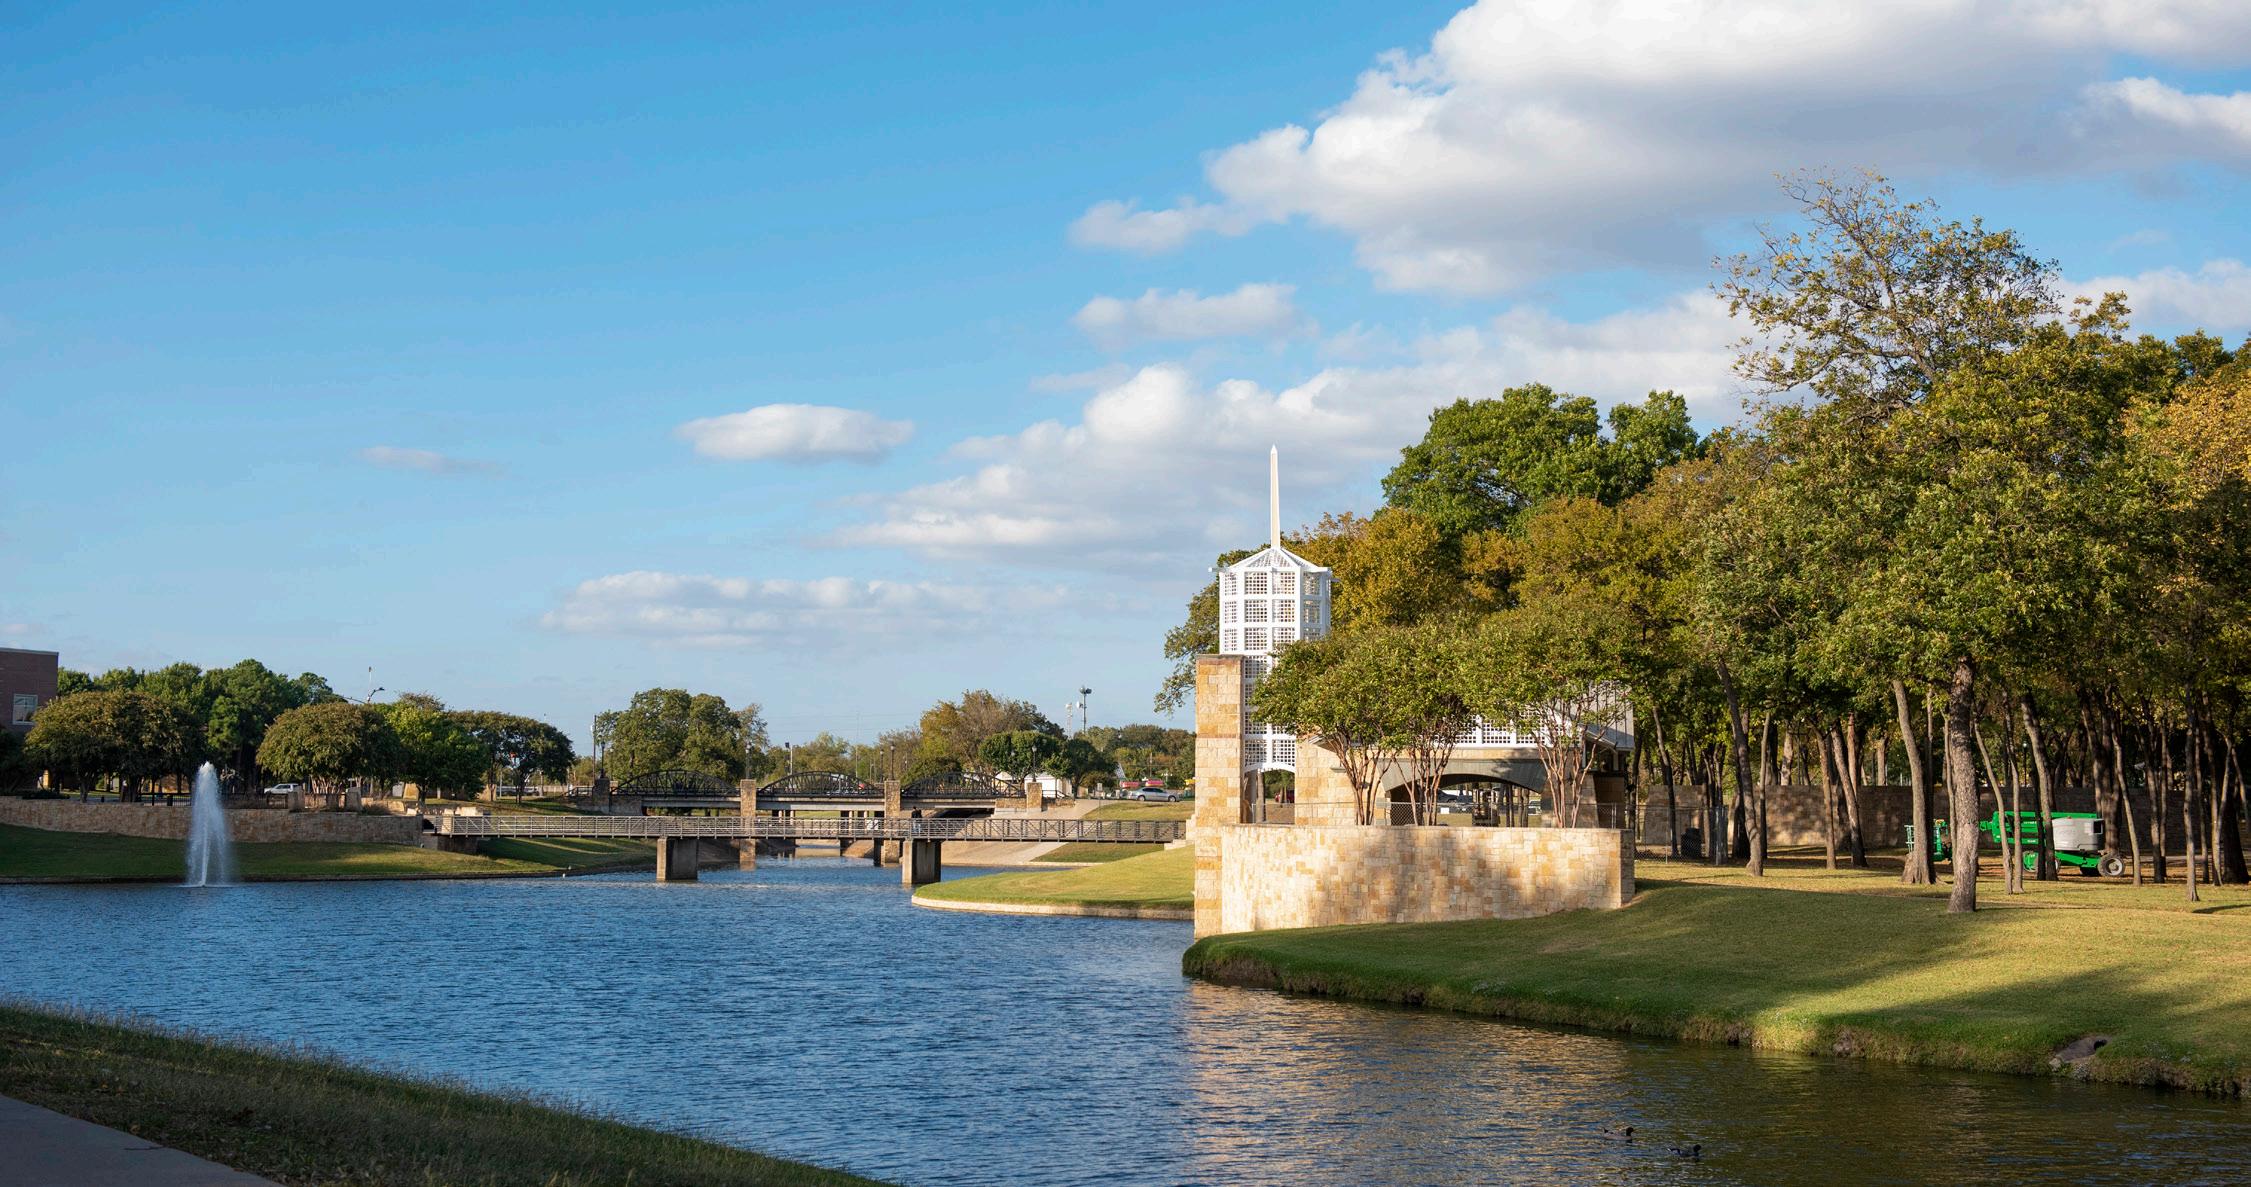
Irving continues to shine as a vibrant urban community that is a destination for investment and high-wage jobs.
The 2020 decennial Census counted approximately 15,000 more Irving residents than ongoing annual estimates predicted. It is unclear whether these are residents who have been undercounted in the past, or if there may have been some overcount stemming from the unusually long amount of time during which data was collected.
The Census Bureau and the North Central Texas Council of governments continue to release their annual estimates and remain in disagreement as to the actual size of Irving’s population. With a tight housing market, short inventory of available housing, and high demand for both single-family homes and rental apartments, it appears that whatever the true population is, the City of Irving’s population is still a growing one.
Of possible interest to readers, 2023 was the driest year since 2014 with a little more than 29 inches of rain. Also of note is that 2015 brought record-breaking rainfall, so it may not be necessary to completely switch over to xeriscaping, though it would help with long-term water conservation. Not shown in this document, but 2023 also was unusually hot (not just in January and July) with an average temperature for the year of 69.7 degrees. The average annual temperature for this region since 1888 is 66.0 degrees and this region has been above that average 25 of the past 40 years. Ten of those times by more than 2 degrees.
The 2023 Existing Land Use data shows a sudden jump in built out acreage, and a corresponding drop in available vacant land. In actuality, construction has remained at its historic pace, but that table has been recalibrated to better reflect the amount of land still “in play” with an uncertain destiny. From this point forward, when a construction permit is issued, land will be marked as belonging to that land use category rather than being listed as vacant until the new construction starts appearing on the tax roll.
In looking at the long-term population trend tables, astute readers will note that the 2021 ACS is being used as a comparison point against the 1990, 2000 and 2010 Decennial Census data. This is due to the discontinuation of the “Long Form” that addressed many of the longitudinal topics of interest and suspected irregularities in the 2020 ACS that would have been used as a replacement for that form.
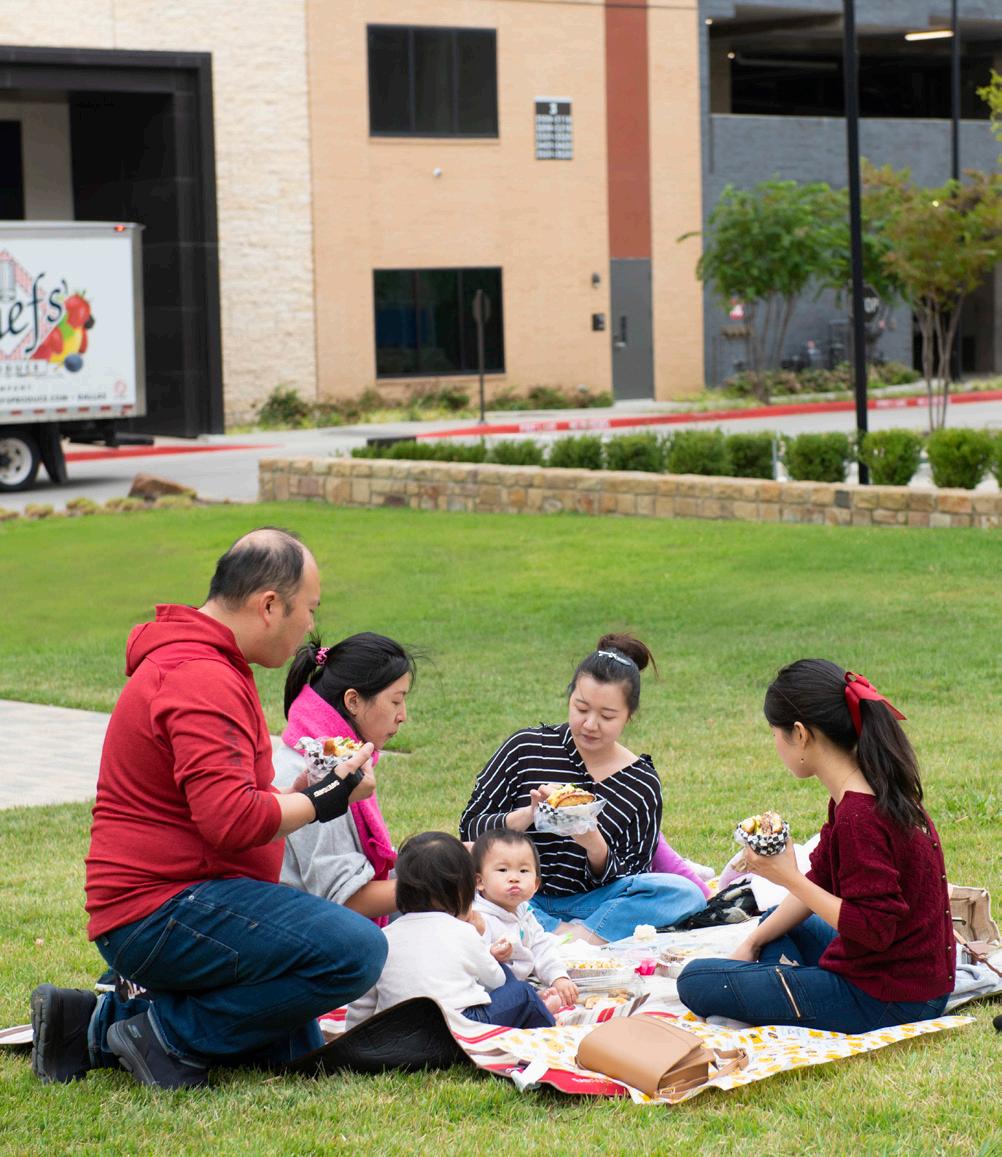
Irving, Texas, is centrally situated between Dallas and Fort Worth. The city’s rich diversity is exhibited by its population and the number of languages spoken by residents. In fact, Irving has one of the most diverse ZIP codes in the United States.
Irving’s population rank is (2022 Census P.E.P.) 2nd largest in the county 12th largest in the state 88th largest in the nation
Fortune 500 and Fortune 1000 companies have their global headquarters located in Irving. Irving is home for more than 8,500 companies – large, small and mid-size. With international companies currently operating throughout the city, Irving is striving to be the leading international business center in America.
Irving continues to shine as a vibrant urban community that is a destination for investment and high-wage jobs.

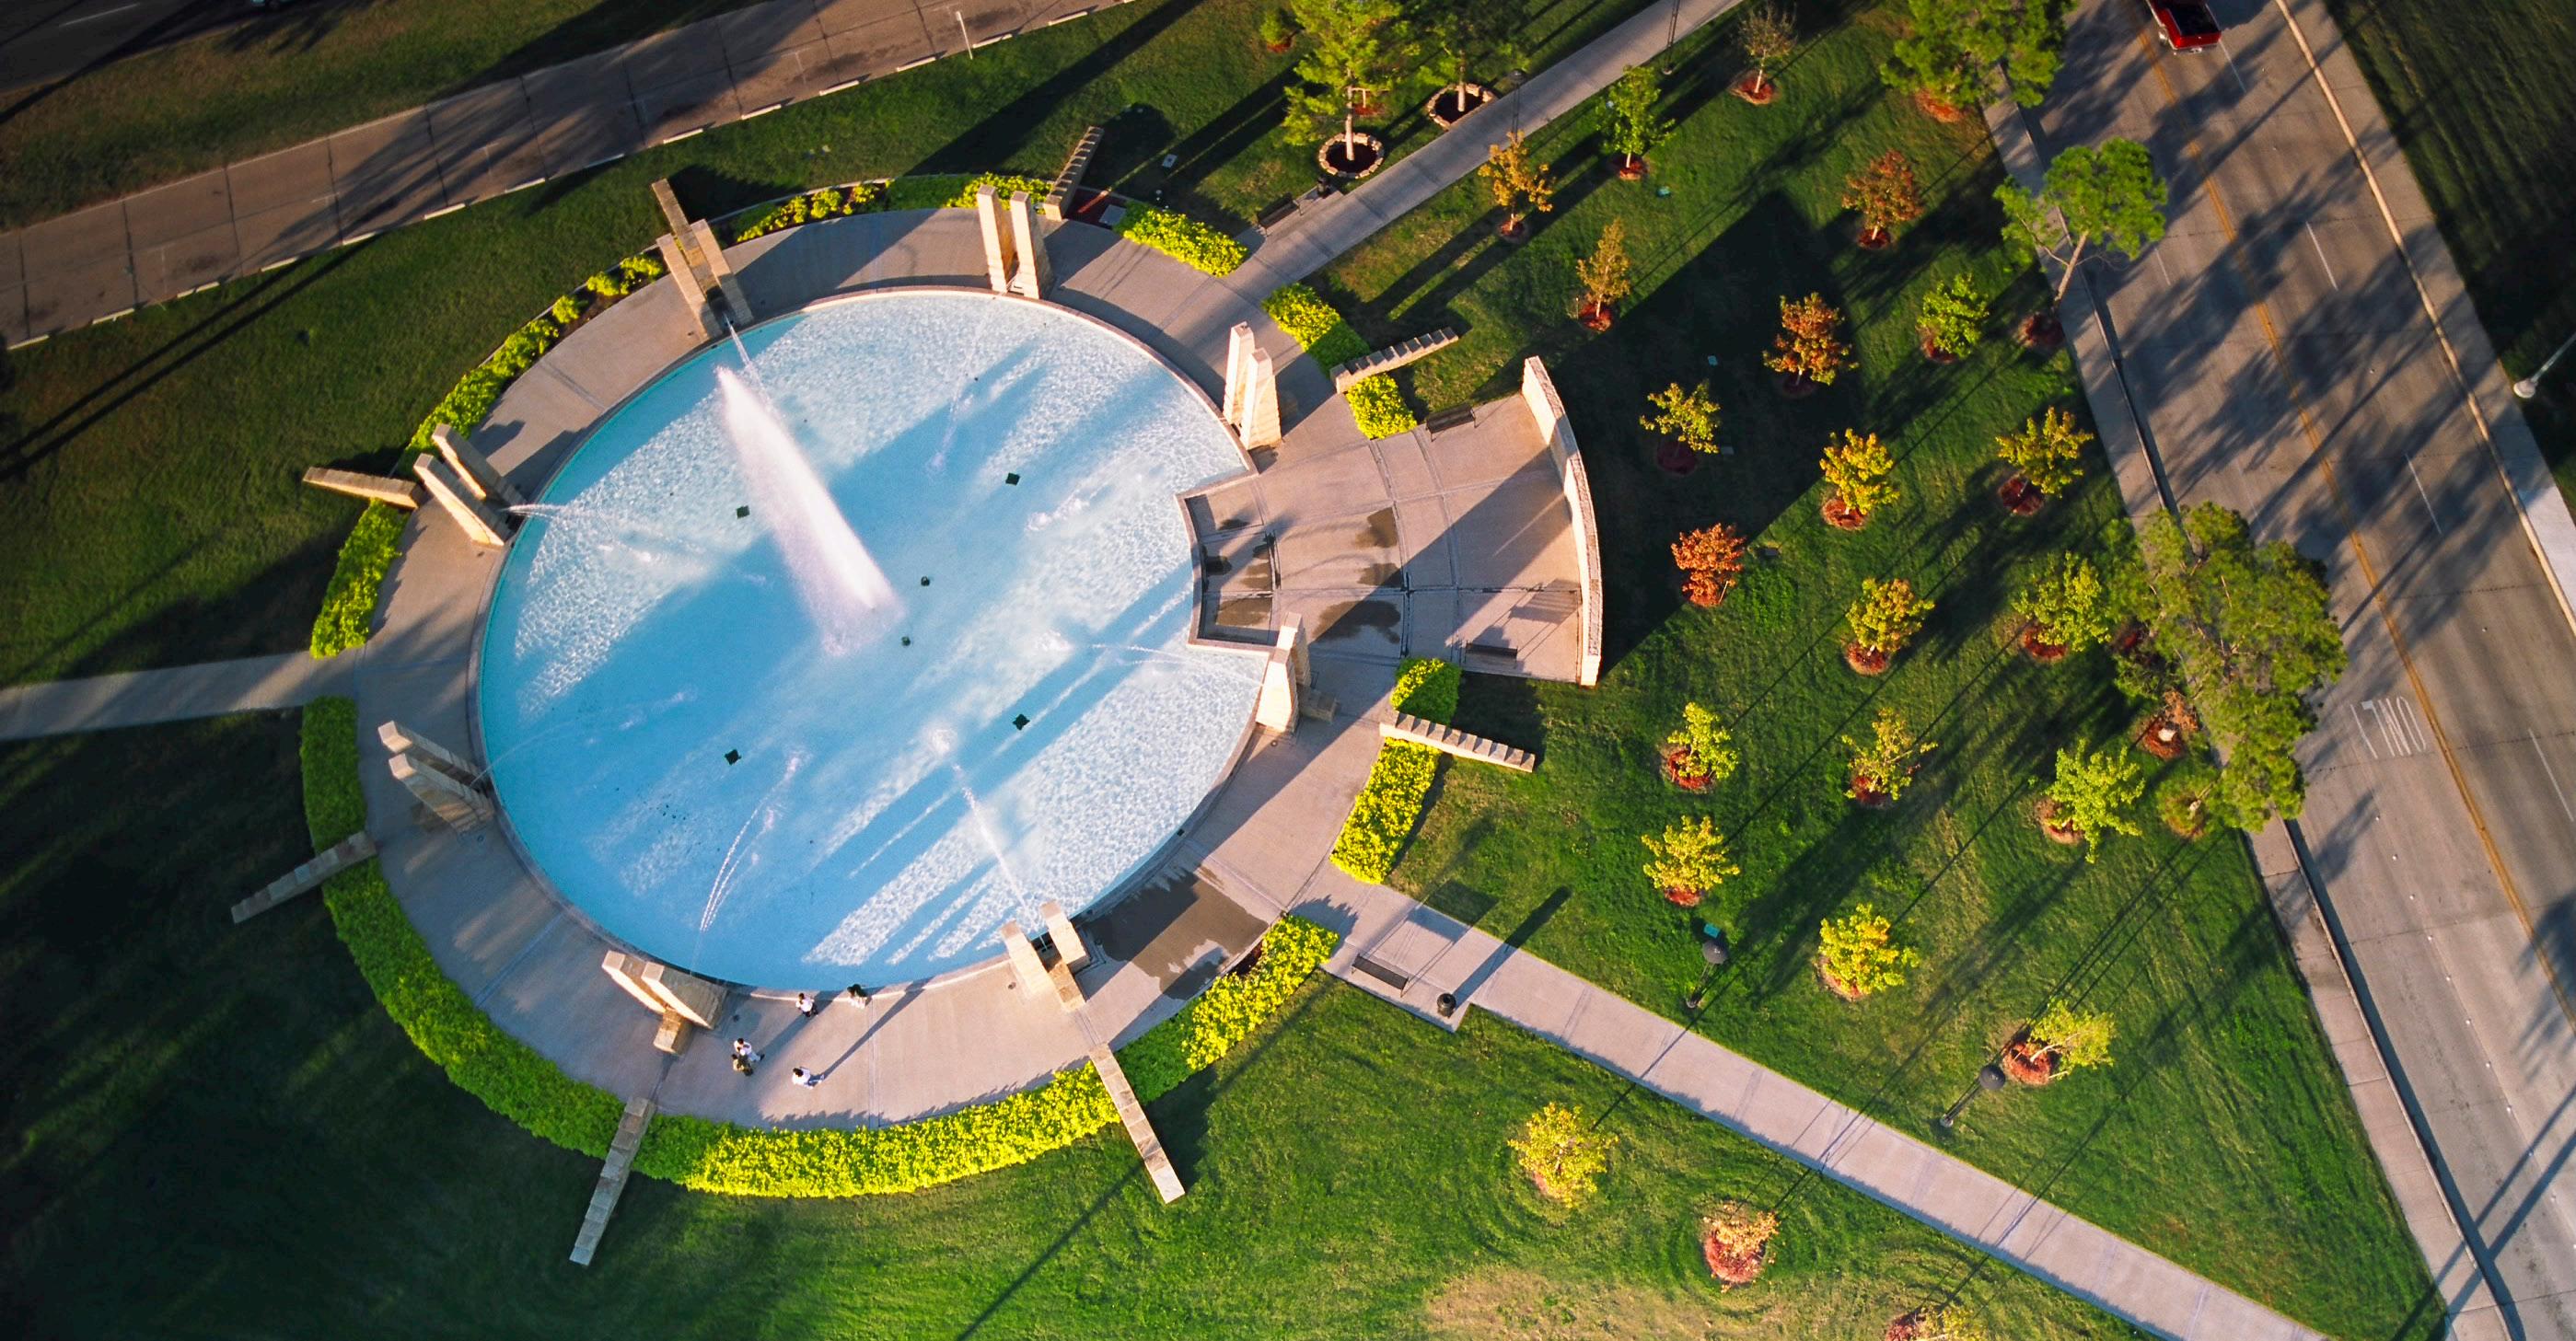
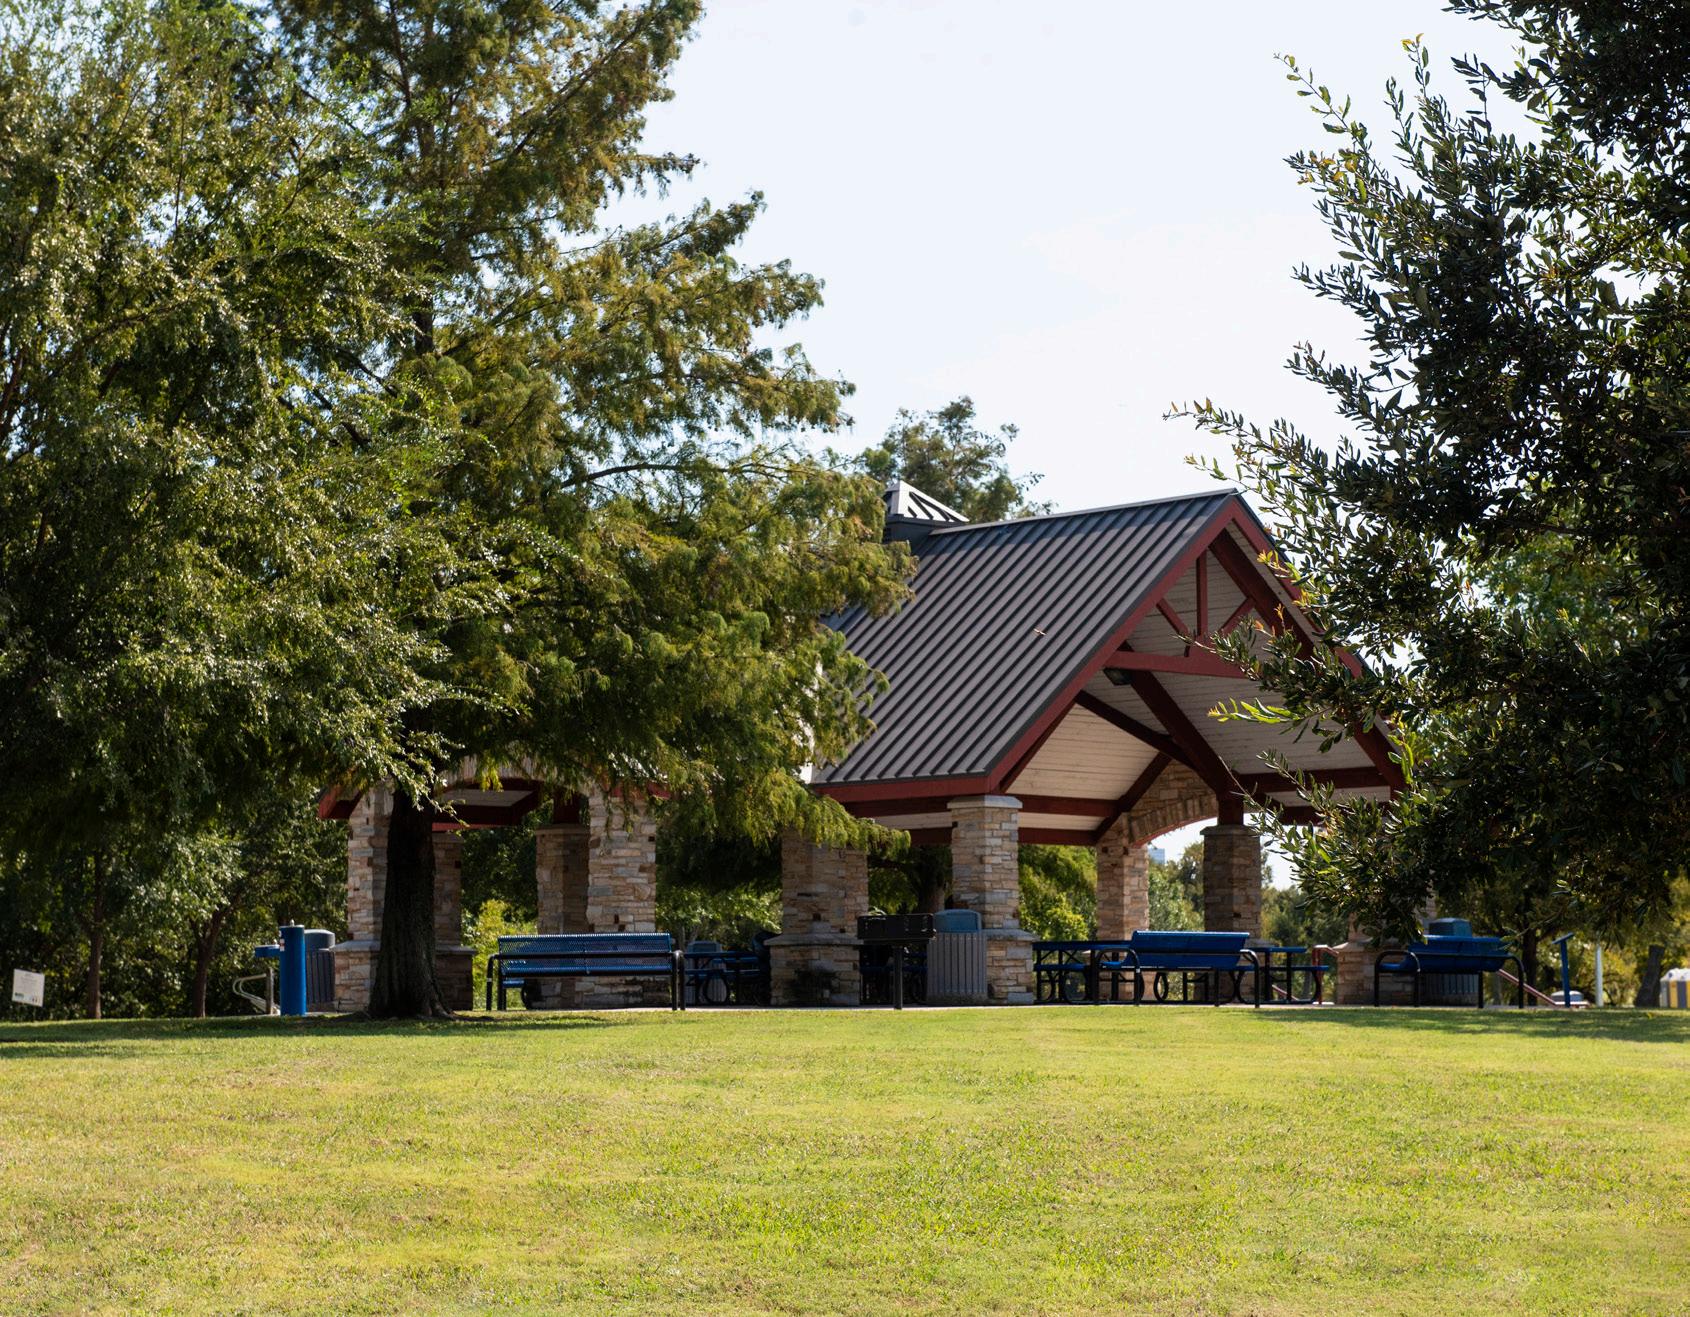
Irving’s 67.9 square miles of land area includes exceptional golf courses and more than 80 parks on 1,873 park acres — all begging outdoor activity. Irving is the first city to share a major connection along the Trinity Trail System, a regional network that will ultimately span 250 miles and connect 16 counties across North Texas.
(Above Sea Level)
Highest Level Lowest
In Irving, the summers are hot and muggy; the winters are cold and windy. Summer runs from June through September, with July and August being the hottest. In Irving, one could experience all four seasons in one day.
Record High: June 26 and 27, 1980 – 113°F
Record Low: Feb. 12, 1899 – -8°F
2nd Record Low: Jan. 31, 1949 and Feb. 16, 2021 – both with -2°F
Rainfall
Historical Average – 33.4 inches
Rainfall in 2023 – 29.31 inches
Driest Year on Record – 1921 with 17.91 inches
Wettest Year on Record – 2015 with 62.61 inches
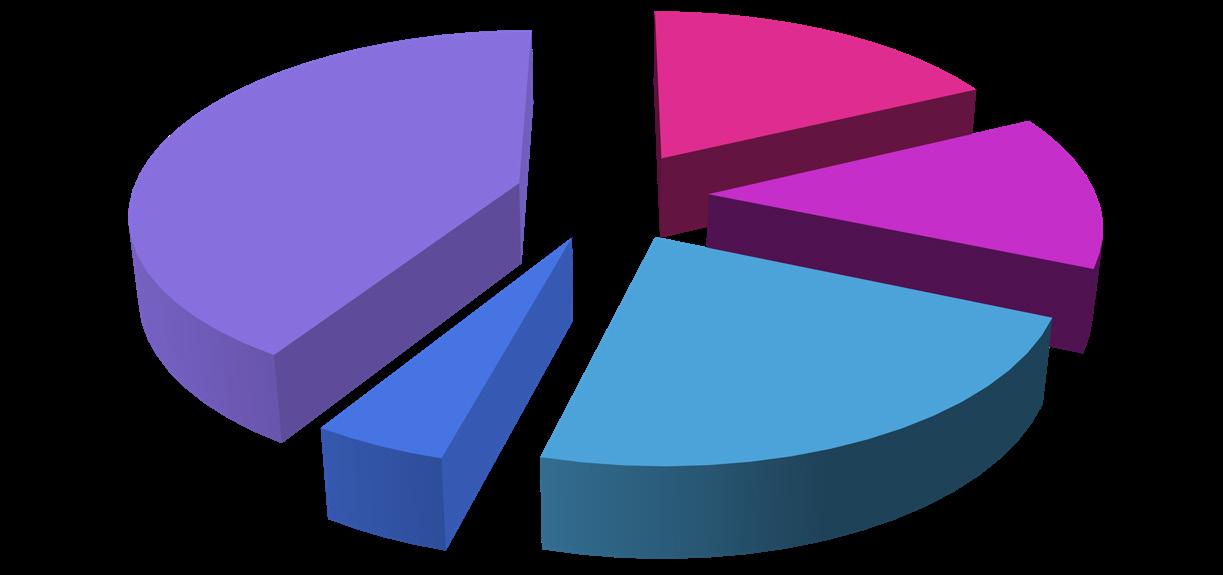
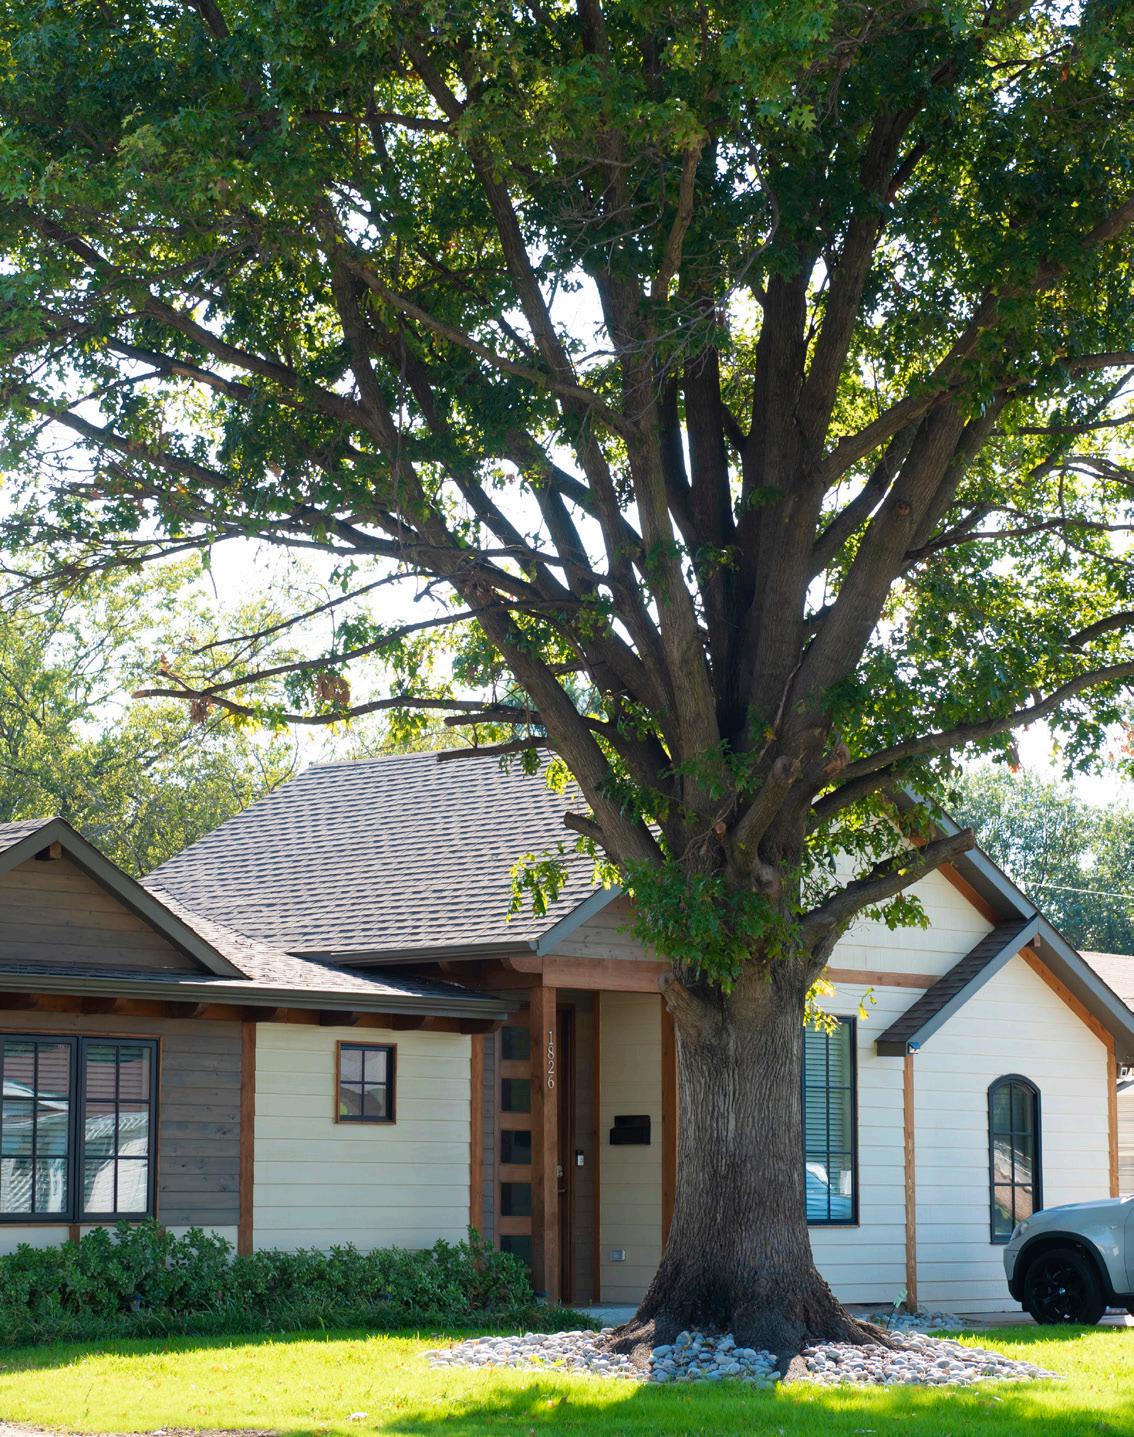
Irving offers a variety of housing options from single-family to multifamily — from houses to mobile homes to apartments and townhomes.
By Acreage (2023)
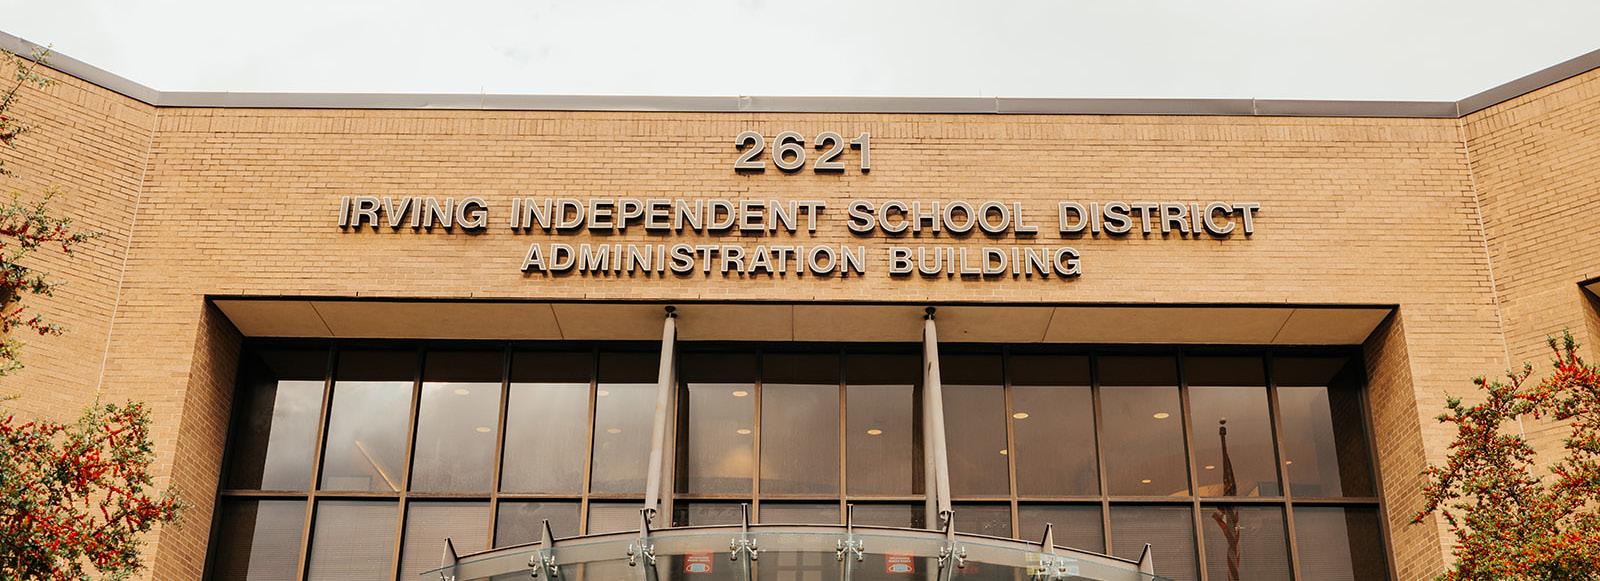
Irving residents are served by Irving, Carrollton-Farmers Branch and Coppell independent school districts, as well as a variety of private and parochial schools and academies. Irving also boasts three fully accredited institutions of higher learning: DeVry Institute of Technology, North Lake College and the University of Dallas.
Carrollton/Farmers Branch Independent School District
The City of Irving is a full-service municipality that operates under a council-manager form of government consisting of the mayor and eight city council members who serve three-year terms.
The mayor and two council members are elected at-large, and the remaining council members represent single-member districts. The mayor and city council appoint a professional city manager to manage the day-today operations of the organization.
Irving, founded in 1903 by J.O. Schulze and Otis Brown, was officially incorporated April 14, 1914.
The City of Irving is the 12th largest city in the state and 88th largest in the nation.
Population Growth from 2010 to 2020 18.7%
Following the dramatic growth and geographic shift in population documented by the 2020 Census, the Irving City Council approved new Council District boundaries on Nov. 11, 2021. Third party consultants were used to analyze the data to design these new districts and ensure that each single-member district served roughly the same number of Irving residents. The new district boundaries reduced the area of District 5, which has seen explosive population growth, and adjusted the boundaries of districts 1, 4 and 7, in order to restore equilibrium between them.
Mayor: Rick Stopfer
Council District 2: Brad M. LaMorgese
Council District 8: Dennis Webb
Single Member Districts
Council District 1: John Bloch
Council District 3: Abdul Khabeer
Council District 4: Phil Riddle
Council District 5: Mark Cronenwett
Council District 6: Al Zapanta
Council District 7: Kyle Taylor At Large
Special taxing districts limited to specific areas within the city such as flood control and reclamation districts not included.
School districts do not cover entire city, and only one can be applied to total tax rate.
Tax information listed is for informative purposes only and is subject to change. Verify information with appropriate entity before calculating taxes.
Census Bureau: 2020 Census, 2022 One-year American Community Survey, 2022 Population Estimates Program
Other Data Sources: North Central Texas Council of Governments, Dallas County Appraisal District, National Weather Service Weather Forecast Office, Wayne State University, Irving ISD, Carrollton/Farmers Branch ISD, Coppell ISD, U.S. Geological Survey, Greater Irving-Las Colinas Chamber of Commerce, Texas Education Administration, Texas Real Estate Data Center, Texas A&M University, Texas Education Agency Academic Excellence Indicator System, Texas Workforce Commission TRACER
City of Irving Planning Department
825
(972) 721-8069