11 minute read
Responding to climate change
This section provides an overview of key current global governance for reducing greenhouse gas emissions. It also looks at goals for emissions reductions, and when these goals need to be reached to avoid the worst impacts of climate change. Global commitments to emissions reductions are also described here.
Modelling future climate
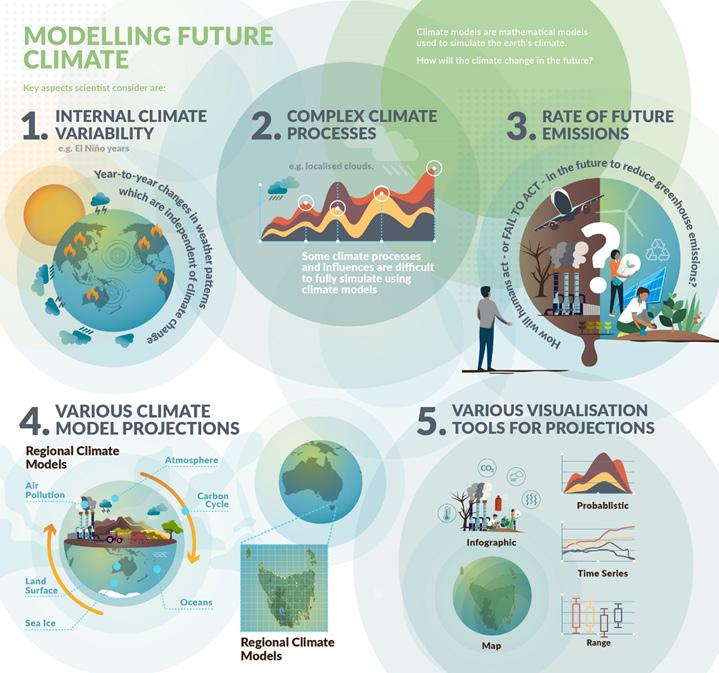
This section explains how projections of our future climate are made using global and regional climate models. It also discusses how we can model a range of possible future climates based on different possible greenhouse gas emissions scenarios. Ultimately, climate models help us better understand and adapt to current impacts, and a future under a changing climate.
The Paris Agreement
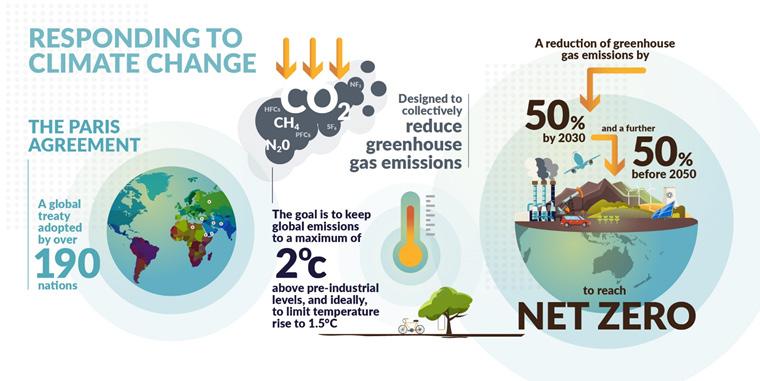
The Paris Agreement is a treaty on responding to climate change that was adopted by over 190 nations at the United Nations’ Conference of the Parties of the United Nations Framework Convention on Climate Change (COP21) in Paris in 2015. Under the Paris Agreement, countries pledged to reduce greenhouse gas emissions to keep global temperature rise to 2°C above pre-industrial levels and to pursue all efforts to keep temperature rise to no more than 1.5°C above pre-industrial levels. At the time it was signed, the Paris Agreement was hailed as a breakthrough in international diplomacy and climate policy. Despite this, we are currently not on track globally with emissions reductions to meet the Paris Agreement targets. Current emissions reductions mean that it is now unlikely we will be able to keep global temperature rise to 1.5°C. Policies currently in place around the world are projected to result in about 2.7°C of warming.
What needs to be done
In order to avoid the worst impacts of global warming, greenhouse gas emissions must be reduced significantly and rapidly. The Paris Agreement broadly calls for a reduction of greenhouse gas emissions of 50% by 2030, and a further 50% reduction to reach “net zero” before 2050. This needs to be achieved by rapid decarbonisation of the energy, transport, manufacturing, and food production sectors globally. This means a rapid phase-out of fossil fuels (coal, oil and gas) and a shift to renewable energy and sustainable food production systems. The concept of “net zero” includes preservation and restoration of natural environments that absorb and store carbon, like forests, wetlands and natural coastal environments.
What countries are pledging
Climate change is fundamentally a global problem, which needs a global response. About 140 countries have now pledged to achieve net zero emissions by 2050. Developed countries, which have historically been the biggest emitters, are expected under the Paris Agreement to make the deepest emission cuts soonest. The US has pledged a 50-52% cut in emissions from 2005 levels by 2030. The UK has promised a 78% emissions reduction by 2035, while the EU has pledged to cut emissions 55% by 2030 on 1990 levels. Japan has committed to a 46% cut by 2030 on 2013 emissions. In 2022, Australia increased its national commitments to reduce emissions to 43% below 2005 levels by 2030. This increased commitment is warranted, given that Australia is one of the highest per-capita global
What are climate projections?
Climate projections are outputs from computer models used to represent the Earth’s mean climate, including variability. Climate projections do not predict weather on particular dates in the future and are not based on observations. Climate models can be adapted to determine the influence of particular variables on the climate system and can test the impact of different future scenarios on the climate system over long timescales. This means they can help us understand what climate will look like under different greenhouse gas emissions scenarios.
Climate projections are generally described in 20- or 30-year periods, to incorporate natural variability in the weather system. This reduces the effect of annual to decadal events (e.g. droughts, cool/hot seasons and other natural cycles) on the average weather. Using climate projections, we can understand what the future climate may plausibly look like for a given location to the end of the century and beyond.
What are weather predictions/forecasts?
Weather forecasts aim to accurately predict the weather at a precise place and time in the near future. To achieve this, weather forecasts use observations to configure the atmosphere within a climate model so it represents the actual atmosphere as accurately as possible at a particular time - usually today or now.
Forecasting has improved considerably in recent decades: a 5-day forecast today is more accurate than a 2-day forecast was in the 1980s. Improvements in forecasting have been driven by advances such as higher resolution observational data (due to satellite and surface ocean measurements), increased computer processing power and improved understanding and representation of atmospheric dynamics within climate models.
Global Climate Models
Global Climate Models are mathematical models used to simulate the Earth’s climate. They are important tools for understanding how the global climate will change with increasing greenhouse gas concentrations. Global climate models simulate the components of the Earth system: atmosphere, ocean, land-surface, sea-ice, the carbon cycle and also air pollution.
To simulate the Earth system, the atmosphere, ocean and Earth’s surface are represented as regularly spaced grid points in a spherically arranged grid. Mathematical models are then used to determine fundamental parameters at each grid point, including temperature, windspeed, solar radiation, humidity and rainfall, as they change over time.
A typical distance between grid points for a global climate model is 50 - 200kms. To improve the precision of the climate model requires increased computing power but also produces a more detailed representation of Earth system processes. Very high-resolution models are computationally intensive because of the number of individual calculations that must be performed at each gridpoint to show climate change over decades.
Regional climate models
The lower resolution of global climate models (using grid squares of between 50km and 200km) means that some fine scale features of regional climates are not well represented. By contrast, regional climate models can represent local climates at higher resolution, using much smaller grid squares of 1-50km. These fine scale climate models can better capture the influence of regional features like mountain ranges, coastlines and urban areas in projections of future climate. Regional climate models are created by downscaling global climate models, using statistical and computational methods.
Regional climate modelling is particularly important for Tasmania because it has an extensive coastline and mountainous terrain which generates strong regional climate influences over a relatively small geographical area.
Uncertainty and future emissions scenarios in climate projections:
There are three main sources of uncertainty in climate models which are more or less prominent as we model further into the future. These areas of uncertainty are:
• internal climate variability: year-to-year changes in weather which are independent of climate change e.g. El Niño years
• model uncertainty: some climate processes and influences are difficult to fully simulate using climate models e.g. localised clouds
• uncertainty around future greenhouse gas emissions: how humans will act - or fail to act - in the future to reduce greenhouse emissions
As we model further into the future - especially past 2050 - different anthropogenic emissions scenarios become the main source of variability in climate models. Climate science and bodies like the Intergovernmental Panel on Climate Change (IPCC) have formulated several possible future emissions trajectories called Representative Concentration Pathways (RCP) or Shared Socio-economic Pathways (SSPs). These different scenarios can be used to help describe possible future climates, which differ according to varying degrees of emissions reduction and global cooperation, or otherwise, in dealing with climate change.
Climate models present a range of plausible futures, rather than a single certain one. By allowing insight into possible futures, they help us think about how we might adapt and prepare - including for worst-case scenarios. Understanding a range of possible futures allows decision makers to apply a risk management approach for immediate and longer-term decision making.
Modelling methods
To develop the climate projections for Launceston provided here, six global climate models were downscaled to a resolution of ~10km using the CSIRO’s Conformal Cubic Atmospheric Model (CCAM). The six models were selected to represent the range in plausible futures over southeast Australia.
All climate models have some systematic errors which vary depending on local conditions such as topography, altitude and distance from large water bodies. These errors are accounted for by applying a statistical method (called bias-adjustment) to adjust the model output so that it matches the actual observations. The adjustment is then applied to the data for future time periods, to give absolute values of climate variables that are needed for climate impact assessments and understanding temperature extremes. Modelling methods used for the projections provided here can be accessed in detail in this publication (pages 15-32).
How confident can we be in the models?
We have high confidence in how temperature will change into the future under particular emissions scenarios. The physical drivers of how temperature changes within the climate system are well understood and are robust across large spatial scales, so they are straightforward to represent within climate models. This allows the models to achieve high levels of skill in the temperature projections they produce. There is strong agreement across the ensemble of climate models we used regarding the rate and magnitude of warming projected into the future. As such, there is high confidence regarding projected variables related to temperature, such as evaporation.
Rainfall is one of the most uncertain components in climate projections because it is naturally highly variable and the many physical processes involved are difficult to model. However, even small increases in annual rainfall can result in decreased moisture availability across a region with a warming climate, because rainfall may not be sufficient to offset evaporative losses. Confidence in temperature, the warming trend and evaporative demand is high. Therefore, we have high confidence that any increases in rainfall will not be sufficient to offset the projected losses.
Data for the high emissions future scenario (RCP8.5) is used here because this scenario broadly aligns with emissions-reduction practice over the past few decades and it enables local government to understand the full extent of possible climate risk. If international climate policy achieves rapid reductions in greenhouse gas emissions, the pattern of projected changes will be similar, but lower in magnitude. Adaptation will still be required, however, because we cannot avoid the warming that is already committed to due to past greenhouse gas emissions.
Understanding Launceston’s future climate
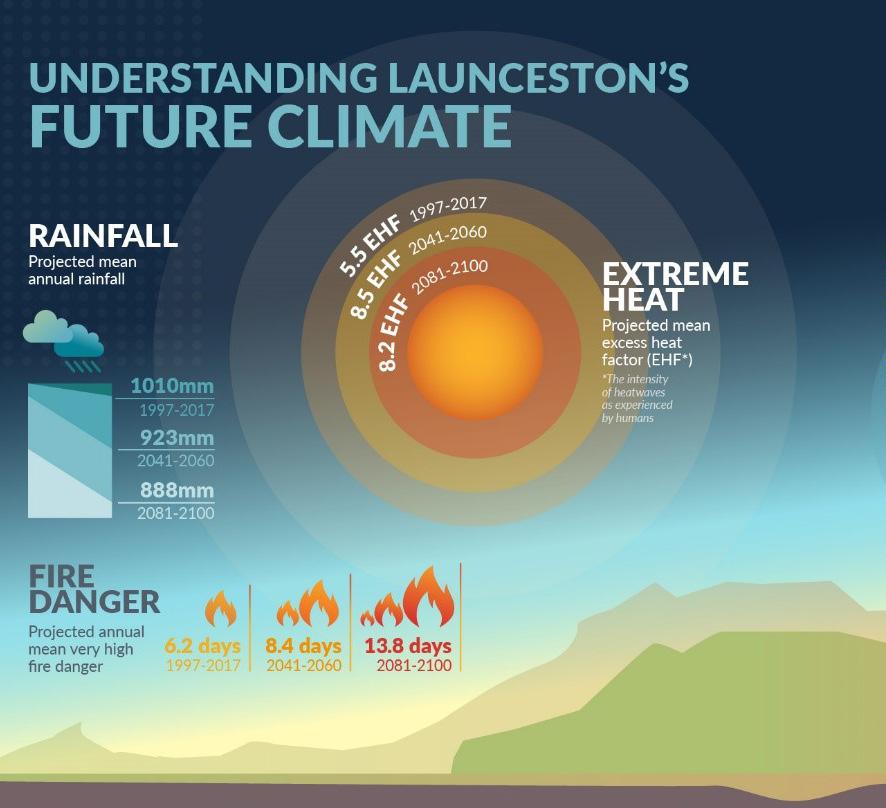
Although there are clear changes in projections of future climate in Tasmania, the fact that Tasmania is an island means that the changing climate is moderated to a certain extent by the surrounding ocean. Tasmania still sees an overall drying and warming trend, with a doubling of bushfire frequency and severity by 2100. Projections for Launceston in terms of changes to 2100 are less extreme compared to projections for other parts of the planet.
The climate projection information in the following pages provides more detail.
A set of climate indices (measures) was developed in consultation with the Launceston Community and the City of Launceston to identify the indices of most interest. They cover five broad areas: temperature, heat extremes, frost and cold extremes, rainfall and evaporative demand, and bushfire risk. These indices were calculated for the Launceston region. Information such as this is vital for planning to reduce the impact of climate variability and longer-term climate trends.
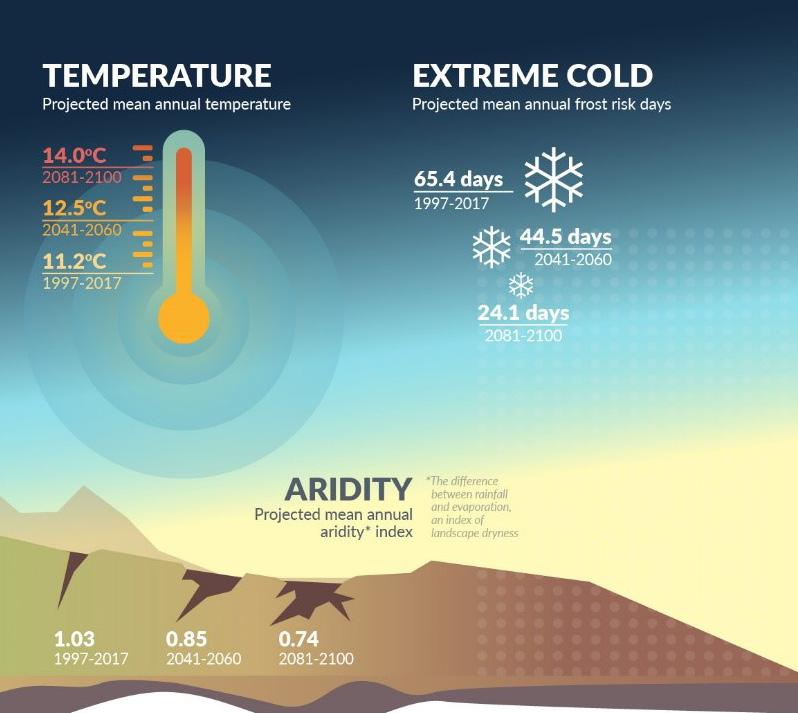
Temperature
These figures listed show observed and projected annual mean temperature.
Interpretation: Figures 1, 2 & 3 show that the mean annual temperature has risen by approximately 0.4°C in recent decades (comparing 1997-2017 to the baseline period 1961-1990). This increase has been consistent for all parts of the Launceston region.
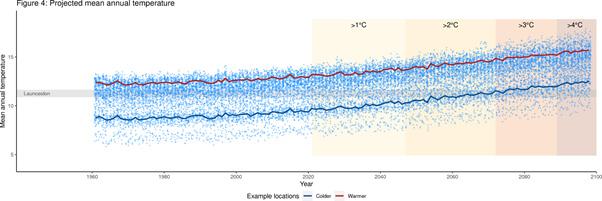
Figure 4: The shaded areas on the right of Fig. 4 show the change in temperature that could be expected in Launceston if global temperature rise is kept below the 1, 2, 3 and 4°C thresholds. This allows us to understand Launceston’s possible future temperature under a range of global warming scenarios.
Rainfall and evaporative demand
These figures show annual, monthly and seasonal rainfall, and annual, monthly and seasonal aridity, observed and projected.
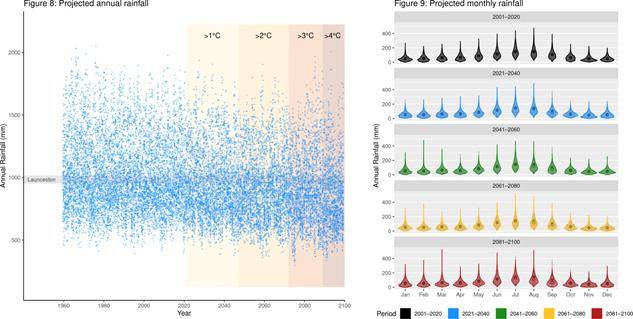
Interpretation: Figures 5, 6 & 7: The change in mean annual rainfall varies in different parts of the region (comparing 1997-2017 to the baseline period 19611990). The western and northern parts of the region, around Lilydale and the City of Launceston, have in general experienced less rainfall, with the largest change being ~40mm less between the two periods. In the eastern part of the region, towards Mount Barrow, mean annual rainfall has increased by up to 100mm for some areas.
Figure 8: There will be a slight drying trend across the region in future decades, although rainfall will continue to be variable (with some wet years and some dry years). The shaded areas on the right of Fig. 8 show the change in rainfall that could be expected in Launceston if global temperature rise is kept below the 1, 2, 3 and 4°C thresholds. This allows us to understand Launceston’s possible future temperature under a range of global warming scenarios.
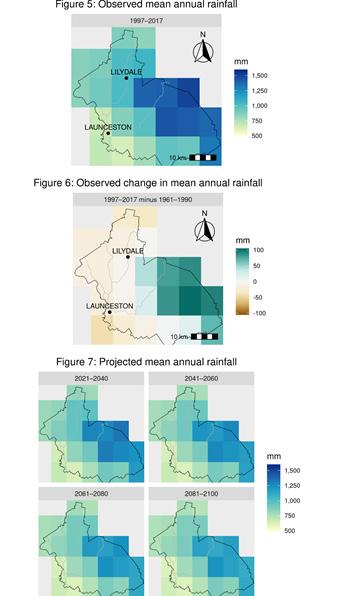
Figure 9: This figure indicates that there is little change projected for monthly rainfall for the Launceston region.

Heat extremes
These figures include the Extreme heat factor (EHF) during a heatwave, heatwave duration and intensity, the number of days per year exceeding temperature thresholds (30°C, 35°C, 40°C, 45°C) and the frequency of days with high human heat stress risk for people working outside.
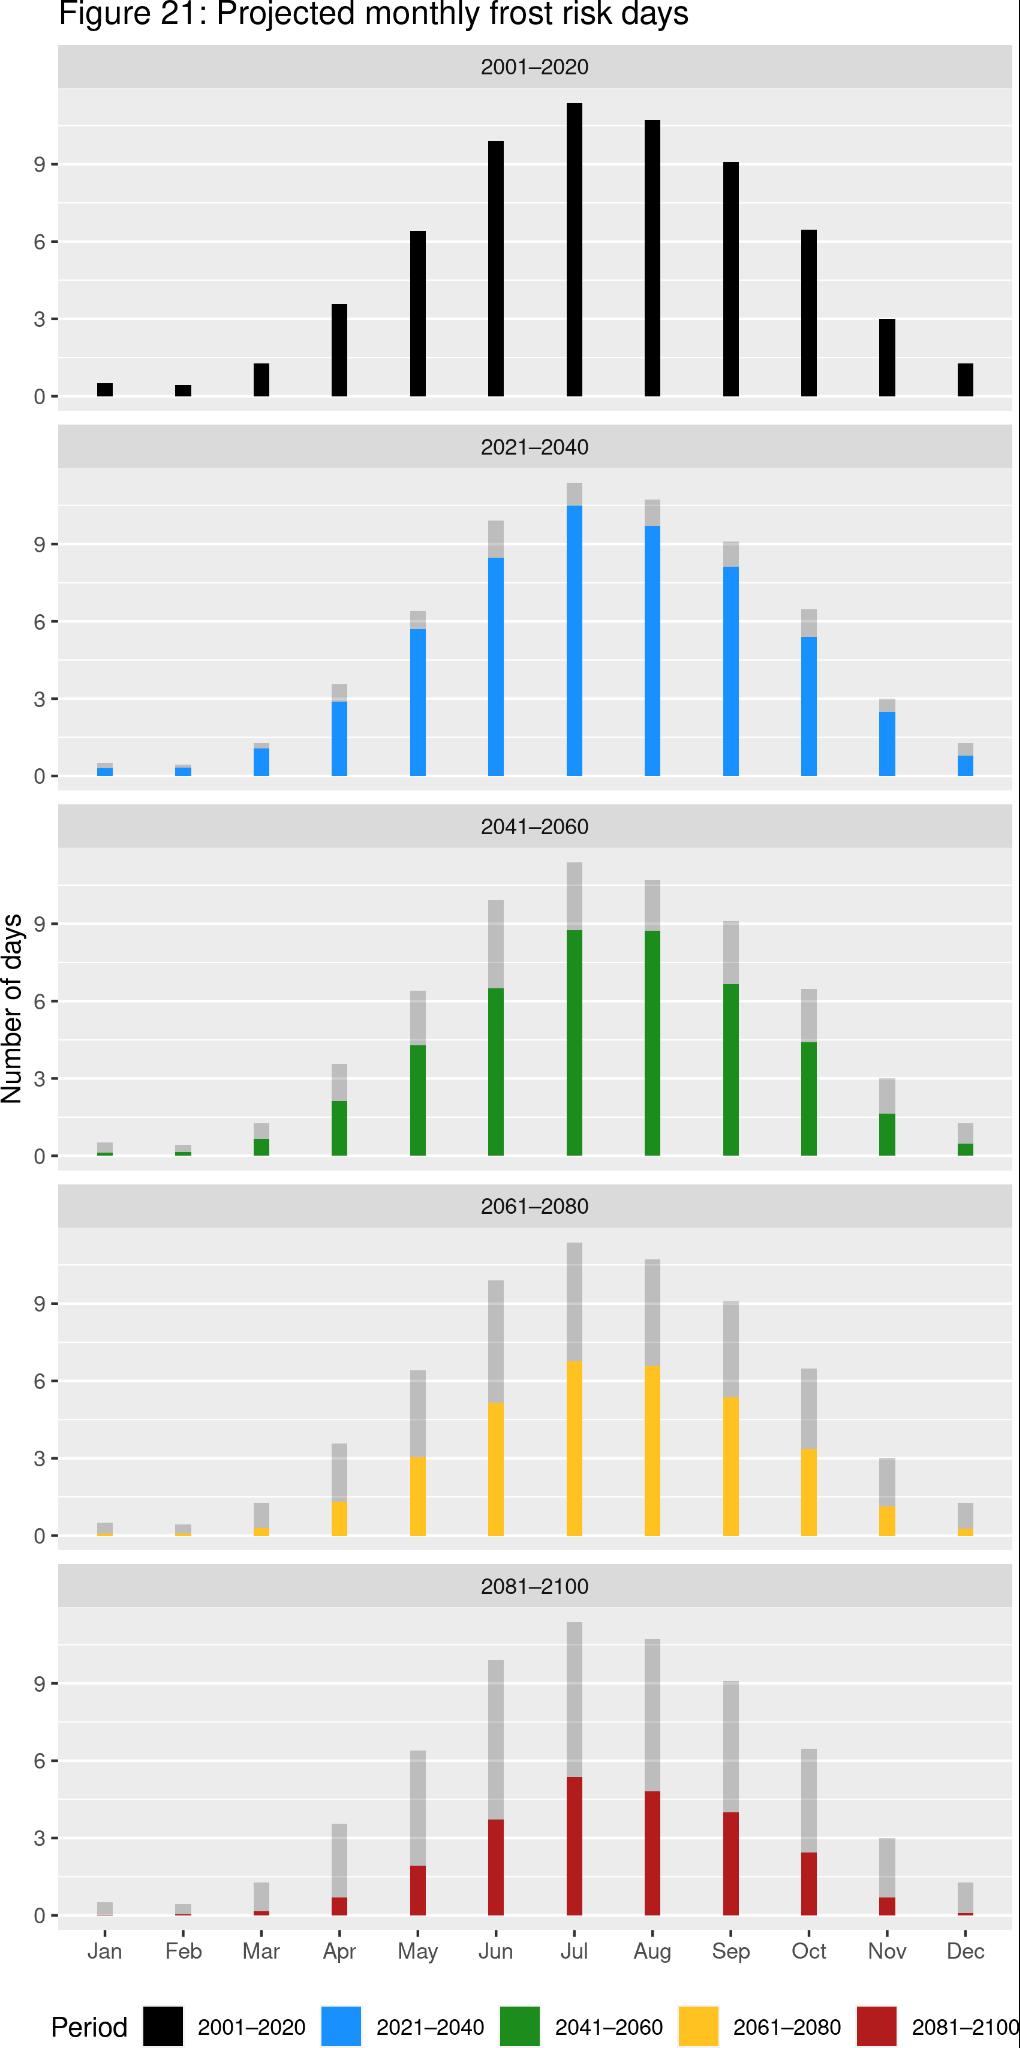
Interpretation: Figures 13 & 14: Very little change in mean Excess Heat Factor (EHF) has occurred in recent years in Launceston (comparing 1997-2017 to the baseline period 1961-1990).
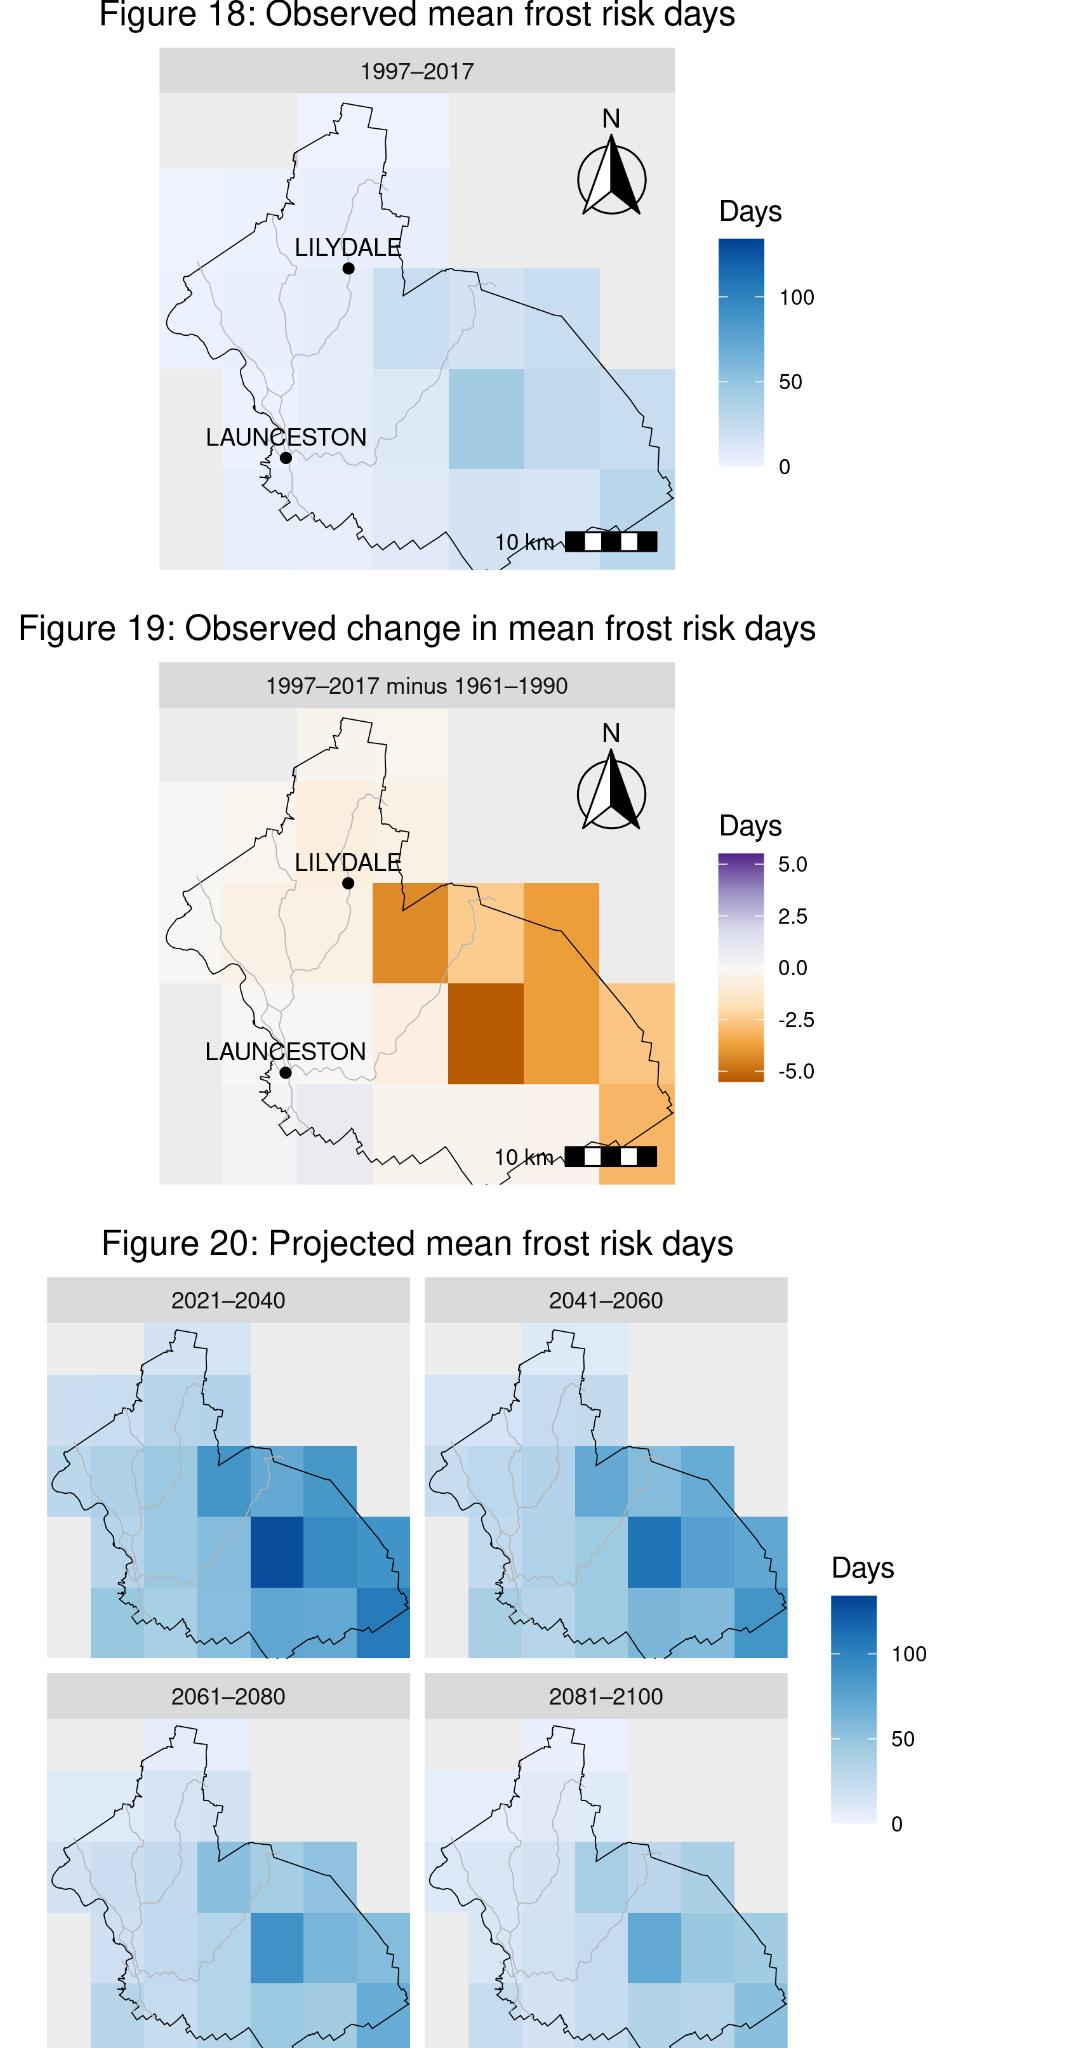
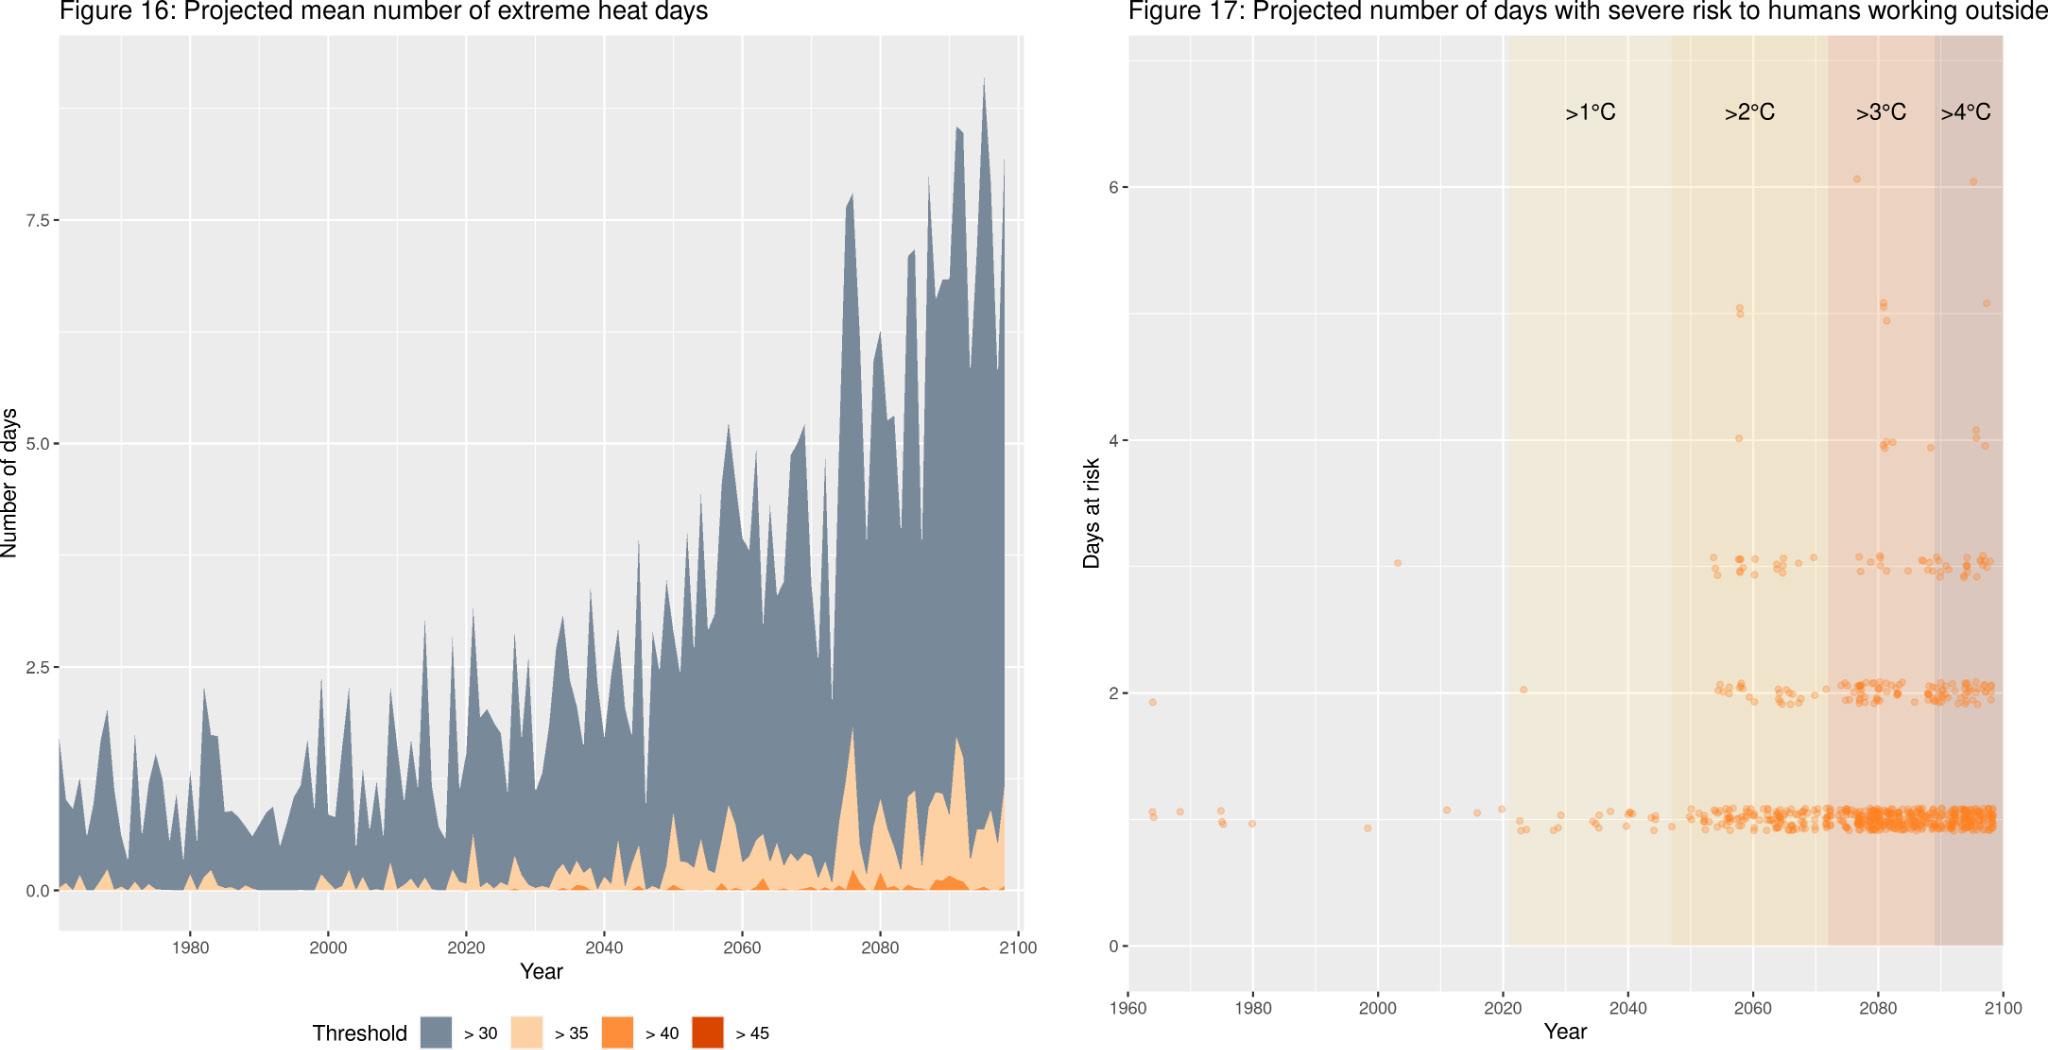
Figures 15, 16 & 17: Excess Heat Factor will increase in future decades, although extreme heat is not expected to be a major risk for Launceston in the future. The temperature thresholds of 35°C and higher will only rarely be exceeded and only 5 days per year are expected to pose a severe risk to humans working outside.
Cold extremes
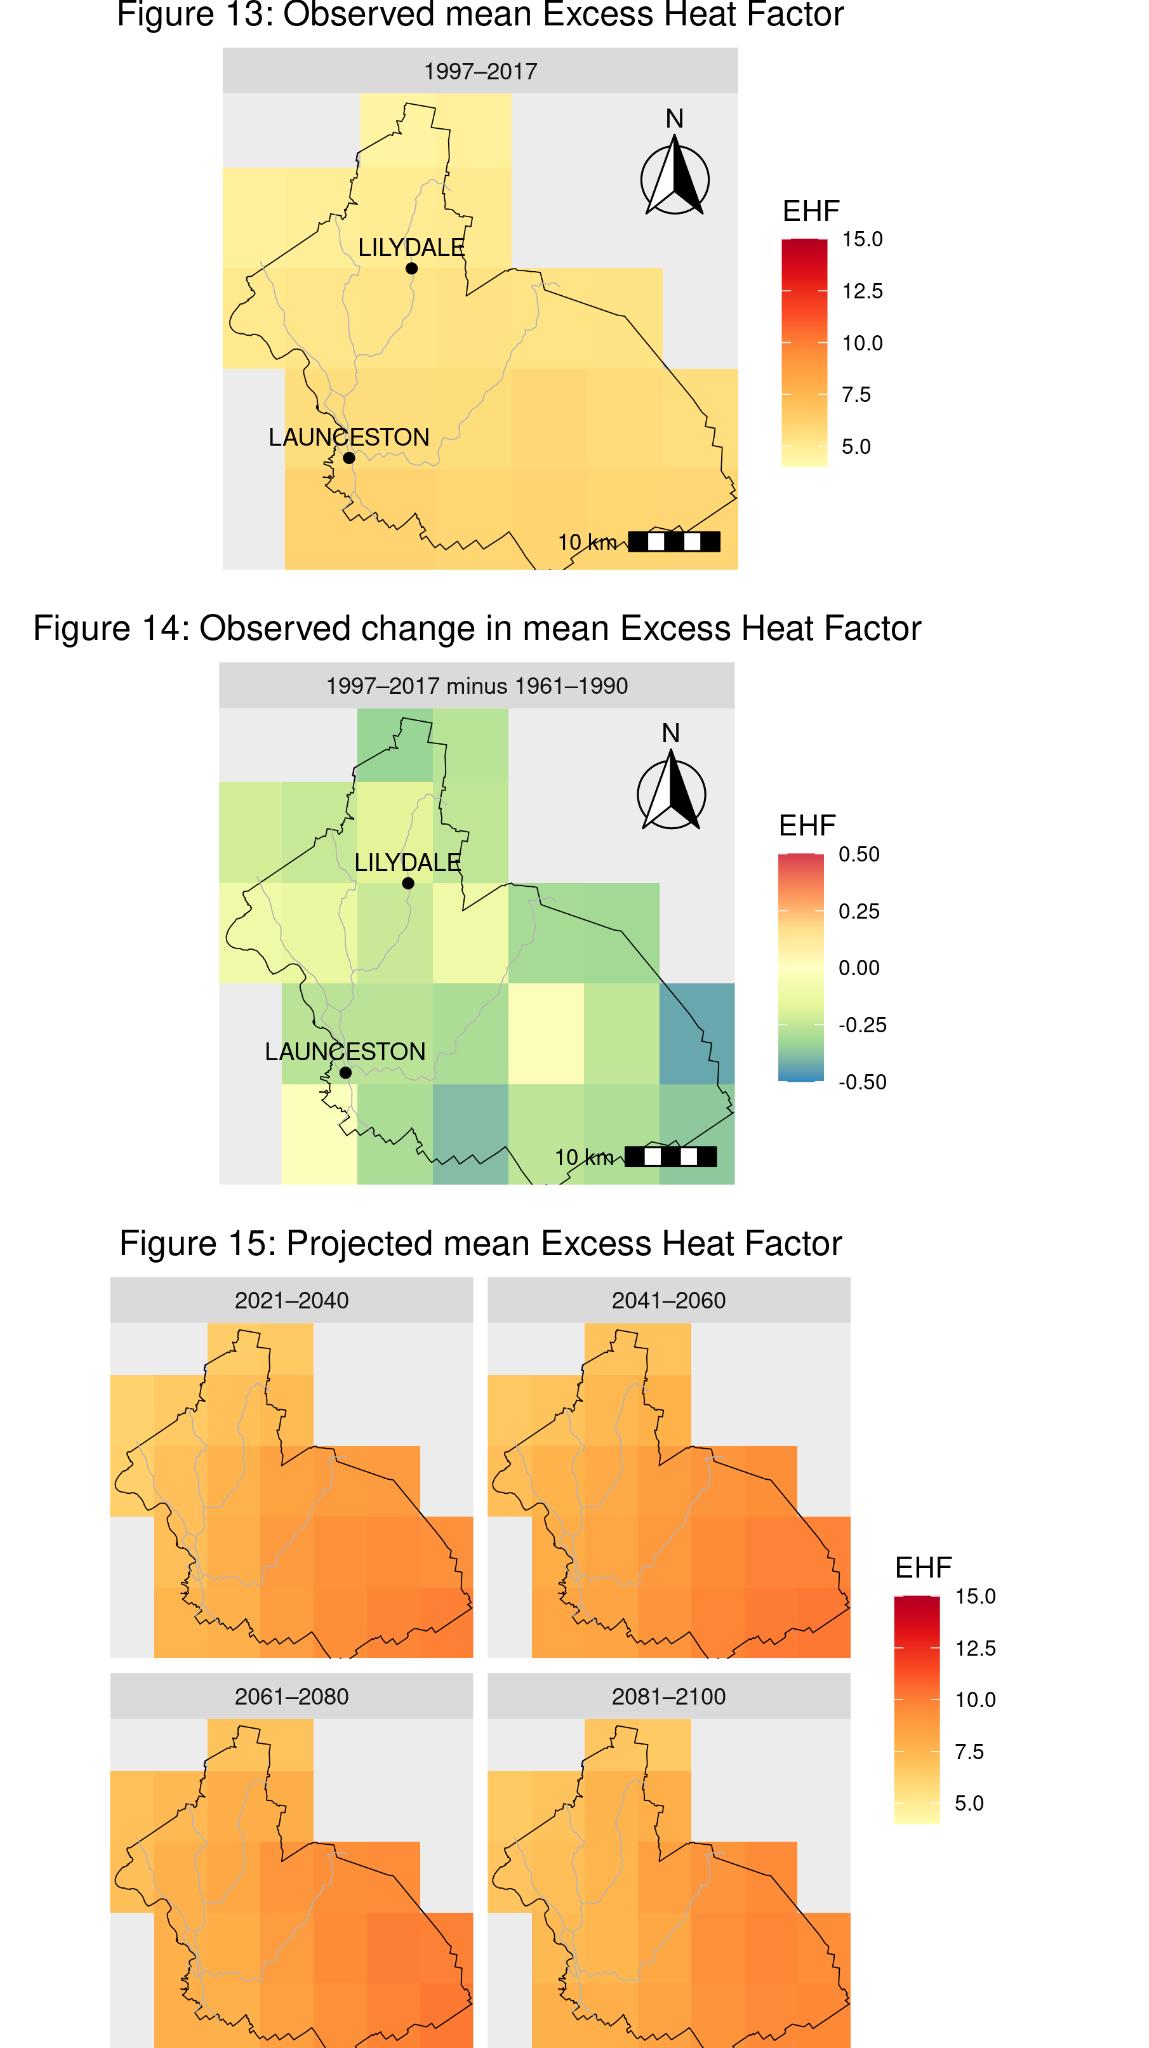
Annual mean frost risk days (days when the minimum temperature is <2°C) and monthly frost risk days.
Interpretation: Figures 18 & 19: The mean number of frost risk days (any day when daily minimum temperature is <2°C) across the Launceston region have slightly decreased by 0.5 days per year for lower altitudes, and up to 5 days per year for higher altitudes (comparing 1997-2017 to the baseline period of 1961-1990).
Figures 15, 16 & 17: Frost risk will continue to decline into the future. In some areas the number of frost risk days will halve and in other areas, there will be no frost risk days. Along with increased bushfire risk, the reduction in frost days is likely to be one of the most distinct climate impacts in the Launceston region, with important implications for fruit growers in the future.
Bushfire risk
These figures include the projected 90th, 95th and 99th percentile of daily max Forest Fire Danger Index (FFDI), projected monthly FFDI with outliers removed, projected monthly FFDI with outliers shown, and projected number of days per year with of bushfire danger ratings.

Interpretation: Figure 22: Both average Forest Fire Danger Index (FFDI) and extreme (99th percentile) FFDIs are expected to increase, and the City of Launceston will experience increased maximum daily FFDIs into the future.
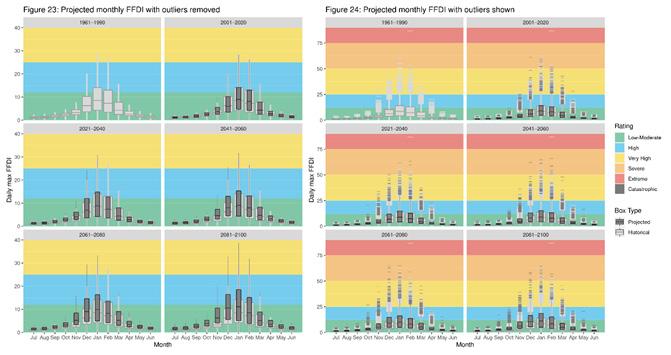
Figures 23 & 24: Fire risk across the year will also change, with the fire season lasting longer into the future. Forest Fire Danger (FFDI) risk is expected to increase particularly in spring. This means there will be a narrower window of suitable conditions for prescribed burning in the future. This has important implications for the opportunity to carry out hazard reduction burning, which is used to reduce the risk posed by high fuel loads across the landscape.
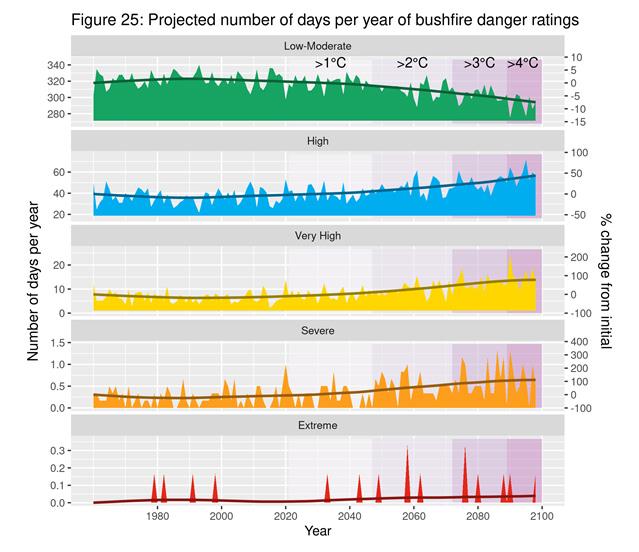
Figure 25: Projections of bushfire danger under future climate conditions suggest that fire danger will increase across Tasmania over the next decades. The frequency of low-moderate fire danger days will decrease, with an increase seen in the number of days per year of High, Very High, Severe and Extreme fire danger days in the Launceston area also.
Flooding in Launceston
Launceston’s flood risk is well known and well understood under current climate conditions. Flood risk in Launceston is caused by the combination of flooding from the North and South Esk Rivers and high-water levels as storm tides move upstream along the Tamar River estuary. As sea level rises and extreme weather events increase in the future due to climate change, flooding is expected to change in the Launceston area, as documented within the recent review of the North and South Esk rivers' flood behaviour.
City of Launceston : Response
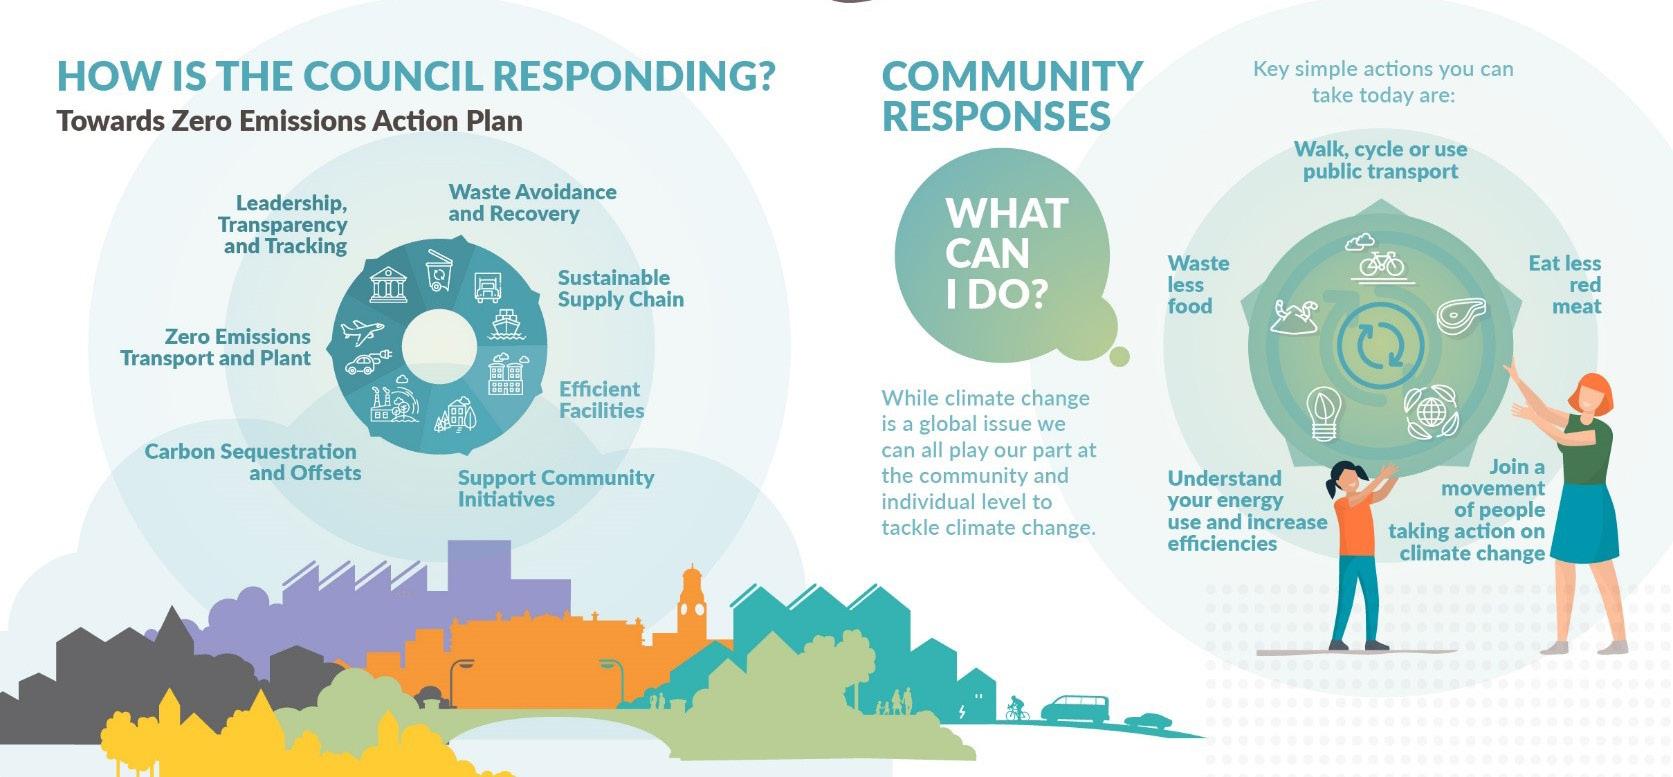
It was with the support of the community that the City of Launceston developed a Sustainability Action Plan which aims to align and coordinate the City of Launceston’s actions related to climate change within the framework of its responsibilities.

As part of the Action Plan, the Council commits to reducing emissions associated with its activities, enhancing the region’s resilience, and managing the risks associated with a changing climate.
