LAUNCESTON RESIDENTIALLANDREVIEW


June 2023
RENAISSANCE planning understand | envision | plan | sustain
LAUNCESTON CITYCOUNCIL

Final Report Prepared for the City of Launceston June 2023

Dr JeffWolinski
Renaissance Planning Pty Ltd
The author wishes to acknowledge the guidance and encouragement of the Manager for Strategic Planning, Mr Richard Jamieson.
I would also like to acknowledge the contribu ons made in bringing this Report to comple on:
Kathryn Connane
Chris na Santa-Isabel
Irene Sajn, idraw4u
Disclaimer: Neither Renaissance Planning Pty Ltd nor any member of employee of Renaissance Planning Pty Ltd takes responsibility in any way whatsoever to any person or organisa on (other than that for which this report has been prepared) in respect of the informa on set out in this report including any errors or omissions herein. Renaissance Planning is not liable for errors in plans specifica ons, documenta on or other advice not prepared or designed by Renaissance Planning.
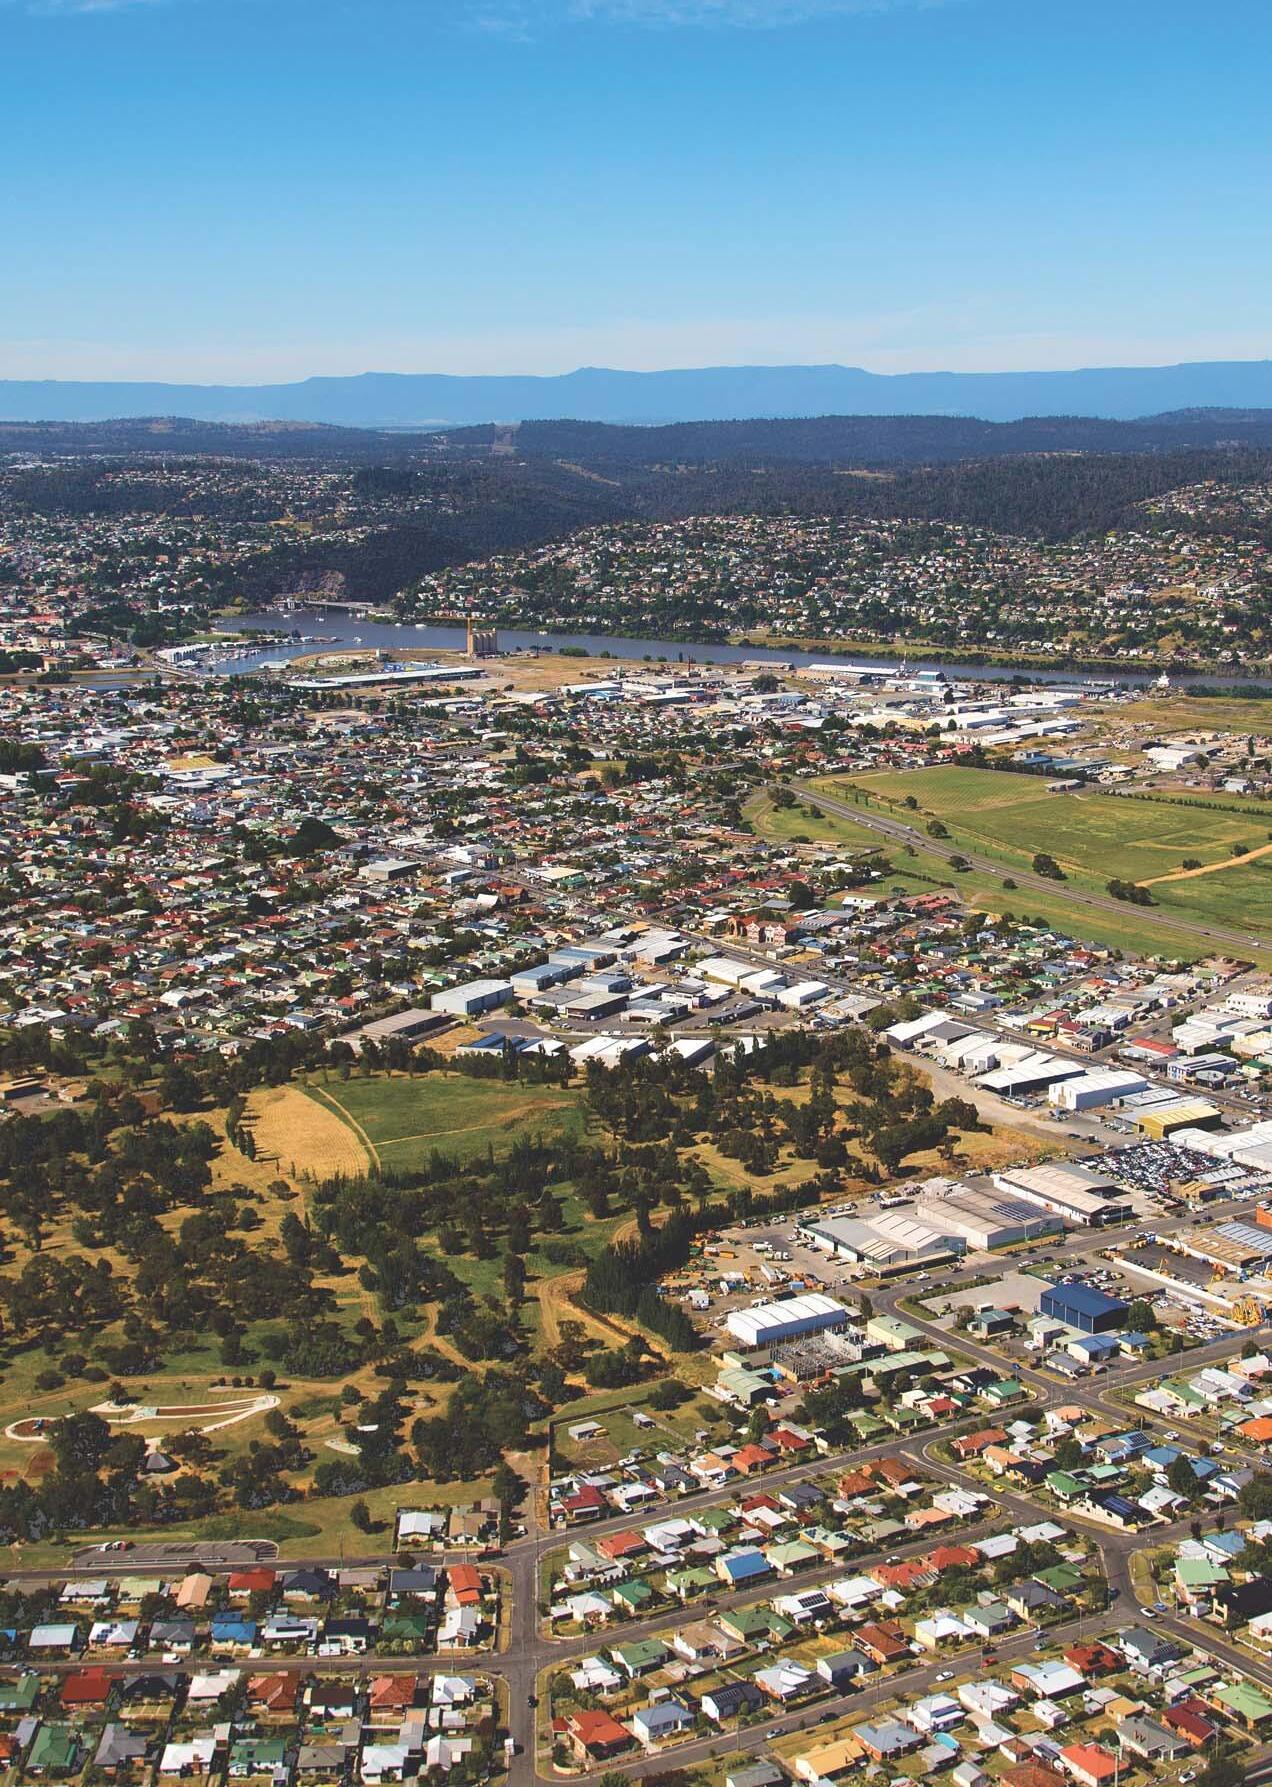
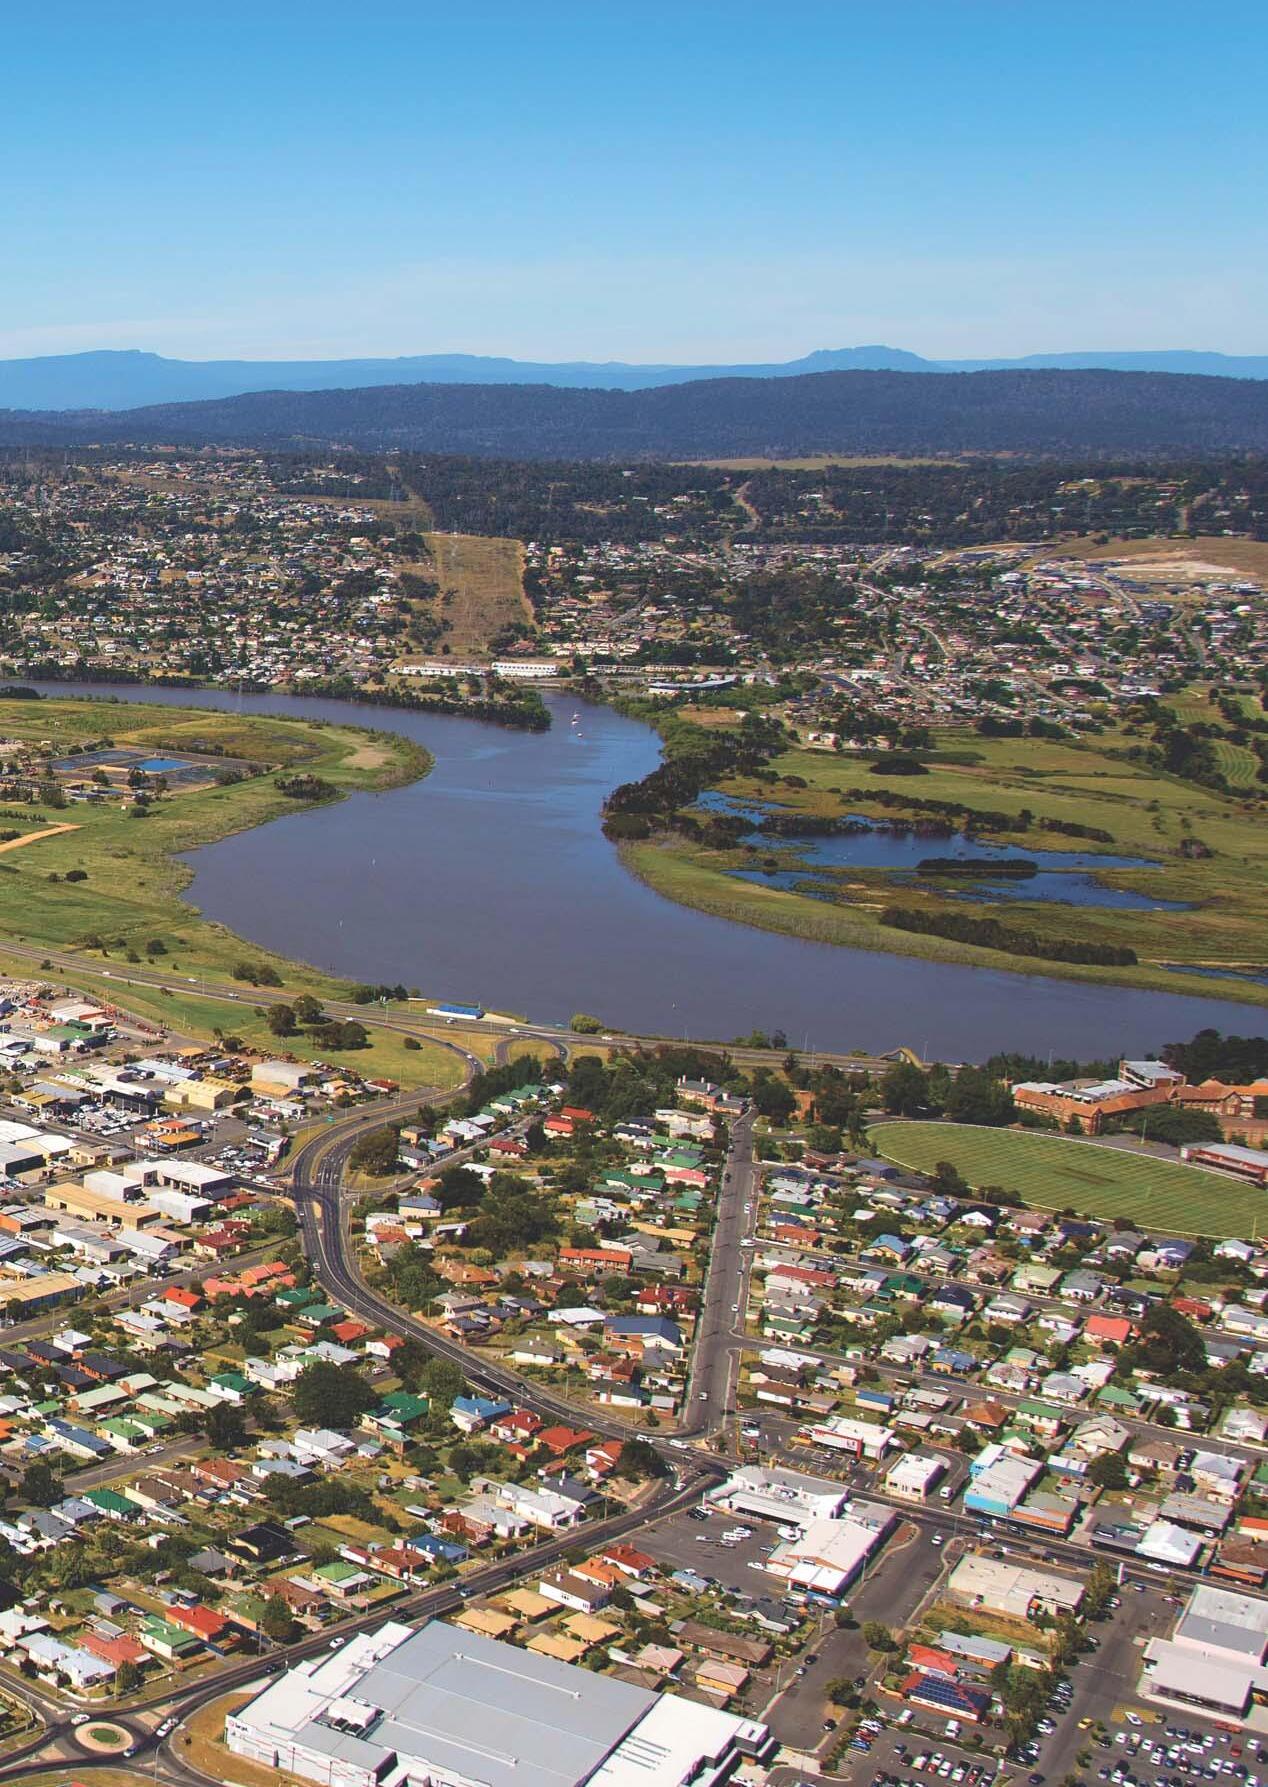
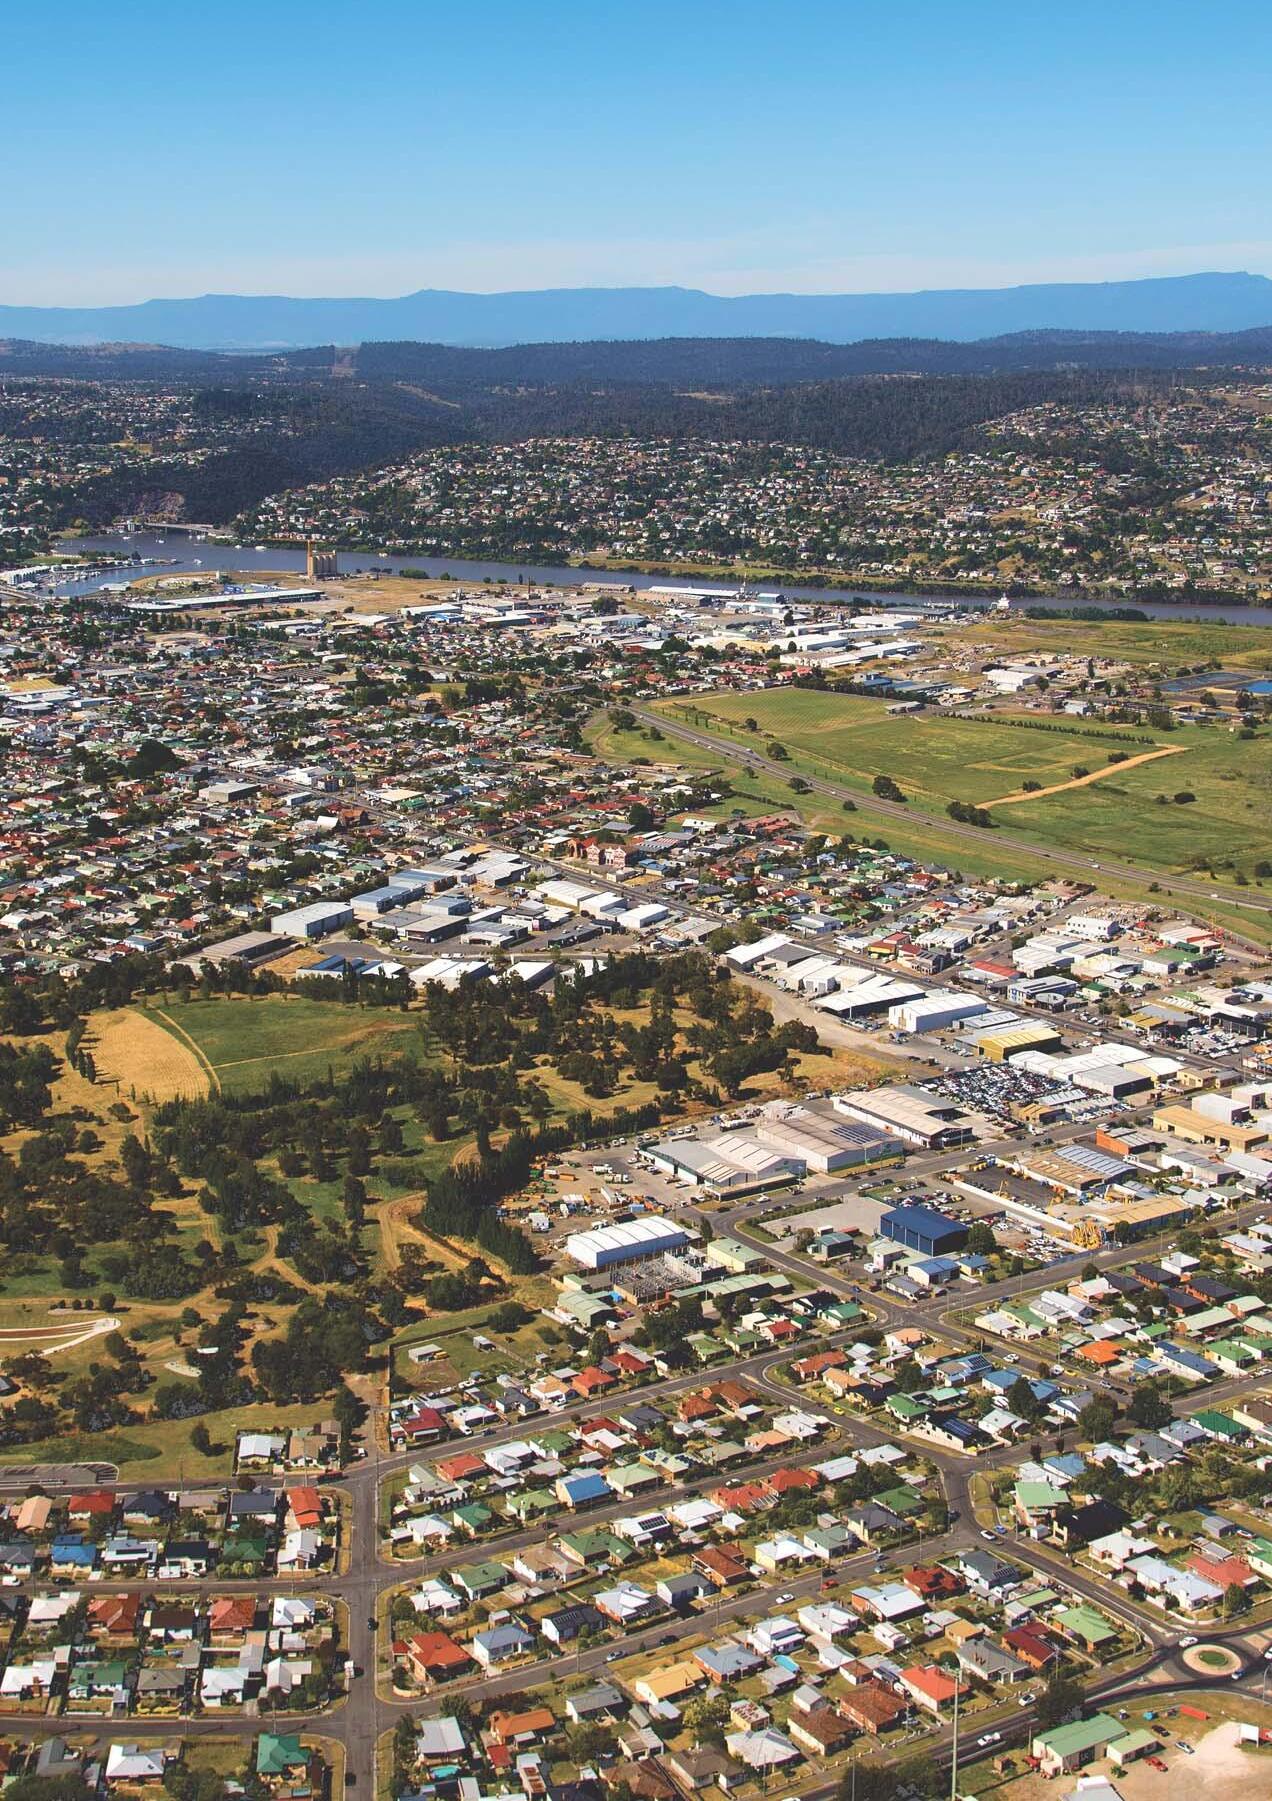
Photo Credit: Rob Burne , Tourism Tasmainia and Nick Hanson
Figure 1 Greater LauncestonArea StudyArea
Figure 2 City of Launceston: StudyArea
A.1: Estimatedopulation (ERP) Residential P
A.DS 2:Totalwellingtock
A.3:ccupiedwellingtock
Set B: Greater LauncestonArea Municipalities (GLAM): Changes in Population and Dwelling Stock
B.1: Estimated Resident Population (ERP) SelectedYears: 2001, 2011, 2021
B.2Total Dwelling Stock SelectedYears: 2001, 2011, 2021
B.3 Occupied Dwelling Stock SelectedYears: 2001, 2011, 2021
Set C: Greater Launceston Statistical Sub-division: Changes in Population and Dwelling Stock
C.1 Estimated Resident Population (1996–2021) HistoricTime Series by ComponentArea
C.2Total Dwelling Stock (1996–2021)
C.3 Occupied Dwelling Stock (1996–2021)
C.4 Persons Per Occupied Dwelling (1996–2021)
C.5 Percentage of Occupied Dwellings
C.6MPHC Summaryeasures ofopulation andousinghange (2001–2021)
Set D: City of Launceston StudyArea: Residential Land Supply Tables
D.1 Zoned Residential Land Supply(March 2022)
D.2GRZPD Analysis ofeneralesidentialone byropensity forevelopment (March 2022)
D.3Analysis of Development-ready Land Supply in the General Residential Zone (GRZ) (March 2023)
D.4RLSAdditionalesidentialandupply (March 2022–March 2023)
E.1 Greater LauncestonArea Municipalities (GLAM) Region Residential BuildingApprovals:Total New Dwellings (2003–2020)
E.2 Greater Launceston Statistical Sub-divisionAnalysis of Net Increase in Total Dwelling Stock (2001–2021)
E.3 City of Launceston StudyArea BuildingApprovals for New Residential Development (2000–2020)Analysis by Suburb and District
E.4 City of Launceston StudyArea BuildingApprovals for New Residential evelopment (2021–2022 Inclusive)
E.5 City of Launceston StudyArea: BuildingApprovals for New Multiple Units Onon-vacantand (2000–2017) * NL
E.6 Greater LauncestonArea Municipalities (GLAM) Region Dwelling Unit BuildingApprovals and Net Changes inTotal Dwelling Stock (2001–2021)
E.7 Greater Launceston Statistical Sub-division Dwelling Unit BuildingApprovals and Net Changes inTotal Dwelling Stock (2001–2021)
Set F: Launceston ResidentialAllotments Demand - Supply
F.1 Greater Launceston Statistical Sub-divisionAssessed MediumTerm ResidentialAllotment Requirements (2023–2036 + 7-Year Rolling Reserve)
F.2 City of Launceston: StudyArea Housing Development: 2000–2022:Key Statistics
F.3 - F.8 Residential Demand SupplyAnalysis (2023–2036/37)
F.3 (2023–2024/25)
F.4 (2025–2026/27)
F.5 (2027–2028/29)
F.6 (2029–2032/33)
F.7 (2033–2036/37)
F.8 (2023–2036/37) SummaryTable
Set G: PopulationAnalysis and Projections
G.1 State ofTasmania (1989–2033) Population Projections byAge Cohort
G.2 Greater HobartArea Population Projections byAge Cohort
G.3 Estimate of Projected Population Growth forTasmania Net of Greater Hobart 2021 - 2033
G.4 Greater Launceston Statistical Sub-division Residential-based Population Projection (2036)


The Launceston Residential Land Review was prepared in 2022/23 for the Launceston City Council by Dr JeffWolinski, Renaissance Planning Pty Ltd. It is a considered land demand-supply assessment of likely residential land requirements for the City in the future medium term (2023–2036) and allows for a 7-year rolling reserve at the completion of this period.
The Study has provided research and analysis in relation to the following: an overview of population and demographic change in the State ofTasmania; housing need and residential land requirements for the greater City and provision for a rolling reserve (2023–2036);
detailed analysis of residential housing and land demand-supply in defined suburbs and districts in the City of Launceston (2000–2020);
projections of residential housing and land requirements for the City of Launceston, assessed by suburb and district for the period 2023–2036 with allowance for a 7-year rolling reserve;
recommended priorities for residential development in the City of Launceston.
Tasmania's resident population has been growing at approximately one per cent per annum compound over the period 2001-2021.
This growth rate is predicted to continue in projections provided by the Centre for Population (Online Public Release, 6 Jan 2023).The Centre has foreshadowed ongoing major changes in the age-sex structure of the population.There are likely to be major implications for future patterns of living and housing market needs (among a range of other impacts).
The greater Hobart region is predicted to grow by approximately 1.3 per cent per annum compound over the period 2022-2033. Within this context the projected growth rate of the balance ofTasmania outside the greater Hobart area is approximately 0.72 per cent per annum compound for the period 2022-2033.
Aresidential-based population model prepared for the Study indicates the resident population of the greater Launceston area is projected to increase to approximately 124,160 persons by 2036, representing a long-term growth rate of approximately 0.66 per cent per annum.
Greater Launceston may be characterised as a lower-moderate growth urban area. Launceston City is the largest single population component, but comparatively lower differential rates of growth have resulted in marginal shifts in the overall spatial distribution of the resident population over time.
The projection forTasmania's population outside the greater Hobart area of 0.72 per cent per annum compound based on the Centre for Population's recent Public Release (6 January 2023) provide an important context for an understanding of greater Launceston's population growth over the 20-year period to 2021.The greater city's growth rate in the post-2000 period (0.66 per cent per annum) is certainly of the same order as has been projected forTasmania outside the greater Hobart area.
The demographic projections by the Centre Population foreshadow historic ongoing and future changes in the age-sex structure of the population, with projected highly significant patterns of ageing.There are likely to be major implications for future patterns of living and housing market needs (among a range of other impacts) should these projections be realised.
Market share patterns throughout the 18-year and 20-year periods examined indicated a consistent distribution where the Western and South-Western growth areas of WestTamar, Meander Valley and Northern Midlands together held approximately 55 per cent of housing approvals in the greater City.
Approximately 39 per cent of the metropolitan housing market was held by the City of Launceston.The balance of approximately 6 per cent occurred in George Town.
Total dwelling approvals for the 20-year period 2001–2021 were estimated as follows (referTable E.7, Column 3):
City of Launceston (part): 3,800 dwelling approvals;
WestTamar (part): 2,920 dwelling approvals;
Meander Valley (part):1,140 dwelling approvals;
Northern Midlands (part): 1,380 dwelling approvals;
GeorgeTown (part):580 dwelling approvals;
Total LauncestonSSD:9,820 dwelling approvals.
Total housing requirements for the greater City over the, 14-year period to 2036 were assessed at approximatelydistributed as follows 6,770 dwellings (referTable F.1, Column 3):
City of Launceston (part) 2,870 dwellings.
WestTamar (part)1,960 dwellings.
Meander Valley (part) 800 dwellings.
Northern Midlands (part) 830 dwellings.
GeorgeTown (part)310 dwellings.
In addition, for land planning purposes, aforward allowance of a minimum7-year rolling reserve should be provided together with the projected demand for the period under consideration.The housing allowance in the 7-year rolling reserve should provide land for adistributed as follows further 3,380 dwellings (referTable F.1, Column 4):
City of Launceston (part) 1,440 dwellings.
WestTamar (part)980 dwellings.
Meander Valley (part)400 dwellings.
Northern Midlands (part) 410 dwellings.
GeorgeTown (part)150 dwellings.
The assessed total residential land requirements for the greater Launceston city area for the 14-year period 2023–2036 together with an allowance for a 7-year rolling reserve indicated that approximately(ESL) 8,540 equivalent single lots were likely to be required for the greater City area.This ongoing and future land requirement is distributed as follows (referTable F.1, Column 8):
City of Launceston (part) 3,450 lots.
WestTamar (part)2,580 lots.
Meander Valley (part)1,050 lots.
Northern Midlands (part) 1,090 lots.
GeorgeTown (part)370 lots.
An inventory of the City of Launceston's residential land supply has been updated to March 2023. It represents all land in the General Residential Zone (GRZ) that is readily capable of development and is not constrained by any known issues.
The assessed level of effective supply at March 2023 was approximately 1,400 lots (Equivalent Single Lots orESL) (referTable D.3).

Adetailed land demand-supply analysis for the City of Launceston has found that over the 14-year period to December 2036 approximately 3,430 dwellings are likely to be required to meet the ongoing and future needs of the City of Launceston (referTable F.8, Column 4). Of this number:
some 2,950 dwellings will be needed to be developed on new housing lots, comprised of approximately 1,620 single dwellings and 1,330 multiple units; approximately 480 dwellings are projected as infill development in existing urban areas.
Total land requirements in the City of Launceston for new housing in the 2023–36 period together with an allowance for a 7-year rolling reserve were assessed at approximately 3,150 lotsESL.
An importantfinding of the Study is that the likely level of land requirements to accommodate the housing needs of the City will substantially exceed the existing development-ready land supply for the City assessed at March 2023.
The demand-supply analysis undertaken for the City of Launceston has identified a significant deficiency of zoned residential land that is readily capable of development and not constrained by any known issues.Thefindings clearly showed:
the City's current effective residential land supply was assessed at 1,400 lots (ESL)at March 2023 as(referTable F.8, Column 6);
residential land likely to be required for development in the near future and medium term (2023–2036) significantly exceeds current supply (this was assessed at approximately, refer F.8, Column 5); 2,100 lots
provision of an allowance for a 7-year rolling reserve would require approximatelyESLat current and projected rates of likely land take 1,050 lots up;
thus the minimal residential land requirements for the City of Launceston for the 14-year periodare approximately.This is of 2023–363,150 lotsESL the same order as an initial broad assessment ofbeing required to 3,450 lots meet the City's residential needs over the period to(referTable F.1, 2036 Columns 6-8).
In conclusion, the City's current effective supply of residential land (1,400 lotsESL) is well below assessed minimal requirements (in the range 3,150–3,450 lotsESL). Astrategy to address this deficiency has been identified to enable the City to secure a viable and effective pathway for its residential development future.
It is recommended that Council undertake a broadly based residential land development strategy in order to secure the City's required land supply necessary to meet future housing needs and minimise strategic risk in future residential development:
first priority projects: completion of planning and development-preparation processes for identified future new residential areas. This encompasses the following projects:
- completion of current conservation and management studies for the South Prospect development project; this project has a design capacity of approximately 1,600 lots.
- support for thedevelopment project in the North District with a Alanvale design capacity for approximately 450 lotsESLis recommended as a priority project.
co-ordinated infrastructure projects to facilitate approved estate development.
It is recommended that Council adopt a co-ordinating role to address infrastructure constraints which are preventing two key projects from proceeding.These are:
- theEstate in North St Leonards with a design capacity of Cedar Grove 325 lots;
- theat Reservoir Road in Rocherlea with a design capacity of Green Estate approximately 400 lots.
Completion of strategic and development planning for the St Leonards area
It is recommended that Council review and complete the strategic and development planning undertaken for the St Leonards area. It is anticipated that the plan will provide for approximately 1,000 lotsESL;
Support for Infill Development.
It is recommended that Council develop a multi-faceted program to foster and progress a diversity of infill development opportunities within the established urban area.
The role of infill housing needs to be progressively expanded over time to form a significant component of new housing development.
The achievement of this objective via community-based infill development projects will bring a range of benefits to the City and the broader Launceston community.
The Launceston Residential Land Review was prepared in 2022/23 for the Launceston City Council by Dr JeffWolinski, Renaissance Planning Pty Ltd. It is a considered land demand-supply assessment of likely residential land requirements for the City in the future medium term (2023–2036) and allows for a 7-year rolling reserve at the completion of this period.
This Review is part of regular and ongoing strategic planning reviews and related residential land assessments undertaken by the City of Launceston. Council is committed to ensure that the City of Launceston, together with the broader greater city area is developed as a community-based structured city district, where emphasis is placed on the following:
the need to provide for the long-term development of viable and vital communities as part of the broader development of the City of Launceston within the greater city area;
the siting of potential future residential communities is a considered strategic process and takes into account a range of factors including:
the relationship of the potential future community to existing residential communities and employment areas and to a wider range of activity centres including access to the LauncestonCBDand access to a range of social, education and health facilities;
the contribution of the proposed future community development to the further integration and inter-connection of the urban area of the City and the broader greater city area relationship to existing and future open space linkages in the City and broader greater city area;
relationship to existing and proposed transport infrastructure and the contribution this makes to the efficient use of the transport network and improved intra-city access and interconnection.
relationship to the LauncestonAirport and other major regional facilities in NorthernTasmania.
The process of residential land assessment and strategic planning for the identification and detailed planning of future residential communities isfirmly placed within the context of Council's long-standing commitment to an evidence-based strategic approach to the analysis, planning and implementation of land infrastructure requirements to meet the ongoing and changing needs of the Launceston community.
Significance of the Greater Launceston Plan (May 2014) as a community vision and strategic framework for the sustainable and effective development of Launceston
Ongoing application of a projects-framework for the effective realisation of a multi-faceted environmental, socially-based and economically effective strategy for the sustainable and equitable long-term development of the City and the broader greater city area.
The Study will provide the following data or assessments and develop considered conclusions and recommendations for Council.The Study Deliverables include:
to review residential land requirements for the City of Launceston for the broader greater city context;
the Study is required to provide an assessment of land requirements for a future medium-term period (2023–2036) with a 7-year rolling reserve to be provided at the end of this period;
within this context to provide an overview of residential land allocation necessary to support the timely implementation of the South Prospect Framework Plan currently in development;
to review and update future land supply recommendations for the City of Launceston and to provide for the needs for the City of Launceston to 2036 with a 7-year rolling reserve.
The Study will provide the following data or assessments and develop considered conclusions and recommendations for Council.The Study Deliverables include:
residential land supply update by suburb or local area to 2023 for the Launceston StudyArea;
historic residential demand updated to December 2020 by suburb in the Study Area;
historic trends for each of the component municipalities that form part of the greater Launceston area statistical sub-division, the analysis will encompass long-term trends in:
estimated resident population (ERP); total dwelling stock; occupied dwelling stock; persons per occupied dwelling; dwelling unit building approvals.
historic record of multiple unit housing by suburb and impacts on land requirements;
medium term projections (2023–2036) of the above measures for the municipalities that comprise the a greater Launceston area Councils and component areas of the Greater LauncestonArea sub-division;
projections of likely future building unit approvals and residential land requirements for the future medium-term (2023–2036) and allow for a 7-year rolling reserve;
recommended residential land requirements and land allocation provision for the City of Launceston for the future medium-term period (2023–2036) together with a 7-year rolling reserve.
assessment of land requirements for ongoing and likely future residential developments. Within this context an assessment is required of the demand basis and supply impacts of the proposed residential community envisaged in the South Prospect Framework Plan currently in preparation.

The study process comprised of several components: establishment of a consistent framework for analysis; establishment of the database; assessment at the greater city level; assessments of change within the City of Launceston.
The study process comprised the following major components.
The analysis framework is based on the recognition that the City of Launceston is a core and integral component of an inter-connected greater urban area.The geographic area that best reflects this is the Greater Launceston Statistical SubDivision (SSD) as defined by theAustralian Bureau of Statistics (ABS) at the 2006 Census (refer: Greater Launceston Plan, 2011, Figure 1.1, restated in this report, refer Figure 1).
The Greater LauncestonSSDis the key reference area employed by the Greater Launceston Plan as encapsulating the effective greater city area encompassing the city's residential and employed population.The greater city area as defined encompassed urban areas and immediate surrounds of parts of the following municipalities: City of Launceston; WestTamar; Meander Valley; Northern Midlands; GeorgeTown.
In 2006, the estimated resident population (ERP) of the greater LauncestonSSD was approximately 103,170 persons.Atat the 2021 census the resident population was approximately 112,400 persons.
In the establishment of the database and the undertaking of analyses of population and housing a consistent framework was developed focused on the Greater LauncestonSSDas the key reference area with a related area, the Greater LauncestonArea Municipalities (GLAM) as a supporting reference area.
The position was taken that the research should reflect the overall growth and economy of Launceston as an integral regional city.This is best achieved through the adoption and consistent application of the Launceston greater city areaSSD.
Beaconsfield Exeter
1:350,000 @A.4
04.5913.518 2.25 Kilometers
Legend
Greater LauncestonArea (SSD)
StatisticalArea 2 (SA2)
StatisticalArea 1 (SA1)
Water Parkland and Open Space Urban Centres / Localities (ABS, 2006)
*Source: Greater Launceston Plan, July 2014Figure 1.1 , Refer
Revised Greater LauncestonArea (ASGS- CurrantABSGeographic Boundaries)
Base data source: Australian Bureau of Statistics theLIST , © State ofTasmania Launceston City Council
Adatabase was developed for the Greater LauncestonSSDand theGLAM region for a series of measures in population and housing over a 20-year period (2001–2021) incorporating the outcomes offive successive censuses in the period. Residential building approvals were provided by the municipal Councils that constituted the greater city area.The key measures in the database were set out in the Study Deliverables (refer Page 18).
Analyses of patterns of change of the above measures were undertaken (ReferTable SetsA–C).
The assessments provided an overview of how the greater city area was changing over time in relation to:
the overall rate of growth of the residential population; patterns of differential change within the greater city; the relationship of housing requirements to population; patterns of housing and residential land take up over time; indicative projections of likely housing and land requirements.
Detailed analyses of residential demand and supply were undertaken within the City of Launceston by suburb and residential district. For the purposes of this analysis a StudyArea was defined within the City of Launceston.The StudyArea was originally defined for the Residential Land DemandAssessment prepared for the City of Launceston (March 2019). It comprised of the following districts and key component suburbs (refer Figure 2):
North District
Includes:
Mayfield
Mowbray
Newnham
Rocherlea
East District
Includes:
Ravenswood
Waverley
West District
Includes:
Summerhill
Trevallyn
West Launceston
South East District
Includes:
North St Leonards
St Leonards
South District Includes:
Kings Meadows
Norwood
Punchbowl
Youngtown
Central Includes: East Launceston
Invermay
Launceston
Newstead
South Launceston
South West Includes: Prospect
South Prospect
It will be noted that the current report has incorporated the South Prospect area as an active residential demand-supply area in the post 2026 period.
The StudyArea as defined above provided the framework for a detailed assessment of:
existing residential land supply;
residential building approvals;
distribution of single dwellings and multiple units; a demand-supply analysis for residential housing and allotment requirements for the period 2023 - 2036 with an allowance for a 7-year rolling reserve.
STUDYAREA:
It is important to provide a brief commentary on population growth and change at the State level in order to appreciate the growth and demographic change context for the greater Launceston City.
The keyfindings encompass the following:
the State ofTasmania had an estimated resident population (ERP) of approximately 473,250 persons at December 2001;

at 2021 the State'sERPof approximately 569,800 persons;
Tasmania's population had an average compound growth rate of 0.93 per cent per annum over the 20-year period to 2021;
the Centre for Population which is anAustralian government agency issued an Online Public Release (6 Jan 2023). Its population projections for Tasmania included the following:
Tasmania's population is projected to grow by approximately one per cent compound per annum over the period 2022-2033;
the greater Hobart area will comprise a major component of the State's growth. Its population is projected to grow at approximately 1.3 per cent per annum over the forecast period (ReferTable G.3);
the projected population growth rate ofTasmania outside the greater Hobart area has been calculated at approximately 0.72 per cent per annum compound (ReferTable G.3).
Acriticalfinding contained in the Online Public Release was the prediction of highly significant demographic changes contained in the projection of the State's population over the period to 2033;
the Centre for Population has provided a projection of the State's population to 2033 by age cohort (ReferTable G.1);
it provided an assessment of the State's population in 1989 by age cohort for comparison;
the historic demographic structure and projected changes indicate highly significant changes in particular age cohorts;
Table G.1 shows that over the 44-year period the State's population is predicted to grow by approximately 42 per cent in absolute terms, however it has predicted markedly different outcomes for particular age cohorts;
it is noted that notwithstanding the prediction of significant overall growth of 42 per cent for the overall population, future population levels of persons aged under 19 are predicted to fall in absolute terms;

minor growth is predicted for 20-29 age group (4 per cent overall change over the 44-year period) and modest growth for the 30-39 age group;
however, there are high order changes with major shifts predicted for the older age groups and the 60+ age groups are predicted to by between 100400 per cent in the 44-year period;
it will be noted that of the predicted net increase in the State's population over the 44-year period of 191,300 persons, more than two-thirds will be concentrated in the 60+ population age groups.
In summary,Tasmania's resident population has been growing at approximately one per cent per annum compound over the period 2001-2021.This growth rate is predicted to continue in projections provided by the Centre for Population (Online Public Release, 6 Jan 2023).
The greater Hobart region is predicted to grow by approximately 1.3 per cent per annum compound over the period 2022-2033.
Within this context the projected growth rate of the balance ofTasmania outside the greater Hobart area is approximately 0.72 per cent per annum compound for the period 2022-2033.
Predictions of ongoing major changes in the age structure of the population with significant projections in the ageing of the population form an important context for this study.
Greater Launceston may be characterised as a low-moderate growth regional city;
over the 20-year period 2001-2021, the estimated resident population (ERP) of the greater city grew from approximately 98,500 persons in 2001 to 112,400 persons in 2021, growing at average compound rate of 0.66 per cent per annum (referTablesA.1, and C.6);
population changes in the greater city are characterised by long established differential patterns of growth.Acrescent of higher growth areas extends from the northern urban areas (encompassing areas in WestTamar) through to the developing western suburbs and exurban areas (in Meander Valley) and the growing south western areas (in Northern Midlands);
over the 20-year period to 2021 population growth in these areas averaged approximately one per cent per annum compound with growth rates ranging from 0.88 per cent to 1.18 per cent per annum;
the City of Launceston contains the largest single component of the greater city's population, but has a materially lower level of population growth than the northern, western and south western areas indicated above.
the City of Launceston's population growth rate has averaged approximately 0.48 per cent compound over the 20-year period to 2021.The long-term growth differential between the City of Launceston and the growth areas of WestTamar, Meander Valley and Northern Midlands has resulted in a gradual long-term shift in the geographic distribution of population:
at 2001 Launceston City held approximately 60 per cent of the greater city's population (approximately 59,500 within the greater city's population of 98,500 persons, referTableA.1);
at 2021 the City held approximately 58 per cent of the greater city's population (approximately 65,440 persons within the greater city's population of 112,440 persons);
the urban areas of GeorgeTown comprise part of the greater city area. It has a small component of the metropolitan population (approximately 6 per cent) and a low growth rate (averaging 0.33 per cent per annum over the 20-year period to 2021).

In summary, greater Launceston may be characterised as a lower-moderate growth city. Launceston City is the largest single population component, but comparatively lower differential rates of growth have resulted in marginal shifts in the overall spatial distribution of the resident population over time.

The projection forTasmania's population outside the greater Hobart area of 0.72 per cent per annum compound based on the Centre for Population's recent Public Release (6 Jan 2023) provide an important context for an understanding of greater Launceston's population growth over the 20-year period to 2021.The greater city's growth rate in the post-2000 period (0.66 per cent per annum) is certainly of the same order as has been projected forTasmania outside the greater Hobart area.
The demographic projections for the Centre for Population foreshadow the historic changes in the age-sex structure of the population.There are likely to be major implications for future patterns of living and housing market needs (among a range of other impacts) should these projections be realised.
The Study provided a long-term assessment of patterns of housing approvals over an 18-year period to 2020 (referTable E.1.).
Housing approvals data provided by the municipalities that comprise the greater city of Launceston wasfirstly assessed at theLGAlevel.
Building approvals data for eachLGAis shown for the 18-year period 2003-2020 (inclusive, ReferTable E.1). It will be seen that for thefive municipalities as a whole (Greater LauncestonArea Municipalities orGLAM):
the overall area had a long-term average of 552 dwelling approvals per annum;
within this area each of the component municipalities generated comparatively stable levels of market share (allfigures are approximate and rounded to the nearest whole number).The pattern of residential development over the entire 18-year period was distributed as follows among the component municipalities (referTable E.1, Column 8):
City of Launceston: 199 dwelling approvals per annum (long-term mean); WestTamar: 150 dwelling approvals per annum;
Meander Valley: 95 dwelling approvals per annum; Northern Midlands: 77 dwelling approvals per annum; GeorgeTown: 31 dwelling approvals per annum.
An analysis of housing approvals in the greater LauncestonSSDindicated that approximately 89 per cent of residential approvals were concentrated in the greater City area. Comparable approvals within the greater City over the 18-year period were as follows (ReferTable E.7, Column 2):
City of Launceston (part):190 dwelling approvals per annum; WestTamar (part):146 dwelling approvals per annum; Meander Valley (part):57 dwelling approvals per annum; Northern Midlands (part):69 dwelling approvals per annum; GeorgeTown (part): 29 dwelling approvals per annum.
On this basis, total dwelling approvals for the 20-year period (2001–2021) were estimated as follows (referTable E.7):
City of Launceston (part):3,800; WestTamar (part):2,920; Meander Valley (part):1,140; Northern Midlands (part):1,380; GeorgeTown (part):580. Total LauncestonSSD9,820.
Several important observations may be made in relation to patterns of housing development in the greater LauncestonSSD:
market share patterns throughout the 18-year and 20-year periods examined, indicated a consistent distribution where the western and southwestern growth areas of WestTamar, Meander Valley and Northern Midlands together held approximately 55 per cent of housing approvals in the greater city.
Approximately 39 per cent of the metropolitan housing market was held by the City of Launceston.
The balance of approximately 6 per cent was taken up in GeorgeTown.
It was also the case that the City of Launceston held the largest single component of the greater Launceston housing market.
The Census of Population and Housing undertaken every 5 years by theABS provides a regular inventory of total dwelling stock. Measuring changes in total dwelling stock over time should provide a comparative measure with residential building approvals.
This analysis was undertaken by the Study:
in thefirst step building approvals for greater Launceston were estimated for the 20-year period (2001–2021) based on the data for 2003–2020 (inclusive);
in the second step net changes in total dwelling stock were calculated from Census data for the 2001–2021 period;
finally, a comparative analysis was undertaken for the two sets of data by componentLGA.
This process was undertaken at the totalLGAlevel for the component municipalities of greater Launceston (GLAM) region (ReferTable E.6); and for the greater citySSD(referTable E.7).
The analysis shows that for the greater City as a whole whether measured at the GLAMregional level or at the greater CitySSDlevel, there was a variation between the two methods of measuring housing change relying on different databases of less than two per cent over a 20-year period.
There are some differences of significance between the two methods for particular LGAs, but at the overall regional or metropolitan level the difference is not significant.The comparative assessments add weight to the integrity of both sets of data for analysis of broad housing change over time.
The database enabled afirst assessment of likely future housing and residential land requirements for the greater City over the next 14 years (2023-2036 inclusive).The analysis was undertaken for the greater LauncestonSSDand their component local government areas (LGAs) (referTable F.1).
It will be seen that total housing requirements for the greater City over the 14year period to 2036 together with a minimal allowance of a 7-year rolling reserve10,150 dwellings were assessed at approximatelydistributed as follows (referTable F.1, Column 5):
City of Launceston (part):4,310 dwellings; WestTamar (part):2,940 dwellings; Meander Valley (part):1,200 dwellings; Northern Midlands (part): 1,240 dwellings; GeorgeTown (part): 460 dwellings.

The residential land requirements for the projected housing levels together with an allowance for a 7-year rolling reserve indicated a total requirement of approximatelyfor the greater City for the 14-year period to 8,540 allotments 2036. It will be noted that the allotments are measured as “Equivalent Single Lots”(ESL). The allotment requirements by componentLGAwere comprised as follows (referTable F.1, Column 8):
City of Launceston (part): 3,450 lots (all allotment requirements areESL); WestTamar (part):2,580 lots; Meander Valley (part): 1,050 lots; Northern Midlands (part): 1,090 lots; GeorgeTown (part): 370 lots.
In summary, an assessment of recent patterns of demand in the post-2000 period provided the basis for initial estimates of housing and allotment demand for the greater City over the next 14 years to 2036. C
The issue of land supply beyond the City of Launceston is outside the scope of this Study. It will be appreciated that land supply and availability will be significant in shapingfinal housing outcomes over the next 15-years and beyond.
Adetailed evaluation of residential housing demand and land supply within the City of Launceston was undertaken for the 15-year period to 2036. It will be recalled that a StudyArea (Refer page 22) was defined for this purpose.
Zoned Residential Land Supply: Initial Inventory (March 2022)
Adetailed inventory of residential land supply was provided by the City of Launceston (March 2022).The inventory is showed inTable D.1. It will be noted that:
the residential land supply inventory has been measured in terms of “equivalent single lots”(ESL);
almost all of the vacant allotments were contained in the General Residential Zone (GRZ);
a small proportion of vacant lots were in the Rural Living Zone (less than 8 per cent of all existing and potential lots);
the inventory also identified lots potentially available for development which were classified as“not vacant”(that is partially occupied);
a set of categories were provided to indicate the relative readiness of vacant land for development.The categories were defined as follows:
Category 1 - Broad hectare residentially zoned land which has no approved coordinating plan for future development (including, for example, an approved framework plan, outline development plan or structure plan);
Category 2–Residentially zoned land which is planned and approved for development. Land in this category has a plan of subdivision approved by Council;
Category 3–Residentially zoned land which is sub-divided, serviced and available for development.
The initial inventory undertaken in March 2022 indicated that approximately 2,005 vacant lots were in the General Residential Zone (GRZ).This comprised (refer to above categories):
Category 1: 558 lots;
Category 2: 1,292 lots;
Category 3: 155 lots.
The vacant lots within the General Residential Zone (GRZ) were further assessed by Council in terms of their ownership type (in terms of indicating a propensity for development).Table D.2 shows the vacant allotments for theGRZclassified in terms of the following ownership types:
Land held by:
public housing sector agency/authority;
private sector developers/builders;
private ownership: actively advertised for sale or development;
other private ownership: not publicly listed for sale or development.
The assessment indicated that the overwhelming majority of lots were held by private sector developers or builders (73.4 per cent).Approximately 7.5 per cent were held by public housing agencies or authorities and only 11.0 per cent were not publicly listed for sale or development.
Adetailed inventory, based on data held by Council, was established for residential building approvals by triennial period by district and key suburbs in the StudyArea for the 21-year period (2000-2020 inclusive) (referTable E.3).
The StudyArea contained about 90 per cent of dwelling approvals within the City of Launceston. It will be noted that the inventory revealed important patterns of development across the City's suburbs and districts.
over the 21-year period, 2000–2020 (inclusive), approximately 3,800 building approvals were generated in the StudyArea;
of that number, approximately half of all development in the StudyArea was concentrated in two districts:
Central District (with the important residential suburb of Newstead);
South District (with the key suburbs ofYoungtown and Kings Meadows).
a further 25 per cent of approvals occurred in the North District, and most of these have been focused in the suburb of Newnam;
a significant level of multiple unit developments has occurred in the Study Area. Over 40 per cent of residential building approvals were for multiple units, and several districts and suburbs contained notably higher levels (ReferTable E.3);
infill development which has generated housing on previously“non vacant” land has provided a notable component of the City's housing. It will be noted that over the 18-year period 2000–2017 (inclusive), approximately 26 per cent of all new multiple units in the StudyArea were developed on “non vacant land”(Refer Residential Land Demand SupplyAssessment, October 2018, Renaissance Planning Pty Ltd,Table 6.).This has been restated in this report inTable E.5.
Infill development comprised some 340 dwellings over the 18-year period which represented approximately 10 per cent of dwelling unit approvals in the StudyArea over the 18-year period assessed.
As indicated above residential development in the StudyArea has historically been concentrated in a few areas (referTable E.3):
Newnham in the North district;
Newstead in the Central district;
Youngtown and more recently Kings Meadows in the South district.
These suburbs have collectively served as a mainstay and focus for residential development in the City of Launceston.
They remain attractive areas for new residential development but local land supply will likely be virtually exhausted within the current 5-year period (2022-2026 inclusive).
There are significant land supplies available in other suburbs asTable D.2 shows the distribution of vacant lots in theGRZby suburb and district (at March 2022). It will be noted that almost all the supply (approximately 88 per cent) was concentrated in the North, East and South East districts.
An assessment of demand in these areas indicates that:
demand will likely be consolidated in the North district in areas adjoining Newnham and a steady take up of vacant land in the North district is likely to continue in the foreseeable future;
the East district has a very low level of take up and this is not likely to grow significantly in the foreseeable future. Projections made for the East district have allowed for some growth in residential demand as reflecting the most realistic view;
the South East district, which includes St Leonards and North St Leonards/Waverley, will in the view of this study have a steady growth in residential demand through the medium-term and beyond (next 15 years and following periods).
These areas currently account for approximately 25 per cent of residential approvals in the StudyArea (referTable E.3).
In summary, the available residential land in the StudyArea is highly concentrated in areas with relatively low levels of demand. One of these areas has prospects for demand consolidation and ongoing long-term development (the North district).A second area (South Eastern district) has long-term prospects for residential demand consolidation and growth.
Two of the City's most significant areas for residential development (the Central and South districts) will likely exhaust local allotment supplies within the nextfive years. It is important to remember that these areas have supplied over half of all residential approvals in the StudyArea over more than 20 years.

Infill development has provided a relatively small component of housing approvals in the StudyArea (approximately 10 per cent of all housing approvals). It will continue to contribute to the diversity of housing stock in the City. However, given its limited scope at the present time, it can only provide a limited role in the provision of new housing. In the present circumstances, almost all of the housing requirements for the City will have to be met through the ongoing provision of vacant land stocks.
The current distribution of residential land supply, does not provide an effective basis to cater for the City's ongoing and future residential demands at a sufficient scale to replace the imminent loss of the South and Central districts to the residential supply market.
The strategic planning study by Council indicates that an answer to this dilemma is the proposed South Prospect Framework Plan.This has been assessed in the following section as part of the integrated demand-supply assessment.

On 30 January 2023, the draft report of the Launceston Residential Land Review was emailed to Council. Commentary on the draft report was received from Council on 21 March 2023.
Key issues identified by Council encompassed the following:
deficiencies in the residential land supply table provided by Council (March 2022). In a review undertaken in March 2023, Council determined that the designated“Zoned Residential Land Supply” (March 2022) represented“Nominal Land Supply”and did not represent land readily capable of residential development.
Infrastructure constraints were identified in relation to two significant areas.These infrastructure issues need to be fully resolved before the areas can be developed. The identified areas were:
- the approvedin St Leonards North with a design Cedar Grove estate capacity of approximately 325 allotments (ESL);
- the approvedin Rocherlea with a design capacity Reservoir Road site of approximately 400 lots (ESL).
The decision was taken to update the residential land supply table to March 2023 and to amend the supply so that it fully represented“development-ready” residential land.
This process was undertaken by the consultant in several interrelated steps (refer Table D.3):
in thefirst step, the existing Council inventory of residential land supply as at March 2022 was acknowledged as a base line for the update (refer Column 2);
the residential land not readily capable of development as at March 2023, was identified as indicated above (refer Column 3);
land developed in the period March 2022–March 2023 was identified by the consultant on the basis of residential approvals by Council during the period (refer Column 4);
additional residential land supply approved during the period March 2022–March 2023 was identified (refer Column 5).
The, was estimated current development-ready land supply at March 2023 assessed as follows:
Current Development-Ready Land Supply at March 2023 (referTable D.3, Column 6):
residential land supply in theGRZ(Council inventory, March 2022) = (Column 2);
identified land not readily capable of development (at March 2023)(Column 3);
land developed (March 2022–March 2023) (Column 4); -
additional residential land supply (March 2022–March 2023) (Column 5). +
It will be noted that Launceston City's development-ready residential land supply as at March 2023 was approximately 1,400 lotsESL(referTable D.3, Column 2.)
The consultant has been advised that the previous estimate of timing for the South Prospect potential development date would need to be set back for a period of approximately two years to allow for completion of a detailed conservation study being undertaken for Council and for a management plan to be prepared by the Tasmanian Department of Natural Resources and Environment.
The report is required to identify future residential land requirements for the City of Launceston to 2036 with a 7-year rolling reserve (effectively requiring identification of assessed housing needs to the mid-2040s).
Abroadly-based strategic approach is recommended in order to minimise strategic risk which may involve individual single projects.This broader based strategy will seek to foster the conjoint development of several development areas at the same time or within significant overlapping timeframes.
Fostering several development estates at any one time will likely minimise strategic development risk compared to a highly structured preferential development system, and the highest risk will be where a significant scaled project is accorded clear preference and resources and strategic organisation is held back on other areas.
The recommended approach to achieve ais broadly based residential strategy four-fold:
completion of planning and development-preparation processes for identified future community areas. This encompasses the following projects:
thearea in the North District with a design capacity of Alanvale approximately 450 lotsESLhas been identified by Council as a priority development area.This is reflected in the recommendations and the demand-supply analysis undertaken in the Report;
completion of current conservation and management studies being undertaken for theproject. Review and potential South Prospect amendments to the plan andfinalisation of development process.The South Prospect project currently has a design capacity of approximately 1,600 lotsESL.
co-ordinated infrastructure projects to facilitate approved estate developments.As previously indicated, there are two residential estates that have been approved by Council where development cannot proceed due to identified infrastructure issues. It is recommended that Council adopt a co-ordinating role to address the infrastructure constraints.
The effective“rehabilitation”of the Cedar Grove estate in the North St Leonards area (325 lots) and the Reservoir Road area (the Green Estate) with a design capacity of 400 lots should be viewed as potential development-support initiatives that should be undertaken to facilitate residential land supply.
completion of strategic and development planning for the St Leonards area.
It is recommended that Council review and complete the strategic and development planning undertaken for the St Leonards area. It is anticipated that the plan will provide for approximately 1,000 lotsESL.
support for infill development.
It is recommended that Council develop a multi-faceted program to foster and progress a diversity of infill development opportunities within the established urban area.The Project should include a survey to identify sites and activities that may be no longer required or may be potentially relocated to provide significant opportunities for future community development.
At the present time infill development comprises approximately 10% of new housing development in the City of Launceston.* (refer“Residential Land Demand-SupplyAssessment”, March 2019, prepared for the City of Launceston, Dr JeffWolinski, Renaissance Planning Pty Ltd, referTable 6, page 40).TheTable has been restated in this report (referTable E.5).
An important policy objective is the identification of infill opportunities in the City of Launceston and the development of infill projects.The achievement of this objective via community-based infill development projects would bring a range of benefits to the City and the broader Launceston community including:

reduction of strategic risk in future development projects;
greater efficiencies in infrastructure provisioning and long-term utilisation;
provisioning the City for more effective public transport and pedestrianbased accessibility;
providing a broader range of housing types better suited for the needs of an ageing population.
This Study has found that residential land stocks will be depleted in several districts (the Central, South and West Districts).The Central and West Districts are projected to have their land stocks depleted by 2025 and the South District by 2029.
All three areas have played a major role in the development of the City over an extended period of time.The Central and South Districts in particular, have played a pivotal role in the City's residential development supplying approximately 50 per cent of its residential accommodation requirements.The impending loss of these districts as critical residential supply areas will likely have several important impacts:
an increased urgency for planned new residential areas includingAlanvale, South Prospect and St Leonards;
increased demand for infill housing in established areas.
In summary, major historic changes will likely occur within a relatively short period in the City of Launceston. The loss of the Central and South Districts as major supply areas means that for thefirst time in more than 40 years, the City will need to supply housing without the contribution of two of the three most important residential supply areas in the City.
There is a critical need for a new focus on quality infill housing opportunities as the City enters a new demographic and development phase.
Adetailed residential land demand-supply assessment has been undertaken for Council for the 14-year period 2023-2036 (inclusive).The analysis provides an assessment of the introduction of the proposed South Prospect development together with a broad-base of other housing projects to meet the future needs of the City.The assessment was undertaken in following time periods (all time periods are inclusive of the dates below):
2023-24
2025-26
2027-28
2029-32
2033-36

Astandardised assessment process has been developed for the demand-supply analysis (ReferTables F.3-F.8).An explanation of the structure of the analysis format is set out below with thefirst assessment period (2023-24) taken as an example.
The 2023-24 assessment is shown inTable F.3. It will be noted that:
projected housing demand is shown in Columns 2–4.This is comprised of:
projected infill development (refer Column 2).
Data provided by Council for the Residential Supply-Demand Assessment (March, 2019) has been restated in this Report (refer Table E.5).
The data is drawn from an 18-year time period (2000-17 inclusive) it shows that approximately 26% of multiple units developed within the StudyArea of the City of Launceston during this time period were on “non-vacant land”and represented some form of infill development.
Multiple units represented approximately 40% of new housing development in the StudyArea. On this basis infill development comprised approximately 10% of new housing development.
The data provided the basis for indicative projections of future infill development.
projected housing approvals on identified vacant land stocks (refer Column 3)
this category of housing is the principal source of new housing development in the City of Launceston (essentially new single dwellings and multiple units built on newly developed residential land). the database on which projections have been drawn was established via a 21-year record of building approvals by district and selected suburbs in the StudyArea (ReferTable E.3), and more recent data for 2021 and 2022 (ReferTable E.4). Key statistics relating to housing rates and multiple unit developments are provided in total in F.2.
projected drawdown from identified vacant land stocks (Refer Column 5)
projected housing approvals for 2023 and 2024 are shown in Column 3.These have been converted to estimates of land stocks required, taking account of multiple unit requirements and allowances for higher rates of land occupancy. Thus the estimate of 293 housing approvals for 2023 and 2024 has been assessed to require 206 lots as shown in Column 5. Note that these are measured as 'equivalent single lots' (ESL).
thefinal Columns inTable F.3 (Columns 6-9) track the progressive adjustments to residential allotment supply likely to arise from demand drawdowns or additional allocations to supply. Key components are as follows:
existing residential land supply (at March 2023 is shown in Column 6);
residual land supply (at December 2024 is shown in Column 7). this shows the balance of land supply available at the end of the 202324 period and takes account of existing land supply at March 2023 with deductions for the likely drawdown of available land stocks over the 2year period (shown in Column 5);
recommended additional supply (early 2025 as shown in Column 8). It is recommended that the proposedAlanvale estate with a design capacity of approximately 450 lots be examined and reviewed by Council in 2023 and 2024 and subject to this Review be supported through a rezoning process to enable development to commence in early 2025;
supply balance (early 2025 as shown in Column 9). The projected resultant supply balance early 2025 which takes account of the recommended additional supply and the drawdowns is shown in Column 9.
The standardised format developed inTable F.3 for Period 1 has been further developed for the successive future periods.

The demand projections and demand-supply analyses are set out for the future assessment periods as follows:
2025-26Table F.4
2027-28Table F.5
2029-32Table F.6
2033-36Table F.7
Overall Housing Requirements (2023-36 inclusive)
Over the entire 14-year projection period approximately 3,400 dwellings are likely to be required to meet the ongoing and future housing needs of the City of Launceston (referTable F.8, Column 4). Of this number:
somewill be needed to be developed on 2,950 dwellingsnew housing lots1,620 single (referTable F.8, Column 3) comprised of approximately dwellings and 1,330 multiple units;
in addition, approximatelyare projected 480 dwellingsas infill development in existing urban areas (referTable F.8, Column 2) or approximately 14% of all new housing development.
Land requirements for new housing (2023-36 inclusive)
Taking account of the likely mix of multiple units and estimated levels of infill development, the land requirements for the future housing stock are estimated to be(ESL) over the 14-year period to December 2036 approximately 2,100 lots (referTable F.8 Column 5).
An allowance for a 7-year rolling reserve would require approximately 1,050 lots ESL at projected rates of take up.
Thus, the assessedof residential land requirements for the City of minimum level Launceston for the 14-year period 2023–2036 are approximately 3,150 lots ESLinitial broad assessment of 3,450 .This is of the same order as anlots being required to meet the City's residential needs over the period 2036 (refer Table F.1, Columns 6-8).
In conclusion, the City's current effective supply of residential land (1,400 lots ESL) is well below assessed minimal requirements (in the range 3,150–3,450 lotsESL).
In summary, theover the projected 14-year likely level of land requirements periodfor the substantially exceeds existing development-ready land supply City at March 2023.This was assessed at 1,400 lots (ESL) (referTable F.8 Column 6).Astrategy to address this deficiency has been identified to enable the City to secure viable and effective pathway for its residential development future.
Overall Housing Requirements (2023-36 inclusive)
It is recommended that Council undertake a broadly based residential land development strategy in order to secure the City's required land supply necessary to meet future housing needs and minimise strategic risk in future residential development:
first priority projects: completion of planning and developmentpreparation processes for identified future new residential areas. This encompasses the following projects:
- completion of current conservation and management studies for the South Prospect development project.The project has a design capacity of approximately 1,600 lotsESL;
- support for thedevelopment project in the North District with a Alanvale design capacity for approximately 450 lotsESLis recommended as a priority project.
co-ordinated infrastructure projects to facilitate approved estate development. It is recommended that Council adopt a co-ordinating role to address infrastructure constraints which are preventing two key projects from proceeding.These are:
- theEstate in North St Leonards with a design capacity of Cedar Grove 325 lots;
- theat Reservoir Road in Rocherlea with a design capacity of Green Estate approximately 400 lots.
Completion of strategic and development planning for the St Leonards area.
It is recommended that Council review and complete the strategic and development planning undertaken for the. It is anticipated St Leonards area that the plan will provide for approximately 1,000 lotsESL;
Support for Infill Development.
It is recommended that Council develop a multi-faceted program to foster and progress a diversity of infill development opportunities within the established urban area.
The role of infill housing needs to be progressively expanded over time to form a significant component of new housing development.
The achievement of this objective via community-based infill development projects will bring a range of benefits to the City and the broader Launceston community.
Infill development should be fostered as part of a composite strategy to build a diversity of housing types to meet a wide range of demographic and locational requirement, an address a broad range of city structure contextual situations.
However, it is clear that the key response to the City's future housing needs will need to be drawn in large part from new housing in well planned, environmentally balanced and socially coherent communities. In this context, the need for the recommended land development projects is critical for Launceston's future residential development.These encompass:
- implementation of thedevelopment plan subject to the South Prospect requirements for conservation and management studies underway;
-development project in the North District; Alanvale
- infrastructure support projects aimed at resolving development constraints for two future residential areas atand the Cedar GroveGreen Estate;
- long-term strategy development at St Leonards;
- proposed second stage encompassing approximately 500 lots (ESL) indicatively set for early 2037.
On the basis of the above recommendations and analyses, a positive supply balance of approximately 3,000 lots (ESL) is projected by early 2037 (referTable F.8, Column 8).This will provide a future land reserve for approximately 16 years based on projected rates of land development in the mid-2030s.This will provide a strong basis for future residential planning. By way of example, residential planning for the period 2037–2051 would likely require an allowance for approximately 4,200 lotsESLincluding a 7-year rolling reserve.The legacy of the projected supply balance at 2037 is that a large part of the future required provision for the following planning period will already be in place.
The demand-supply analysis indicates that several districts will have their identified land stocks depleted at various stages over the next 14 years.These comprised the following:
the Central District with available land stocks likely to be depleted by December 2024.
the Prospect area of the South West District with land stocks predicted to be depleted by early 2023.
the West District with land stocks projected to be depleted by December 2026.
the South District with land stocks projected to be depleted by December 2032.
The most significant events will be the loss of the Central and South Districts as areas of significant new housing developments on residential land. Growth is predicted in infill development during this period, but this will occur from a low base.
It is highly likely that in the forecast period to 2036 the loss of the Central, South and West Districts will need to be made up in large part by the contribution of new and rehabilitated residential areas.
In summary, the residential allotments demand-supply assessment for the 15-year period, 2022–2036 (inclusive), has been analysed for the StudyArea.

The projections indicate the likely loss of hitherto two key districts that have been mainstays of residential housing development in the City of Launceston: the Central and South Districts.

These two districts have provided 50 per cent of housing development in the Study Area in thefirst two decades of this century.
Implementation of the envisaged South Prospect Framework Plan is a necessary and fundamental requirement for the effective replacement of the Central and South Districts as major providers for future residential development.
South Prospect is projected to be the main source for new housing in the Study Area. In it’s initial development phases (2029 - 2036) it will provide approximately 37 percent of all new housing in the City and will be the leading district in the City for residential development (referTables F.6, F.7, column 4).
It may be reasonably concluded that South Prospect will play an indispensable role to enable the City of Launceston meet it’s housing requirements.
The study has found that the current level of effective residential land supply (that can be readily accessed for development) is approximately 1,400 lotsESL(refer Table F.8, column 6).This is well below the City’s minimum residential land requirements for the period 2023 -2036 with an allowance for a 7-year rolling reserve (in the range 3,150 - 3,450 lotsESL).
The question may well be asked how the projected housing needs of over 3,000 dwellings in the next 14 years will be met in the absence of the South Prospect project?