


This document represents a key element of the City of Launceston's Strategic Planning Framework. The Long Term Financial Plan sets out Council's objectives, goals, and operating requirements in financial terms.
The provision of the necessary financial resources, in a sustainable and affordable manner, underpins the delivery of quality services to our Community.
The Long Term Financial Plan models the financial needs of the organisation over the medium term against forecast revenue, including reinvestment in our community's assets as set out in the Strategic Asset Management Plan.
The City of Launceston Long Term Financial Plan 2022-2032 (LTFP) is a strategic planning document informed by a series of financial models, strategies and performance indicators, which establish the strategic financial framework within which sound financial decisions will be made.
The LTFP is a framework based on a range of assumptions that assesses the financial requirements to achieve our strategic objectives. It demonstrates the Council’s obligation and commitment to sound financial planning to ensure the future prosperity of the City.
The LTFP does not assume that all desired projects will automatically be funded, particularly those requiring external grant funding. Projects are only included in the LTFP when funding is reasonably assured and committed to by the Council. This establishes a picture of what the Council can currently afford and deliver with reasonable certainty over the forecast period.
The LTFP illustratesthat overall, the Council is ina sound financial position. This is based on strong liquidity and cash reserves, and manageable levels of debt. Council has strong capacity tofund its short term obligations in terms of asset renewal and core operations, as well as consider appropriate future investment opportunities to support the ongoing economicprosperity of our Municipal Area and region.
Revenue growth requirements, averaged across the life of theplan, are forecast tobe belowthe Council CostIndex(CCI) forecasts:
Averageraterevenue growthrequirementsof 3.65%per annum;
CCIforecasttoincreaseby3.50%perannum(averageover10yrs);
CPIforecasttoincreaseby between 3.00% and 3.50% per annum.
Council has a large asset base with a replacement cost in excess of $2.52 billion dollars, and the LTFP in conjunction with the Strategic Asset Management Plan demonstrate that Council has the capacity to fund asset renewal liabilities as they fall due. Our challenge is in managing the additional operational costs arising from new and upgraded assets, both Council and grant funded.
The LTFP considers a comprehensive range of factors that influence the financial sustainability of our organisation, including the ongoing financial impacts of the Covid-19 Pandemic, climate change and sustainability initiatives, and macroeconomic factors that affect not only Council, but all members of our community. Given the likely changing nature of many of these factors, the LTFP is updated annually, and is subject to major review every four years, in line with the electoral cycle. As and when funding is secured for desired projects, the Plan is amended to include the changingcircumstances.
MichaelStretton CHIEFEXECUTIVEOFFICERThe City of Launceston is currently in a solid financial position , despite Covid-19 contributing to underlying deficits in 2019/2020 and 2020/2021, andtheCouncil'spositionis based onstrong liquidityand cash flow, and satisfactory funding provision for asset renewal and investment activities. Recent challenges have included changes in the accounting treatment of assets, dividend restructuring and the cost of operatingregional assets. The Covid-19 Pandemic presented a significant challenge both in an immediate sense and in the medium to long term and Council has now entered into the budget repair stage.
Council debtremains limitedtointerest freeloans.At30June2022,Council had $26.0mof interest free loans.This is comprised of$6.0m for the Paterson Street Central Carpark purchase (due in 2024/25) and $20.0mworthofinterestfreeloansborrowedin2020/21as partoftheLocalGovernmentLoansProgramdevelopedbytheStateGovernmentinresponseto theCovid-19pandemic(duein2023/2024).Councilhasapprovalfor$6.0mborrowingin 2022/23andatthedateofreviewofthisLTFPitisCouncil'sintentiontodrawdownonthis funding.
This revision of the LTFP makes certain assumptions regarding the ongoing financial impact of the Covid-19 pandemic and delivers a pathway to underlying operating surplus in the medium term - that is, by 2025/26.
Council has managed a litany of financial challenges and shocks in recent years, including;
Covid-19 Community Care and Recovery package of $10m approved by Council in April 2020, which included a decision to freeze rates in 2020/2021 which led to a revenue shortfall of $2.2m that is compounded annually.
TasWater dividend reduction of $1.36m per annum
TasWater additional charges for the arbitrated agreement over the Combined Drainage System averaging $1.432m per annum from 2016/2017 to 2021/2022, a total of $8.597m during that time.
Increased depreciation costs due to escalating construction costs and revaluation of existing assets of approximately $1.5m - $2m per annum
Decrease in Interest Revenue of $1.5m per annum between 2018/2019 - 2021/2022 due to the low Official Cash Rate
Loss of Launceston Airport dividend of $1.4m during Covid-19 pandemic
Reduced TasWater dividend of $2.7m during Covid-19 pandemic
Introduction of Food Organics Garden Organics (FOGO) service at a cost of $0.78m per annum without, initially, a charge to users for the first four years.
Court decision to prevent to rating of retirement villages $0.8m per annum
Changes in accounting standards requiring Masterplans to be categorised as operational expenditure $0.4m - $0.5m per annum.
Insurance costs have increased by 34% since 2016/17 $0.32m, while workers compensation premiums have increased by 148% since 2016/17 $0.3m
Riverbend Park Operational costs - $0.25m per year
CapitalGrants& Contributions,$1,621Investment&Interest Revenue,$5,237
Future revenue assumptions across the life of the LTFP have been detailed in Table 2 and Table 4.

Several major capital projects, including the construction of the Riverbend Park Precinct, the redevelopment of both Macquarie House and Civic Square and the Brisbane Street Mall, have associated ongoing operational and maintenance costs which Council is required to fund. Although these projects have been primarily funded through the assistance ofFederalandStategrants,theongoing operationalandmaintenancecostsare the responsibilityof Council to fund annually.
For the last ten years rate increases have been below the Council Cost Index (CCI) published by the Local Government Association of Tasmania (LGAT). Council has managed internal costs to maintain rate increases below CCI, butthis is notan appropriate long term strategy if applied in isolation. Reviewing our Levels of Service is key. The shortfall in CCI and actual rate increases since 2013/14 equates to over $0.635m annually.
CouncilExpenditure(2022/23Budget) $'000

Utilities,$2,873
Remissions,$277TERHAP Contribution, $3,700
Fire&WasteLevies, $10,495
AssetDisposal,$400
Depreciation,$25,043
OtherCosts,$350
Council faces several significant operating pressures into the near future. Commitments to various major Capital projects, the Launceston City Deal, the Northern Suburbs revitalisation, Tamar Estuary River Health Action Plan, changes to the financial distributions received from TasWater and fluctuating Consumer Price and Council Cost Indices will make maintaining an underlying surplus a challenge.

Within the Local Government sector in Australia, there is not a universally accepted definition (or set of metrics) that specify what financial sustainability is. Asa public service entity with the core responsibility of serving our community over the long-term, achieving intergenerational equity should be the ultimate measure of financial sustainability. It should notbe left forone generation to"paytheway" for another.
While this outcome is difficult to quantify at any point in time, adopting an underlying mindset that Council should provide quality and efficient service delivery to the community both now and into the future, while ensuring that each generation is responsible for the cost of services and resources they consume, provides the foundation to achieve this long-termoutcome.
The Local Government Sustainability Objectives and Indicators report presented by the Department of Premier and Cabinet (DPac) prescribes seven indicators thatcan be used to measure financial sustainability. Council reports its performance against these indicators in its Annual Report, and has adopted these as the principle indicators for the purposes of measuring our financial sustainability intheLTFP:
UnderlyingSurplusorDeficit
Underlying SurplusRatio
NetFinancialLiabilities
NetFinancialLiabilitiesRatio
AssetConsumptionRatio
Asset Renewal FundingRatio
Asset SustainabilityRatio
Adopted benchmarks have been based on a combination of Council's desired outcomes and guidelines provided by DPac.
The recurrent income (not including income received specifically for new or upgraded assets, physical resources received free of charge or other income of a capital nature) of Council for the financial year less the recurrent expenses of Council for the financial year.
Serves as an overall measure of financial operating effectiveness.
Underlying Surplus Ratio
The underlying surplus or deficit divided by the recurrent income (not including income received specifically for new or upgraded assets, physical resources received free of charge or other income of a capital nature) for the financial year.
Serves as an overall measure of financial operating effectiveness.
Liquid financial assets (cash and cash equivalents plus trade and other receivables plus other financial assets) less total liabilities.
Indicates what is owed to others less money held, invested or owed to Council.
Net financial liabilities divided by recurrent income.
Indicates the extent to which net financial liabilities could be metby operating income.
Asset Consumption Ratio
The depreciated replacement cost of plant, equipment and infrastructure assets divided by the current replacement cost of depreciable assets. Indicates the level of remaining service potential in the Council's existingasset base.
Asset Renewal Funding Ratio
The current value of projected capital funding outlays for an asset class identified in the long-term financial plan divided by the value of projected capital expenditure funding for an asset class identified in the long-term strategic asset management plan of Council.
Indicates the Council's asset renewal and replacement performance.
90% to 100% 100%
Asset Sustainability Ratio
The amount of capital expenditure by Council in a financial year on the replacement and renewal of existing assets divided by Council's annual depreciation expense for the financial year.
Indicates Council's capacity to fund future asset replacement requirements.
DebtService Ratio
Total Principal repayments and interest expense divided by operating revenue (excl. Capital Grants).
Indicates the amount ofrecurrent income that is used to repay debt and interest charges.
to 20% 0.49%
This LTFP sets out CoL's strategy to deliver our organisational plans and objectives in financial terms. The first comprehensive LTFP was produced as part of an integrated approach to defining our organisational resource capacity and needs, and is reliant on data from its partner document, the SAMP.
This analysis, and tools created in developing this plan, will be used to guide the CoL on its journey towards better service provision to our community, and long term financial sustainability. Financial planning and management is one of the many factors influencing strategic planning at the CoL, as shown in Figure 3.
There are many spheres of influence - near and far. The CoL recognises its role as a key stakeholder, along with the other Local Government municipalities, in greater Launceston and the wider northern Tasmania region and as such recognise that their success is our success and vice versa. Working together as a Council, a city and a region is fundamental to a sustainable future for all of our communities.
The Long Term Financial Plan along with the Strategic Asset Management Plan and the (proposed) Corporate Resourcing Plan become major iterative influences in terms of inputs to and outputs of the central corporate planning document, the Corporate Strategic Plan.
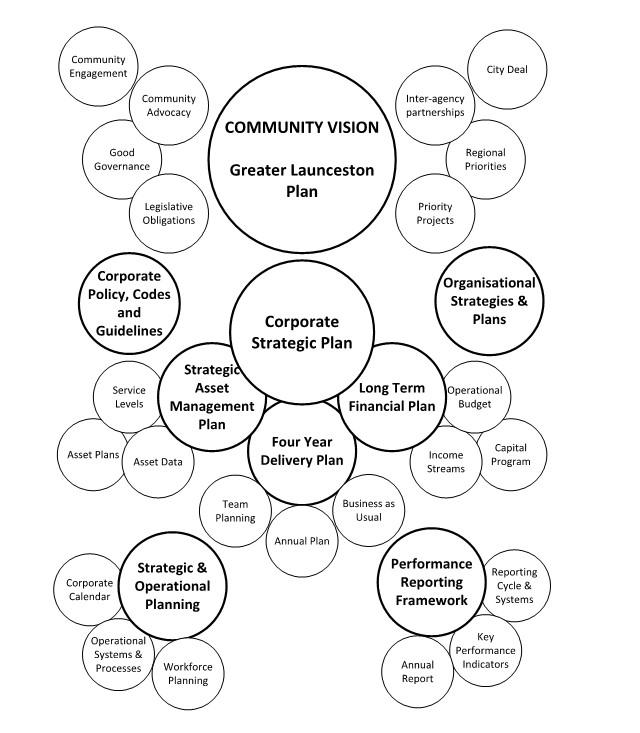
Figure 4 shows the hierarchy that becomes the framework for the CoL's strategic planning through to service delivery activities and operations. The framework demonstrates the clear alignment towards achievement of corporate objectives from the Community Vision through the Corporate Strategic Plan down to activity planning and individual job planning. Note that not all of the below elements have been enacted, but form part of the broader framework. This is factored into the Improvement Plan.
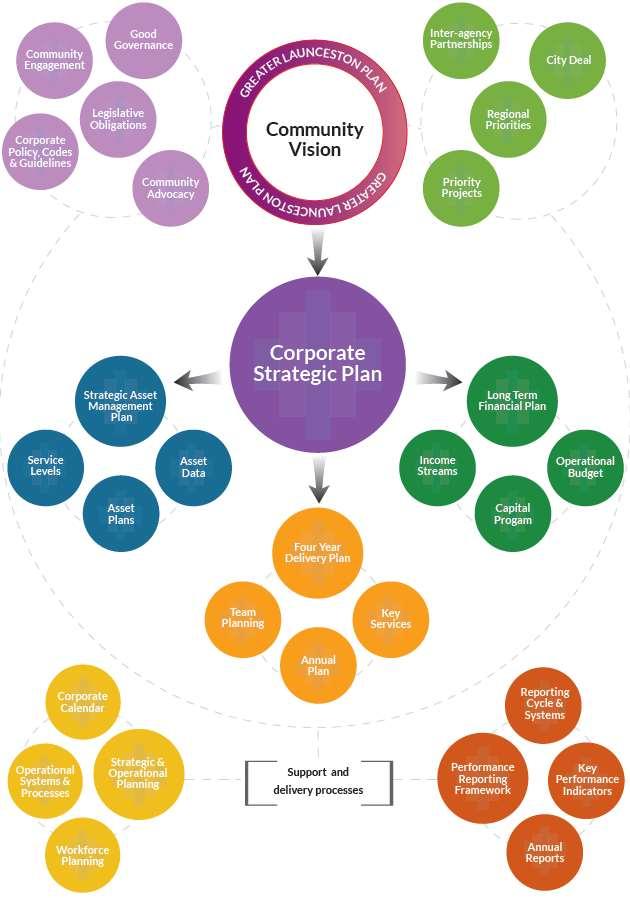
The Resource and Capacity Planning layer demonstrates the interaction of the strategic assetmanagementand long term financialplanstounderstandthe"what,whenand how much" ofassets need resourcing and the organisation's ability to fund the services into a 10 year forwardhorizon.
The framework would not function without the inputs and outputs to and from supporting systems which are identified as "Organisational Enablers". Enablers include Community Engagement, Risk Management, Information Management and Financial Management systems.
Our LTFP is an overarching document, supported by our Financial Management Strategy, organisational policies, operational systems and processes that form the basis of our financial management system.
The CoL primary purpose is to serve our community. When providing services, it is guided by performance reporting and feedback from the stakeholders whether they are fee paying or not. All CoL activities are underpinned by philosophies of stakeholder and community engagement, consultation and continuous improvement.
CoL operates within a broad framework of Acts, regulations and orders.
The principal legislation that prescribes our powers and functions is the Local Government Act 1993 (Tas). This Act establishes us as a corporate body, and obligates us to:
providefor thehealth, safety and welfare ofthe community;
to represent the interests ofthe community; and
to provide forthe peace,orderand good government ofthe municipal area.
We demonstrate a commitment to these roles in our day to day activities, guided by our strategic plan, long-term financial management plan, financial management strategy, long- term strategic asset management plan, and asset management policy and strategy.
Section 70 of the Local Government Act 1993 (Tas) requires CoL to prepare a long-term financial management plan for the municipal area. At CoL, we call this document our Long Term Financial Plan (LTFP).
Amongst other things, our Long Term Financial Plan estimates the future operating revenues and expenses associated with operating requirements, capital expenditure and asset management renewal, in support of the deliverables in the organisations Strategic Plan.
It also provides a mechanism for CoL to deliver asset renewal requirements as determined in the Strategic Asset Management Plan, by making provision for the estimated costs associated with our management of the assets that are considered in that plan.
The LTFP reflects in financial terms how Council proposes to deliver on its intended objectives, goals and desired outcomes for the next 10 years. Fundamentally, the goal of the LTFP is to ensure City of Launceston remains a financially sustainable organisation.
The LTFP forms a key part of Council's strategic planning framework. In concert with the SAMP (and proposed Corporate Resourcing Plan) it forms the basis of Council's resource and capacity planning tools to inform our decision making processes. It provides a "point in time" indication of Council's financial sustainability, along with facilitating early identification of financial challenges and the impacts of decisions taken, and enhances the transparency and accountability of the Council to the community.
The LTFP has been formulated within the parameters of Council'sFinancialManagement Strategy.
In addition to outlining the adopted financial model, a range of scenario analysis has been completed to assist with understanding the potential implications of future decisions and external factors, and a suite of tools developed to assist with identifying the financial implications of organisational decisions moving forward.
The LTFP Financial Model has been formulated based on a range of assumptions in order to establish a baseline data set to facilitate discussion and review of the overall LTFP content, and our organisational capacity to deliver services to our community.
The primary underlying assumptions contained in the adopted LTFP Scenario are summarised below:
1) ConsumerPriceIndex(CPI)beingsetat between3.00% - 3.50%across thelifeof thePlan,this willbe reviewed annually.
a) Hobart CPI to June 2022 showed a 6.50% increase from June 2021.
b) The Reserve Bank of Australia (RBA) has stated that its target inflation rate is between 2 - 3 percent beyond 2024.
2) Council Cost Index (CCI)is forecast to exceed CPIthroughout the Plan.
a) CCI for 2021/22 is 4.06%. This figure was provided by LGAT in March 2022.
b) This is due to key inputs into CCI such as construction and specific Local Government sector material cost increases. This assumption is supported by recent historical trenddata.
c) Historical trend analysis indicates that CCI exceeds CPI. This is expected to continue throughout the life ofthe plan.
3) The adopted Depreciation Expense used in the current model is set to increase by 3.5% annually.
a)ThisrecognisesthatCouncilconductsregularrevaluationsofmajorassetclasses, theconstructionofnewassetsduringtheCapitalWorksprogramandthe identificationofnewlyfoundassetsaddingtotheoverallreplacementcostofthe depreciableassetbase.
b)Thecostofinputsintobuiltassetshasincreasedsignificantlyinrecentyears, whichtheincreaseof3.5%perannumisindicativeof.
c)Theadditionaloperational,maintenanceanddepreciationcostsbasedon Council'sSAMPareincludedasaseparateexpenseiteminthefinancial modellingtohighlighttheaddedcost.
4) Financial Assistance Grants funding to increase slightly below CPI only (no major increase to FAG funding has been incorporated) in order to be conservative and acknowledge the difficulty in obtaining increased FAG funding.
a) Council is currently advocating for a greater share of funding given our role as a regional hub and the associated cost of owning and operating facilities involved in such a role. This willbemonitored through the life ofthe Plan.
b) It is noted that increases in FAGs at the currently forecast levels have notbeen achievable in recenthistory.
c) Modelling does not include an increase in QVMAG operating grants other than for indexation. Council previously petitioned for an increased share of funding for regional assets but was unsuccessful in arguing for the State Grants Commission to change the distribution model. The QVMAG Future Directions Plan has been endorsed by Council and provides a roadmap to a new governance structure and more sustainable funding model, which future iterations of the LTFP will include.
5) Distributions received from TasWater are included as revenue.
a) Dividends from TasWater are budgeted at $3.268m until 2026/27, an increase on the usual dividend paid of $2.724m. This is due to dividends not paid by TasWater to Councils during the Covid-19 pandemic and TasWater's commitment to repay this shortfall over five years.
b) Council's ongoing contribution to Combined Drainage renewal works is included in the LTFP model however, there is ongoing engagement with TasWater on this matter to ensure the forecast contributionlevelsare robust and reliable.
6) Dividends from Council's ownership in Launceston Airport are expected to return to pre Covid-19 levels during the life of the plan, with a modest dividend of $0.3m budgeted for in 2022/23.
7) Theoverallratebaseisexpectedtoincreasebyanaverageof0.75% to 1.00% annually throughgrowthand development inthemunicipality.
a) This position is in line with recent trends, and supported by long- term historicalaverages.
b) It is likely that growth projections will form a significant part of future scenario modelling,particularly with significantdevelopment projects(suchas the South Prospect andSt Leonardsresidentialgrowthproposals).
8) An organisationEfficiency Dividend on materials and services has been included as a budget-savings measure. It is in envisioned that in conjunction with the LEAN Program, this willsee Materials& Servicesincrease at a rate belowCCI.
9) Council's contribution to the Tamar Estuary River Health Action Plan has been included in both 2022/23 ($3.7m), 2023/24 ($5.5m) and 2024/25 ($1.8m)
The assumptions in the adopted financial model have been based on best available information, professional judgement and experience, and developed in discussions with Council officers. The rate increase requirements used in the financial model are based on achieving a balanced operating result or small underlying surplus, from 2025/26 onwards.
Rate increases to achieve a small underlying surplus were calculated after all other assumptions and information was entered into the financial model, including the adoption of a balanced capital works program (see Table 7). Projected financial statements, which include the adopted capital works program and all other assumptions, have been included in this document from items 10 through to 12.
The Table below summarises the Indexation factors that have been adopted in developing the initial LTFP model:
The Table below summarises the revenue inputs that have been adopted in developing the 10yr LTFP model:
Note that the balance of total revenue is made of Capital Grants.
The Table below summarises the assumptions that have been adopted in the 10yr LTFP model, including data on the relevant proportion of each expense section to the overall total.
The City of Launceston Enterprise Agreement 2021 stipulates the below increases from 2021/2022 until 2024/2025, at which point a new agreement will be negotiated.
The Strategic Asset Management Plan sets out the proposed 10 year capital works program which has been adopted as a principle input into the LTFP.
Table 7 below sets out the proposed capital works program by expenditure type and includes both Council and grant funded projects. It needs to be noted that while a detailed program has been prepared as part of the SAMP development process, the
inputs into the LTFP are only concerned with the quantum of funding forecast across each expenditure type; new, upgrade or renewal. Individual capital projects will continue to be assessed for approval annually during Council's capital budgeting process.
Total Capital Program figure includes Externally Funded Projects noted in the table below
Council has committed to $20m of self-funded capital works annually across the life of the LTFP, in addition to externally funded capital projects. Council has a significant list of carried forward capital works projects budgeted for as at 30 June 2022 of $48.4m (includes externally funded projects). Notable in this list of carried forward projects is the Albert Hall Renewal Project ($11.5m), Tennis Centre Upgrade ($3.1m) and Churchill Park & Birch Avenue Facilities Upgrade ($4.25m). A more restrained capital budget will allow for this list of carried forward projects to be addressed, with a focus primarily on the renewal of existing assets.
Not all proposed capital projects have been included in Table 7. Council has a list of Holding Projects that are not in a position to be approved for inclusion in the SAMP or LTFP. This list will be reviewed at least annually in accordance with the LTFP and SAMP.
The forecast Capital Works expenditure (both Council and external funding contributions) has been used to model the additional operational and maintenance costs and additional depreciation expense associated with each new and upgrade project. These additional costs have been included in the adopted financial model.
It should be noted that the Annual Depreciation Charge decreases in 2023/2024 due to the transfer of UTAS Stadium to the new governance arrangement.
Table 8 shows the budgeted depreciation by the major asset classes. Detailed annual depreciation budgets are prepared for each asset class.
The table included in Section 14 details the useful lives applied to each asset group. Along with underlying asset valuation data, the useful life is used to calculate the annual depreciation expense on assets, and used in conjunction with the SAMP. Asset lives are consistent with Council's Asset Capitalisation Framework which is reviewed annually.
In addition to the primary assumptions underpinning the LTFP Financial Model outlined in section 7.1, an additional range of assumptions also inform the plan. These are summarised below:
1) Existingmunicipal boundariesremain unchanged,with nosignificant change to underlying rate or asset base.
a) Although there is current active discussion of amalgamation/boundary adjustment in the Local Government Sector generally, no change has been factored into the current LTFPmodel.
2) Levelsofservice will bemaintained atexisting levels.
a) The LTFP and the aligned SAMP process identify Level of Service Planning as a key improvement action for the organisation to undertake. While adjustment to levels of service and rationalisation is hoped to be achieved via this process, no change has been factored intothe current LTFP model.
3) The adopted budget for 2022/23 has been included in the Plan.
4) IndexationFactors will be reviewed annually as the Planand accompanyingmodel are updated.
a) Historical trends, and likely future projections have been analysed in setting the current indexationfactors, asdiscussed later inthis report.
5) Overallstaffing levelsacross the organisationremain constant.
6) There may be future FTE changes across Networks and/or Teams however; there
is no current forecast data available organisationally to justify a significant change from the projection adopted for this version of the LTFP model.
7) Employee costs will increase as listed in Table 6
a) As each new Enterprise Agreement is approved, this will be updated in future versions of the LTFP and factored in. Beyond the scope of the current Enterprise Agreement, which expires in 2024/25, CPI has been used as the basis to calculate the annual increase in employee costs.
b)TherecommendedimplementationofaWorkforce/CorporateResourcingPlan (positionedalongsidetheLTFPandSAMPasourprincipalResource&Capacity Planningtools)wouldprovidehighlevelforecastingofworkforceplanningandcost modellingintothefuture.
c) Given the proportionallysignificant impact (currently budgetedat 40%) of employee costs on the overall organisational expenses, these items should be subject to specific analysisand scenariomodellingmovingforward.
d) Within the Local Government sector, the percentage of employee costs onoverall organisationexpenses islowerthantheaverageofallTasmanianCouncilsper2020/2021 annualreportdata.
8) Utilitiesexpenses havebeenmodelled onmarketprojections.
a)GiventhevolatilityinvolvedintheenergymarketpricingacrosstheNational EnergyMarket(NEM),thisexpensecategorywillbereviewedindetailduringeach iterationoftheLTFP.
b) The Australian Energy Market Operator (AEMO) publishes energy market price forecasting across the NEM, and is currently suggesting national energy pricing will fallslightlybelow underlying inflation figures.
c)Itisexpectedthatfuturescenariomodellingcouldincludetargetsforenergy reductioninitiativesataCouncil-widelevel.
d)In2021CoLcompletedtheLauncestonAquaticCentreEnergyproject whichinvolvedconvertingtheheatingsystemfromgastoelectricity whichwillsignificantlyreducedenergycostsaswellassignificantly reducingtheCouncil'scarbonfootprint.
e) It isnoted that utilitiescosts representapproximately 2%of thetotal organisational expense.
9) Fire Service Levy hasbeen indexed at 4.0% forthelife ofthe plan.
a) This will be reviewed annually based on updates provided by the State Fire Commission. Council acts as a collection agent for this levy, which is then paid to the State Fire Commission. Council receives a 4% commission for the collection of this levy.
b) It is noted that other Councils have adopted a significantly higher forecast percentage increase in the Fire Service Levy.
10) Under the newState GovernmentWaste and Resource Recovery Act 2022 a charge of $20 per tonne must be collected by Councilfor any waste disposed to Council operated landfill facilities. Council recoups the vast majority of thisfrom theuser, via either an offset amount per property collected through rates,or fees charged at the LauncestonWaste Centre. The charge is expected to increase to $40 per tonne after two years and then after afurther two years to $60 per tonne. For modelling purposes in the LTFP, an annual increase in line with the FireService Levy is included. Updates will be made in future versions of the LTFP when the timing of increases per tonne areconfirmed.
CITYOFLAUNCESTONLongTermFinancialPlan2022-3222
The purpose of scenario modelling is to demonstrate the robustness of the adopted financial model, and the effect on CoL's financial position should there be a deviation to the assumptions made in the adopted model. Given the range of inputs to the model, some variation to the adopted inputs is inevitable, however, ensuring the LTFP is reviewed on an annual basis will enable currency of input forecasts.
The change in the tables below represents the modified assumptions used for each revenue or expense item. The assumptions used in the adopted model have been outlined in Section 5 of this plan.
The movement is calculated annualising average increase or decrease across the life of the LTFP.
Change in Rates, Fees & Charges relates to the underlying growth or decline, as opposed to an increase in the cost of rates or services charges.


Figure 5 below represents the adopted financial model (blue line) plotted against the Optimistic and Pessimistic scenario factors detailed in Table 9 and Table 10 above, and the potential cumulative impact across the 10 years of the LTFP - should no action be taken to correct and adjust the underlying financial model as changes materialise.
While the early years of this scenario projection represent a manageable variation in either direction of the adopted model, sustained variation without adjustments result in significant cumulative variations from the target operating result. This underlines the necessity to undertake an annual review of the LTFP as part of the budget preparation and consideration process.
In developing the LTFP, published financial data from the 2020/21 Annual Reports of the Council areas listed in Table 11 below has been compiled to facilitate benchmarking analysis.
Council RelevanceasaComparator
CityofHobart
CityofDevonport
CityofBurnie
CityofClarence
CityofMaitland(NSW)
CityofMaribyrnong(Vic)
CityofDarwin(NT)
Similarpopulationbase.Bestlocalcomparatorforoverall revenue&expensevalues.Similarstructuralhierarchyas CoL,beingurbancentreoflocalarea.
State-basedurbancouncilcomparator.Somesimilaritiesto CoLasstructuralcentreofabroaderregion.
State-basedurbancouncilcomparator.Somesimilaritiesto CoLasstructuralcentreofabroaderregion.
Similarpopulation-base.Similarurban/ruralCouncilarea make-upandsignificantlylessdepreciableassetvalue.
ConsistentoverallcomparatorwithCoL.Similarcouncilareamakeup(urbanandruralareas).Somesimilaritiesto CoLasstructuralcentreofabroaderregion.
ConsistentoverallcomparatorwithCoL.Population, financialmetricsandsignificantlylessdepreciableasset value.
ConsistentoverallcomparatorwithCoL.Populationand financialmetrics.SimilarstructuralhierarchyasCoL,being urbancentreoflocalarea,althoughalargenumberof communityassetsownedbyTerritoryAdministration.
Detailed financial data for each Council noted above is included in Section 15 of the LTFP.
The compiled financial data facilitated the calculation of a range of metrics against which the relative performance of the City of Launceston has been considered. Updating of this benchmarking data as part of the annual review of the LTFP is an important exercise to inform future versions of the LTFP, and ensure Council's overall performance (in a financial sense) is considered with respect to the broader Tasmanian and interstatebased Local Government sector.
Overall, the benchmarking data reflects favourably on CoL's financial performance. A number of key metrics require monitoring in future versions of the LTFP, and some opportunities for reconsideration of the relative balance of some other revenue and expense factors has also been identified. Table 12 sets out the key metrics identified for specific monitoring in future versions of the LTFP.
Note that the below benchmarks have been used internally as measures of performance, separate to those prescribed by DPac in Table 1.
BelowthefiveselectedTasmaniancomparatorcouncil average,andsignificantlybelowsomecomparators (CityofClarence),indicatinga morediversifiedrevenuebase.
SlightlyhigherthanthefiveselectedTasmanian comparatorcouncilaverage,andsignificantlybelow somecomparators(CityofHobart).Growthoffee-based (or"userpays")revenuemaybeaconsiderationforfuture versionsoftheLTFP,enablingreductioninotherrevenue areas,suchasratingrevenue.
Aholisticreviewoffeesandchargesisrecommendedas animprovementactioninthisversionoftheLTFP.
HigherthantheaverageofthefiveselectedTasmanian comparatorCouncils.Belowoneoftheinterstate comparatorcouncils.
AdditionaloperationalfundingsupportfortheQVMAG operationsisdesired,inrecognitionoftheregional serviceprovisionofferedbythisCouncil-owned institution.Anyrelativeincreaseinoperationalgrant fundingmayalsofacilitatereductioninotherrevenue areas,suchasratingrevenue.
LowerthanthefiveselectedTasmaniancomparator councils.
SignificantlybelowmostcomparatorCouncils.This indicatesaneedtoreviewrateswhichhavehistorically beenbelowCCI.
SignificantlybelowmostcomparatorCouncils.This indicatesaneedtoreviewrateswhichhavehistorically beenbelowCCI.
Slightlylowerthanthestate-basedaveragebutequalto thefiveselectedTasmaniancomparatorcouncilaverage. Representationalofemployee-intensivenatureofcore serviceprovision,includingprovisionofsomesignificant regionalleisureandrecreationservices.Inthiscontext, employeenumbersbenchmarkfavourably.
On-parwiththefiveselectedTasmaniancomparator councilaverageand0.3%lowerthanthestatebased average.Asperitemabove,thisfigurebenchmarks favourablygiventherelativeserviceprovisionofferedon aregionalbasis.
The LTFP adopts a range of assumptions to develop the 10 year financial forecast. There are various external factors over which Council has no control over that have the potential to have a major impact on future financial projections. To mitigate the risk associated with these assumptions, the LTFP will be reviewed and updated annually, before being presented to Council for adoption.
A more detailed risk assessment has also been prepared in accordance with Council's Corporate Risk Management Framework, and is included in Section 8.6. The commentary below provides an overview of risks associated with key LTFP inputs.
Salary and wage increases will be in line with the Enterprise Agreement 2021, noted in Table 6. Beyond 2024/25, a new Enterprise Agreement is due to be negotiated. For modelling purposes beyond 2024/25, CPI + 0.5% has been used to calculate employee costs. Given wages and salaries comprise 40% of Council's total budgeted expenses; any increase in excess of this will have a significant effect on Council's ability to achieve an underlying surplus.
The LTFP model relies on a number of forecasting measures and assumptions. Any major discrepancy with the below price indices will impact future modelling projections. This risk is mitigated by the fact that the LTFP is updated annually and indices will be changed in line with the annual update.
CPI is a key measure of household inflation published quarterly to reflect the movement in prices on a wide range of goods and services. Annual Hobart CPI to June 2022 was 6.50%
CPI has been extremely volatile due to a variety of macroeconomic factors in recent years, with various revenue and expense items in the LTFP being modelled on CPI, there is a degree of risk associated with this.
Should CPI increase significantly, employee entitlements may increase in line with this. The final year (2024/25) of the current Enterprise Agreement has an increase of 3.50% or CPI, whichever is greater.
For modelling purposes, CPI has been projected to be 3.50% until 2024/25 then 3.00% which is line with RBA forecasts of between 2 and 3 percent after 2024.
The Local Government Association of Tasmania (LGAT) publishes an annual index, which reflects cost increases directly associated to services provided by and the cost of running Local Government. This index recognises that CPI does not fully encapsulate cost increases in the Local Government sector. CCI was 4.06% for 2021/22.
Council primarily uses electricity as its main source of power (96% on a cost basis) as opposed to gas. The Launceston Aquatic Centre renewable energy project completed in 2021 drastically reduced Council's reliance on gas, which is volatile in price but also lessens Council's carbon footprint, in line with our Sustainability Strategy.
Council continues to reduce energy usage through the use of new technology and a new electricity contract was negotiated in early 2020 that locks in favourable prices until December 2024.
Financial Distributions from the Tasmanian Water Corporation (TasWater) contribute approximately 3% of Council's budgeted revenue. In 2019/20 and 2020/21 a 50% dividend distribution was received due to Covid-19 impacts. TasWater have indicated they will repay the reduced dividend over the course of the next five years, this has been reflected in the LTFP. Should these dividends not be received, there will be an adverse effect on Council's financial results.
Significant capital expenditure is required to upgrade and maintain existing stormwater infrastructure to meet community expectations. Council relies on TasWater to provide a future 10 year Capital Works program as an input into the LTFP. Any inaccuracies in the figures provided will impact on future financial forecasts.
Council is exposed to the risk that damage will occur to infrastructure such as roads, bridges, stormwater, parks and buildings through events such as the 2016 floods, natural disasters, acts of vandalism, and acts of terrorism. Such damage requires the redirection of capital and/or operational budgets, changes to levels of service and increased insurance premiums.
When an asset is disposed of before the full term of its useful life, unless consideration is received, there will be a loss on disposal recorded as the asset will not be fully depreciated.
The 2019 redevelopment of Civic Square is one such project that resulted in a loss on disposal, given several assets in the area were not fully depreciated before being disposed of (renewed).
Council will consider the impact of loss on disposal of existing assets, in conjunction with the SAMP, in the planning process for capital projects. The risk can be mitigated by accelerating the depreciation of any identified affected assets.
Additionally, to mitigate this risk an annual provision of $500,000 for losses on disposal of assets has been made in the financial modelling from 2023/24 onwards.
Financial Assistance Grants and operating grants have been indexed to increase slightly under CPI, at 2.50% in line with historical trends. There is inherent uncertainty regarding the distribution of grant funding due to a number of factors. To mitigate this uncertainty, budgeted grant funding will be updated annually for use in the LTFP.
Council continues to lobby for a greater share of funding to reflect our role as a regional hub and the associated cost of owning and operating facilities involved in such a role. This will be monitored through the life of the Plan.
Long term capital grant funding forecasts have been sourced from the SAMP. Each year capital grant funding will be updated based on the proposed capital works program for the following year.
Council continues to face challenges relating to the Covid-19 pandemic both economically, from a workforce perspective and how we continue to support our community.
Council's nation leading Community Care & Recovery Package, approved in April 2020, included the provision of rate remissions, rent and fee relief, community grants program and the freezing of all rate increases for 2020/21. Council elected to freeze rates in 2020/21 as part of the $8.7m Community Care and Recovery Package in response to the Covid-19 pandemic, after an initial proposal to increase rates by 3.9%. This resulted in lost revenue in excess of $2.2m in the 2020/21 year. This lost revenue compounds
annually given it was a true freeze, not an increase and subsequent remission of rates.
Staffing levels and as a result service delivery continues to be impacted Covid-19 affected absences. This has been able to be negated to a degree by Council improving its technical literacy and working remotely has become more commonplace for many staff.
The transition of the University of Tasmania Stadium to the Tasmanian Government is expected to be finalised in 2022/23, this is reflected in the annual budget and modelled accordingly in the LTFP. The annual savings are budgeted to be approximately $3.5m annually from 2023/2024, with 50% of this saving budgeted in 2022/2023. The relevant budget lines have been adjusted to reflect the ongoing savings to Council.
No provision for a reduction in operating costs or any additional grant funding for the QVMAG is included in the LTFP, however Council continues to advocate for this, and the endorsed QVMAG Future Directions Plan provides a path to a new governance structure and more sustainable funding model.
The pathway to operating surplus post Covid-19 is deliverable if assumed and modelled rate increases detailed in this revision of the LTFP are met. Deviation from assumptions in the LTFP would require consideration of the flow on impacts of those deviations.
There are a number of Council adopted/supported strategies which are not fully costed and therefore have not been included in the financial modelling. As this financial information becomes available, future versions of the LTFP will updated to include this. These strategies include, but may not be limited to, Greening of Launceston, support of Art in Public Spaces in line with the Cultural Strategy, Sustainability Strategy, QVMAG Futures Plan and the Tamar Estuary Management Taskforce
The CoL has reviewed its Risk Management Framework to provide contemporary foundations and organisational arrangements for effectively and efficiently managed risk across what is a diverse business.
Council is committed to implementing a strategic, consistent and structured corporatewide approach to risk management in order to achieve an appropriate balance between realising opportunities for gains and minimising losses. Council’s commitment to managing risk within its operations and ensuring that Council makes informed decisions with respect to the activities that it undertakes by appropriately considering both risks and opportunities is outlined in the Risk Management Policy 30-Pl-004.
The risk management process is:
integraltoeffective organisational management and decisionmaking, allowsthe CoLtomake risk informed decisions, embedded in the cultureand the everydaypractices of the CoL,and tailored tothe businessprocessesof the CoL.
The reviewed framework is aligned to the requirements of AS/NZS ISO 310001 and illustrates how risk management will be embedded in CoL systems to ensure it is integrated at all levels and for all work contexts.
ISO 31000 is recognised as the leading standard relating to risk management and is produced by the International Organisation for Standardisation. The purpose of ISO 31000 is to provide principles and generic guidelines on risk management. ISO 31000 emphasises that for risk management to be effective, organisations must comply with the principles outlined below.
1 AS/NZS ISO 31000:2009 Risk Management – Principles andGuidelines
Creates Value - Risk management contributes to the achievement of objectives. Protects value - minimise downside risk,protectspeople, systems and processes
Integral Part of Organisational Processes - Risk management is not a stand-alone activity fromthe management systemof the organisation. It ispart of theprocessnot an'additional'compliance task
Part ofDecisionMaking- Risk management helpsdecision makers make informed choices, prioritise actions and distinguish among alternative courses of action. Helps allocate scarceresources
Explicitly Addresses Uncertainty - Risk management explicitly takes account of uncertainty, the nature of that uncertainty, andhow it can beaddressed
Systematic, Structured and Timely - A systematic, timely and structured approach to the management of risk contributes to efficiency and to consistent, comparable and reliable results. Themore aligned -the moreeffective and efficient
Based on Best Available Information - The inputs to the process of managing risk arebased oninformationsourcessuchashistoricaldata,experience,stakeholder feedback, observation, forecasts and expert judgement. As perfect information is not usually available, start with resources/expertise you have or gain easily. Increase informationas the level ofrisk increases
Tailored-Riskmanagement isaligned withthe organisationsexternaland internal context and risk profile. Different risk appetites and different measurements are used fordifferent risk types
Takes Human and Cultural Factors into Account - The management of risk recognises the capabilities, perceptions and intentions ofpeople that makeevery organisationdifferent
Transparent and Inclusive - Appropriate and timely involvement of stakeholders at alllevels oftheorganisationensures that management ofrisk remainsrelevant and up to date. The management of risk must be clearly set out in job profiles/employment contracts and annualappraisals
Dynamic, Repetitive and Responsive to Change - External and internal events happen, context and knowledge change, monitoring and review take place, new risksemerge,somechange,andothersdisappear. Arelevantandaccuratesystem should support decisions and strategies. There should be regular reviews of the Risk Register(s) and Framework, in particular the Register(s) by the areas of the business that areidentifiedand are managingthe risks
Facilitates continual improvement and enhancement of the organisationdevelopment and implementation ofstrategies to improve risk management maturity alongside allother aspectsof the organization
The CoL has considered the level of risk it is prepared to accept, take action to mitigate in the pursuit of its public service obligations. If the assessed risk level is above the acceptable/tolerable level for that category of risk then treatment may be required. If the risk is equal to or less that the acceptable/tolerable level for that category of risk then that risk can be accepted.
Table 13 summarises the level of residual risk we are willing to retain in the pursuit of our objectives.
Table 13: Level of Residual Risk
Levelofrisk(aftertreatment)wearewillingto retain in the pursuit of ourobjectives
While Table 13 indicates the acceptable/tolerable levels of risk we are willing accept it is an unrealistic expectation that the CoL would have all risks sitting below these levels.
By introducing treatments and control measures we can minimise our residual risk to the acceptable target level in many circumstances. However, where this is not possible Table 14 identifies those with the authority to accept risks that exceed our acceptable target level.
Table 14: Authorityfor Acceptance above Risk Targets
Authority for acceptance of risk above the target level
The CoL Risk Management Framework operates to enhance the financial management of Council by ensuring that effective processes are in place to manage risks. The framework is currently under review and will be implemented across all Networks once completed.
A risk assessment is to be undertaken as part of any project. Senior and Project Managers are accountable for identifying and assessing any risks emerging as a result of projects. These risks are to be included on the project plan which is reviewed and maintained throughout the life of the project. Capital project risks are to be managed using the Tech1 Capital Planning and Delivery module. Any risks which eventuate as a result of the project, and are of an ongoing nature, should be recorded in the Corporate Risk Register.
Risk Management is a structured way to identify and analyse potential risk, and devise and implement appropriate responses according to the level of those risks. The process includes identifying and assessing risks to enable well informed decisions about risk management and treatment plans. The table below lists risks that have been identified with regard to Financial Management at the CoL. It will require review on a regular basis to ensure currency and to capture emerging risks.
The Risk Matrix, Likelihood and Consequence Tables included in Section 13 will be used to rate each risk against the Critical Success Factors below:
Reputation and PublicImage
PublicSafety/StaffWHS
Financial/BusinessInterruption
Legal/Regulatory
Environment.
Please note the highest risk rating against the Critical Success Factors for any risk will be the overall risk rating.
A suite of financial management improvement initiatives have been identified during the preparation of this Long Term Financial Plan. The improvement initiatives are prioritised in the below table.
PursuealternativegovernancestructuresforUTASStadiumand QVMAG
Implementaquarterlyreviewofthemacroeconomicclimatepost Covid-19Pandemic
ConductareviewofcurrentLevelsofService.
a) DocumentcurrentLevelsofService.
b) DevelopfinancialmodelforcurrentLevelsofService.
c) ClarifytheservicesCouncilsubsidisesascomparedto serviceswhichareprovidedatfullcost.
Reviewapproachtouserfeeandchargesrevenue,including benchmarkingagainstotherlikeCouncilfinancialdata.
ReviewCouncil'sassetownershipandpotentialassetsfordisposal.
1
2
3
4ChiefFinancialOfficer
5
InitiatetheDevelopmentofaCorporateResourcingPlantoenhance workforce-planninginputsintofutureversionsoftheLTFP. 6GeneralManager
Additional information on each action from the above table is outlined below:
The transition of the University of Tasmania Stadium to the Tasmanian Government is expected to be finalised in 2022/23, this is reflected in the annual budget and modelled accordingly in the LTFP. The annual savings are budgeted to be approximately $3.5m annually from 2023/2024, with 50% of this saving budgeted in 2022/2023. The relevant budget lines have been adjusted to reflect the ongoing savings to Council.
No provision for a reduction in operating costs or any additional grant funding for the QVMAG is included in the LTFP, however Council continues to advocate for this and will update future versions of the LTFP to reflect any changes necessary.
The QVMAG Future Directions Plan was endorsed by the Council on 30 June 2022 and now provides a roadmap to a new governance structure, a sustainable funding model, and improved activation outcomes, as well as infrastructure overhauls of both Royal Park and Inveresk sites. The new governance model is known as a 'company limited by guarantee', will allow the Council to retain ownership of the museum buildings and collection. A new skills-based board will be established to oversee all operational activities. This structure will allow the QVMAG to be registered and endorsed as a recognised charity and to seek out funding opportunities to supplement its operational activities.
The plan also outlines five potential future funding models, as opposed to the current model which sees the majority of funding met by Launceston ratepayers, with around 20 per cent currently coming from the State Government. The Council believes that the State Government needs to increase its share of funding to better reflect the museum's role as a state-level institution and to provide more equity for Launceston ratepayers.
The Council indents to progress with the implementation of the Futures Plan and will continue to lobby the State Government in respect to an increase in the level of funding that is currently provided.
The international impacts of the Covid-19 pandemic on the economy are currently undetermined. To mitigate the risks created by this economic uncertainty CoL will implement ongoing quarterly reviews of the macro economic climate post Covid-19 Pandemic.
An ongoing review into service levels has commenced with a dedicated resource supporting a cross-Council team in conducting this review. Council faces community expectations to maintain and increase existing service levels, while keeping rate rises to a minimum.
It is likely that any changes to service levels will have a financial impact that is required to be reflected in the LTFP, and will require ongoing analysis and modelling to support community engagement and decision making processes with regard to any proposed change in service levels. It is envisioned that there is the potential for long term savings as a result of this review.
A more substantive review and approach towards modelling fees and charges has been undertaken since the last version of the LTFP. This has required significant input from operational teams to provide guidance, including Building Surveying and Planning, with fees now being charged in line with the cost to provide the service.
Benchmarking data against other like Council financial data suggests that CoL's overall fee revenue is lower as a ratio to rating revenue. Further analysis and benchmarking of this ratio is required to determine the appropriate fee and rate revenue model for CoL.
The fees and charges review will include a component of reviewing services we provide that are currently not separately charged or rated - for example, the review of an implementation of a charge for stormwater services.
Council currently has a very diverse and large array of assets, with significant associated operating costs. Council plans to review its asset base for any assets that may be surplus
to requirements. An Asset Ownership Framework is being developed which will be utilised to investigate and assess Council's asset base.
It is proposed that Council develop a Corporate Resourcing Plan over the forward planning period. This plan would form part of the 10 Year Resource & Capacity Plan suite of documents, sitting alongside the LTFP and the SAMP, providing enhanced planning and forecasting inputs to both the SAMP and LTFP.
Specifically, enhanced forecast workforce requirements into the future would be of particular value to future versions of the LTFP given the significance of employee expenses proportional to Council's overall budgeted expenses in 2022/23 (40%).
ReviewapproachtoaligningalldecisionmakingtotheLTFP Reviewcompleted Embedanorganisationalprocesstoaligntheannualreview oftheSAMPandLTFP.
Organisationalprocessdeveloped andimplemented.Internalauditby Crowefoundthat"CoLhas thoroughprocessesinplaceto developtheLTFPandSAMP. There isahighdegreeofcollaboration betweentheteamsthatdevelop theplans. TheLTFPandSAMP formacornerstoneofplanning processesinCoL. Theyare refreshedinlinewiththeelectoral cycleandformastartingpointfor annualbudgetprocesses."
Review,andconfirm,currentapproachtodepreciation modelling,particularlyforatypicalclassesofassets.
Independentreviewisbeing conductedbyInfrastructureand Financetopotentiallyextendasset livesofroadsbasedoncondition assessments.
Implementationofannualefficiencydividendtargetsinto operationalbudgetingprocess.
Efficiencytargetsarereviewed annuallyduringthebudgeting process,andchangesincludedin theLTFPmodelling.
Efficiencytargetsforrespective Teambudgetsectionsare incorporatedintotheannual operationalbudgetingprocesses.
CITYOFLAUNCESTONLongTermFinancialPlan2022-3239
CITYOFLAUNCESTONLongTermFinancialPlan2022-3240
CITYOFLAUNCESTONLongTermFinancialPlan2022-3241
CITYOFLAUNCESTONLongTermFinancialPlan2022-3242
Table 18: Risk Scoring Matrix - Likelihood x Consequence
Likely
Possible
Unlikely
Rare
Expectedtooccurinmostcircumstances
Thereisaconstantexposuretorisk
Weakand/ornon-existentcontrols Lessthan1year
Willprobablyoccurinmostcircumstances
Thereisfrequentexposuretorisk
Majorityofcontrolsareweak 1to<10years
Mightoccuratsometime
Thereismoderateexposuretorisk
Somecontrolsarestrongwithnogaps
Notexpectedbutcouldoccuratsometime
Thereisinfrequentexposuretorisk
Majorityofcontrolsarestrongwithnogaps
Mayoccuronlyinexceptionalcircumstances
Thereisrareexposuretorisk
Allcontrolsarestrongwithnogaps
10to<100years
100to<1,000years
1,000+years
>$5M loss
Fatality(ies)
Community outrage
Widespread social impact
National or international coverage
Service disruption for more than 7 days
Critical or irreversible loss or damage to property or infrastructure
$1M - $5M loss
Disruption to services and routine needs for 4-7 days
Multiple permanent disability or ill-health
Critical legal, regulatory or internal policy failure
Intervention from governments
Major breaches of regulation, major litigation
Irreversible long-term damage
Toxic release offsite with detrimental effect
Long-term illness or multiple serious injuries
Major legal, regulatory or internal policy failure
Widespread long-term damage
Significant level of community concern
Local media coverage
Moderate level of community concern
Serious structural damage to property/ infrastructure
$500k - $1M loss
Capability or services impaired 1-4 days
Moderate loss or infrastructure damage
2 Minor
Short-term local media coverage
Minor level of community concern
$50k - $500k loss
Delays in undertaking routine tasks <24 hours
Loss or damage to property <$50k
Injury requiring treatment
Possible hospitalisation
Numerous days lost
Minor injury requiring First Aid
Enforcement action by regulators
Breach of regulation with prosecution and/or moderate fine
Moderate legal, regulatory or internal policy failure
Regulatory compliance issue without high severity level consequence
Minor legal, regulatory or internal policy failure
Minor legal issue, non-compliance and breaches of legislation
Widespread short term damage
Contamination – offsite release, no detrimental effect 3
Contamination – offsite release contained with outside assistance
Minor short term damage
Contamination – onsite release contained within 8 hours
1 Insignificant
Little or no effect on public image
Insignificant level of community concern
< $50k
Delays in undertaking routine tasks <12 hours
Negligible loss or damage to infrastructure
No personal injury
No First Aid needed
Minor encroachment on legislation/standard
Minimal damage
Contamination – onsite release contained immediately
CITYOFLAUNCESTONLongTermFinancialPlan2022-3244
The below table details the useful lives applied to each asset group. The useful life is used to calculate depreciation expense on assets, and used in conjunction with the SAMP. Asset lives are consistent with Council's Asset Capitalisation Framework which is reviewed annually.
TownHall,18StJohnStreetLaunceston
T 0363233000
E contactus@launceston.tas.gov.au
W www.launceston.tas.gov.au