3 minute read
Financial Basics
There are many different forms of revenue and expenses. The descriptions below provide a broad overview. For the full details of this information, please visit the City’s website and review the CAFR. REVENUE SOURCES
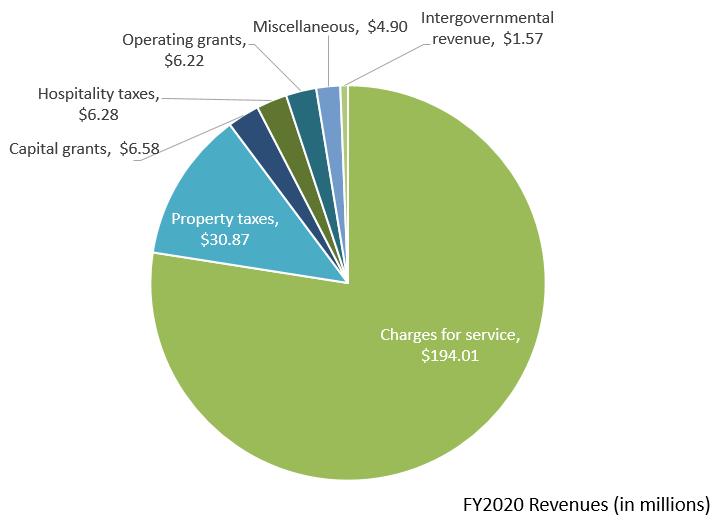
General Revenues– include property taxes, investment income, funding from other governments, and hospitality taxes (which is a fee on prepared food and beverages, etc.). Property taxes provide for the majority of General Fund expenditures, but only make up 12% of total City revenues. This percentage is unchanged from the previous year.
Program Revenues–revenues that are specifically tied to certain program expenses. Charges for services– this is revenue received for things like business licenses, electric, water, and sewer bills, solid waste fees, etc. This makes up 77% of all City revenues, which is consistent with FY2019. Operating grants and contributions – usually grant funding received from the state or federal government that goes towards a specific program function—make up 2% of all revenues which is consistent with FY2019.
Capital grants and contributions– grant funding received from the state or federal government that goes towards a specific capital purchase—make up 3% of all revenues, a significant decrease from FY2019 in large part due to an almost $6 million grant related to the My Ride transit system in the previous year. Changes in Revenue between FY2019 and FY2020—Overall, revenue from all sources has decreased by 1% between FY2019 and FY2020, from $253 million to $250 million. Aside from the My Ride capital grant received last year, there were mild decreases in charges for services—largely related to mild weather patterns that decreased overall electric revenue. There were also modest decreases in revenue due to the impact of the COVID-19 pandemic.
PROGRAM EXPENSES
Program expenses are generally broken down by City departments. The Utility Funds in the City (Electric, Water, Wastewater, and Stormwater) are also accounted for individually. There are two expense categories that include multiple departments and divisions in the City: General Government– includes many of the support functions in City government like the Planning and Development, Finance, and Human Resources. Public Safety– includes Police, Fire, and Judicial Departments.
The City participates in a jointownership of the Piedmont Municipal Power Agency (PMPA), a wholesale electric provider for ten cities within South Carolina. The purchase of electricity to provide power to the community is the City’s largest expense, accounting for 41% of the City’s expenses. Mild weather patterns created lower demand, therefore decreasing total electric expenses. Core governmental services in Public Safety are the next largest expense, accounting for 15% of expenses. General Government expenses amount to 14% of City expenses which are largely made up of salaries and benefits for City personnel. Capital and Electric expenses aside, most City funds are spent on City personnel and expenses related to the City’s 1,000+ employees. Increased expense in employee health claims, retirement increases from the state, and liability for one time COVID-19 paid time off added to expenses. Tax increment financing (specifically, the Textile TIF) related expenses as well as expenses related to new parking services in Knowledge Park, Police radios, and the expanded My Ride transit system impacted the City budget. The primary difference between revenues (prior page) and expenses was related to principal payments on debt and cash funded projects. Changes in Expenses between FY2019 and FY2020— Overall, expenses increased by 3% when comparing FY2019 and FY2020. Similar to the revenue side, the electric system saw decreased demand, correlating with a decrease in purchase power expenses. The challenges of COVID-19 also brought about additional, unplanned expenses in order to maintain the safety of our customers and staff members.


