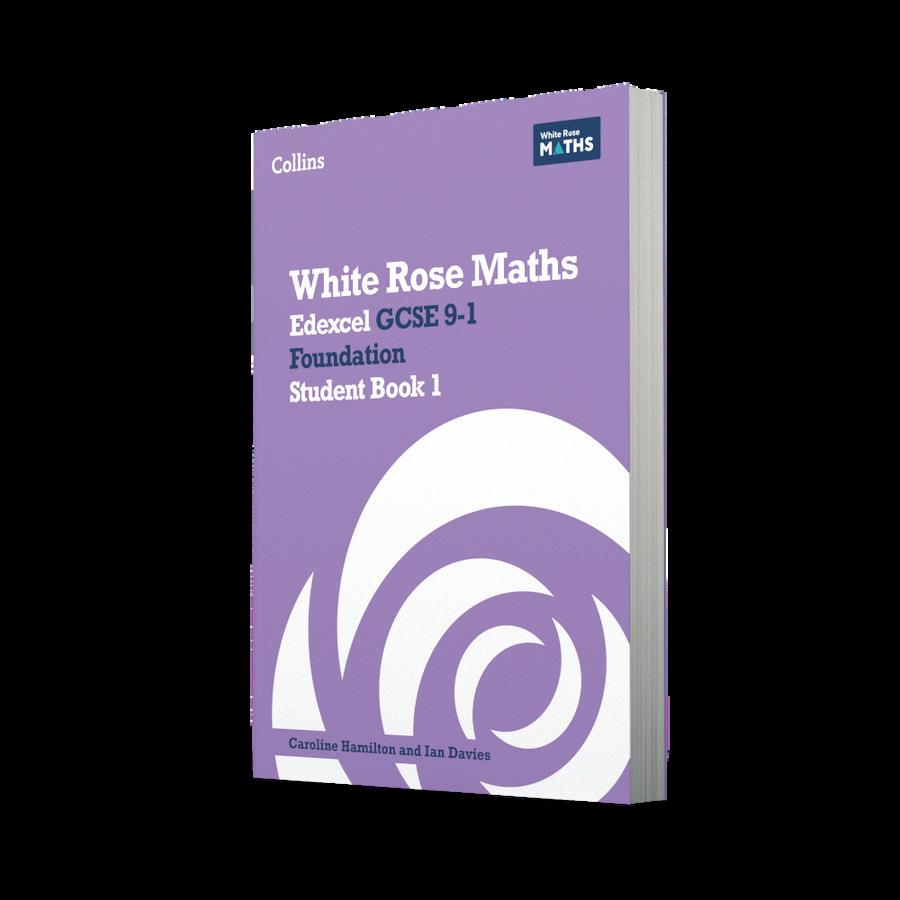
White Rose Maths
Edexcel GCSE 9-1 Foundation Student Book 1
Sample pages
Caroline Hamilton and Ian Davies
3 Introduction 5 Block 1 Integers 7 1.1 Powers of 10 8 1.2 Converting units 11 1.3 Place value and ordering 15 1.4 Arithmetic 21 1.5 Using inverse operations 31 Integers: exam practice 34 Block 2 Fractions and decimals 35 2.1 Equivalence 36 2.2 Ordering 44 2.3 Fraction arithmetic 51 2.4 Decimal arithmetic 63 Fractions: exam practice 73 Block 3 Moving on with number 74 3.1 Powers and roots 75 3.2 Order of operations 79 3.3 Standard index form 84 Moving on with number: exam practice 91 Block 4 Factors, multiples and primes 92 4.1 HCF and LCM 93 4.2 Prime factorisation 97 Factors, multiples and primes: exam practice 104 Block 5 Percentages 105
Fraction, decimal and percentage equivalence 106 5.2 Fractions of amounts 111 5.3 Percentages of amounts 118 5.4 Simple interest and compound interest 128 5.5 Reverse percentages 134 Percentages: exam practice 140 Block 6 Accuracy 141 6.1 Decimal places 142 6.2 Significant figures 146 6.3 Estimation 151 6.4 Limits of accuracy 156 Accuracy: exam practice 160 Number: exam practice 161 Block 7 Understanding algebra 163 7.1 Notation and simplifying 164 7.2 Index laws 169 7.3 Substitution 173 7.4 Algebraic structures 177 Understanding algebra: exam practice 180 Block 8 Working with brackets 181 8.1 Expanding and factorising a single bracket 182 8.2 Expanding and simplifying double brackets 186 8.3 Factorising quadratic expressions 189 8.4 Identities 192 Working with brackets: exam practice 195 Contents sample proof - content not final
5.1
4 Contents Block 9 Functions and linear equations 196 9.1 Inputs, outputs and inverses 197 9.2 Linear equations 204 9.3 Unknowns on both sides 211 Functions and linear equations: exam practice 215 Block 10 Formulae 216 10.1 Using formulae 217 10.2 Creating formulae 221 10.3 Rearranging formulae 224 Formulae: exam practice 228 Block 11 Inequalities 229 11.1 Understanding inequalities 230 11.2 Solving inequalities 233 11.3 Inequalities on number lines 239 Inequalities: exam practice 243 Block 12 Linear graphs 244 12.1 Plotting graphs 245 12.2 Interpreting straight line equations 250 12.3 Interpreting graphs 254 Linear graphs: exam practice 263 Block 13 Non-linear functions 264 13.1 Quadratic graphs 265 13.2 Cubic and reciprocal graphs 270 Non-linear functions: exam practice 275 Block 14 More complex equations 276 14.1 Quadratic equations 277 14.2 Simultaneous equations 280 More complex equations: exam practice 285 Block 15 Sequences 286 15.1 Generating sequences 287 15.2 Linear sequences 291 15.3 Other sequences 295 Sequences: exam practice 300 Algebra: exam practice 301 Block 16 Ratio 303 16.1 Ratio notation 304 16.2 Finding parts and wholes 310 Ratio: exam practice 317 Block 17 Proportion 318 17.1 Fractions and equal ratios 319 17.2 Direct proportion 323 17.3 Inverse proportion 332 Proportion: exam practice 336 Block 18 Rates 337 18.1 Speed 338 18.2 Density 344 Rates: exam practice 348 Ratio, proportion and rates of change: exam practice 349 Glossary 351 Answers 355 sample proof - content not final
12.1 Plotting graphs
Are you ready?
1 Here are five pairs of coordinates:(4, 3) (4, 0) (4, –1) (4, 9) (4, –7)
a What do all the pairs of coordinates have in common?
b Copy and complete this sentence to describe the coordinates. In each pair of coordinates, the value is equal to
12 Linear graphs
2 Write down three pairs of coordinates in which the y value is equal to –3
3 Substitute x = –1 into these expressions and evaluate them.
a 4x + 3 b 3x – 4 c –3x + 4 d 3 – 4x
4 Draw a coordinate grid with x-axes and y-axes that go from –5 to 5 and plot these points.
a (1, 3) b (–1, 3) c (1, –3) d (–1, –3)
In
The word ‘linear’ implies ‘straight line’, so all linear graphs will form a straight line.
Knowing this fact helps you to check if you have drawn your graphs correctly.
this block, we will cover…
To plot a linear graph, you can:
● complete a table of values, working out the values of y for some values of x
● plot a point for each pair of coordinates (x y)
● join the points with a straight line.
12.1 Plotting graphs
If your points do not all lie on the same straight line, you know you have made a calculation error.
Example 1
Draw the graph of y = 6
The equation of the line is ‘y is equal to 6’ so the y value is equal to 6 in the pair of coordinates for all points on the line.
b y = 2x + 1 and y = 2x – 4 are parallel because they have the same gradient.
Examples are (–8, 6), (0, 6) and (5, 6).
c y = 2x + 1 and y = –x + 1 have the same y-intercept.
This is because they cut the y-axis at the same point, (0, 1).
Example 2 A straight line has equation y = 5x – 8
This happens because the equations of these lines have the same coefficient of x. The number before x is 2 in both equations.
This happens because the equations of these lines have the same constant term (in both equations it is +1), so when x = 0 they have the same value.
Write down: a the gradient of the line b the coordinates of the y-intercept.
Method
SolutionCommentary
12.2 Interpreting straight line graphs
a 5 The gradient of the straight line is given by the coefficient of x in the equation.
b (0, –8)The y-intercept of a straight line is given by the constant in the equation. You are asked for the coordinates of the y-intercept, so you need to give the value of x as well as the value of y
Practice
1 State whether each line has a positive or negative gradient. a y 0 b y 0 c y 0 d y 0
2 a Draw each of these lines on the same coordinate grid.
y = x y = 2x y = 3x y = 5x
12.3 Interpreting graphs
b Explain what happens to a line when you increase its gradient.
3 a Draw each of these lines on the same coordinate grid.
y = 3x y = 3x + 1 y = 3x – 2 y = 3x + 5
b Explain how you can tell all lines are parallel from: i the graphs ii the equations.
d What was Abdullah’s speed: i during the first section of his journey ii between 2:30 pm and 3:00 pm iii on the return journey home?
c Write down the equation of another line that is parallel to each line above. 9780008669539_White
e Find Abdullah’s average speed for the time he was actually driving.
3 Marta goes on a bike
graph.
12.3 Interpreting graphs
b Work out:
i the total distance Marta cycled ii the speed on her return journey home.
Consolidate – do you need more?
1 Find an equation for each line.
244
245
Method Solution Commentary 10 9 8 7 6 5 4 3 2 1 10987654321 −1 −2 −4−1−2−3−5−6−7−8−9−10 0 y x y 6 × × ×
9780008669539_White Rose Maths Edexcel SB1_Block 12.indd 245 08/04/24 6:56 PM
260
Here is a
She left home at 10 am.
cycled at a speed of 20 miles per hour for 90 minutes.
had
break
1 hour.
ride.
description of her journey:
She
She
a
for
She then cycled back and returned home at 2:30 pm. a Represent this information on a distance–time
a 5 4 3 2 1 54321 −1 −2 −3 −4 −5 −4−1−2−3 −5 0 y x b 5 4 3 2 1 54321 −1 −2 −3 −4 −5 −4−1−2−3 −5 0 y x c 5 4 3 2 1 54321 −1 −2 −3 −4 −5 −4−1−2−3 −5 0 y x d 5 4 3 2 1 54321 −1 −2 −3 −4 −5 −4−1−2−3 −5 0 y x 9780008669539_White Rose Maths Edexcel SB1_Block 12.indd 260 08/04/24 6:57 PM
251 12.2
Interpreting straight line graphs
sample proof - content not final
Rose Maths Edexcel SB1_Block 12.indd 251 08/04/24 6:57 PM
12.1 Plotting graphs
Are you ready?
1 Here are five pairs of coordinates: (4, 3) (4, 0) (4, –1) (4, 9) (4, –7)
a What do all the pairs of coordinates have in common?
b Copy and complete this sentence to describe the coordinates. In each pair of coordinates, the value is equal to
2 Write down three pairs of coordinates in which the y value is equal to –3
3 Substitute x = –1 into these expressions and evaluate them.
a 4x + 3
b 3x – 4 c –3x + 4 d 3 – 4x
4 Draw a coordinate grid with x-axes and y-axes that go from –5 to 5 and plot these points.
a (1, 3) b (–1, 3) c (1, –3) d (–1, –3)
The word ‘linear’ implies ‘straight line’, so all linear graphs will form a straight line. Knowing this fact helps you to check if you have drawn your graphs correctly.
To plot a linear graph, you can:
● complete a table of values, working out the values of y for some values of x
● plot a point for each pair of coordinates (x, y)
● join the points with a straight line.
If your points do not all lie on the same straight line, you know you have made a calculation error.
Example 1
Draw the graph of y = 6
Method
The equation of the line is ‘y is equal to 6’ so the y value is equal to 6 in the pair of coordinates for all points on the line.
Examples are (–8, 6), (0, 6) and (5, 6).
245
Solution Commentary 10 9 8 7 6 5 4 3 2 1 10987654321 −1 −2 −4−1−2−3−5−6−7−8−9−10 0 y x y = 6 × × ×
sample proof - content not final
Example 2
a Complete the table of values for y = 3x – 4
x –2–1012 y
b Draw the graph of y = 3x – 4
Method
Solution
a
Commentary
You can use this function machine to help you to work out the values in the table.
At each point on the line y = 3x – 4, the y value is equal to 4 less than 3 times the x value.
Note the straight line extends infinitely in both directions, beyond the points given by the table of values.
Practice
1 a Draw a coordinate grid with x-axes and y-axes that go from –10 to 10
b i Write down three pairs of coordinates in which the y value is equal to 4
ii Plot your coordinates and join them to draw the line y = 4
iii Choose another point on the line and write down its coordinates. How does this confirm that your line has the equation y = 4?
c On your coordinate grid, draw and label each of these straight lines. i y = 1 ii y = –3 iii y = –7
246
12.1 Plotting graphs
x –2–101 2 –6–303 6 y –10–7–4–1 2 – 4 × 3 –
4 × 3
b 10 9 8 7 6 5 4 3 2 1 10987654321 −1 −2 −3 −4 −5 −6 −7 −8 −9 −10 −4−1−2−3−5−6−7−8−9 −10 0 × × × × × y x y = 3x −4
x
× 3 − 4 y
Input Output
sample proof - content not final
2 a Draw a coordinate grid with x-axes and y-axes that go from –10 to 10
bi Write down three pairs of coordinates in which the x value is equal to 4
ii Plot your coordinates and join them to draw the line x = 4
c On your coordinate grid, draw and label each of these straight lines.
i x = 1 ii x = –3 iii x = –7
d What is the same and what is different about your answers to part c?
e i Write down three pairs of coordinates in which the y value is equal to the x value.
ii Plot your coordinates and join them to draw the line y = x
3 a Copy and complete the table of values for y = 2x + 1 x –2–1012 y
b Draw the graph of y = 2x + 1 for values of x from –2 to 2
4 Here are the equations of three straight lines: i y = x – 4 ii
For each line:
a complete a table of values using values of x from –2 to 2
b draw the graph for values of x from –2 to 2
Draw all three graphs on the same coordinate grid. Remember to label each line with its equation.
5 Here are the equations of two straight lines: y = 3x – 2 y = 2 – 3x
a What is the same and what is different about the lines?
b For each line:
i complete a table of values using values of x from –3 to 3
ii draw the graph for values of x from –3 to 3
6 Here are the equations of four straight lines:
–5
For each line:
a complete a table of values using values of x from –2 to 2
b draw the graph for values of x from –2 to 2
247 12.1 Plotting graphs
iii y = 4(x – 1)
y = 4x – 1
i y
2x ii y = 2(x + 5) iii y = 5 – 2x iv =+yx 1 2 5
=
+
sample proof - content not final
What do you think?
1 Junaid has completed a table of values for y = 3x + 4
x –1012 y 14710
He says, “I only need to find the first value, then add 3 each time, as the coefficient of x is 3”
a Is Junaid correct?
b Why won’t his method work for the table of values below?
x 01510
y
Consolidate – do you need more?
1 Write down the equation of each line.
248 12.1 Plotting graphs
a 5 4 3 2 1 1234 5 −2 −3 −4 −1 −5 0 −2−3−4−1 −5 y x b 5 4 3 2 1 1 234 5 −2 −3 −4 −1 −5 0 −2−3−4−1 −5 y x c 5 4 3 2 1 1234 5 −2 −3 −4 −1 −5 0 −2−3−4−1 −5 y x d 5 4 3 2 1 1 234 5 −2 −3 −4 −1 −5 0 −2−3−4−1 −5 y x sample proof - content not final
1.1 LinearXxxxxgraphs: exam practice
1 a) Plot the points (2, 4) and (2, –3) on a copy of the grid. Join your points with a straight line. (2)
b) What is the equation of the line you have drawn? (1)
c) On the same grid, draw the line y = x. (1)
d) Write down a pair of coordinates that would lie on the line y = −4 (1)
2 a) Complete a copy of the table of values for y = 3x + 4 x –2–1012 y (2)
b) Draw the graph of y = 3x + 4 on a copy of the grid below.
3 The equation of a line is y = 7x + 3
a) What is the gradient of the line? (1)
b) What is the intercept of the line? (1)
c) Write down an equation of a line that would be parallel to y = 7x + 3 (1)
4 Write down three pairs of coordinates that would lie on the line x + y = 3 (2)
263
5 4 3 2 1 12345 −2 −3 −4 −1 −5 0 −2−3−4−1 −5 y x
5 4 3 2 1 123 −2 −3 −1 0 −2 −3 −1 y x 6 7 8 9 10 (2)
1–3 3–5 sample proof - content not final


ISBNTITLE 9780008669539 NEW Edexcel GCSE 9-1 Higher Student Book 1 PRICE £14.99 NEW Edexcel
Higher Student Book 2 NEW
Higher Complete Digital Download 9780008669546 9780008669560 9780008669553 9780008726829 £14.99 £14.99 £14.99 £6,000.00 + VAT We’re here to help WRMEDF @freedomtoteach Collins Secondary Collins Ed Email us education@harpercollins.co.uk Talk to your local representative findarep.collins.co.uk Call us 01484 668 148 Order online collins.co.uk/WRMGCSE collins.co.uk September 2024
GCSE 9-1
Edexcel GCSE 9-1 Foundation Student Book 1 NEW Edexcel GCSE 9-1 Foundation Student Book 2 NEW Edexcel GCSE 9-1 Foundation and


