A COMER INDUSTRIES
CONSOLIDATED FINANCIAL REPORT December 31, 2023
ANNUAL REPORT
COMER INDUSTRIES S.p.A.
via Magellano 27, 42046 Reggiolo (RE), Italia
Tel. +39 0522 974111
Fax
+39 0522 973249
Email: info@comerindustries.com
www.comerindustries.com
2023 ANNUAL REPORT
COMER INDUSTRIES
2023 ANNUAL REPORT COMER INDUSTRIES S.P.A. Headquarters and Administrative Offices: Via Magellano 27, 42046 Reggiolo (RE), Italy Registered in the Reggio Emilia Business Register no. 07210440157 Authorized Share capital 18,487,338.60 euros fully subscribed and paid up Tax Code 07210440157 – VAT code IT 01399270352
COMER INDUSTRIES
Letter from the President General information 1. Directors' report 1.1 Significant events in the 2023 financial year 1.2 The global macroeconomic scenario and the reference market 1.3 Comments on key performance indicators 1.4 Investments 1.5 Research and Development 1.6 Social responsibility 1.7 Environment, health and safety 1.8 Intergroup relations and dealings with related parties 1.9 The companies in the Group 1.10 Non-financial information 1.11 Significant events after the close of the year and business outlook 1.12 Operational risk management 1.13 Proposal for the allocation of profit 2. Consolidated financial statements and explanatory notes 2.1 General information 2.2 Scope of consolidation 2.3 Accounting standards adopted 2.4 Financial risk management 2.5 Corporate information and industry-related information 2.6 Notes to the consolidated financial statements 3. Report of the Audit Firm 4 7 8 36 100
CONTENTS
LETTER FROM THE PRESIDENT
Dear shareholders,
The results for the year illustrated in the document that follows tell of a year of consolidated growth, which continued in 2023 following a stable path and maintaining a steady pace in terms of sales, with a significant increase in profitability thanks to a strategy consisting of investments and increased resource efficiency, a process that will continue over time. A year in which Comer Industries confirmed its position as a leading company in the industry, while at the same time successfully continuing the work of reorganization and integration among the various souls that make up our Group.
Comer Industries has been transformed from a strategic idea to a reality: a platform of companies, each recognized and well positioned in its own market, with its own distinctive product range and its own business culture, but with the decisive added value of cooperation, of synergies of the entire Group.
Of the many events we experienced in 2023 I want to mention two in particular, which I believe best represent what Comer Industries is today, aside from being a healthy, solid, profitable Group.
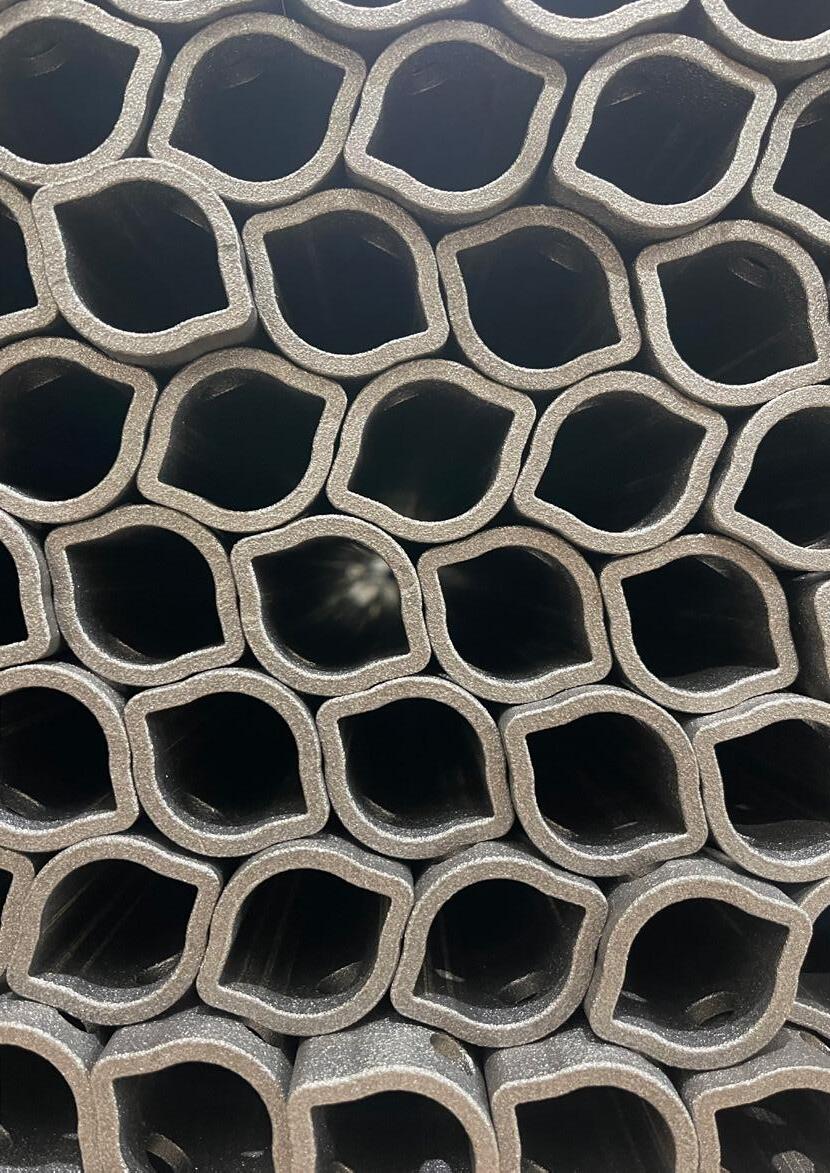
Last July Comer Industries S.p.A. began trading its ordinary shares on the Euronext Milan regulated market of Borsa Italiana, the exchange where the country's most important companies are listed, leaving the Euronext Growth Milan segment after four years.
This change in market, which represented a new stage in the strategic growth that began a few years ago, gives even more authority to our Group. During the "new listing" ceremony that took place at the stock exchange – some of the shareholders were present – Comer Industries was given a special welcome. The market's admiration for our company and the industrial trajectory we have undertaken was perceptible.
The second event of 2023 dense in significance has little to do with finance and markets, but then again not so distant in a world where the vision of companies is also measured by their Corporate Social Responsibility.
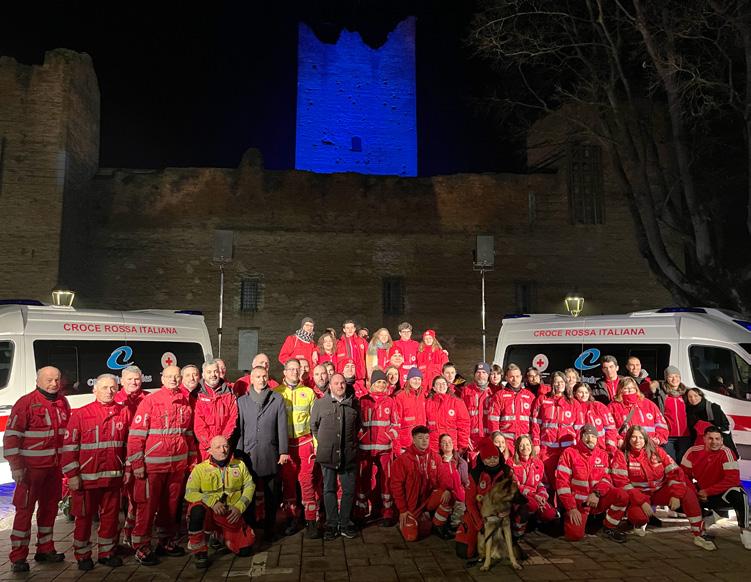
Last December our company donated two new next-generation ambulances to the Reggiolo Red Cross, both outfitted with the latest technology to ensure the most immediate and efficient rescue possible to people in need. Here again a large number of people, institutions and our own employees gathered at Comer Industries, applauding the initiative and corporate policies of our company, which has long cultivated an ESG culture that over the years has developed deep, strong roots.
Two moments in the year that, along with many others, best represented what our and your company is today: a company of value and values, recognized by the market and all its stakeholders.
Two moments in a journey that Comer Industries embarked on several years ago and that will continue in the current fiscal year. Always with the same goal: to play the role of a market-leading, innovative and caring company. Focused on growth, people and environmental, social but also economic sustainability.
This is the company that, with your support, we have chosen to be.
Reggiolo, March 13, 2024
 Matteo Storchi President & CEO
4 2023 ANNUAL REPORT
5 COMER INDUSTRIES
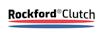
From the right Matteo Storchi and Cristian Storchi.
GENERAL INFORMATION
BOARD OF DIRECTORS
Matteo Storchi
President & CEO
Cristian Storchi
Vice President and Director
Arnaldo Camuffo Independent Director
Luca Gaiani Director
Lee M. Gardner Director
Joseph P. Huffsmith Director
Matteo Nobili Director
Paola Pizzetti Independent Director
Marco Storchi Director
BOARD OF STATUTORY AUDITORS
Luigi Gesaldi Chairman
Francesca Folloni Standing Statutory Auditor
Massimiliano Fontani Standing Statutory Auditor
CONTROL, RISK AND SUSTAINABILITY COMMITTEE
Paola Pizzetti
Chairman
Arnaldo Camuffo Member
Luca Gaiani Member
APPOINTMENT AND REMUNERATION COMMITTEE
Arnaldo Camuffo
Chairman
Paola Pizzetti Member
Matteo Nobili Member
RELATED-PARTY COMMITTEE
Paola Pizzetti Chairman
Arnaldo Camuffo Member
FINANCIAL REPORTING OFFICER
Stefano Palmieri
AUDIT FIRM
Deloitte & Touche S.p.A.
7 COMER INDUSTRIES
2022 Annual Report 01
DIRECTORS’ REPORT
Comer Industries
SUMMARY OF THE RESULTS OF COMER INDUSTRIES GROUP
(*) EBIT (Operating income) adjusted to exclude depreciation and amortization resulting from the accounting of business combinations.
(**) Net profit adjusted to exclude depreciation and amortization and related theoretical tax effects arising from the accounting of business combinations.
(***) Financial charges calculated according to the provisions of the Group's loan agreements for the purpose of calculating covenants, i.e., excluding financial charges attributable to the application of IFRS 16 and foreign exchange gains and losses.
10 2023 ANNUAL REPORT (MILLION EUROS) 2023 2022 CHANGE IN % SALES REVENUES 1,223.9 1,237.6 -1.1% EBITDA % of sales revenue 205.0 16.7% 180.0 14.5% 13.9% EBIT % of sales revenue 144.4 11.8% 127.5 10.3% 13.3% NET PROFIT % of sales revenue 94.0 7.7% 90.7 7.3% 3.7% EPS [NET PROFIT / NO. OF SHARES] 3.3 3.2 3.7% Adjusted EBIT (*) % of sales revenue 164.6 13.4% 142.8 11.5% 15.2% Adjusted NET PROFIT (**) % of sales revenue 108.6 8.9% 101.8 8.2% 6.7% COMMERCIAL WORKING CAPITAL % of sales revenue 233.6 19.1% 254.2 20.5% -8.1% INVESTED CAPITAL 602.4 592.8 1.6% NET FINANCIAL POSITION (94.8) (148.9) -36.3% NET FINANCIAL POSITION / EBITDA 0.5x 0.8x -44.1% EBITDA / NET FINANCIAL EXPENSES (***) 15.4x 30.4x -49.4% FREE CASH FLOW 162.9 60.0 171.4% CASH CONVERSION RATE FREE CASH FLOW / EBITDA 79.5% 33.3% 138.3% CAPEX % of sales revenue 42.3 3.5% 34.1 2.8% 23.9% SHAREHOLDERS’ EQUITY NET FINANCIAL POSITION / SHAREHOLDERS' EQUITY 507.6 0.19x 443.9 0.34x 14.4% ROI [EBIT / INVESTED CAPITAL] 24.0% 21.5% 11.5% Adjusted ROE [Adjusted NET PROFIT / NET EQUITY] 21.4% 22.9% -6.7% AVERAGE PERSONNEL EMPLOYED IN THE PERIOD 3,804 3,668 3.7%
SIGNIFICANT EVENTS IN THE 2023 FINANCIAL YEAR

In January 2023, Comer Industries S.p.A. along with its subsidiaries (hereinafter the "Group") entered the market for electric vehicle engines and transmissions through the acquisition of Benevelli Electric Powertrain Solutions and Sitem Motori Elettrici, later merged into e-comer S.r.l.
The deal, which came a year after the signing of an agreement to acquire 100% of Germany's Walterscheid (hereinafter "WPG") – among the industry leaders in propulsion systems and services for off-highway and industrial applications – allowed the Group to enter a fast-growing market, enriching the range of products offered through investments in cutting-edge and sustainable technologies.
Furthermore, during the year the Group began the process of listing on the regulated Euronext Milan market for medium-large cap companies.
This transfer (so-called translisting from the Euronext Growth Milan multilateral trading system to Euronext Milan) that took place on July 12, 2023 represents another strategic objective in the Group's growth and is aimed at boosting the Company's visibility in the financial markets and attracting more interest from institutional investors.
The main events that occurred during 2023 are detailed below:
On January 9, 2023, the parent company Comer Industries S.p.A. (the “Parent Company”) concluded the acquisition of e-comer S.r.l., a newly established company that on December 27, 2022 absorbed the business units of Benevelli Electric Powertrain Solutions and Sitem Motori Elettrici, for an Enterprise Value of 54 million euros plus a variable component (so-called earn out) estimated at 3.4 million euros as of December 31, 2023. This transaction resulted in a cash-out on the closing date of 50 million euros. The consideration paid for the transaction at the closing was financed by resorting to a medium- to long-term bank loan provided by Crédit Agricole Italia in the same amount. The remaining 4 million euros will be paid in four constant annual installments without interest starting from the 12th month following the date of the closing. The newly acquired e-comer S.r.l. has been consolidated since January 1, 2023.
In March 2023 the deed of merger by incorporation of Walterscheid Monguelfo S.p.A. into Comer Components S.r.l. was signed, with legal effect as of April 1, 2023 and with accounting and tax effects backdated to January 1, 2023. The reason and justification for the merger is the need to contain operating expenses and simplify the Group's corporate structure following the acquisition of WPG. The transaction has no accounting impacts on the consolidated financial statements.
11 COMER INDUSTRIES 1.1
On April 4, 2023, the Parent Company’s Board of Directors resolved to submit to the Shareholders' Meeting convened on April 20, 2023 the approval of i) the project for listing the Company's ordinary shares on Euronext Milan, ii) the adoption of new bylaws, with effect subject to the commencement of trading of the Company's ordinary shares on Euronext Milan, and iii) the proposal to grant the Board power to increase the share capital pursuant to Article 2443 of the Italian Civil Code.
On April 20, 2023 the Ordinary and Extraordinary Shareholders' Meeting of the Parent Company approved all items on the agenda including: i) the Financial Statements for the year 2022 and the distribution of a dividend of 0.75 euros per share, ii) the appointment of the Board of Statutory Auditors for the threeyear period 2023-2025, iii) the project for listing the Company's ordinary shares on Euronext Milan, iv) the delegation of authority to the Board of Directors to increase the share capital pursuant to Article 2443 of the Italian Civil Code, and v) the adoption of a new text of the Company's bylaws for the purpose of complying with current regulations on companies with shares traded on regulated markets, with effect subject to the commencement of trading of the Company's ordinary shares on Euronext Milan.
On May 4, 2023 the unaudited consolidated financial indicators for the first quarter ended March 31, 2023 were reviewed and approved.
On May 5, 2023 the shareholder Eagles Oak S.r.l. announced that as of the date of commencement of trading of Comer Industries S.p.A.'s shares on Euronext Milan it ceased to exercise direction and coordination over Comer Industries S.p.A.
On June 21, 2023 the Ordinary Shareholders' Meeting of Comer Industries S.p.A. resolved to adjust and supplement the assignment given to the Audit Firm with respect to the period 2021-2029 in view of the admission of the Shares to trading on Euronext Milan.
On July 5, 2023, with order no. 8958, Borsa Italiana S.p.A. ("Borsa Italiana") authorized admission to listing of the Company's ordinary shares (ISIN IT0005246191) on the Euronext Milan regulated market organized and managed by Borsa Italiana ("Euronext Milan") and ordered the simultaneous exclusion of trading on the Euronext Growth Milan multilateral trading system.
On July 7, 2023, with document no. 0063331/23 the National Commission for Companies and the Stock Exchange ("Consob") authorized the publication of the Prospectus (the "Prospectus") regarding the admission to trading of the Company's ordinary shares on the Euronext Milan regulated market.
On July 12, 2023 trading of the ordinary shares of Comer Industries S.p.A. began on the Euronext Milan regulated market organized and managed by Borsa Italiana S.p.A. with simultaneous exclusion thereof from trading on the Euronext Growth Milan multilateral trading system.
In July 2023 Evoluzione Comer s.r.l., a non-operating company wholly owned by the parent company, was put into liquidation. Also in July 2023, Comer GmbH was merged into the subsidiary WPG German HoldCo GmbH. These operations were carried out in pursuit of the goal of reducing operating costs and simplifying the corporate structure, but without any accounting impact on the consolidated financial statements.
On August 3, 2023 the audited Consolidated half-yearly financial report as of June 30, 2023 was approved.
On September 7, 2023 14,640,089 shares achieved an increase in voting rights (two voting rights for each share) pursuant to Article 5 of the Bylaws.
On October 17, 2023 1,700,000 shares achieved an increase in voting rights (two voting rights for each share) pursuant to Article 5 of the Bylaws.
On November 8, 2023 the unaudited Consolidated financial indicators for the first nine months ended September 30, 2023 were reviewed and approved.
12 2023 ANNUAL REPORT
On November 16, 2023 the ordinary Shareholders' Meeting approved the authorization to purchase treasury shares for a period of 18 months; on the same day, the Board of Directors approved the initiation of the first tranche of the share buyback program for a maximum of 10 million euros.
As part of the project to rationalize the production footprint, the Group informed trade unions that in May 2024 the staff of the Pegognaga (MN) Plant will be transferred to the Reggiolo (RE) plants.
13 COMER INDUSTRIES
THE GLOBAL MACROECONOMIC SCENARIO AND THE REFERENCE MARKET
MACROECONOMIC SCENARIO
Following the Covid-19 pandemic, Russia's invasion of Ukraine, and the sharp rise in inflation, the global economic recovery has proven surprisingly resilient. In its January 2024 World Economic Outlook the International Monetary Fund (IMF) forecasts global growth of 3.1% in 2024 and 3.2% in 2025, with the forecast for 2024 being 0.2 percentage points higher than in October 2023. However, the IMF points out that growth for the next two years will be lower than the historical average (2000-2019) of 3.8% due to higher benchmark rates by central banks needed to combat inflation and a decrease in fiscal support amid high debt burdens on global economic activity.
Inflation is falling faster than expected from its 2022 peak, with less impact on the economy, reflecting favorable developments both on the supply side – thanks to the resolution of pandemicera supply chain problems – and the tightening of central bank monetary policies, which have kept inflation expectations anchored.
Overall headline inflation is expected to fall from the current 6.8% at the end of 2023 to 5.8% in 2024 and 4.4% in 2025. With deflation and steady growth, the odds of an economic crisis (hard landing) have decreased, while those in favor of gradual global development (soft landing) have increased.
However, new surges in commodity prices due to geopolitical shocks – including continued attacks in the Red Sea – and supply disruptions or more persistent underlying inflation could prolong tight monetary conditions to the detriment of the economic recovery. The worsening of the real estate sector's difficulties in China, as well as any drastic cuts in government spending and fiscal increases could have negative effects on the future outlook.
Economic growth was stronger than expected in H2 2023 in the United States and several major emerging markets and developing economies. However, the growing momentum was not felt everywhere, with a particularly subdued recovery in the euro area, reflecting weak consumer confidence, the lingering effects of high energy prices, and weakness in manufacturing and business investment, which are particularly sensitive to interest rates.
As regards the main economies in which the group operates, the IMF expects America to grow by 2.1% in 2024, Europe by 0.9% (with Italy at +0.7% and Germany at +0.5%), China by 4.6%, India by 6.5% and Latin America by 1.9%, and in particular Brazil by 1.7%.
14 2023 ANNUAL REPORT 1.2
OVERVIEW OF THE WORLD ECONOMIC OUTLOOK PROJECTIONS
15 COMER INDUSTRIES YEAR OVER YEAR ESTIMATE PROJECTIONS 2022 2023 2024 2025 World Output 3.5 3.1 3.1 3.2 Advanced Economies 2.6 1.6 1.5 1.8 United States 1.9 2.5 2.1 1.7 Euro Area 3.4 0.5 0.9 1.7 Germany 1.8 - 0.3 0.5 1.6 France 2.5 0.8 1.0 1.7 Italy 3.7 0.7 0.7 1.1 Spain 5.8 2.4 1.5 2.1 Japan 1.0 1.9 0.9 0.8 United Kingdom 4.3 0.5 0.6 1.6 Canada 3.8 1.1 1.4 2.3 Other Advanced Economies 2.7 1.7 2.1 2.5 Emerging Market and Developing Economies 4.1 4.1 4.1 4.2 Emerging and Developing Asia 4.5 5.4 5.2 4.8 China 3.0 5.2 4.6 4.1 India 7.2 6.7 6.5 6.5 Emerging and Developing Europe 1.2 2.7 2.8 2.5 Russia - 1.2 3.0 2.6 1.1 Latin America and the Caribbean 4.2 2.5 1.9 2.5 Brazil 3.0 3.1 1.7 1.9 Mexico 3.9 3.4 2.7 1.5 World Consumer Prices 8.7 6.8 5.8 4.4 Advanced Economies 7.3 4.6 2.6 2.0 Emerging Market and Developing Economies 9.8 8.4 8.1 6.0
Source: World Economic Outlook, January 2024 Update
TARGET MARKET
The Comer Industries Group designs and produces advanced engineering systems and mechatronic solutions for power transmission, and divides its operations into two main areas depending on the use of the machines on which the supplied products are installed: (i) agricultural and (ii) industrial, which includes all other sectors including wind power and electricity.
AGRICULTURAL SECTOR
As for the agricultural market, 2023 was a year traveling in two different speeds. During the early part of the year the market continued to benefit from the trends that have supported the sector since the second half of 2021, i.e., after the end of the Covid-19 pandemic: (i) growth in farmers' demand for machinery and (ii) generalized price increases.
CEMA BUSINESS CLIMATE INDEX (CBI) - TOTAL
In contrast, during the second half of the year there was a rebalancing of the market after the business cycle highs reached in the spring of 2023.
The December 2023 general business climate index for the agricultural machinery industry in Europe (CEMA's business climate index) closed 2023 at -48 compared to the highs reached in February 2023 of +36 (on a scale of -100 to +100), showing a significant downward trend. Although current confidence levels for all European markets remain negative for the entire year of 2024, respondents expect their company's revenues to decline by an average of between 5% and 10%.
CBI = geometric mean of 1) evaluation of the current business situation and 2) turnover expectation; Index scale from -100 to +100; positive index for 1) = majority of respondents evaluates the current situation as favorable and vice versa; positive index for 2) = majority of respondents expects for the next six months an increasing turnover and vice versa (respectively compared to the previous year’s level)
Source: CEMA Business Barometer December 2023
16 2023 ANNUAL REPORT 80 60 40 20 0 -20 -40 -60 -80 2013-12 2019-12 2014-06 2014-12 2015-06 2015-12 2016-06 2016-12 2017-06 2017-12 2018-06 2020-06 2020-12 2021-06 2021-12 2022-06 2022-12 2023-06 2023-12 2018-12 2019-06 PRESENT SITUATION CBI FUTURE EXPECTATION -48
As for the North American market, however, the Association of Equipment Manufacturers AEM in its Ag Tractor and Combine Report for December 2023 reported an 8.2% decline in agricultural equipment sales (despite a 5.2% increase in the sub-index for tractors over 100HP) and a 1.7% growth in sales of combines.
The figure below shows that the American market was more resilient than the European market with 2023 sales substantially aligned with the average of the last 5 years (2018-2022) in the second half of the year.
Source: AEM United States Ag Tractor and Combine Report December 2023
predicts a trend between -10% and -15% in the various geographical areas, with Asia slightly less negative than the rest of the world. UNIT
Leading agricultural OEMs are feeling cautious about the market’s development in 2024. Specifically:
• In its annual report issued in November 2023 John Deere
Source: Deere & Company Forecast as of 22 November 2023
17 COMER INDUSTRIES
50 40 30 20 10 0 GEN FEB MAR APR MAY JUN JUL AUG SEP OCT NOV DEC 2020 5 YR (18-22) AVERAGE 2021 2022 2023 UNITED STATES UNIT RETAIL SALES 2-4WD TRACTORS & COMBINES SOUTH AMERICA AG (tractors and combine) 10% EUROPE AG 10% U.S and CANADA SMALL AG and TURF 5-10% U.S and CANADA LARGE AG 10-15% ASIA AG Down Moderately
SALES (000)
• In its annual report issued in early February 2024 AGCO is slightly more positive than its competitor, estimating instead a market contraction between 5% and 10%
Source: AGCO Fourth Quarter and Full Year 2023 Financial and Operational Results
• In its annual report issued in mid-February CNH estimates a 10% to 15% decline in overall sales for the agricultural sector in 2024.
INDUSTRIAL SECTOR
The industrial sector, whose performance is most closely linked to economic conditions and interest rate trends that favor investment, saw a slight improvement in early 2023 followed by a negative trend for the remaining part of the year, as shown by the Business Index trend published by the Committee for European Construction Equipment (CECE) in December 2023 (Fig. A), which was also confirmed by the decrease in orders in the second part of the year in both the European and non-European markets (Fig. B).
Respondents’ expectations in terms of market trends for the next six months differ according to the different geographical areas:
i) 65% expect the European market to be in the range of 0% to -10%;
ii) 71% expect the North American market to be in the range of 0% to +10%;
iii) 77% expect the Chinese market to be in the range of 0% to -10%; and
iv) 78% expect the Indian market to be in the range of 0% to +10%.
18 2023 ANNUAL REPORT
NORTH AMERICA WESTERN EUROPE SOUTH AMERICA 2023 2024E 2023 2024E 2023 2024E 106K DOWN ~10% 133K DOWN 5-10% 67K DOWN ~10%
Source: CECE Business Barometer January 2024
19 COMER INDUSTRIES 100 80 60 40 20 0 -20 -40 -60 -80 -100 2019-12 2020-12 2021-12 2022-12 2023-12 2018-12 CURRENT BUSINESS SITUATION BUSINESS INDEX FUTURE EXPECTATION 20 15 10 5 0 -5 -10 -15 -20 Jan 23 Feb 23 Mar 23 Apr 23 May 23 Jun 23 Oct 23 Sep 23 Aug 23 Jul 23 Nov 23 Dec 23 Dec 22
NON-EUROPEAN MARKETS EUROPEAN MARKETS Fig. A Fig. B
• Volvo, one of the leading OEM players in the industry, in its annual report issued in January 2024 for its Construction Equipment division sales for 2024 forecasts: i) Europe contracting between -10% and -20%, ii) North America in a range between 0% and -10%, iii) Asia (excluding China) contracting between -5% and -15%, and iv) China in a range between 0% and -10%; as indicated in the charts below.
Source: Volvo Fourth Quarter 2023
20 2023 ANNUAL REPORT 250 200 150 100 50 0 04 06 08 10 12 14 16 18 20 22 24 250 200 150 100 50 0 04 06 08 10 12 14 16 18 20 22 24 NORTH AMERICA 2023 YTD Nov: +7% Forecast 2024: -10% to 0% EUROPE 2023 YTD Nov: -1% Forecast 2024: -20% to -10% 250 200 150 100 50 0 04 06 08 10 12 14 16 18 20 22 24 250 200 150 100 50 0 04 06 08 10 12 14 16 18 20 22 24 ASIA (Excl. China) 2023 YTD Nov: +4% Forecast 2024: -15% to -5% CHINA 2023 YTD Nov: -40% Forecast 2024: -10% to 0%
• CNH expects the Construction Equipment sector as a whole to contract by about 10% in revenues versus 2023.
1.3
• In contrast, Caterpillar instead announced sales for 2024 that would be substantially in line with those for 2023, but did not provide a breakdown by geographic area.
COMMENTS ON KEY PERFORMANCE INDICATORS
Management uses certain performance indicators that are not identified as accounting measures under IFRS (non-GAAP measures) to enable a better assessment of the Group's economic, capital, and financial performance. The calculation performed by the Group may not follow the same method adopted by other groups, and therefore the indicators may not be comparable with those used by them. These performance indicators, determined in accordance with the provisions of the Guidelines on performance indicators issued by ESMA/2015/1415 and adopted by Consob with Communication no. 92543 of December 3, 2015, refer only to the performance of the accounting period covered by this Consolidated Annual Financial Report and the periods compared. The performance indicators should be regarded as complementary and not as a substitute for information prepared in accordance with IFRS. Below is a description of the main indicators adopted.
1.3.1 DEFINITION OF THE INDICATORS
The performance indicators used by the Group and disclosed in this report are based on the following definitions:
“EBITDA”: represents the value of Operating Profit adjusted by the amount of the following entries:
(+) Amortization, Depreciation and other write-downs of fixed assets, in particular:
• Amortization of intangible fixed assets;
• Depreciation of tangible fixed assets;
• Other write-downs of fixed assets;
“EBIT”: is the Operating Profit in the Consolidated Income Statement.
"Net profit": indicates the result of the Consolidated Income Statement.
"Adjusted EBIT": indicates the item Operating Income in the Consolidated Income Statement adjusted for depreciation and amortization resulting from the accounting – as required by IFRS 3 – of the purchase price in connection with the business combination transaction that took place at the end of 2021 related to the acquisition of WPG and at the beginning of 2023 for the acquisition of e-comer.
"Adjusted Net Profit": represents the Net Profit in the Consolidated Income Statement adjusted for depreciation and amortization and the related theoretical tax effects arising from the accounting – as required by IFRS 3 – of the purchase price in connection with the business combination transaction that took place at the end of 2021 related to the acquisition of WPG and at the beginning of 2023 for the acquisition of e-comer.
“Commercial working capital”: indicates the algebraic sum of the following balance sheet items:
(+) Current asset items: Inventories; Trade Receivables;
(-) Current liability items: Trade payables.
“Invested capital”: indicates the algebraic sum of the following balance sheet items:
(+) Commercial working capital;
21 COMER INDUSTRIES
(+) Tangible (including Rights of use), intangible and equity investments in other companies;
(+) Tax and deferred tax assets, current tax assets;
(+) Other short and long-term receivables, of a non-financial nature;
(
- ) Other short and long-term payables, of a non-financial nature;
(
- ) Current and deferred tax liabilities;
(
- ) Post-employment benefits in the short and long term and short- and long-term provisions.
“Net financial position”: indicates the algebraic sum of the following balance sheet items:
(+) Current Asset items (A):
• Other short-term financial receivables;
• Marketable securities at fair value;
• Cash and cash equivalents.
(-) Non-current and current liabilities (B):
• Long-term loans;
• Long-term derivative financial instruments;
• Short-term loans;
• Short-term derivative financial instruments;
• Other short- and long-term financial payables (including payables relating to lease contracts recognized in accordance with IFRS 16);
• Non-current trade payables.
The net financial position, determined in accordance with the provisions contained in Reminder no. 5/21 of April 29, 2021 issued by Consob, which refers to ESMA Guideline 32-382-1138 of March 4, 2021.
"Free cash flow": Indicates the algebraic sum of cash flow generated (absorbed) by operations and Net cash flow from investing/disinvesting activities in the Statement of Cash Flows.
"Cash conversion rate": represents the ratio of Free Cash Flow to EBITDA.
"Capex": indicates the increase occurring in investments in tangible and intangible fixed assets (net of revaluations, capital grants and the effects of currency conversion) which, following International Accounting Standards, are recorded in the corresponding heading in equity, excluding (i) the equity effects of internal capitalizations of costs for internally generated development activities and excluding (ii) the impacts related to the application of IFRS 16.
“Equity”: indicates the algebraic sum of Share capital, Share premium reserve, Treasury share reserve in the portfolio, Other reserves and Profits/losses corresponding to the total of the “Share capital and reserves” heading.
“ROI (return on investment)": ratio of EBIT to invested capital.
“Adjusted ROE (return on equity)": ratio of adjusted Net Profit to Net Equity.
“EPS (Earnings per share)”: ratio of Net Profit to average number of shares outstanding in the period of reference.
“Average staff in the year”: simple average on the basis of the workforce employed by the Group, including temporary workers.
The Group prepares the income statement according to the nature of costs and the Cash flow statement with the indirect method.
1.3.2 COMMENTS ON THE INDICATORS
The Group's consolidated revenues amounted to 1,223.9 million euros (-1.1% compared to the previous year), and this figure includes revenues from e-comer of 26.9 million euros, consolidated as of January 1, 2023.
Revenues generated abroad represent 90% of the total.
The depreciation of the US dollar and the Chinese yuan, the Group's main reference currencies, had a negative impact of 18.6 million euros. The amount of revenues at the same exchange rates as the previous year would have been 1,242.5 million euros (+0.4%).
The agricultural sector experienced a 6.7% decline in revenues, while the industrial sector closed the period with an 8.3% increase over the previous year. Net of the consolidation of e-comer, whose revenues are fully attributed to the industrial sector, growth would have been +2.5%.
EBITDA amounted to 205.0 million euros, equal to 16.7% of sales, compared to 180.0 million euros in the previous year (equal to 14.5% of sales), an improvement of 13.9%.
FY2023 includes the final accounting for the acquisition of e-comer in accordance with IFRS 3.
Net profit reached 94.0 million euros, corresponding to 7.7% of turnover compared to 90.7 million euros in the previous year (7.3%
22 2023 ANNUAL REPORT
of sales). Adjusted net profit, which excludes depreciation and amortization and the related theoretical tax effects attributable to the accounting of the business combinations of WPG and e-comer, amounted to 108.6 million euros (+6.7% compared to the previous year).
Earnings per share stand at 3.3 euros per share (3.2 euros per share in 2022).
Adjusted ROE, calculated on adjusted net profit, stood at 21.4% compared to 22.9% in the previous year.
The net financial position as of December 31, 2023 is shown below:
million euros. The balance as of December 31, 2023 includes 68.3 million euros of cash, 98.6 million euros of loans, net of up-front expenses, and 58.3 million euros of financial payables arising from the accounting treatment of leases in accordance with IFRS 16, in addition to other items. Of note are the numerous voluntary early repayment activities that reduced the amount of bank loans by 144.4 million euros during the year, which considering the increase in other financial debts by 6.8 million euros determines a decrease of indebtedness for 137.6 million euros.
Trade working capital was 19.1% of sales, lower than the 20.5% at the end of 2022, confirming the improvement of the operational processes implemented by the Group. The Group generated a Free Cash Flow of 162.9 million euros, which includes investments of 42.3 million euros. The Cash Conversion rate was 79.5% in the period just ended.
The net financial position shows a negative balance of 94.8 million euros, an improvement over the previous year of 54.1
1.4
INVESTMENTS
During fiscal year 2023, two new horizontal machining centers dedicated to cast iron flow and a new hobbing cell equipped with green technology free of cutting oil came on line at the Italian plant in Reggiolo. This hobbing cell is serviced by anthropomorphic robots and was dedicated to the steel flow for gear toothing. Both investments were interfaced with factory systems following the Industry 4.0 approach. As part of greening efforts, an investment was also made for the purchase of an industrial water treatment system that will come on line in the first half of 2024. Also at the Reggiolo plant an investment was made in a new
The parent company Comer Industries S.p.A. distributed dividends in the amount of 21.5 million euros in fiscal year 2023.
semi-automatic axle assembly line that will achieve full-speed production during the next fiscal year. This line is equipped with the latest production technology, i.e., cyber-physical system, software management and supervision.
With regard to the Italian plant in Monguelfo, a measuring machine for mechanical machining integrated with the closedloop production process went into operation.
At that same production site a new investment was made for an integrated steel component production line. This is a semiautomatic line that will come into operation in H1 2024.
23 COMER INDUSTRIES
DESCRIPTION (THOUSAND EUROS) DECEMBER 31, 2023 DECEMBER 31, 2022 CHANGE Cash and cash equivalents (68,333) (151,328) 82,995 Short-term loans 35,028 51,814 (16,786) Long-term loans 69,833 190,669 (120,836) IFRS 16 financial payables 58,304 57,792 512 Net Financial Position 94,831 148,947 (54,115)
In Germany during FY 2023, the plants in Sohland and Lohmar underwent several industrial investments. Of particular note at the Sohland plant is the purchase of a high-tech semi-automatic testing system for agricultural transmissions that will go into operation in the first half of 2024.
Also worth mentioning is the green, sustainable investment in the purchase and installation of electric vehicle charging stations.
The columns were installed in H2 2023.
At the Lohmar plant, a new robot cell for the production of mechanical steel components came on line during 2023, and a new automatic line for surface treatments of agricultural gimbals was also installed.
An investment was also made for the purchase of a new automated welding cell for mechanical components, which will be put into operation during the next fiscal year.
An investment was also made at the Lohmar plant for a new semi-automatic paint plant using water-based paint products, confirming the environmentally friendly approach adopted by the Group. The paint line is also equipped with all the latest paint application and production management technologies in order to optimize its output in terms of productivity, quality, and safety. Investments were also launched for the purchase of semiautomatic agricultural gimbal assembly lines.
1.5
RESEARCH AND DEVELOPMENT
The Group's research and development is carried out in design offices located in Italy, Germany and the United States, which are then validated and approved in four different specialized validation centers located in Reggiolo and Monguelfo in Italy, Lohmar in Germany and Rockford in the United States.
For the agricultural market, especially for tractor applications, the development and validation of the front axle for tractors up to 160hp and the development of a new size for machines up to 120hp have been completed. Also of note is the completion of the next-generation stabilizer for the rear hitch system.
Also in the agricultural field, of note is the development of the complete transmission system for combine harvesters, with products belonging to different lines (gearboxes, planetary, driveshafts) and the development of the quick-connect solution (Quick-fit) for cutter bars.
In China during 2023 in the Jiaxing plant, investments were made in masonry works and general plant engineering related to production facilities in order to industrialize new products and new production processes.
In addition, of note is the full-speed production of new semiautomatic assembly lines for the production and testing of agricultural and industrial transmissions. In the area of environmental sustainability, an investment was made to purchase an industrial water treatment system. This facility will come into full operation during the next fiscal year.
In India, a new manufacturing plant in Bangalore dedicated to the production of axles, gearboxes and double couplings was opened during 2023. Specifically, new assembly, machining, and quality control systems were installed for double joints and their components and assembly lines for axles and gearboxes. Of additional note is the commissioning of a new paint plant.
Finally, with regard to the US plants, several industrial investments were made during 2023. These include the commissioning of two machining cells for steel components and the purchase of additional machining centers that will enter full operation during the next fiscal year.
In the industrial field, the development of the category 2 axle for aerial platforms was completed, and the development of the category 3 axle for telescopic loaders began. Furthermore, the first prototype axles for electrified wheel loaders were delivered.
Prototypes were then developed of two new sizes of the nextgeneration industrial driveshaft range (30kNm / 40kNm) and a new size of the double joint range with superior torque performance (>10kNm).
In the renewable energy sector, of note is the completion of the validation of new sizes of slewing drives (140kNm and 190kNm) and the fail-safe system developed specifically for this application.
Finally, following the acquisition in early 2023 of the complementary electric transmission and motor business
24 2023 ANNUAL REPORT
units, Benevelli Electric Powertrain Solutions and Sitem Motori Elettrici, which were merged into e-comer S.r.l., the Group acquired the ability to further increase both its R&D capabilities and expertise and its product portfolio and the ability to make integrated products and systems for electrified transmissions and vehicles.
An early example of this synergy was the development of a gearbox equipped with an electric motor for rotating an
excavator that will be supplied as a prototype during 2024 to a major Group customer.
In the field of digitization, a new PLM (Product Lifecycle Management) system for the management of engineering processes and documents was set up during 2023, a system that will be extended to all the Group's engineering offices over the next year.
25 COMER INDUSTRIES
SOCIAL RESPONSIBILITY
Over the past few years, Comer Industries has been committed to supporting and advancing various sustainability and social responsibility initiatives, in line with the Sustainable Development Goals defined by the United Nations Organization. Generating a positive impact for economic, social and cultural development is a priority for the Company. Therefore education, health, innovation, environment, sports and culture are the main areas in which the Company believes most and invests to create value and opportunities for its employees and future generations.
Realizing that only starting from one's roots can one continue to grow, Comer Industries invests to develop the region it operates in and the surrounding communities through initiatives, programs, support activities, and partnerships.
The donation of two ambulances to the Reggiolo Committee of the Italian Red Cross is part of this commitment, a symbol of the company's attention to such an important issue as health, as well as a concrete gesture in support of the community and the local healthcare system, to make emergency services available to citizens more effective and efficient. In fact, the two Mercedes Sprinter 190hp ambulances are equipped with advanced medical devices and electro-medical equipment making them suitable both for basic operations and as mobile resuscitation units. Support for the world of education also begins with the awareness that we have an important responsibility to people, and Comer Industries' support of the International Industrial Research Doctorate in Reggio Childhood Studies, sponsored by the Reggio Children's Foundation and the Department of Education and Human Sciences at the University of Modena and Reggio Emilia, helps to create know-how and value for the future. It is an international research project dedicated to the Ateliers of Palazzo Sartoretti in Reggiolo, which complements and gives continuity to the now long-standing collaboration between Comer Industries, Reggio Children, the Municipality of Reggiolo and Azienda Servizi Bassa Reggiana, expanding the development possibilities of the educational and learning paths initiated in the past years, established with the aim of investigating the phenomena of mechanics and gears, welcoming various other collateral disciplines (graphic, digital, etc.) that merge within workshops and embrace numerous aspects of education and experimentation.
The projects related to education and training that the company strongly believes in also involve territories beyond the borders as evidenced by the now long-standing collaboration with the Volunteer Organization "Namaste, Honor to You," with which the Vidya Home project in Bangalore, India was initiated: a residence for deserving girls for whom the company provides room, board, university expenses and all the necessary resources so that they can cultivate their talents and become nurses. The partnerships with universities both in Italy and abroad and the Scuola2030 project, in collaboration with the Gazzetta di Reggio and Modena, respond to that outlook inherent in the Company's DNA of looking to the future and to the younger generations by allowing them to approach the world of metalworking while still in school.
The company's commitment to sustainability is also evident in its support of projects related to innovation, and Comer Industries' participation in Le Village by Crédit Agricole in Parma, the first Benefit Company of the Crédit Agricole Italia Group, as well as one of the first European innovation hubs to earn such recognition, is one more example of such support: an open ecosystem where on the one hand start-ups can take advantage of services to accelerate their business and work alongside structured realities, and on the other hand already-established industrial realities benefit from the collaboration with the start-ups in terms of know-how and innovative ideas implemented in their operations, taking advantage of new technologies as facilitators of business development.
As for the territory development activities aimed at fostering the well-being of employees, of note are the two partnerships in the field of sports with the amateur association of Carpi (Modena) Sessantallora, which promotes initiatives involving cycling, mountain biking and triathlons, and Padel Club Reggiolo. The "Jobbike" initiative, which kicked off at the Walterscheid headquarters in Lohmar, also espouses the same objective principles and values: a modern form of leasing bicycles for employees to use for work and personal use, aimed at motivating employees to switch from cars or public transportation to bicycles in order to have a positive impact on their health and the planet. Also in the area of sports, Walterscheid GmbH, a Comer Industries Group company, supported the "Walterscheid Cup," a youth soccer tournament organized by the SV 1919
26 2023 ANNUAL REPORT 1.6
club in Lohmar. Sustainability in Comer Industries also means preserving the scenic, artistic and cultural beauty of our country, therefore for years now the Company has been supporting FAI by participating in the Corporate Golden Donor membership
program. The ambition to do something tangible to promote sustainable development is strong and well integrated in the company's vision, driven by a desire to make a positive mark and create something new.
27 COMER INDUSTRIES
ENVIRONMENT, HEALTH AND SAFETY
In light of further expansion through the acquisition of e-comer at the beginning of the year, the Group confirmed its commitment to occupational health and safety by consolidating its performance.
In fact, in 2023 there was a significant reduction in the number of accidents, from 84 in 2022 to the current 54, with a corresponding 36% improvement in the frequency indicator. This was achieved by extending the preventive approach geared toward worker awareness and involvement to all Group operations and implementing various initiatives globally. These include the provision of training supported by videos representative of actual hazardous conditions within manufacturing facilities, and targeted actions to reduce the risks and improve the ergonomics of manufacturing infrastructure.
Of note is the result achieved by the Bangalore plant, which recorded no accidents for the third consecutive year.
During 2023 the Group intensified its commitment to environmental sustainability through various projects aimed at reducing its impact on the environment, which resulted in improved performance indicators.
With regard to energy consumption, there was a 17% reduction in the intensity index due to the reduction in electricity and natural gas consumption per unit worked. This achievement confirms the
process of progressively improving energy efficiency undertaken several years ago and also extended to the new plants.
The reduction in energy consumption combined with the purchase of electricity from renewable sources in Italy (Matera and Pegognaga) and China (Jiaxing) led to a parallel reduction in the Group’s Scope 1 and Scope 2 greenhouse gas emission intensity, which saw a 6% improvement.
Finally, there was a positive trend compared to the previous year in the percentage of hazardous waste, with a 5% reduction.
To promote the development of sustainable mobility, the Group has upgraded the existing network of electric vehicle charging systems by building new charging points at the Sohland production site.
No critical issues have emerged during the year with relation to the environment.
Please see the 2023 Non-Financial Statement for a detailed description of the Group's standards, specifically in the Employee Health and Safety Management System and commitment to corporate sustainability.
28 2023 ANNUAL REPORT 1.7
INTERGROUP RELATIONS AND DEALINGS WITH RELATED PARTIES
The Group has dealings with subsidiaries and other related parties at market conditions considered as normal in the respective reference market, taking account of the characteristics of the assets and the services provided.
Transactions between Comer Industries S.p.A. and its consolidated subsidiaries, which are entities related to the Company, are eliminated in the consolidated financial statements, and in compliance with IAS 24.
DEALINGS WITH PARENT COMPANIES
The Group does not have commercial or financial dealings with the majority shareholder, Eagles Oak S.r.l.
RELATIONS WITH OTHER RELATED PARTIES
It is disclosed that the "Other operating costs" heading includes professional consultancy provided by two Directors of the parent company Comer Industries S.p.A. for non-significant amounts.

29 COMER INDUSTRIES 1.8
THE COMPANIES IN THE GROUP
As of December 31, 2023, the Group is organized in a structure with Comer Industries S.p.A. at the top, possessing directly or indirectly 100% of 24 Italian and foreign subsidiaries that constitute the scope of consolidation.
The key figures of the consolidated subsidiary companies are summarized in the table below:
30 2023 ANNUAL REPORT 1.9
COMPANY COUNTRY % CONTROL MAIN ACTIVITY SHARE CAPITAL DECEMBER 31, 2023 SALES DECEMBER 31, 2023 MILLION EUROS NET EQUITY DECEMBER 31, 2023 MILLION EUROS HEADCOUNT DECEMBER 31, 2023 Comer Industries S.p.A. Italy Parent company Design, production and sales € 18,487,339 421.16 320.29 863 Comer Industries Components S.r.l. Italy 100% Production and sales € 7,125,000 164.95 45.95 421 e-comer S.r.l. Italy 100% Design, production and sales € 1,000,000 26.87 61.92 116 WPG German HoldCo GmbH Germany 100% Holding company € 10,495,000 - 25.89 0 Off-Highway Powertrain Services Germany GmbH Germany 100% Sales and after-sales service € 2,050,000 108.05 22.85 298 Walterscheid GmbH Germany 100% Design, production and sales € 17,895,000 193.74 77.44 758 Walterscheid Getriebe GmbH Germany 100% Design, production and sales € 25,600 63.48 6.93 239 Walterscheid Cardan GmbH Germany 100% Production and sales € 625,000 7.85 1.53 28 Comer Industries UK Ltd. UK 100% Sales £ 265,000 2.92 1.37 4 WPG UK HoldCo Ltd. UK 100% Holding company £ 3,093,000 - 21.00 0 Powertrain Services UK Limited UK 100% Holding company £ 14,231,000 - 4.07 0 Powertrain Services (UK Newco) Ltd. UK 100% Holding company - - 0.82 0 Powertrain Services France SAS France 100% Sales and after-sales service € 2,139,000 16.48 15.39 27 Walterscheid Russia LLC. Russia 100% Sales RUB 10,000 - 0.76 3 Comer Industries INC United States 100% Sales $ 13,281,000 119.28 25.54 34 WPG US Holdco LLC. United States 100% Holding company $ 58,546,000 - 19.33 0 Walterscheid Inc. Woodridge United States 100% Production and sales $ 2,000,000 67.08 30.16 186 Powertrain Rockford Inc. United States 100% Design, production and sales $ 1,000 90.49 72.59 197 Comer Industries do Brasil EIRELI Brazil 100% Sales BRL 6,112,000 14.19 8.23 8 Walterscheid Brasil Industria de Equipamentos Agricolas Ltda. Brazil 100% Production and sales BRL 8,410,000 10.99 1.05 59 Comer Industries (Jiaxing) Co. Ltd. China 100% Production and sales € 11,700,000 148.00 81.08 284 Comer Industries (Shaoxing) Co. Ltd. China 100% Production and sales € 6,720,000 4.25 5.24 2 Walterscheid Powertrain (China) Co. Ltd. China 100% Production and sales CNY 2,000,000 16.54 2.44 0 Comer Industries India Pvt. Ltd. India 100% Production and sales 145,090,000 INR 34.85 11.01 101
1.10
NON-FINANCIAL INFORMATION
Launched in 2019, the Group's Our Bright Impact sustainable development program is based on a commitment to contribute to the achievement of the Sustainable Development Goals, an integral part of the United Nations 2030 Agenda and a point of reference for building a strategy based on sustainability.
In declaring this commitment, the Group has chosen the path of progressive integration of programs and actions within its business model, applying criteria based on sustainability to its strategic choices and operations. Moreover, in order to give greater prominence to its commitment to a sustainable business model, even in previous years when it was not required to do so by Directive 2014/95/EU (Non-Financial Reporting Directive),
1.11
the Group had decided to communicate its sustainability performance in a structured manner through the publication of the Non-Financial Statement in accordance with the provisions of Italian Legislative Decree no. 254/2016 and the Global Reporting Initiative Sustainability Standards.
The 2023 Non-Financial Statement, now mandatory as a result of the translisting, contains information relating to environmental, social, personnel-related, respect for human rights, and the fight against corruption, useful to ensure an understanding of the activities carried out by the Group, its performance, its results, and their impact.
SIGNIFICANT EVENTS AFTER THE CLOSE OF THE YEAR AND BUSINESS OUTLOOK
As concerns the significant events after the end of the financial year, on February 3, 2024 the shareholders' agreement signed on December 1, 2021 and subsequently amended on June 14, 2023 between Comer Industries S.p.A., Eagles Oak S.r.l. and WPG Parent B.V. was terminated.
With regard to the foreseeable development of operations, note that the agricultural market has benefited from particularly sustained growth over the last year and a half, and is now facing a phase of decline in this excess demand, moving towards more limited growth rates aligned with historical trends. The sector was down in the final quarter of 2023 and is also expected to decrease in the first part of 2024, with expectations for a slight
improvement in the second half of the year. On the other hand, the industrial sector, after benefiting from the economic recovery to less of an extent, is expected to perform better than the agricultural sector.
Overall, Management expects 2024 sales to be in line with the forecasts of the market’s major OEM players mentioned above, and a margin slightly lower than what was recorded in 2023. Lastly, net of extraordinary transactions, the Group is expected to continue on its path of improving its net financial position thanks to the continuous generation of cash.
32 2023 ANNUAL REPORT
OPERATIONAL RISK MANAGEMENT
Below are the main operational risks inherent in the nature of business, such as risks related to climate change and information technology.
Furthermore, the Group is exposed to different types of business risk, as described in the Notes to this Consolidated Financial Report in Section 2.4 "Financial Risk Management."
CLIMATE CHANGE RISK
The Group works to achieve its goal of contributing to the fight against climate change through progressive alignment and adherence to the Recommendations of the TCFD-Task force on Climate-related Financial Disclosures.
In 2023 the spectrum of analysis was further expanded and updated, incorporating instances from new operating locations in light of recent acquisitions.
(I) SCENARIO ANALYSIS
The analysis was conducted considering the specifications of the 2017 Technical Supplement, The Use of Scenario Analysis in Disclosure of Climate-Related Risks and Opportunities.
The first phase involved a mapping of the current state on which to construct scenario assessments in terms of economic growth and exogenous factors, correlating them with potential levels of climate-changing gases (GHGs) released into the atmosphere.
Using 2022 as the base year, a medium-long time horizon to 2030 was assessed using two scenarios: the first corresponding to the goal of limiting global warming to 1.5°C (Net Zero 2050); the second aligned with the preservation of current policies (business as usual) and global warming greater than 2°C. The analysis was developed for the countries the Group's sites are located in: Brazil, China, Germany, India, Italy, UK, USA.
(II) GOVERNANCE
The BoD is responsible for strategic and organizational direction with respect to climate change and for verifying the adequacy of the organizational structure and resources needed. To manage the related risks and impacts, it relies on the Control, Risk and Sustainability Committee, which has proposing and support functions in setting environmental policies and monitoring the proper implementation of the strategy. The authority for the coordination of the strategy's implementation and assessment of risks and opportunities related to climate change management
is assigned to the Quality, Sustainability & Lean Development function. This function sets specific quantitative targets to be achieved each year for each individual site and each indicator based on the results achieved in the previous year and the medium- to long-term sustainability development plan. Each site develops an improvement plan defining projects, resources, and responsibilities. Progress is monitored monthly to update and revise the action plans and to manage progress and performance. The CEO receives monthly progress reports.
Specific indicators related to climate risk management aimed at monitoring and reporting quarterly to the CRSC and the BoD on the effectiveness of implemented mitigation plans are also being defined.
The Integrated Quality, Sustainability and Product Responsibility Policy is the key document that defines the modus operandi of the Company and expresses its commitment to the Sustainable Development Goals.
(III) RISK MANAGEMENT
The process is based on the scenario analysis described above in compliance with the Recommendations of the Task Force on Climate-related Financial Disclosures. The risk management system was supplemented by a timely analysis of risk factors related to climate change. The scope of analysis includes all the Group's sites.
Risk weighting and related mitigation actions were carried out through the tools and criteria provided in the Group's risk management model. The prioritization of climate risks is based on a specific Risk = Probability x Impact matrix, with which risks are classified into high, significant, medium and low in light of any prevention or mitigation measures that have already been applied. In accordance with the internal risk management procedure, specific mitigation plans are defined for risks classified as high and significant, while medium and low risks may be considered acceptable. Any action plans flow into the corporate ERM monitoring system. The mapping and assessment of significant physical climate risks relevant to the Group are carried out based on data and information inferred from specific models in the public domain and internationally recognized. For the classification of physical hazards reference was made to the table in Appendix A of Attachment I to Del. Reg. 2021/2139.
The mapping and assessment of significant and relevant
33 COMER INDUSTRIES 1.12
transitional climate risks for the Group was made possible through the direct involvement of function heads and management, as well as the characterization of sites according to their geographic area. The classification of transition risks was made considering those envisaged in the technical specification.
The regulatory framework applicable to the context and the impact on the Company's processes and products were also considered, especially the recently published legislation by the European Union aimed at combating carbon emissions (Carbon Border Adjustment Mechanism).
Finally, each of the risks identified was assigned an estimate of the related and residual financial impacts as a result of the application of the specific mitigation actions implemented.
For the financial quantification of acute and chronic physical climate risks, two economic quantities related to the organization's operations were identified and used according to the specific type of risk:
• Value of buildings and their contents (e.g., equipment, machinery, etc.) for each Group site. These values were derived from expert estimates or alternatively from the literature. In the latter case, the available values were updated considering inflation for the years in question.
• Turnover of the various Group companies and EBITDA. The expected economic damage was assessed in prospective terms by calculating the increase in damage up to 2030 based on two scenarios: net zero 2050 (corresponding to a global average temperature increase of 1.5°C) and delayed transition (corresponding to a global average temperature increase of 2°C).
The quantification of the financial impact related to transition climate risks was calculated using the proxy methodology based on the carbon price suggested by TCFD in the Guidance on Metrics, Targets and Transition Plan (October 2021).
See the chapter “Climate change and emissions management” in the Group's Non-Financial Statement for a more detailed discussion of the risks and opportunities identified.
(IV) STRATEGY
In a medium- to long-term perspective, the acquisition of Walterscheid required a new reflection on objectives and strategic choices, as it redefines the scope subject to corporate
sustainability performance measurement. This assessment took place during 2022, and the process of monitoring and mapping risks and opportunities took this new arrangement into account. While no risks above the internal threshold of acceptability were noted, a number of risks assessed as particularly financially impactful were identified, along with the relevant scenario and time horizon, for which see the chapter “Climate change and emissions management” in the Group's Non-Financial Statement.
(V) METRICS AND OBJECTIVES
The current climate change reporting system is summarized below:
• consumption of direct energy – GRI 302-1;
• direct and indirect emissions: (Scope 1 and Scope 2 GHG emissions) and other types of emissions relevant to the sector of reference (specifically CO, NOx, PM and SOV) - GRI 305-1, GRI 305-2 and GRI 305-7;
• Scope 3 GHG emissions: the areas currently measured are logistics (limited to the route from the Italian plants to the customers' premises), commuting (limited to the Italian plants), Group-wide waste treatment, and fuel- and energyrelated activities at each site – GRI 305-3;
• energy and emission intensity indices – GRI 302-3 and GRI 305-4.
A summary indicator of climate change-related risk is being prepared based on which quantitative targets will be set starting next year.
The objectives related to these indicators are reported and monitored in the 2030 Sustainable Development Plan.
CYBER & INFORMATION TECHNOLOGY RISK
The Group considers the operational continuity of its IT systems to be of great importance and has implemented risk mitigation measures in this regard aimed at ensuring network connectivity, data availability, and data security, while at the same time guaranteeing the processing of personal data in compliance with the European GDPR regulation and the national regulations applicable in individual EU member states. To this end, it has implemented and continues to optimize an Information Security Management System (ISMS).
34 2023 ANNUAL REPORT
Cybersecurity is a strategic priority for Comer Industries, which operates in an increasingly digitized and competitive environment. For this reason, a number of initiatives were implemented during 2023 to strengthen the security of infrastructure, data and processes, in accordance with ISO 27001 and the NIST framework.
The Group periodically provides training to personnel on the risks linked to the use of the Internet, social media and email and a process for assessing threats and the degree of resilience of existing systems against cyber attacks, also by performing vulnerability testing.
PROPOSAL FOR THE ALLOCATION OF PROFIT
The Board of Directors proposes the Shareholder’s Meeting to approve the distribution of a dividend of 1.25 euros for each share held at the date of approval. The dividend will be payable next May 15, 2024 (payment date) with an ex-date of May 13, 2024. In this case, all those registered as Comer Industries S.p.A.
shareholders at the end of the accounting day of May 14, 2024 (the record date) will be entitled to the dividend. The remainder of the profit for the year of the parent company Comer Industries S.p.A. equal to 4,854,003.36 euros will be allocated to the Extraordinary Reserve.
Reggiolo, March 13, 2024
For the Board of Directors

Matteo Storchi President & CEO
35 COMER INDUSTRIES
1.13
02
CONSOLIDATED FINANCIAL STATEMENTS AND EXPLANATORY NOTES
CONSOLIDATED BALANCE SHEET
38 2023 ANNUAL REPORT ASSETS (THOUSAND EUROS) Notes DECEMBER 31, 2023 DECEMBER 31, 2022 Non-current assets Tangible fixed assets 2.6.1 234,275 211,514 Intangible fixed assets 2.6.2 385,369 357,272 Equity investments in other companies 2.6.3 1,760 1,523 Tax assets and deferred tax assets 2.6.4 42,881 35,695 Other long-term receivables 2.6.5 1,119 1,407 Total 665,404 607,411 Current assets Inventories 2.6.6 226,596 244,906 Trade receivables 2.6.7 205,797 207,961 Other short-term receivables 2.6.7 8,953 8,250 Current tax assets 2.6.8 19,927 29,327 Cash and cash equivalents 2.6.9 68,333 151,328 Total 529,606 641,772 TOTAL ASSETS 1,195,010 1,249,183
39 COMER INDUSTRIES EQUITY AND LIABILITIES (THOUSAND EUROS) Notes DECEMBER 31, 2023 DECEMBER 31, 2022 Share capital and reserves Issued capital 18,487 18,487 Share premium reserve 187,881 187,881 Own shares in portfolio (147) 0 Other reserves 58,162 54,495 Accumulated profit (loss) 243,211 183,021 Retained earnings 149,176 92,305 Net profit 94,035 90,716 Total 2.6.10 507,594 443,884 Portion pertaining to minority interests -Total equity 2.6.10 507,594 443,884 Non-current liabilities Long-term loans 2.6.9 64,557 190,669 Other long-term financial payables 2.6.9 51,993 48,048 Deferred tax liabilities 2.6.11 54,338 62,371 Post-employment benefits 2.6.12 122,628 118,416 Other long-term payables 2.6.14 22,378 19,697 Long-term provisions 2.6.13 16,975 14,563 Total 332,869 453,764 Current liabilities Trade payables 2.6.14 198,842 198,630 Other short-term payables 2.6.14 32,168 34,758 Tax liabilities 2.6.15 29,966 23,173 Short-term loans 2.6.9 34,028 51,580 Short-term derivative financial instruments 2.6.9 0 234 Post-employment benefits short-term 2.6.12 7,859 5,792 Other short-term financial payables 2.6.9 12,586 9,744 Short-term provisions 2.6.13 39,098 27,624 Total 354,547 351,535 TOTAL LIABILITIES 1,195,010 1,249,183
CONSOLIDATED INCOME STATEMENT
40 2023 ANNUAL REPORT CONSOLIDATED INCOME STATEMENT (THOUSAND EUROS) Notes DECEMBER 31, 2023 DECEMBER 31, 2022 Sales revenues 2.6.17 1,223,938 1,237,576 Other operating revenues 2.6.18 5,922 6,929 Change in inventories of semi-finished and finished goods and WIP (18,309) 19,279 Purchase costs (648,127) (724,009) Personnel costs 2.6.19 (240,646) (243,644) Other operating costs 2.6.21 (115,174) (114,369) Write-downs of receivables and high risk provisions (2,623) (1,754) Amortization 2.6.1 – 2.6.2 (60,553) (52,491) OPERATING RESULT 2.6.22 144,428 127,517 Net financial income / (charges) 2.6.23 (15,264) (2,588) Profit before Tax 129,164 124,929 Income taxes 2.6.24 (35,129) (34,213) NET PROFIT 94,035 90,716 of which pertaining to minority interests -of which pertaining to the Group 94,035 90,716 Basic earnings per share (in euros) 2.6.25 3.28 3.16
CONSOLIDATED STATEMENT OF COMPREHENSIVE INCOME (THOUSAND EUROS) Notes DECEMBER 31, 2023 DECEMBER 31, 2022 Net profit 94,035 90,716 Other components of the comprehensive income/(loss) statement that will be reclassified to the profit/ (loss) in subsequent periods (net of taxes) Net (loss)/gain on cash flow hedges 509 (963) of which fiscal effect (122) 231 Translation differences on foreign financial statements (5,344) (3,866) Total other components of the comprehensive income/(loss) statement that may be reclassified to the profit / (loss) in subsequent periods, net of taxes (4,958) (4,598) Other components of the comprehensive income/(loss) statement that will not be reclassified to the profit / (loss) in subsequent periods, (net of taxes) Gain/(loss) on revaluation of defined benefit plans 2.6.12 (5,650) 39,320 of which fiscal effect 2.6.12 1,938 (12,828) Total other components of the comprehensive income/(loss) statement that will not be reclassified to the profit / (loss) in subsequent periods, net of taxes (3,712) 26,492 Total comprehensive profit after tax 85,365 112,610
CASH FLOW STATEMENT
42 2023 ANNUAL REPORT
(THOUSAND EUROS) Notes DECEMBER 31, 2023 DECEMBER 31, 2022 Cash flow from operating activities Profit (Loss) for the year 94,035 90,716 Adjustments for: Financial income and expenses and valuation exchange differences 15,264 2,588 Amortization of intangible fixed assets 2.6.2 20,603 17,942 Depreciation of tangible fixed assets 2.6.1 39,950 34,549 Net change in provisions for risks and charges 2.6.13 13,887 13,954 Net change in post-employment benefits 2.6.12 16 (1,651) Net change in deferred taxes (21,226) (6,544) Operating cash flow before changes in working capital 162,528 151,554 Change in inventories 2.6.6 25,051 (19,278) Change in trade receivables 2.6.7 4,926 (11,832) Change in trade payables 2.6.14 (3,676) (19,981) Change in other receivables (including current tax receivables) 9,759 (11,416) Change in other payables (including current tax payables) 2,227 (4,260) Net change in other non-current assets and liabilities 3,009 9,350 Cash flow generated (absorbed) by changes in working capital 41,296 (57,417) Cash flow generated (absorbed) by operations 203,825 94,137 CASH FLOW FROM INVESTMENT ACTIVITIES: (Investments) in intangible fixed assets 2.6.2 (3,462) (3,144) Disinvestments in intangible fixed assets 2.6.2 91
43 COMER INDUSTRIES (Investments) in tangible fixed assets 2.6.1 (38,816) (30,735) Disinvestments in tangible fixed assets 2.6.1 1,460 (Investments)/Divestments in equity investments 2.6.3 (237) (244) Net cash flow from investment/disinvestment activities (40,963) (34,123) Free cash flow 162,862 60,014 Net increases from business acquisition net of cash acquired 2.5.1 (49,830) 0 Business combinations (49,830) 0 CASH FLOW FROM FINANCING ACTIVITIES: Net change in current financial assets 0 803 Loans stipulated 2.6.9 0 69,000 Loans repaid 2.6.9 (147,495) (33,200) Net change in other current financial payables 2.6.9 (7,418) (9,508) Financial income and expenses and valuation exchange differences (14,115) (2,588) Dividends paid 2.6.10 (21,509) (14,339) Change in equity for translation reserve and other impacts 2.6.10 (5,490) (4,598) Cash flow generated (absorbed) by financial operations (196,027) 5,570 Increase (Decrease) in cash and cash equivalents (82,995) 65,584 Net cash and cash equivalents at the start of the year 151,328 85,744 Cash and cash equivalents at the end of the year 2.6.9 68,333 151,328 Change in cash and cash equivalents (82,995) 65,584
CONSOLIDATED STATEMENT OF CHANGES IN EQUITY
comprehensive profit/(loss): IAS 19.93A - Actuarial gains Components of the comprehensive profit/(loss): Changes in conversion reserve
of the comprehensive profit/(loss): Change in CFH reserve
of
comprehensive profit/(loss): Changes in conversion reserve
comprehensive profit/(loss): Change in CFH reserve
44 2023 ANNUAL REPORT
SHARE CAPITAL SHARE PREMIUM RESERVE RESERVE FOR OWN SHARES IN PORTFOLIO LEGAL RESERVE Net equity at January 1, 2022 18,487 187,881 2,622 Profit/(Loss) for the period
Components
Subtotal:
Distribution of dividends Allocation of 2021 profit 794 Net equity at December 31, 2022 18,487 187,881 3,416 Profit/(Loss) for the period Components of the comprehensive profit/(loss):
Components
Components
Subtotal: Res of
Distribution of dividends Allocation of 2022 profit 281 Purchase of own shares (147) Net equity at December 31, 2023 18,487 187,881 (147) 3,697
(THOUSAND EUROS)
Components of the
Res of comprehensive income/(loss) statement
IAS 19.93A - Actuarial gains
of the
the
comprehensive income/(loss) statement
45 COMER INDUSTRIES OTHER RESERVES RETAINED EARNINGS PROFIT/LOSS FOR THE YEAR TOTAL NET EQUITY EXTRAORD. RESERVE TRANSLATION RESERVE IAS 19 RESERVE F.T.A. RESERVE C.F.H. RESERVE CONSOLIDATION RESERVE 27,406 4,078 (5,923) 345 3,543 67,744 39,429 345,612 90,716 90,716 26,227 265 26,492 (3,866) (3,866) (732) (732) (3,866) 26,227 (732) 265 90,716 112,610 (14,339) (14,339) 38,635 (39,429) 27,406 212 26,227 (5,923) (387) 3,543 92,305 90,716 443,884 94,035 94,035 (3,712) (3,712) (5,344) (5,344) 387 387 (5,344) (3,712) 387 94,035 85,365 (21,509) (21,509) 12,055 78,379 (90,716) (147) 39,461 (5,132) 22,515 (5,923) 0 3,543 149,176 94,035 507,594
GENERAL INFORMATION
Comer Industries S.p.A. is an Italian company with headquarters and administrative offices in Via Magellano 27 in Reggiolo (RE), tax code and registration in the Company Register no. 07210440157 with resolved Share Capital of 18,487,338.60 euros fully subscribed and paid up as of December 31, 2023, divided into 28,678,090 ordinary shares. As of December 31, 2023, Comer Industries S.p.A. held 5,387 own shares equal to 0.02% of the share capital, purchased at a weighted average cost of 27.3625 euros.
Comer Industries is the leading global player in the design and manufacture of advanced engineering systems and mechatronics solutions for power transmissions. The company operates in the fields of agricultural machinery, construction, wind power, and electric vehicle motors and transmissions.
The Group consists of 24 companies, including 11 production companies located in Italy, Germany, the United States, China, India and Brazil, 8 trading companies operating in Germany, France, the UK, Russia, China, Brazil and the United States, and 5 holding companies.
As of July 12, 2023, the date on which Comer Industries S.p.A.'s shares begin trading on Euronext Milan, the exercise of direction and coordination by Eagles Oak S.r.l. over Comer Industries S.p.A. ceased.
The consolidated Financial Statements as of December 31, 2023, drafted on a going concern basis, with respect to which there are no aspects of uncertainty, were approved by the Board of Directors on March 13, 2024.
46 2023 ANNUAL REPORT 2.1
SCOPE OF CONSOLIDATION
Below are the main changes that took place in 2023.
On January 9, 2023, the parent company Comer Industries S.p.A. concluded the acquisition of e-comer S.r.l., a newly established company that on December 27, 2022 absorbed the business units of Benevelli Electric Powertrain Solutions and Sitem Motori Elettrici, for an Enterprise Value of 54 million euros plus a variable component ("Earn Out"), to be fully or partially recognized in a tranche subject to the achievement of certain profitability targets of e-comer S.r.l. in the 2023-2026 Sales Plan Period. This transaction, which resulted in a cash-out at the closing date of 50 million euros, is perfectly in keeping with the Group's strategy to enter the fast-growing market for electric vehicle engines and transmissions, expanding the range of products offered and further strengthening its leadership position in the market.
The consideration paid for the transaction at closing was financed by resorting to a medium- to long-term bank loan provided by Crédit Agricole Italia of the same amount. The remaining 4 million euros will be paid in four interest-free annual installments starting from the 12th month following the closing date. The newly-acquired e-comer S.r.l. was consolidated as from January 1, 2023, while the estimated earn out reflected in the consolidated financial statements as of December 31, 2023 based on information available as of that date amounts to 3.4 million euros.
In March 2023 the deed of merger by incorporation of Walterscheid Monguelfo S.p.A. into Comer Components S.r.l. was signed, with legal effect as of April 1, 2023 and with accounting and tax effects backdated to January 1, 2023. The reason and justification for the merger is the need to simplify the Group's corporate structure following the acquisition of the Walterscheid Group. The transaction has no accounting impacts on the consolidated financial statements.
On September 25, 2023, the parent company purchased the shares representing 100% of the share capital of Walterscheid Brasil Industria de Equipamentos Agricolas Ltda owned by the subsidiary Powertrain Services UK Ltd at a price of 100,000 euros. This transaction did not have any accounting impact on the consolidated financial statements.
On December 29, 2023, the Parent Company acquired the shares representing 100% of the share capital of Walterscheid Powertrain (China) Co. Ltd owned by the subsidiary WPG UK HoldCo Limited at a price of 10 Chinese renminbi. This transaction did not have any accounting impact on the consolidated financial statements.
On July 10, 2023, the Shareholders' Meeting passed a resolution to dissolve and put Evoluzione Comer S.r.l. into liquidation. The company ceased operations as of December 6, 2023, and was removed from the Commercial Register on January 10, 2024.
In July 2023 Comer GmbH was merged into WPG German HoldCo GmbH, again with no impact on the consolidated financial statements.
Walterscheid Russia LLC has been inactive since April 2022.
As of the date of these consolidated financial statements, the main shareholder of the Parent Company is Eagles Oak S.r.l. with a 51.05% stake in the share capital and 65.04% of the voting rights.
With regards to the summary of economic-asset/liability relations with related parties of the Group, reference should be made to the details in the Director's Report.
The scope of consolidation as at December 31, 2023 includes the Parent company and the following subsidiaries:
47 COMER INDUSTRIES 2.2
48 2023 ANNUAL REPORT ENTITY NAME REGISTERED OFFICE CURRENCY SHARE CAPITAL APPROVED % CONTROL PARENT COMPANY Comer Industries S.p.A. Reggiolo (RE), Italy KEUR 18,487 Holding company Eagles Oak S.r.l. Comer Industries Inc. Charlotte, NC, USA KUSD 13,281 100 Comer Industries S.p.A. Comer Industries U.K. Ltd. Leicester, United Kingdom KGBP 265 100 Comer Industries S.p.A. Comer Industries Components S.r.l. Matera, Italy KEUR 7,125 100 Comer Industries S.p.A. Comer Industries (Shaoxing) Co. Ltd. Shaoxing, China KEUR 6,720 100 Comer Industries S.p.A. Comer Industries do Brasil EIRELI Limeira (SP), Brazil KBRL 6,112 100 Comer Industries S.p.A. Comer Industries India Pvt Ltd. Bangalore, India KINR 145,090 95 Comer Industries S.p.A. 5 Comer Industries Components S.r.l. Comer Industries (Jiaxing) Co. Ltd. Jiaxing, China KEUR 11,700 65.8 Comer Industries (Shaoxing) Co. Ltd. 34.2 Comer Industries S.p.A. e-comer S.r.l. Reggiolo (RE), Italy KEUR 1,000 100 Comer Industries S.p.A. WPG German HoldCo GmbH Lohmar, Germany KEUR 10,495 100 Comer Industries S.p.A. WPG UK HoldCo Ltd. Leek, United Kingdom KGBP 3,093 100 Comer Industries S.p.A. WPG US HoldCo LLC Rockford, IL, USA KUSD 58,546 100 Comer Industries S.p.A. Off-Highway Powertrain Services Germany GmbH Lohmar, Germany KEUR 2,050 89.9 Walterscheid GmbH 10.1 WPG German HoldCo GmbH Walterscheid GmbH Lohmar, Germany KEUR 17,895 100 WPG German HoldCo GmbH Walterscheid Getriebe GmbH Sohland, Germany KEUR 26 89.84 Walterscheid GmbH 10.16 WPG German HoldCo GmbH Walterscheid Brasil Industria de Equipamentos Agricolas Ltda Cachoeirinha, Brazil KBRL 8,410 100 Comer Industries S.p.A. Walterscheid Powertrain (China) Co. Ltd. Jiangsu, China KCNY 2,000 100 Comer Industries S.p.A. Powertrain Services France SAS Chanteloup-les-Vignes, France KEUR 2,139 100 Off-Highway Powertrain Services Germany GmbH Walterscheid Russia LLC Moscow, Russian Federation KRUB 10 50 Powertrain Services UK Limited 50 Powertrain Services (UK Newco) Ltd. Powertrain Services UK Limited Leek, United Kingdom KGBP 14,231 100 WPG UK HoldCo Ltd. Powertrain Services (UK Newco) Ltd. Leek, United Kingdom KGBP - 100 Powertrain Services UK Limited Walterscheid Inc. Woodridge Woodridge, IL, USA KUSD 2,000 100 WPG US HoldCo LLC Powertrain Rockford Inc. Rockford, IL, USA KUSD 1 100 WPG US HoldCo LLC Walterscheid Cardan GmbH Irxleben, Germany KEUR 625 100 Walterscheid GmbH Matsui Walterscheid Ltd. Koga, Japan KJPY - 40 Walterscheid GmbH
ACCOUNTING STANDARDS ADOPTED
2.3.1 DECLARATION OF COMPLIANCE WITH IFRS
The consolidated financial statements of Comer Industries have been drawn up in compliance with the International Financial Reporting Standards (IFRS), issued by the International Accounting Standards Board (“IASB”) and approved by the European Union and in force at the balance sheet date, as well as the Consob (Commissione Nazionale per le Società e la Borsa) orders issued in implementation of Article 9 of Italian Legislative Decree no. 38/2005 (resolutions 15519 and 15520) of July 27, 2006 and the DEM/6064293 communication of July 28, 2006, pursuant to art. 78 of the Issuers’ Regulations, the EC document of November 2003 and, where applicable, the Italian Civil Code. "IFRS" also refers to the International Accounting Standards ("IAS") still in force, as well as all the interpretive documents issued by the IFRS Interpretations Committee, previously called the International Financial Reporting Interpretations Committee ("IFRIC") and before that, the Standing Interpretations Committee ("SIC").
2.3.2 CONTENTS AND FORM OF THE CONSOLIDATED FINANCIAL STATEMENTS
The unit of currency used is the Euro, and all values are expressed in thousands of euros unless otherwise indicated.
The presentation layout for the consolidated balance sheet makes a distinction between current and non-current assets and liabilities, in which:
• non-current assets include balances of assets realizable after more than one year and include intangible, tangible and financial assets and deferred tax assets;
• current assets include the balances of assets realizable within 1 year;
• non-current liabilities include payables falling due after more than 1 year, including financial debts, provisions for liabilities and charges and liabilities for employee benefits and deferred tax liabilities;
• current liabilities include payables falling due within 1
year, including the short-term portion of medium-longterm loans and of provisions for liabilities and charges and liabilities for employee benefits.
The consolidated income statement is presented according to a “costs by nature” classification.
The cash flow statement has been drawn up on the basis of the indirect method and is presented in compliance with IAS 7, classifying cash flows between operating, investment and financing activities.
It should be noted that, with reference to Consob resolution no. 15519 of July 27, 2006 and the DEM6064293 communication of July 28, 2006, details of significant dealings with related parties are disclosed on the financial statements in order to provide more complete information.
2.3.3
RELEVANT ACCOUNTING STANDARDS
The Comer Industries S.p.A. Group adopted International Accounting Standards and International Financial Reporting Standards as of 2007, with the transition date to IFRS effective January 1, 2006.
Continuing these principles, the consolidated financial statements as of December 31, 2023, were therefore drawn up according to the IAS / IFRS adopted by the European Union.
The consolidated financial statements are presented in thousands of euros. The financial statements are prepared on a cost basis, except for financial instruments that are measured at fair value.
The preparation of the financial statements in accordance with IFRS (International Financial Reporting Standards) requires judgments, estimates and assumptions that have an effect on the assets, liabilities, income and expenses. The actual results may differ from the results obtained using these estimates.
The accounting policies have been applied consistently in all Group companies and for all periods presented.
49 COMER INDUSTRIES 2.3
2.3.4
PRINCIPLES OF CONSOLIDATION
(i) Subsidiaries
Companies are defined subsidiaries when the parent company has the authority, directly or indirectly, to conduct business so as to obtain benefits from such activities. In defining control, consideration is also given to potential voting rights that can currently be freely exercised or converted. These potential voting rights are not taken into account for the purposes of the consolidation process upon allocation to minority shareholders of the results of operations and the share of capital and reserves they are entitled to.
The financial statements of subsidiaries are consolidated from the date on which the Group gains control and deconsolidated from the date that this controlling interest ceases.
The global integration method is adopted for the consolidation of subsidiaries, involving undertaking the total amount of assets and liabilities and all costs and revenues, irrespective of the extent of the Group's interest. The book value of consolidated equity investments is therefore offset against any relative capital and reserves. The shares of capital and reserves and profits pertaining to minority shareholders are shown separately under a specific capital and reserve item and on a separate line of the consolidated income statement. Intercompany dividends distributed by foreign subsidiaries are eliminated in the consolidation process using the proportionate approach provided for by IAS 21, since, even in the case of distribution of profit reserves generated in previous years, the investor’s percentage equity ownership is not considered to be affected.
(ii) Related companies
Related companies are those companies over which the Group has considerable influence but in which it does not exercise any control over the management. The consolidated financial statements include the accrued share of the profits and losses of related companies, measured using the equity method from the date on which any such significant influence on operation started until its termination. Similar to that described above for the subsidiaries, the acquisition of related companies is also recorded under the purchase method; in this case, any acquisition cost in excess of the Group's share of the fair value of net assets acquired is included in the value of the equity investment.
(iii) Transactions eliminated in the consolidation process
Intercompany balances and profits and losses resulting from intercompany transactions are eliminated in the consolidated financial statements. Profits arising from intercompany transactions with associated companies are eliminated as part of the valuation of the equity investment using the equity method. Intercompany losses are eliminated only if there is evidence that these were realized in detriment to third parties.
2.3.5
SEGMENT INFORMATION
Segment information is provided for the two business segments with reference to income data only, as the related balance sheet data are not monitored by the Group’s Management. The information includes both costs directly attributable and costs allocated according to reasonable assumptions. General and administrative costs, ICT and HR services, fees for directors, statutory auditors and Group management departments, as well as costs relating to the global sourcing area (organized according to purchasing group of product category) have been allocated to sectors on the basis of revenues.
The Group operates in the following sectors:
• Agricultural sector . This mainly consists of speed increasers, speed reducers, bevel gearboxes, PTO driveshafts, wheel drives and axles for agricultural use, especially manufacturers of combine harvesters and tractors, haymaking, harvesting, irrigation and mixing, and land preparation and working machines.
• Industrial sector . This includes products such as modular planetary drives, travel and hoist drives, slew drives and rigid and steering axles for construction and forestry machinery manufacturers, from the shipbuilding to the airport building and mining industries. Components for municipalities, for the extraction industry and material handling sectors. Products for the wind power and renewable energy sector as well as for driving the augers of biogas machines. Electric motors for stationary industrial applications, transaxle and geared motors for e-Mobility, construction, material handling and logistics.
50 2023 ANNUAL REPORT
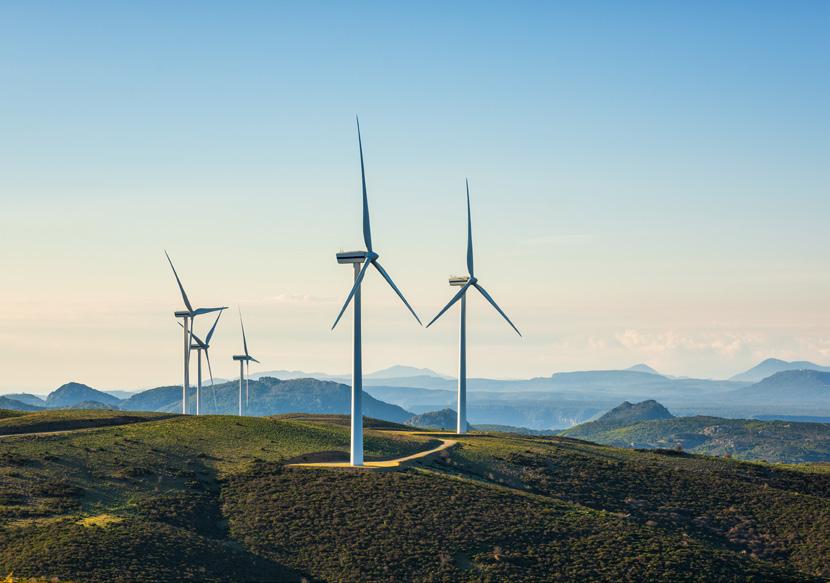
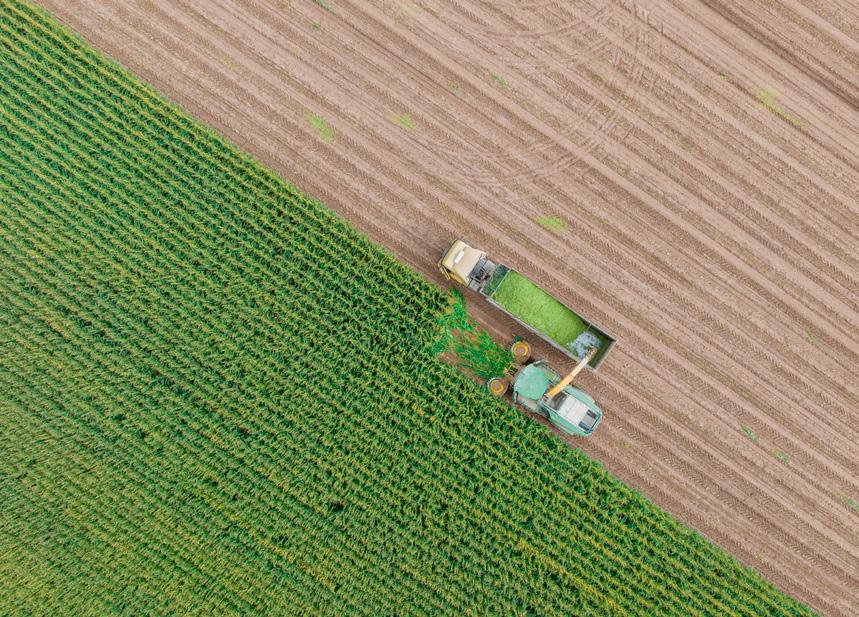
2.3.6 TREATMENT OF FOREIGN CURRENCY TRANSACTIONS
(i) Foreign currency transactions
The functional currency and reporting currency adopted by Comer Industries Group is the Euro. Transactions in foreign currencies are converted into Euro on the basis of the exchange rate at the transaction date. The monetary assets and liabilities are converted at the exchange rate on the balance sheet date. Any exchange rate differences arising out of conversion are recognized in the income statement. Non-monetary assets and liabilities measured at historical cost are converted at the exchange rate at the transaction date. The monetary assets and liabilities measured under fair value are converted into euro at the exchange rate on the date the fair value was determined.
EXCHANGE RATES
Source: Bank of Italy
The latest available exchange rates were used for the €/RUB exchange rate.
(ii) Conversion of financial statements drawn up in foreign currencies
The assets and liabilities of companies based in non-EU countries, including adjustments arising from the consolidation process, relating to goodwill and fair value adjustments arising from the acquisition of a non-EU company, are converted at the exchange rate prevailing on the closing date of the balance sheet. Revenues and costs of these companies are converted at the average exchange rate for the period, closest to the exchange rates on the dates on which the individual transactions took place. Foreign exchange differences arising from the conversion process are recorded directly in a special provision under capital and reserve called the conversion reserve.
Below is the table with the exchange rates applied for the conversion of financial statements:
52 2023 ANNUAL REPORT
SPOT EXCHANGE RATES AVERAGE ANNUAL EXCHANGE RATES DECEMBER 31, 2023 DECEMBER 31, 2022 2023 2022 €/GBP 0.869 0.887 0.870 0.853 €/USD 1.105 1.067 1.081 1.053 €/CNY 7.851 7.358 7.660 7.079 €/BRL 5.362 5.639 5.401 5.440 €/INR 91.905 88.171 89.300 82.686 €/CHF 0.926 0.985 0.972 1.005 €/CZK 24.724 24.116 24.004 24.566 €/DKK 7.453 7.437 7.451 7.440 €/JPY 156.330 140.660 151.990 138.027 €/NOK 11.241 10.514 11.425 10.103 €/RUB 115.484 115.484 88.397 88.397 €/SEK 11.096 11.122 11.479 10.630 €/HUF 382.800 400.870 381.853 391.287 €/PLN 4.340 4.681 4.542 4.686
2.3.7 ACQUISITIONS
Business combinations are recognized according to the acquisition method.
According to this method, the consideration transferred in a business combination is measured at fair value, calculated as the sum of the fair values of the assets transferred and the liabilities assumed by the Group at the acquisition date. Any transaction costs are recognized in the income statement at the time they are incurred.
Goodwill is determined as the excess of the sum of the consideration transferred in the business combination, the value of shareholders' equity pertaining to minority interests, and the fair value of any equity investment previously held in the acquired company over the fair value of the net assets acquired and liabilities assumed at the acquisition date. If the value of the net assets acquired and liabilities assumed at the date of acquisition exceeds the sum of the consideration transferred, the value of shareholders' equity pertaining to minority interests, and the fair value of any equity investment previously held in the acquired company, this excess is immediately recognized in the income statement as income from the transaction concluded. The portions of shareholders' equity of non-controlling interests at the date of acquisition may be measured at fair value or at the pro-rata value of the net assets recognized for the acquired company. The choice of valuation method is made on a transaction-by-transaction basis. If the initial values of a business combination are incomplete at the balance sheet date that the business combination occurred on, in its consolidated financial statements the Group reports the provisional values of the items for which recognition cannot be completed. These provisional values are adjusted during the measurement period to reflect new information gathered about facts and circumstances existing at the acquisition date which, if known, would have affected the value of the assets and liabilities recognized at that date.
2.3.8 PROPERTY, PLANT AND EQUIPMENT
(i) Owned fixed assets
Property, plant and equipment are measured at historical cost and are reported net of depreciation (see next point (iv)) and impairment losses (see para. 2.3.10). The cost of fixed assets manufactured internally includes materials, direct labor and a share of indirect manufacturing costs. The cost of fixed assets, whether purchased externally or manufactured internally, includes incidental costs directly chargeable and necessary to operate the asset and, when relevant and subject to contractual obligations, the current value of the estimated cost for the dismantling and
removal of fixed assets.
Financial charges relating to specific loans used for the acquisition of tangible fixed assets are charged to the income statement on an accruals basis. According to the provisions of IAS 20, any capital grants obtained as a result of investment incentives granted by the public administration are deducted from the historical cost of any related capitalized fixed assets, when put into operation. No fixed assets are available for sale.
(ii) Fixed assets under finance leases
Assets held by the Group under leasing contracts, including operating leases, in accordance with the IFRS 16 standard in force since January 1, 2019, are recognized as assets with a balancing entry in financial payables. In particular, assets are recognized at a value equal to the current value of future payments at the date of signing the contract, discounted using the applicable incremental borrowing rate for each contract.
(iii) Subsequent costs
The costs of replacing certain parts of the fixed assets are capitalized when it is probable that these costs will result in future economic benefits and can be reliably measured. All other costs, including the costs of maintenance and repairs, are attributed to the income statement as incurred.
(iv) Depreciation
Depreciation is charged to the income statement on a straightline basis and on the estimated useful life of fixed assets and their residual possible use. Land is not depreciated. The estimated useful life results in the following depreciation rates by homogeneous category:
53 COMER INDUSTRIES
Buildings 2.5% - 3% Light construction, general and specific equipment 10 - 15.5% Equipment, models and molds 20 - 25% Furniture and furnishings 12% Electronic office equipment 18 - 20% Motor vehicles and internal transport 20 - 25%
The estimated useful life of assets is revised annually and any changes in rates, where necessary, are made prospectively.
For assets purchased and/or that became operational during the year, depreciation is calculated using the rates set out above, but adapted pro-rata temporis to any such set-up date.
2.3.9
OTHER INTANGIBLE FIXED ASSETS
(i) Research and development costs
The costs of research with the aim of acquiring new technical knowledge are charged in the income statement when incurred.
The development costs incurred for the creation of new products, versions, accessories or new production processes are capitalized when:
• these costs can be reliably determined;
• these products, versions or processes are technically and commercially feasible;
• the expected volumes and realization values indicate that the costs incurred for development will generate future economic benefits;
• the resources to complete the development project exist.
The capitalized cost includes the materials and the mere cost of direct labor. Other development costs are charged to the income statement when incurred. The capitalized development costs are measured at cost, net of accumulated amortization, (see next point (iv)) and impairment losses (see para. 2.3.10).
(ii) Other intangible fixed assets
Other intangible fixed assets, which all have finite useful lives, are measured at cost and are recorded net of accumulated amortization, (see next point (iv)) and impairment losses (see para. 2.3.10).
The use of software licenses is amortized over their period of use (3-5 years).
The costs incurred internally for the creation of trademarks or goodwill are charged to the income statement when incurred.
(iii) Subsequent costs
Subsequent costs incurred for intangible fixed assets are capitalized only if they increase the future financial benefits of the specific capitalized fixed asset, otherwise they are charged in the income statement as incurred. Incidental financing costs.
(iv) Depreciation
Amortization is charged to the income statement on a straightline basis based on the estimated useful life of the capitalized fixed assets. The estimated useful lives are as follows:
The useful life is reviewed annually and any changes in rates, where necessary, are made prospectively.
2.3.10
IMPAIRMENT OF ASSETS
The book values of the assets, except for stocks, financial assets regulated by IFRS 9 and deferred tax assets, are subject to review at the balance sheet date, in order to determine if any impairment indicators exist. If the assessment reveals the presence of such indicators, the estimated realizable value of the asset is calculated in the manner indicated below. Please note that the estimated realizable value of goodwill and intangible fixed assets not yet used is estimated at least once per year, or more frequently if events indicate the possibility of a loss of value.
A tangible or intangible asset, including rights of use (as defined by IFRS 16), suffers an impairment if it is not able to recover the book value at which the asset is recorded in the financial statements through the use or sale thereof. The purpose of the verification (impairment test) provided by IAS 36, is to ensure that tangible and intangible fixed assets are not carried at a value higher than their realizable value, consisting of the net realizable value or value in use, whichever is higher.
The value in use is the current value of future financial flows that are expected to be generated by the asset or by the cash generating unit to which the asset belongs. Expected cash flows are discounted using a pre-tax discount that reflects the current market estimate of the cost of money reported at the time and risks specific to the asset. If the book value is higher that the realizable value, the assets or cash-generating unit to which they
54 2023 ANNUAL REPORT
Patents and trademarks 5 years Development costs 3-5 years Licensing of software 5 years
belong are written down to reflect the realizable value. These impairment losses are recognized in the income statement. If the conditions that led to the impairment cease to exist, the assets previously written down are proportionally reversed until reaching at most the value that the assets would have had in the absence of previous impairments, net of amortization calculated on the historical cost. Restorations of value are recognized in the income statement.
The goodwill value previously written down can never be reinstated.
2.3.11 EQUITY INVESTMENTS
Equity investments in associates are measured using the equity method, as required by IAS 28.
If impairment with respect to the amount determined using the above method is detected, the equity investment is written down accordingly.
2.3.12 CASH AND CASH EQUIVALENTS
Cash and cash equivalents include cash on hand, bank and postal deposits and securities with an original maturity of less than three months.
2.3.13
CURRENT FINANCIAL ASSETS, RECEIVABLES AND OTHER ASSETS
Financial assets, as provided for by the new IFRS 9 – “Financial Instruments: recognition and measurement” (as revised in July 2014) which replaces IAS 39 - "Financial Instruments: Recognition and Measurement", are classified, on the basis of the Group's management methods and the related contractual cash flow characteristics, in the following categories:
• Amortized cost: financial assets held exclusively for the purpose of collecting the contractual cash flows are classified in the Amortized cost category. They are valued using the amortized cost method, recording the income in the income statement using the effective interest rate method;
• Fair value through other comprehensive income ("FVOCI"): financial assets whose contractual cash flows are represented exclusively by the payment of principal and interest and which are held in order to collect the contractual cash flows as well as the flows deriving from the sale of the same are classified in the FVOCI category. They are measured at fair value. Interest income, exchange rate gains/losses, impairment losses (and related write-backs) of financial assets classified in the category FVOCI, are recorded in the income statement; other changes in the fair value of assets are recorded among the other components of OCI. When these financial assets are sold or reclassified to other categories, due to a change in the business model, the cumulative gains or losses recognized in OCI are reclassified to the income statement;
• Fair value through profit or loss ("FVTPL"): the FVTPL category is residual in nature by collecting financial assets that do not fall under the Amortized cost and FVOCI categories, such as financial assets purchased for trading or derivatives, or assets designated as FVTPL by management at the date of initial recognition. They are measured at fair value. Gains or losses resulting from this measurement are recognized in the income statement;
• FVOCI for equity instruments: financial assets represented by equity instruments of other entities (i.e. investments in companies other than subsidiaries, associates and joint ventures), not held for trading purposes, can be classified in the FVOCI category. This choice can be made instrument by instrument and requires changes in the fair value of these instruments to be recognized in the OCI and not to be reversed to the income statement either on sale or on impairment of the same. Only dividends from these instruments will be recognized in the income statement. The fair value of financial assets is determined on the basis of quoted bid prices or through the use of financial models. The fair value of unlisted financial assets is estimated using specific valuation techniques adapted to the specific situation. Valuations are regularly carried out in order to verify whether there is objective evidence that a financial asset or group of assets may be impaired. If there is objective evidence, the impairment loss is recognized as a cost in the income statement for the period.
55 COMER INDUSTRIES
2.3.14 DERIVATIVE FINANCIAL INSTRUMENTS
If the Group holds derivative financial instruments that do not meet all the conditions for hedge accounting as per IFRS 9, the changes in the fair value of these instruments are recorded in the income statement as financial expenses and/or income.
Therefore, the derivative financial instruments are recorded in compliance with the hedge accounting regulations when:
• the hedge ratio is formally designated and documented at the beginning of the hedge;
• it is presumed that the hedge is highly effective;
• the effectiveness can be reliably measured and the hedge itself is highly effective during the designated periods.
The fair value of derivative financial instruments against exchange risks (forward) is their market value on the balance sheet date, which coincides with the discounted market value of the forward.
The accounting method for derivative financial instruments
varies depending on whether or not the conditions and requirements of IAS 9 are met.
Specifically:
(i) Cash flow hedges
In the case of a derivative financial instrument for which the hedging ratio to variations in cash flows generated by an asset or liability or a future transaction (underlying hedged item) believed to be highly probable and that could affect the income statement is formally documented, the effective portion, originating from the adjustment of the derivative financial instrument to the fair value, is charged directly to a reserve under capital and reserves. When the underlying hedged cash flow occurs, any such reserve is removed from capital and reserves and assigned to the income statement as operating charges and revenues, while any non-effective portion or over hedging, portion is immediately allocated to the income statement as financial charges and/or income.
When a hedging instrument reaches maturity, is sold or exercised, or the company changes the relationship with the underlying hedged item, and the forecast transaction, though it has yet to
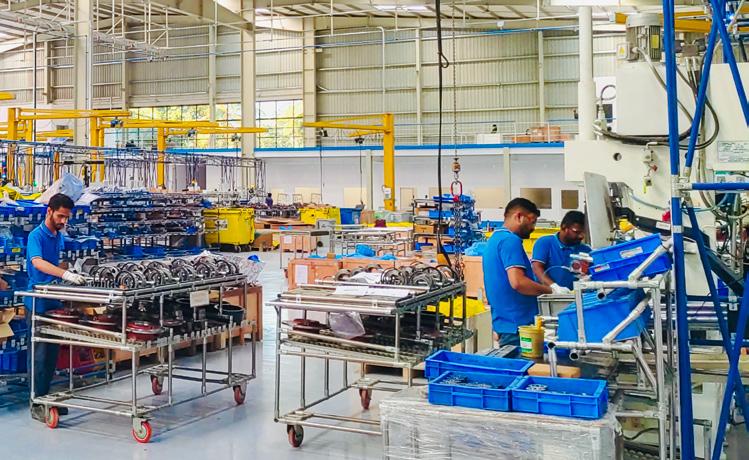
56 2023 ANNUAL REPORT
take place, is still considered likely, the resulting profits or losses originating from the adjustment of the financial instrument to the fair value remain under capital and reserves and are charged to income statement when the transaction takes place as described above. If the probability of the underlying transaction occurring is no longer likely, the related profits or losses from the derivative contract, originally recorded under capital and reserves, are immediately charged to the income statement.
(ii) Hedges of monetary assets and liabilities (Fair value hedges)
Where a derivative financial instrument is used to hedge changes in value of monetary assets or liabilities already recorded in the financial statements that could affect the income statement, profits and losses related to changes in fair value of the derivative financial instruments are immediately recorded in the income statement. Likewise, the profits and losses relating to the hedged item modify the carrying amount of any such item and are recorded in the profit and loss account.
2.3.15 OWN SHARES
For purchases of own shares, the price paid, including any directly attributable ancillary charges, is deducted from the Company's Equity until the shares are canceled, reissued, or disposed of. When said own shares are resold or reissued, the price received net of any directly attributable ancillary charges and the related tax effect is accounted for as Company Equity. Therefore no gain or loss is recognized in the Income Statement with the purchase, sale, or cancellation of own shares.
2.3.16 INVENTORIES
Stocks are recorded, in each homogeneous category, at the purchase cost, including incidental and production costs and the corresponding net realizable or market value at year-end, whichever is lowest. The cost is determined according to the weighted average cost method.
As far as goods manufactured by the Company (semi-finished, work in progress and finished goods) are concerned, the cost of production includes all directly chargeable costs (raw materials, consumables, energy utilities, direct labor), and the cost of manufacturing (indirect labor, depreciation, etc.) in the amount reasonably attributable to the products.
Any stock impairment risks are hedged by the relevant stock depreciation allowance recorded as an adjustment to the
corresponding assets item. Amounts thus obtained do not differ significantly from current costs on the closing date of accounts.
2.3.17 INTEREST-BEARING FINANCIAL PAYABLES
All interest-bearing financial liabilities are valued as per the amortized cost method; the difference between this value and the settlement value is charged to the income statement during the term of the loan.
2.3.18 LIABILITIES FOR EMPLOYEE BENEFITS
(i) Defined contribution plans
The Group participates in public or privately defined contribution pension schemes on a mandatory, contractual or voluntary basis. The payment of contributions fulfills the Group's obligation towards its employees. The contributions are costs recognized in the period in which they are due.
(ii) Defined benefit plans for employees for Italian companies
The defined benefit plans for employees are payable on or after the termination of the period of employment in the Group. These mainly include the severance indemnities which are calculated separately for each plan using actuarial methods to estimate the amount of future benefit accrued to employees during the year and in previous years. The resulting benefit is discounted and recorded net of the fair value of any related assets. The interest rate used to calculate the present value of the obligation was determined in accordance with para. 78 IAS 19, of the Iboxx Corporate A index with duration 7-10 determined at the date of valuation. To this end, the yield for a duration comparable to the overall duration of the worker's covered by the assessment was chosen.
In the case of increases in plan benefits, the portion of the increase relating to the previous employment period is charged to the income statement on a straight line basis over the period in which the related rights will be acquired. If the rights are acquired immediately, the increase is immediately recorded in the income statement.
The expected present value of benefits payable in the future related to the length of employment in the current period, conceptually similar to the accrued share of the employee severance indemnity, is classified under personnel costs in the income statement while the implicit financial charges are reclassified in the applicable financial section.
57 COMER INDUSTRIES
(iii) Employee defined benefit plans for German and American subsidiaries
Certain group companies offer defined benefit, post-employment, and other long-term pension plans. The cost of providing benefits under the plan is determined using the projected unit credit method.
The companies' net obligation is calculated separately for each plan by estimating the amount of future benefit that employees have accrued in the current and prior periods, discounting that amount and deducting the fair value of any plan assets.
Measurements, including actuarial gains and losses and the return on plan assets (excluding interest), are recognized immediately in the balance sheet, with a corresponding debit or credit to retained earnings, through comprehensive income for the period they occur in. Remeasurements are not reclassified to earnings in subsequent periods.
Costs for past services are recognized in earnings on the date of the plan amendment or reduction. Interest is calculated by applying the discount rate to the defined benefit liability. The companies' obligation with respect to other long-term employee benefits is equal to the future benefit that employees have received in exchange for their current work and in prior periods. This benefit is discounted to determine its present value.
2.3.19 INCOME TAXES
Income taxes recognized in the income statement include current and deferred taxes. Income taxes are generally charged to the income statement, unless they relate to items recognized directly under capital and reserves. In this case, the income taxes are also charged directly to capital and reserves, as a variation to the amount recorded.
Current taxes are taxes calculated by applying the tax rate in effect on the balance sheet date and adjustments to prior year taxes to taxable income.
Deferred taxes are calculated using the so-called liability method on timing differences between the amount of assets and liabilities recorded in the financial statements and the corresponding values recognized for tax purposes. Deferred taxes are calculated according to the designated method of reversal of timing differences, on the basis of realistic estimates of financial charges resulting from the application of the tax legislation in force at the date in which the financial statements were prepared.
Deferred tax assets are recognized only if it is probable that sufficient taxable income will be generated in future years to realize these deferred taxes.
2.3.20 PROVISIONS FOR RISKS AND CHARGES
Provisions for risks and charges relate to costs and charges of a specific nature and certain or likely existence, the amount and date of occurrence of which are not known at the close of the period. Provisions are recognized when:
• the existence of a pending liability arising from a past event is probable;
• it is likely that the obligation will be burdensome;
• the amount of the obligation can be estimated reliably. Provisions are recorded at the value reflecting the best estimate of the amount the company would reasonably pay to settle the obligation or transfer it to third parties at the end of the period.
The costs that the Group expects to incur to carry out restructuring plans are recorded in the financial year the Company formally defines the plan and the interested parties have a valid expectation that the restructuring will happen.
The provisions are periodically updated to reflect any variations in estimates of costs and realization times. Revisions of the provision estimates are charged in the same income statement item that had previously held the provision.
The notes to the consolidated financial statements illustrate the contingent liabilities consisting of:
• possible, but not probable, obligations arising from past events, the existence of which will be confirmed only by the occurrence or non-occurrence of one or more uncertain future events not wholly under the control of the company;
• present obligations arising from past events the amount of which cannot be reasonably estimated or the fulfillment of which will probably not be burdensome.
2.3.21
CURRENT FINANCIAL LIABILITIES, TRADE PAYABLES AND OTHER PAYABLES
Trade payables and other payables, which mature within the normal commercial terms, are not discounted and are recognized at cost (identified by nominal value) reflecting their settlement value.
Current financial liabilities include the short-term portion of borrowings, including payables for cash advances and other financial liabilities. Financial liabilities are measured at amortized cost by recording charges in the income statement using the effective interest rate method, with the exception of financial
58 2023 ANNUAL REPORT
liabilities purchased for trading purposes or derivatives, or those designated as FVTPL by management at the date of initial recognition, which instead are measured at fair value through profit or loss (see para. Financial derivatives).
2.3.22 DE-RECOGNITION OF FINANCIAL ASSETS AND LIABILITIES
FINANCIAL ASSETS
A financial asset is derecognized when:
• the rights to receive cash flows from the asset are extinguished;
• the Group retains the right to receive cash flows from the asset, but has assumed the contractual obligation to pay them in full and without delay to a third party;
• the Group has transferred the right to receive cash flows from the asset and has transferred substantially all risks and rewards of ownership of the financial asset or has neither transferred nor retained all risks and rewards of ownership of the asset, but has transferred control of the asset.
In cases where the Group has transferred the rights to receive cash flows from an asset and has neither transferred nor retained all the risks and benefits or has not lost control over it, the asset is recognized in the balance sheet to the extent of its residual involvement in the asset. The residual involvement that takes the form of a guarantee on the transferred asset is valued at the lower of the initial book value of the asset and the maximum amount that the Group could be required to pay.
In cases where the residual involvement takes the form of an option issued and/or purchased on the transferred asset (including options settled in cash or similar), the extent of the Group's involvement corresponds to the amount of the transferred asset that the Group may repurchase; however, in the case of a put option issued on an asset measured at fair value (including options settled in cash or similar), the extent of the Group's residual involvement is limited to the lower of the fair value of the transferred asset and the option exercise price.
FINANCIAL LIABILITIES
A financial liability is derecognized when the obligation underlying the liability is extinguished, canceled or discharged.
In cases where an existing financial liability is replaced by another from the same lender, under substantially different conditions, or
the conditions of an existing liability are substantially changed, this exchange or change is treated as a de-recognition of the original liability and the recognition of a new liability, with any differences between the carrying amounts recognized in the income statement.
In the case of changes to financial liabilities defined as nonsubstantial, the financial liability is not derecognized and the value of the debt is recalculated keeping the original effective interest rate unchanged, discounting the modified cash flows, thus generating a positive or negative effect on the income statement.
2.3.23 REVENUE SALES REVENUES
Revenues are recognized to the extent in which it is probable that the economic benefits will be achieved by the Group and the related amount can be reliably determined, regardless of the date of payment. Revenues are measured at the fair value of the amount received or to be received, taking into account the contractually defined payment terms and excluding taxes and duties.
Revenue from the sale of goods is recognized when the Company has transferred control of the goods to the purchaser. Revenue is measured at the fair value of the consideration received or to be received, net of returns and rebates, commercial discounts and volume reductions.
2.3.24 COSTS
Costs are recognized when they relate to goods and services purchased and/or received during the period or by systematic allocation of an expense from which future benefits are spread over time.
2.3.25
FINANCIAL INCOME AND CHARGES
The financial income and charges are reported on an accrual basis based on the interest accrued to the net value of the related financial assets and liabilities by applying the effective interest rate. The financial income and charges include gains and losses
59 COMER INDUSTRIES
on exchange and gains and losses on derivative instruments that must be recognized in the income statement if they fail to meet the requirements to be considered hedging (see para.2.3.13 and following).
2.3.26
USE OF ESTIMATES
The preparation of the consolidated financial statements requires that the Directors apply accounting standards and methods that, in certain circumstances, are based on difficult and subjective valuations and estimates based on past experience and assumptions which are from time to time considered reasonable and realistic depending on the relative circumstances. The application of these estimates and assumptions affect the amounts reported in the financial statements, as well as the information provided. The final values of the accounting items for which these estimates and assumptions were used may differ from those reported in the financial statements due to uncertainties regarding the assumptions and the conditions on which the estimates are based. Estimates and assumptions are reviewed periodically and the effects of each variation recognized in the period in which the estimate is revised if the revision affects only the current period, or even in subsequent periods if the revision affects the current period and those in the future. The financial statement items which, more than others, require a greater degree of discretion by the Directors when making estimates and for which a change underlying the assumptions used could have a significant impact on the financial statements are: defined benefit plans for employees, provision for bad debts, provisions for product warranty risks, other provisions for legal risks, the inventory write-down provision for semi-finished and finished products, the recoverable value of non-current assets with an indefinite useful life ("impairment") and the estimate of the fair value of the net assets acquired ("Purchase Price Allocation").
Pension plans and other post-employment benefits / Provisions for employee benefits.
The related net financial assets, costs, and expenses are valued using an actuarial method that requires the use of estimates and assumptions to determine the net value of the obligation or asset. The actuarial method considers financial parameters such as for example the discount rate or expected long-term return on plan assets and payroll growth rates, and considers the probability of occurrence of potential future events through the use of
demographic parameters, such as for example mortality rates. Specifically, the discount rates taken as reference are rates or rate curves of high quality corporate bond rates (Euro Composite AA rate curve) in the respective markets of reference. Expected asset returns are determined based on various data provided by some experts on the long-term expectations of capital market returns, inflation, current bond yields, and other variables, and are adjusted as necessary to account for asset investment strategies. The rates of future pay increases reflect the Group's long-term expectations based on the relevant markets and inflation trends. Changes in any of these parameters could have effects on future contributions to the funds.
Impairment test.
The allocation of goodwill to cash-generating units, the determination of those units, and the forecasting of future cash flows involve making estimates.
The Group has based its estimates and assumptions on parameters available at the time of preparing the Consolidated Financial Statements. However, current circumstances and assumptions about future developments may change due to changes in the market or events beyond the Group's control. If they occur, such changes are reflected in the assumptions. Note that with regard to this particular aspect, given its significance, a sensitivity analysis was also performed, for which please refer to paragraph "2.6.2 Intangible fixed assets."
Purchase Price Allocation.
The estimation of the fair values of the net assets acquired of the subsidiary e-comer, done by appointing an independent expert, resulted in the quantification of higher values compared to the balance sheet figures inferred from the accounting situation as of the date of acquisition.
The valuations were determined based on a final report prepared by an independent expert.
The differential between the total purchase consideration and the fair value of the net assets acquired was allocated to goodwill, which in turn was allocated to a CGU subject to verification by impairment test.
Provision for bad debts.
The provision reflects the risks calculated on specific positions both in relation to insolvency proceedings in progress and cases for which legal action has been taken, or simply receivables outstanding for more than 360 days, as well as the estimate of expected losses on receivables, also in the absence of events that
60 2023 ANNUAL REPORT
already indicate clear risks of loss, as provided for by international accounting standard IFRS 9.
Provision for product warranty risks.
The provision includes amounts for both specific risks, estimated on the basis of specific technical analyses, and generic risks. The latter are calculated on the production values of single plants, using the average warranty costs as a percentage of turnover in the last 5 years applied to the turnover of the period. The warranties granted are in line with legal provisions.
Provision for legal risks.
These refer to specific cases assigned to legal attorneys with relation to ongoing litigation.
Inventory write-down provision.
A generic amount has been set aside, calculated by applying a specific percentage write-down for bands of rotation indices in a systematic fashion, and a specific amount (especially for foreign subsidiaries) relating to the real possibility of disposal of the products.
2.3.27 PUBLIC GRANTS
Public grants are recognized when there is reasonable certainty that they will be received and that all the conditions referring to them have been satisfied. Grants relating to components of cost are recognized as revenues, but are systematically spread over a number of financial periods so as to match the recognition of the costs they are intended to offset. A grant relating to an asset is recognized as a revenue in constant amounts along the expected useful life of the asset in question.
In the event the Group receives a non-monetary grant, the asset and the relative grant are recognized at nominal value and released in the income statement in constant amounts along the expected useful life of the asset in question.
Law 124 of 2017 provides for compulsory disclosure of subsidies, grants, appointments or economic advantages received from the Public Administration or, in any case, involving public resources. From a systematic reading of the regulation, the facilitating measures aimed at all companies have not been included (by way of example but not limited to tax facilitating measures such as hyper-amortization, super-amortization, tax credit for research and development and facilitating measures such as the Wages Guarantee Fund) as these advantages are not aimed at a specific company.
During the year, the Group Italian companies only received State Aid that targeted all companies, and therefore for any details reference should be made to the National Register of State Aid.
61 COMER INDUSTRIES
2.3.28
ACCOUNTING STANDARDS
IFRS ACCOUNTING STANDARDS, AMENDMENTS AND INTERPRETATIONS APPLIED FROM JANUARY 1, 2023
The following IFRS accounting standards, amendments and interpretations have been applied for the first time by the Group starting from January 1, 2023:
• On May 18, 2017, the IASB published IFRS 17 – Insurance Contracts, which is intended to replace IFRS 4 - Insurance Contracts. The standard was applied from January 1, 2023. The objective of the new standard is to ensure that an entity provides relevant information that faithfully represents the rights and obligations arising from insurance contracts issued. The adoption of this principle and its amendment has not had any effect on the Group’s consolidated financial statements.
• On May 7, 2021, the IASB published an amendment called “Amendments to IAS 12 Income Taxes: Deferred Tax related to Assets and Liabilities arising from a Single Transaction” The document clarifies how deferred taxes should be accounted for on certain transactions that can generate assets and liabilities of equal amounts at the date of first registration, such as leases and decommissioning obligations. The amendments were applied from January 1, 2023. The adoption of this amendment has not had any effect on the Group’s consolidated financial statements.
• On February 12, 2021, the IASB published two amendments called "Disclosure of Accounting Policies—Amendments to IAS 1 and IFRS Practice Statement 2" and "Definition of Accounting Estimates—Amendments to IAS 8." The amendments regarding IAS 1 require an entity to disclose relevant information about the accounting standards applied by the Group. The amendments are intended to improve the disclosure of accounting policies applied by the Group so as to provide more useful information to investors and other primary users of financial statements as well as to help companies distinguish changes in accounting estimates from changes in accounting policy. The amendments were applied from January 1, 2023. The adoption of these amendments has not had any effect on the Group’s consolidated financial statements.
• On May 23, 2023, the IASB published an amendment called “Amendments to IAS 12 Income taxes: International Tax Reform – Pillar Two Model Rules.” The document introduces a temporary exception to the recognition and disclosure requirements for deferred tax assets and liabilities related to the Pillar Two Model Rules (effective in Italy as of December 31, 2023, but applicable as from January 1, 2024) and provides specific disclosure requirements for entities affected by the related International Tax Reform. The document provides for the immediate application of the temporary exception, while the disclosure requirements will apply only to annual financial statements on or after January 1, 2023, but not to interim financial statements with a closing date prior to December 31, 2023.
62 2023 ANNUAL REPORT
2023 FINANCIAL STATEMENTS DISCLOSURES
As a Multinational Group that exceeds the revenue threshold of 750 million euros for two out of the previous four fiscal years, effective 1/1/2024 the Comer Group falls under the Pillar II income taxation envisaged in Directive 2022/2523, adopted in Italy by Legislative Decree 209/2023 aimed at ensuring a global minimum level of taxation for multinational business groups and large-scale domestic groups in the Union.
In accordance with paragraph 4.A of IAS 12, which as an exception to the provisions of that standard provides that information on deferred tax assets and liabilities relating to Pillar II income taxes are not recognized or disclosed, no deferred tax assets or liabilities relating to Pillar II income taxes are recognized.
RELEVANT FOR 2023 PARAGRAPHS IAS 12
YES 88A [An entity shall disclose that it has applied the exception to recognizing and disclosing information about deferred tax assets and liabilities related to Pillar Two income taxes (see paragraph 4A).]
With respect to all Group companies (and any jointly controlled entities) that are located in each individual jurisdiction, exposure to Pillar II income taxes derives from the level of effective taxation, which for each of those jurisdictions depends on various and even interrelated factors such as primarily the income produced there, the level of the nominal tax rate, the tax rules for determining the tax base, and the provision, form, and enjoyment of incentives or other tax benefits.
Moreover, given the newness of the regulation and complexity underlying the determination of the level of effective taxation, for the first effective periods (so-called transitional regime valid for periods beginning before December 31, 2026 and ending no later than June 30, 2028) the second pillar legislation provides for the possibility of applying a simplified regime (safe harbor transitional country-by-country reporting) based primarily on accounting information available for each relevant jurisdiction that results in reduced compliance burdens and zero taxes under Pillar II if at least one of three tests is passed.
YES 88C [In periods in which Pillar Two legislation is enacted or substantively enacted but not yet in effect, an entity shall disclose known or reasonably estimable information that helps users of financial statements understand the entity’s exposure to Pillar Two income taxes arising from that legislation.].
Based on known or reasonably estimable information, no jurisdictions with an ETR of less than 15% have currently been identified.
With the support of external consultants, the Group is organizing and preparing for the fulfillments related to Pillar II legislation, also in order to manage its exposure in subsequent periods, through the preparation of appropriate systems and procedures aimed at:
• Identifying, locating and characterizing all Group enterprises (or jointly controlled entities) for the purposes of Pillar II legislation, even on an ongoing basis.
• Computing the simplified tests (so-called country-by-country safe harbor transitional reporting) for each relevant jurisdiction in order to enjoy the related benefits in terms of reduced compliance burden and zero taxation under Pillar II.
• Making full and detailed calculations of relevant quantities as required by Pillar II legislation for any jurisdictions that fail any of the above tests.
YES 88D [To meet the disclosure objective in paragraph 88C, an entity shall disclose qualitative and quantitative information about its exposure to Pillar Two income taxes at the end of the reporting period. This information does not have to reflect all the specific requirements of the Pillar Two legislation and can be provided in the form of an indicative range. To the extent information is not known or reasonably estimable, an entity shall instead disclose a statement to that effect and disclose information about the entity’s progress in assessing its exposure.]
63 COMER INDUSTRIES
IFRS ACCOUNTING STANDARDS, AMENDMENTS AND INTERPRETATIONS
ENDORSED BY THE EUROPEAN UNION AS OF DECEMBER 31, 2023, NOT YET MANDATORILY APPLICABLE AND NOT ADOPTED EARLY BY THE GROUP AS OF DECEMBER 31, 2023
The following IFRS accounting standards, amendments, and interpretations have been approved by the European Union but are not yet mandatory and have not been adopted in advance by the Group as of December 31, 2023:
• On January 23, 2020, the IASB published an amendment called "Amendments to IAS 1 Presentation of Financial Statements: Classification of Liabilities as Current or Noncurrent" and on October 31, 2022 published an amendment entitled
“Amendments to IAS 1 Presentation of Financial Statements: Non-Current Liabilities with Covenants.” The purpose of these documents is to clarify how to classify debt and other shortterm or long-term liabilities. Furthermore, the amendments also improve the information that an entity must provide when its right to defer settlement of a liability for at least 12 months is subject to meeting certain parameters (i.e., covenants). The modification applies from January 1, 2024, however early application is permitted. The Directors do not expect a significant effect in the consolidated financial statements of the Group from the adoption of this amendment.
• On September 22, 2022, the IASB published an amendment called "Amendments to IFRS 16 Leases: Lease Liability in a Sale and Leaseback." The document requires the sellerlessee to measure the lease liability arising from a sale-andleaseback transaction so as not to recognize income or loss that relates to the retained right of use. The modification will be applied from January 1, 2024, however, early application is permitted. The Directors do not expect a significant effect in the consolidated financial statements of the Group from the adoption of this amendment.
ACCOUNTING STANDARDS, AMENDMENTS AND IFRS INTERPRETATIONS NOT YET APPROVED BY THE EUROPEAN UNION AS OF DECEMBER 31, 2023
At the reference date of this document, the competent bodies of the European Union have not yet completed the approval process necessary for the adoption of the amendments and principles described below.
• On May 25, 2023 the IASB published an amendment called “Amendments to IAS 7 Statement of Cash Flows and IFRS 7 Financial Instruments: Disclosures: Supplier Finance Arrangements.” The paper requires an entity to provide additional information on reverse factoring arrangements that will enable financial statement users to assess how financial arrangements with suppliers may affect the entity's liabilities and cash flows and to understand the effect of such arrangements on the entity's exposure to liquidity risk. The modification will be applied from January 1, 2024, however, early application is permitted. The Directors do not expect a significant effect in the consolidated financial statements of the Group from the adoption of this amendment.
• On August 15, 2023, the IASB published an amendment called "Amendments to IAS 21 The Effects of Changes in Foreign Exchange Rates: Lack of Exchangeability." The document requires an entity to apply a methodology to be applied consistently in order to ascertain whether one currency can be converted into another, and when this is not possible how to determine the exchange rate to be used and the disclosure to be made in the notes to the financial statements. The amendment will apply from January 1, 2025, but earlier application is allowed. The Directors do not expect a significant effect in the consolidated financial statements of the Group from the adoption of this amendment.
• On January 30, 2014, the IASB published IFRS 14Regulatory Deferral Accounts , which allows only first-time adopters of IFRS to continue to recognize amounts related to activities subject to regulated rates ("Rate Regulation Activities") under the previous adopted accounting standards. As the Group is not a first-time adopter, this principle is not applicable.
64 2023 ANNUAL REPORT
FINANCIAL RISK MANAGEMENT
The Group's business is exposed to various financial risks: market risk (including the exchange rate risk and interest rate risk), credit risk, liquidity risk, price and cash flow risk. The risk management program aims to minimize any negative impacts on the Group's financial performance and is planned by a central function of the Parent Company that coordinates all operating companies, reporting directly to the Chief Executive Officer.
The Group uses derivative financial instruments to hedge its exposure to foreign exchange risk and does not subscribe to derivative financial instruments for speculative purposes.
(a) MARKET RISK
(i) Exchange rate risk
The Group operates internationally and is exposed to exchange rate risk due to exposure mainly to the US dollar and the Chinese yuan, and secondarily to the Indian rupee, the Brazilian real and the British pound. The exchange rate risks are generated by forecasts of future commercial transactions and recognized assets or liabilities.
In order to manage the exchange rate risk generated by forecasts of future commercial transactions and recognized assets or liabilities denominated in a currency other than the functional currency of the Group (euro), the Group companies use repurchase agreements (forward), under the coordination of the central Treasury.
The Group's policy is to hedge a portion of future currency transactions that are expected to occur in the next 12 months. Where necessary, derivative contracts previously stipulated are renewed at maturity in relation to the evolution of the business. The Group is exposed to the conversion risk of net assets of subsidiaries in North America, Great Britain, China, India and Brazil. Considering the strategic importance of the subsidiaries for which the implementation of this activity is foreseen in the short term, the Group did not consider the signing of hedging contracts necessary for this purpose.
(ii) Interest rate risk
The interest rate risk is derived from medium-long term loans at variable rates. Given the limited financial exposure, the Group's current policy is to use floating rate loans, monitoring the interest rate curve.
(b) CREDIT RISK
The Group's policy is to sell to customers after an evaluation of their credit capacity and therefore within pre-set credit limits. Historically, the Group has not suffered significant losses on receivables.
(c) LIQUIDITY RISK
Prudent management of liquidity risk implies maintaining sufficient available cash and cash equivalents and sufficient credit lines from which to draw. Due to the dynamic nature of the business, the Group's policy is to have revolving standby credit facilities that can be utilized at short notice.
The Group follows stringent rules to distribute its deposits and liquid assets in a balanced manner among an adequate number of banking institutions with ratings of high standing.
(d) PRICE AND CASH FLOW RISK
The Group is subject to the risk of fluctuations in metal prices, in particular aluminum, copper and steel. The Group's policy is to cover the risk where possible, through commitments from suppliers in the medium term, with stockpiling policies when prices are at their lowest and agreements with customers. For the operational management of the above risks, please refer to paragraph 2.6.16.
65 COMER INDUSTRIES
2.4
2.5
CORPORATE INFORMATION AND INDUSTRY-RELATED INFORMATION
2.5.1
ACCOUNTING IMPACTS OF THE PURCHASE PRICE ALLOCATION DERIVED FROM THE ACQUISITION OF E-COMER S.R.L.
On January 9, 2023, Comer Industries S.p.A. acquired 100% of e-comer S.r.l., a newly established company that on December 27, 2022 received in contribution the business units of Benevelli Electric Powertrain Solutions and Sitem Motori Elettrici, operating in the market of motors and transmissions for electric vehicles.
The amounts related to the final accounting of the aforementioned acquisition through the application of the so-called purchase method are summarized below, that is, the measurement at fair value of all assets and liabilities (including contingent liabilities) acquired as of January 1, 2023, and the determination of any goodwill to the extent of the excess of the sum of the consideration transferred in the business combination over these values:
The valuation process was finally completed as of December 31, 2023 and was approved by the Board of Directors on February 7, 2024. The final Purchase Price Allocation was prepared with the support of a major consulting firm.
The results of this valuation are summarized below:
• The value of inventory, the fair value of which is higher than the book value by 564 thousand euros, generating deferred tax liabilities of 157 thousand euros.
• The list of customers, the fair value of which is equal to 6,281 thousand euros, generating deferred tax liabilities of 1,752 thousand euros.
• The tangible fixed assets, the fair value of which is equal to 9,115 thousand euros, generating deferred tax liabilities of 2,543 thousand euros.
Deferred taxes were calculated considering a tax rate of 27.90%.
As a result of the above, goodwill of 14,296 thousand euros was calculated, subjected to an impairment test at the end of the year as described below in paragraph 2.6.2.
66 2023 ANNUAL REPORT
(VALUES IN EUROS) Net equity acquired 30,103,313 Fair value measurement of assets and liabilities 0 Other intangible fixed assets 6,281,000 Tangible fixed assets 9,115,000 Inventories 564,000 Payables for deferred taxes (4,453,000) Fair value of net assets acquired A 41,610,313 Total consideration transferred B 55,906,000 Goodwill at the date of acquisition B - A 14,295,687
The following details the amount of net equity acquired and the amount resulting from the provisional Purchase Price Allocation.
(IN EUROS)
Note that the allocation process did not involve valuations of know-how, a value that was already accounted for in the financial statements of the subsidiary e-comer and resulting from the acquisition appraisal and therefore already expressed at fair value.
The fair value of the customer list was determined using the Multiperiod Excess Earnings Method ("MEEM"), applying a discount rate of 11.2% (corresponding to the WACC value specifically calculated by Group Management plus a Risk Premium of 0.8%).
With regard to the values of tangible fixed assets, a sworn appraisal was made after the acquisition, from which surpluses in value emerged with respect to the relevant carrying amounts, resulting in a higher valuation.
2.5.2 SEGMENT INFORMATION
Industry-related information is given with reference to sectors of activity. The information includes both costs directly attributable and costs allocated according to reasonable assumptions. General and administrative costs, ICT and HR services, fees for directors, Statutory Auditors and Group management departments, as well as costs relating to the global sourcing area (organized according to purchasing group of product category) have been allocated to sectors proportionally to the turnover.
The Group operates in the following sectors:
Agricultural sector. Products mainly consists of speed increasers, speed reducers, bevel gearboxes, PTO driveshafts, wheel drives and axles for agricultural use, especially manufacturers of combine harvesters and tractors, haymaking, harvesting, irrigation and mixing, and land preparation and working machines. Industrial sector. This includes products such as modular planetary drives, travel and hoist drives, slew drives and rigid and steering axles for construction and forestry machinery manufacturers, from the shipbuilding to the airport building and mining industries. Components for municipalities, for the extraction industry and material handling sectors. Products for the wind power and renewable energy sector as well as for driving the augers of biogas machines. Electric motors for stationary industrial applications, transaxle and geared motors for e-Mobility, construction, material handling and logistics.
67 COMER INDUSTRIES
NET EQUITY ACQUIREDSITEM BUSINESS UNIT NET EQUITY ACQUIREDBENEVELLI BUSINESS UNIT PURCHASE PRICE ALLOCATION TOTAL CONSIDERATION TRANSFERRED Goodwill 0 0 14,295,687 14,295,687 Other intangible fixed assets 12,430,607 12,330,180 6,281,000 31,041,787 Tangible fixed assets 3,135,894 2,151,078 9,115,000 14,401,972 Net working capital 2,773,504 2,081,995 564,000 5,419,499 Net Financial Position 320,693 170,000 0 490,693 Receivables for prepaid taxes/Payables for deferred taxes (1,822,847) (1,822,847) (4,453,000) (8,098,694) Other current and non-current assets/ liabilities (1,407,126) (237,818) 0 (1,644,944) Total 15,430,726 14,672,587 25,802,687 55,906,000
The Agricultural sector, which now accounts for 59.2% of total revenues (62.7% in 2022), experienced a -6.7% decrease in revenues during the year, with an increase in operating profitability
(EBITDA). In contrast the performance of the industrial segment was positive (+8.3%), improving its operating profitability partly due to the acquisition of e-comer.

68 2023 ANNUAL REPORT AGRICULTURAL SECTOR INDUSTRIAL SECTOR TOTAL SECTORAL INDICATORS (THOUSANDS OF EUROS) DECEMBER 31, 2023 DECEMBER 31, 2022 CHG. % DECEMBER 31, 2023 DECEMBER 31, 2022 CHG. % DECEMBER 31, 2023 DECEMBER 31, 2022 Revenue from contracts with customers 724,131 776,262 -6.7% 499,807 461,314 8.3% 1,223,938 1,237,576 EBITDA 120,298 109,219 10.1% 84,682 70,789 19.6% 204,981 180,008 EBITDA on revenues (%) 16.6% 14.1% 16.9% 15.3% 16.7% 14.5% Amortization (34,800) (32,621) (25,753) (19,869) (60,553) (52,491) EBIT 85,498 76,598 11.6% 58,930 50,919 15.7% 144,428 127,517
2.6
NOTES TO THE CONSOLIDATED FINANCIAL STATEMENTS
2.6.1
TANGIBLE FIXED ASSETS
Changes in technical fixed assets and related accumulated depreciation during FY 2023 are illustrated in the following tables:
refer to balances arising from the transfer of the Benevelli Electric Powertrain Solutions and Sitem Motori Elettrici businesses to e-comer.
69 COMER INDUSTRIES
DESCRIPTION (THOUSAND EUROS) LAND AND BUILDINGS PLANT AND MACHINERY INDUSTRIAL AND COMMERCIAL EQUIPMENT OTHER ASSETS TANGIBLE FIXED ASSETS IN PROGRESS RIGHTS OF USE TOTAL January 01, 2022 43,241 87,118 10,659 7,119 2,636 53,963 204,736 Increases 569 16,974 6,062 3,999 4,829 10,592 43,025 Decreases (10) (881) (33) (98) (1,437) (170) (2,629) Amortization (2,486) (15,772) (5,176) (1,178) (9,937) (34,549) Reclassifications 1,378 229 (1,093) (514) 0 Translation reserve 178 367 129 99 (184) 342 931 December 31, 2022 41,492 89,185 11,870 8,848 5,330 54,791 211,514 Acquisition balances 2,119 2,278 581 235 83 5,295 Increases 983 13,938 5,880 11,535 15,595 17,537 65,467 Decreases (19) (1,144) (147) (96) (53) (5,455) (6,915) Amortization (3,004) 17,481 6,018 (3,129) 0 (10,318) (39,950) Reclassifications 814 3,674 198 105 (4,791) 0 Translation reserve (146) (131) (24) (41) (61) (734) (1,138) December 31, 2023 42,240 90,318 12,339 17,457 16,103 55,821 234,275 Acquisition balances
The rights of use heading, relating to the application of the IFRS 16 international accounting standard, mainly refers to the renting of the Group’s operating plants and can be broken down as follows:
70 2023 ANNUAL REPORT
DESCRIPTION (THOUSAND EUROS) LAND AND BUILDINGS OTHER ASSETS TOTAL January 01, 2022 49,959 4,005 53,963 Increases 9,123 1,469 10,592 Decreases (137) (33) (170) Amortization (8,022) (1,915) (9,937) Translation reserve 304 38 342 December 31, 2022 51,227 3,565 54,790 Increases 16,050 1,486 17,537 Decreases (5,473) 18 (5,455) Amortization (8,501) (1,817) (10,318) Translation reserve (815) 81 (734) December 31, 2023 52,489 3,332 55,820
2.6.2
INTANGIBLE FIXED ASSETS
Changes in intangible fixed assets are shown below:
Acquisition balances refer to balances arising from the transfer of the Benevelli Electric Powertrain Solutions and Sitem Motori Elettrici businesses to e-comer.
The item breaks down as follows:
(i) Goodwill
Goodwill arises from business combinations in accordance with IFRS 3 and represents the excess of the cost of the acquisition over the Group's stake in the fair value of the acquirer's identifiable assets, liabilities and contingent liabilities existing at the time of the acquisition.
(ii) Development and approval costs and intangible fixed assets in progress
These capitalizations are mainly related to internal orders associated with the development of new products. During the period mainly development costs of 174 thousand euros were capitalized under fixed assets in progress. These projects meet the requirements of paragraph 57 of IAS 38, as the Group analyzed the technical feasibility of the same, as well as the intention to complete the project, to introduce new products on the market and the availability of technical and financial resources, as well as a reliable identification of own costs and their ability to produce future economic benefits. These expenses are amortized on the basis of the probable useful life generally estimated to be 3 to 5 years, depending on the sector they are intended for.
71 COMER INDUSTRIES
DESCRIPTION (THOUSAND EUROS) GOODWILL DEVELOPMENT AND APPROVAL COSTS TRADEMARKS AND KNOWHOW CONCESSIONS, LICENSES AND TRADEMARKS OTHER INTANGIBLE FIXED ASSETS INTANGIBLE FIXED ASSETS IN PROGRESS TOTAL January 01, 2022 155,689 422 23,994 4,189 187,016 758 372,070 Increases 54 2,780 35 275 3,144 Decreases (5) 7 (68) (66) Amortization (232) (1,713) (2,249) (13,747) (17,942) Reclassifications 0 Translation diff. (16) 63 18 65 December 31, 2022 155,673 244 22,281 4,778 173,329 965 357,272 Acquisition balances 0 24,656 47 61 24,763 Increases 14,296 7 1,607 7,851 278 24,038 Decreases (41) (50) (91) Amortization (166) (4,276) (1,177) (14,985) (20,603) Reclassifications 167 289 0 (457) 0 Translation diff. (8) (4) (12) December 31, 2023 169,968 252 42,661 5,537 166,212 736 385,368
(iii) Concessions, licenses and patents
The increases in the period relate to the capitalization of external costs for the realization of projects already described in the report on operations or to software licenses and applications for the logistics and research and development area.
(iv) Other intangible fixed assets
The item includes developed technology, customer relationships, software and other fixed assets with finite useful lives resulting from the acquisition of the German group. These fixed assets are amortized on a straight-line basis over a period defined by the following amortization rates:
• Brand: 20 years
• Technology developed: 10-13 years
• Relationships with customers: 9-13 years.
Goodwill
As of December 31, 2023, this item amounted to 169,968 thousand euros.
Impairment losses on intangible fixed assets with an indefinite useful life and goodwill
At each reporting date the Group checks for the existence of events or circumstances that cast doubt on the recoverability of the value of tangible and intangible fixed assets with a finite useful life, and if there are any indicators of loss it estimates the recoverable value of the fixed assets in order to quantify the extent of any impairment losses. In contrast, goodwill, other intangible assets with indefinite lives, and current intangible fixed assets are tested annually and whenever there is an indication of possible impairment.
The recoverable amount of goodwill is determined by the Directors by calculating the value in use of the cash generating units the goodwill is allocated to. Cash Generating Units are defined as homogeneous aggregations that generate independent cash inflows from the continued use of assets attributable to them. In line with the requirements of the relevant accounting standards, and consistent with the changes to the
organizational and control structure of the business that the Group introduced from 2023, three CGUs have been identified, and the process of internal reorganization and simplification of the organizational and control structure of the Group’s business has entailed a revisiting of the CGUs given the merger between the former Comer Group and the Walterscheid Group acquired at the end of 2021.
Prepared with the support of a leading consulting firm, the impairment tests were approved by the Board of Directors on February 7, 2024, and were calculated using the Discounted Cash Flow (DCF) method after tax. The expected cash flows used in the DCF calculation were determined based on the business plans (of e-comer, of the Agricultural and Industrial sectors) with a duration of five years. The business plans take into consideration the various scenarios and development expectations of the various markets, based on the information available at the end of 2023.
These flows were discounted at a discount rate calculated using the Weighted Average Cost of Capital ("WACC"), i.e., by weighting the expected rate of return on invested capital net of the costs of hedging for a sample of companies in the same industry. The average cost of capital (WACC) was calculated to be 11.5% for e-comer, 9.5% for Agricultural, and 9.7% for Industrial, and the estimated g rate was set at a value consistent with the expected long-term inflation rate of 2%.
The performance of the impairment tests did not indicate the need to recognize any impairment of goodwill as of December 31, 2023 and the level of coverage is very significant.
Sensitivity analyses performed considering changes in the WACC discount rate and changes in the long-term growth rate g also revealed no need to write down the item.
2.6.3 EQUITY INVESTMENTS IN OTHER COMPANIES
The item mainly refers to the equity valuation in Matsui Walterscheid Ltd., a 40% subsidiary of Walterscheid GmbH.
72 2023 ANNUAL REPORT
2.6.4 DEFERRED TAX ASSETS
The details are as follows:
The balance of deferred tax assets increased by 7,186 thousand euros.
For the detailed breakdown of this item please refer to the table below:
The increase in deferred tax assets refers mainly to the subsidiary e-comer’s exercise of the option to exempt the goodwill that emerged with the acquisition of the Benevelli Electric Powertrain Solutions and Sitem Motori Elettrici business units, with reference to which it was decided to record the entire amount as a credit that will be charged to the income statement in the period in which the tax benefit from the tax deductibility of this asset item recorded in the financial statements will be realized. The balance of temporary differences for foreign subsidiaries is mainly attributable to the pension fund of the German subsidiaries.
The following aspects were taken into account in the calculation of deferred tax assets:
• The tax laws of the countries that the Group operates in and their impact on temporary differences, and any tax benefits from the use of tax loss carryforwards, considering their possible recoverability over a three-year time horizon.
• The Group's profit forecast in the medium and long term. Based on the above, the Group believes that it can recover the recognized deferred tax assets with reasonable certainty.
73 COMER INDUSTRIES
DESCRIPTION (THOUSAND EUROS) DECEMBER 31, 2023 DECEMBER 31, 2022 Deferred tax assets 42,881 35,695 Deferred tax assets 42,881 35,695 DEFERRED TAX ASSETS BY COMPANY (THOUSAND EUROS) DECEMBER 31, 2023 DECEMBER 31, 2022 2023 Description Total Taxes Deferred Total Taxes Deferred Used (allocated) Temporary differences Italian companies 13,000 9,336 3,664 Temporary differences foreign subsidiaries 23,395 22,062 1,334 Total prepaid taxes company 36,395 31,398 4,998 Total prepaid taxes consolidation 6,486 4,297 2,189 Total prepaid taxes in the financial statements 42,881 35,695 7,187
2.6.5 OTHER LONG-TERM RECEIVABLES
The changes are as follows:
The item refers to guarantee deposits primarily for real estate in rental agreements and consumption.
2.6.6 INVENTORIES
The changes are as follows:
The decrease in inventories amounting to 18,310 thousand euros compared to December 31, 2022 comes mainly from the optimization policies implemented during the year and is also affected by the decline in sales volumes that occurred during the
last quarter. The decrease in inventories net of the effect of the acquisition of e-comer would amount to 24,487 thousand euros.
Inventories are shown net of a provision for obsolescence for a total amount of 23,171 thousand euros, a decrease compared to
74 2023 ANNUAL REPORT
DESCRIPTION (THOUSAND EUROS) DECEMBER 31, 2023 DECEMBER 31, 2022 Security deposits for foreign rentals 371 377 Other minor receivables including security deposits Italy 423 287 Other long-term receivables 325 743 Other long-term receivables 1,119 1,407 DESCRIPTION (THOUSAND EUROS) DECEMBER 31, 2022 NET CHANGE TRANSLATION RESERVE DECEMBER 31, 2023 Raw materials and Packaging 90,752 3,951 (1,121) 93,582 Provision for write-down of raw and ancil. mats. and consumables (8,578) 1,545 85 (6,947) Raw and ancillary materials and packaging 82,175 5,496 (1,036) 86,635 Semi-finished products purchased and produced 102,674 (15,798) (126) 86,750 Provision for write-down of semi-finished products purchased and produced (5,673) 1,494 0 (4,179) Work in progress 97,001 (14,304) (126) 82,571 Finished products and Goods 76,610 (6,528) (647) 69,435 Provision for write-down of finished products (10,880) (1,213) 48 (12,045) Finished products 65,730 (7,741) (599) 57,390 INVENTORIES 244,906 (16,548) (1,761) 226,596
December 31, 2022 by 1,960 thousand euros net of the use for scrapping.
2.6.7
TRADE RECEIVABLES AND OTHER SHORT-TERM RECEIVABLES
The changes are as follows:
The balance of trade receivables is influenced by the trend in turnover, especially in relation to the last few months of the year.
Trade receivables from the acquisition of e-comer impact the net change by 2,761 thousand euros.
Average collection days calculated on aggregate revenues for the last quarter stood at 68 days, a drop versus the previous year (62 days). This deterioration was caused by the late payment of overdue receivables at the end of the year by some of the Group's customers.
The provision for bad debts mainly reflects the generic write-down calculated in accordance with IFRS 9, influenced by indicators representing greater macroeconomic risk. During the year, the Group did not record any significant losses on receivables or
release provisions set aside in previous years. Note that there are no trade receivables due after the year.
The Group is not particularly exposed to the nations currently involved in the conflict, Russia, Belarus, Ukraine and Israel. Note that consolidated receivables from customers residing in these countries correspond to less than 1%, and there are no significant accounts receivable positions as payments are normally made in advance. Note that the Moscow-based commercial branch has been inactive since April 2022.
As of December 31, 2023, the presentation of trade receivables (net of the related provision for bad debts) by maturity bracket is shown in the following table.
75 COMER INDUSTRIES
DESCRIPTION (THOUSAND EUROS) DECEMBER 31, 2022 NET CHANGE TRANSLATION RESERVE DECEMBER 31, 2023 Short-term receivables from customers 214,003 2,665 (3,567) 213,101 Provision for bad debts (6,042) (1,316) 54 (7,304) Trade receivables 207,961 1,349 (3,514) 205,797 Advances to suppliers (86) 1,738 (11) 1,640 Accrued income and prepaid expenses 785 548 (1) 1,332 Trade receivables from suppliers 34 41 (1) 74 Other short-term receivables 7,517 (1,615) 4 5,907 OTHER SHORT-TERM RECEIVABLES 8,250 712 (8) 8,953
Note that loans that are less than 30 days past due are classified in the bracket called "Current."
2.6.8 CURRENT TAX ASSETS
The changes are as follows:
The current VAT credit of 13,088 thousand euros is attributable to the parent company Comer Industries S.p.A. for 1,979 thousand euros (it was 8,007 thousand euros on December 31, 2022) and to the subsidiary Comer Industries Components S.r.l. for 4,415 thousand euros (it was 7,795 thousand euros on December 31, 2022). The remaining part relates to foreign companies and in particular to the GST credit held by the Indian subsidiary for 4,481 thousand euros. During the year the VAT receivable related to the year 2022 of Comer Industries S.p.A. in the amount of 5,593 thousand euros and the VAT receivable related to the year 2022 and the first quarter of 2023 of Comer Industries Components S.r.l. respectively in the amount of 6,595 thousand euros and 2,000 thousand euros were partially collected.
The item Other tax receivables for 6,839 thousand euros mainly represents the excess of advances paid with respect to current taxes calculated on the profit generated during the year by some companies of the German group. The balance includes a tax credit related to the parent company Comer Industries S.p.A. for investments in new capital goods of 856 thousand euros mostly related to Industry 4.0, and 502 thousand euros related to the estimated research and development tax credit.
In relation to the above mentioned subsidiaries, it should be noted that the tax system provides for the payment of advance payments for income taxes already withheld on commercial transactions, thus unavoidably generating tax credits during the financial period.
76 2023 ANNUAL REPORT DESCRIPTION (THOUSAND EUROS) DECEMBER 31, 2023 DECEMBER 31, 2022 Current 200,197 202,489 30-60 days past due 6,474 5,673 60-90 days past due 558 228 More than 90 days past due 5,872 5,613 Provision for bad debts (7,304) (6,042) Trade receivables 205,797 207,961 DESCRIPTION (THOUSAND EUROS) DECEMBER 31, 2022 NET CHANGE DECEMBER 31, 2023 Italian and foreign VAT 20,645 (7,557) 13,088 Other tax receivables 8,682 (1,843) 6,839 Current tax assets 29,327 (9,400) 19,927
2.6.9 FINANCIAL ASSETS AND LIABILITIES, GUARANTEES
The net financial position as of December 31, 2023 was negative and amounted to 94,831 thousand euros.
The value of prepayments deriving from accounting for upfront expenses according to amortized cost amounts to 1,269 thousand euros. The value of other financial liabilities attributable to the accounting treatment of leasing contracts according to IFRS 16 at December 31, 2023 amounts to 58,304 thousand
euros, a slight increase compared to December 31, 2022 (57,791 thousand euros).
Cash and cash equivalents dropped by 82,995 thousand euros, moving from 151,328 thousand euros at December 31, 2022 to 68,333 thousand euros at December 31, 2023, mainly due to the voluntary early repayment of some loans in the amount of 144,390 thousand euros.
Below is the composition of the net financial position as of December 31, 2023 and changes compared to the previous year:
77 COMER INDUSTRIES
DESCRIPTION (THOUSAND EUROS) DECEMBER 31, 2023 DECEMBER 31, 2022 CHANGE % CHANGE A) Cash and cash equivalents 68,333 151,328 (82,995) -54.8% B) Cash equivalents - - - 0.0% C) Other current financial assets - - - 0.0% D) Liquidity (A+B+C) 68,333 151,328 (82,995) -54.8% E) Current financial debt (including debt instruments, but excluding the current portion of non-current financial debt) 13,802 10,593 3,209 30.3% F) Current part of non-current financial debt 32,811 50,964 (18,153) -35.6% G) Current financial debt (E+F) 46,614 61,558 (14,944) -24.3% of which secured - - - 0.0% of which not secured 46,614 61,558 (14,944) -24.3% H) Net current financial debt (G-D) (21,719) (89,770) 68,051 -75.8% I) Non-current financial debt (excluding current portion and debt instruments) 116,551 238,717 (122,166) -51.2% J) Debt instruments - - - 0.0% K) Trade and other non-current payables - - - 0.0% L) Non-current financial debt (I+J+K) 116,551 238,717 (122,166) -51.2% of which secured - - - 0.0% of which not secured 116,551 238,717 (122,166) -51.2% M) Gross Financial Debt (G+L) 163,164 300,275 (137,110) -45.7% N) Net Financial Debt (Net financial position) (D+M) 94,831 148,947 (54,115) -36.3%
Current and non-current financial payables as of December 31, 2023 amounted to 163,164 thousand euros as detailed below:
It should be noted, as required by paragraph 186 of ESMA Communication 32-382-1138 of 4 March 2021, that there are no
material elements in terms of indirect indebtedness to be brought to attention in these consolidated financial statements.
78 2023 ANNUAL REPORT
DESCRIPTION (THOUSAND EUROS) DECEMBER 31, 2022 INCREASES DECREASES DECEMBER 31, 2023 Short-term loans 52,272 8,253 (25,352) 34,566 Medium/long-term loans 191,971 288 (126,971) 65,288 Financial payables to banks 244,243 8,541 (152,930) 99,854 Liabilities for short-term derivative financial instruments MTM 234 - (234) 0 Financial payables including financial instruments 244,477 8,541 (153,164) 99,854 Up-front commissions for structured loans (current portion) (692) (538) 692 (538) Up-front commissions for structured loans (M/LT portion) (1,302) (731) 1,302 (731) Debt to third parties for acquisition (current portion) 0 1,000 0 1,000 Debt to third parties for acquisition (ML/T portion) 0 5,276 0 5,276 Other short-term financial payables IFRS 16 9,744 2,647 (805) 11,586 Other long-term financial payables IFRS 16 48,048 10,431 (11,762) 46,718 Total short-term and long-term financial payables 300,275 26,626 (163,737) 163,164
The financial treatment of assets and liabilities broken down by the categories identified by IFRS 9, is summarized in the following table:
Most of the financial assets and liabilities in force reflect shortterm financial assets and liabilities, for which, in consideration of their nature, their book value is considered as a reasonable approximation of fair value.
SHORT-TERM DERIVATIVE FINANCIAL INSTRUMENTS
As of December 31, 2023, there were no short-term derivative financial instruments.
For more information, reference should be made to para. 2.5.15 regarding the management of exchange risks.
CASH AND CASH EQUIVALENTS
The amount of 68,333 thousand euros compares with 151,328 thousand euros last year. This decrease is mainly related to the early repayment of some loans. It is believed that the carrying value of Cash and cash equivalents approximates their fair value at the balance sheet date.
The Group follows stringent rules to distribute its deposits and liquid assets in a balanced manner among an adequate number of banking institutions with ratings of high standing. More information can be gleaned from the cash flow statement.
79 COMER INDUSTRIES
DESCRIPTION (THOUSAND EUROS) AT AMORTIZED COST FAIR VALUE TOTAL BOOK VALUE Assets as at December 31, 2023 Trade receivables 205,797 205,797 Other short-term receivables 8,953 8,953 Current tax assets 19,927 19,927 Cash and cash equivalents 68,333 68,333 Total assets 214,750 88,260 303,010 Liabilities at December 31, 2023 Long-term loans (64,557) (64,557) Trade payables (198,842) (198,842) Other short-term payables (32,168) (32,168) Current tax liabilities (29,966) (29,966) Short-term loans (34,028) (34,028) Other short-term financial payables (12,586) (12,586) Other long-term financial payables (51,993) (51,993) Post-employment benefits short-term (7,859) (7,859) Total liabilities (394,174) (37,825) (431,999) Total (179,424) 50,435 (128,989)
SHORT-TERM LOANS AND CURRENT PORTION OF MEDIUM/LONG TERM LOANS
The item includes interest-bearing bank loans.
The value of 34,028 is made up of 34,566 thousand euros of short-term bank loans, shown net of the short-term portion of transaction costs treated according to the amortized cost method (IFRS 9) equal to 538 thousand euros.
The decrease from the previous year of 17,554 thousand euros is mainly due to the total and partial repayment of two loans granted
by Crédit Agricole (in USD and EUR) for a total of 11,750 thousand euros, and the repayment of a Unicredit Loan granted to Comer Industries S.p.A. for 9,500 thousand euros.
The current account debt at December 31, 2023 of Comer Industries S.p.A. and Comer Industries Components S.r.l. relates to the balance of cash in transit linked to the payment of bills payable and direct remittances on December 31. Due to the dynamic nature of the business, the Group's policy is to have revolving standby credit facilities that can be utilized at short notice.
LONG-TERM LOANS
This item includes the long-term portions of the following loans:
1. Loan agreement entered into with Crédit Agricole in December 2021 and divided as follows:
- Originally 140,000 thousand euros, including 45,000 thousand euros remaining as of December 31, 2023 with a maturity date of March 31, 2027. Installments repaid during the year totaled 95,000 thousand euros.
- 30,000 thousand euros, usable in cash and intended to support general revolving financial requirements, to be repaid in a lump-sum at the end of the relative interest period as set
forth in the utilization request, with a maximum duration of 5 years. This line was unused as of December 31, 2023.
2. Loan agreement signed with Crédit Agricole Italia in December 2022 for a total amount of 50,000 thousand euros, maturing on December 16, 2027. This financing provided the funding for the acquisition of e-comer, finalized in January 2023. The above was partially repaid during the year in the amount of 10,000 thousand euros. The outstanding amount as of December 31, 2023 was 40,000 thousand euros, of which 30,000 thousand euros is long-term.
The loans above require compliance with consolidated operating management covenants, which were met as of December 2023.
80 2023 ANNUAL REPORT
DESCRIPTION (THOUSAND EUROS) CURRENCY BOOK VALUE DECEMBER 31, 2022 CHANGE BOOK VALUE DECEMBER 31, 2023 NOM. VAL. DECEMBER 31, 2023 (LC/000) Bank accounts payable and advances Comer Ind S.p.A. EUR 5,574 7,522 13,097 13,097 Bank accounts payable and advances Comer Comp. S.r.l. EUR 4,786 (4,714) 72 72 Bank account overdrafts Comer India Pvt INR 0 607 607 55,805 MSME loan Comer India Pvt INR 0 26 26 2,408 Simest loan e-comer S.r.l. EUR 0 96 96 96 Loan Unicredit Comer Ind. S.p.A. EUR 9,500 (9,500) 0 0 Loan CAI Comer Ind. S.p.A. EUR 10,076 4 10,081 10,081 Loan Crédit Agricole M/L current portion EUR 15,469 (4,882) 10,587 10,587 Loan Crédit Agricole M/L current portion USD 6,868 (6,868) 0 0 Total gross short-term loans 52,272 (17,708) 34,566 Up-front commissions for short-term structured loans EUR (692) 154 (538) (538) Total net short-term loans 51,580 (17,554) 34,028
Note that in 2023 the remaining debt of 30,802 thousand euros of the loan with Crédit Agricole, originally for 50,000 thousand dollars, was repaid in advance.
Further information can be obtained from the specific tables provided below.
Reported below is the breakdown of bank loans by nature, short and medium/long-term existing as at December 31, 2023:
81 COMER INDUSTRIES
DESCRIPTION (THOUSAND EUROS) CURRENCY BOOK VALUE DECEMBER 31, 2022 CHANGE BOOK VALUE DECEMBER 31, 2023 NOM. VAL. DECEMBER 31, 2023 (LC/000) Loan CAI M/L long-term portion EUR 40,000 (10,000) 30,000 30,000 Simest loan long-term portion EUR 0 288 288 288 Loan Crédit Agricole M/L long-term portion EUR 126,000 (91,000) 35,000 35,000 Loan Crédit Agricole M/L long-term portion USD 25,971 (25,971) 0 0 Total gross long-term borrowings 191,971 (126,683) 65,288 Up-front commissions for M/LT structured loans (1,302) 571 (731) (731) Total long-term borrowings 190,669 (126,112) 64,557 DESCRIPTION (THOUSAND EUROS) BALANCE AS AT DECEMBER 31, 2022 ACQUISITION BALANCES NEW DISBURSEMENT REPAYMENTS BALANCE AS AT DECEMBER 31, 2023 < 1 YEAR > 1 YEAR OF WHICH > 5 YEARS EXPIRY Unicredit 9,500 (9,500) 0 December 31, 2023 CA-CIB Line A1 20,000 (13,571) 6,429 1,429 5,000 March 31, 2027 CA-CIB Line A2 120,000 (81,429) 38,571 8,571 30,000 March 31, 2027 CA-CIB Line A3 $ 30,802 (30,802) 0 March 31, 2027 CAI 50,000 (10,000) 40,000 10,000 30,000 December 16, 2027 Simest 0 2,524 (2,141) 384 96 288 December 31, 2027 Total 230,302 2,524 0 (147,443) 85,384 20,096 65,288 0
OTHER SHORT AND MEDIUM/LONG-TERM FINANCIAL PAYABLES
The heading refers to payables deriving from the application of the international accounting standard IFRS 16. It also includes financial debt of 6.3 million euros (including 1 million euros due within 12 months) for the acquisition of e-comer consisting of: 4 million euros arising from the portion of fixed consideration unpaid as of the closing date, which will be repaid in four constant
annual installments starting in 2024, and recorded net of the amortized cost resulting from the discounting of the debt for 188 thousand euros; and 3.4 million euros from the portion of variable consideration (earn-out) determined based on the value of the newly acquired company's sales in the period 2023-2026, and recorded net of the amortized cost resulting from the discounting of the debt for 920 thousand euros.
Details of the payables and movements in the period are shown below:
82 2023 ANNUAL REPORT
DESCRIPTION (THOUSAND EUROS) DECEMBER 31, 2022 INCREASES DECREASES FOREIGN EXCHANGE IMPACT DECEMBER 31, 2023 Short-term payables IFRS 16 9,744 2,647 (735) (70) 11,586 Long-term payables IFRS 16 48,048 10,431 (11,150) (612) 46,717 Short-term acquisition payables 0 1,000 0 0 1,000 Long-term acquisition payables 0 5,276 0 0 5,276 Total 57,791 19,354 (11,885) (682) 64,579
COMMITMENTS AND GUARANTEES
Guarantees given amount to 23,758 thousand euros (32,990 thousand euros in 2022) and consist of commitments of Comer Industries S.p.A. in the total amount of 21,817 thousand euros, all relating to the granting of local credit facilities in favor of subsidiaries.
The Group has no commitments to finance leasing companies.
2.6.10
NET EQUITY
The Parent Company's share capital as of December 31, 2023
consists of 28,678,090 shares with no par value and fully subscribed and paid up for 18,487,338.60 euros. It consists of a total number of 28,678,090 ordinary shares, of which 5,387 are held as treasury shares with a market value of 147 thousand euros, so that the shares outstanding as of December 31, 2023 are 28,672,703.
On May 17, 2023 dividends of 0.75 euros per share relating to the result for the 2022 financial year were paid for a total of about 21.5 million euros.
Other reserves include:
Information regarding the distributability of the reserves can be found in the notes to the financial statements of the parent company.
The increase in the legal reserve relates to the allocation of the 2022 result of the parent company net of dividend distribution. The decrease in the conversion reserve of 5,344 thousand euros is mainly attributable to the revaluation of the euro against the US dollar and the Chinese renminbi compared to the exchange rates reported at December 31, 2022.
It should be noted that during the period dividends relating to available reserves of some subsidiaries were distributed in favor of the parent company Comer Industries S.p.A. and in particular for a total of 7,648 thousand euros by Comer Industries INC, Comer Industries do Brasil and Comer Industries Components S.r.l.
The IAS 19 reserve refers to the recognition of actuarial gains on pension funds described in detail in Section 2.6.10.
The Stock Grant Reserve has been reclassified to Extraordinary Reserve for the purpose of a more concise presentation of Other Reserves, considering that this incentive plan was completely concluded in the previous financial years.
Reconciliation between the amount of capital and reserves and the result of operations of the Parent Company Comer Industries S.p.A. in compliance with the IAS/IFRS international accounting standards as at December 31, 2023, and the amounts reported in this consolidated financial report, drawn up in compliance with international standards, on the same date is as follows:
83 COMER INDUSTRIES
OTHER RESERVES (THOUSAND EUROS) DECEMBER 31, 2023 DECEMBER 31, 2022 Legal reserve 3,697 3,416 Extraordinary reserves available 39,461 27,406 Consolidation reserve 3,543 3,543 FTA reserve (IAS/IFRS first time adoption) (5,923) (5,923) Translation reserve (5,132) 212 CFH reserve (Cash Flow Hedge) 0 (387) IAS 19 reserve 22,515 26,227 Total other reserves 58,162 54,495
Actuarial earnings from recalculating the pension provision for the year 2023 have been reported after changes in the reserves for retained earnings (as required by the revised IAS 19.93 A) and amounted to 3,712 thousand euros, gross of the tax effect.
All the effects of the above are shown net of the related taxes.
2.6.11
DEFERRED TAX LIABILITIES
The deferred taxes are related to the tax effect of timing differences between the profit and loss for the year for statutory purposes of each company, and any associated taxable income.
The amounts so defined are detailed in the following table:
84 2023 ANNUAL REPORT DECEMBER 31, 2023 DECEMBER 31, 2022 DESCRIPTION (THOUSAND EUROS) NET EQUITY NET PROFIT/LOSS FOR THE YEAR NET EQUITY NET PROFIT/LOSS FOR THE YEAR Impact of net income for the year on Parent Company Net equity 342,046 40,702 314,958 38,044 Other changes: Share capital increase Increase in share premium reserve Increase in treasury stock reserve (147) Effects IAS 19 rev. Actuarial losses net of tax effect (104) 726 Dividends approved (21,509) (14,339) Statutory net equity of Comer Industries S.p.A. IAS/IFRS 320,287 40,702 301,344 38,044 Differences between the adjusted net equity of consolidated equity investments and their value in the financial statements of the Parent Company 327,866 76,752 251,113 84,240 Reversal of intercompany dividends (114,472) (7,648) (106,824) (12,469) Change in the Cash Flow Hedge Reserve IAS 38 Comer Industries Jiaxing 387 (328) Elimination of exchange rate differences from translation reserve calculation (5,132) 212 Effects IAS 19 rev. Actuarial losses net of tax effect 21,840 25,478 Equity contribution of subsidiaries to the Parent Company 230,489 69,104 169,652 71,771 Effects deriving from consolidation entries (43,181) (15,771) (27,112) (19,099) Net equity attributable to minority interests - - -Total net equity IAS/IFRS 507,594 94,035 443,884 90,716
2.6.12
POST-EMPLOYMENT BENEFITS
Variations in the provision were as follows:
85 COMER INDUSTRIES DECEMBER 31, 2023 DECEMBER 31, 2022 YEAR 2023 DESCRIPTION (THOUSAND EUROS) TOTAL DEFERRED TAXES TOTAL DEFERRED TAXES (USED) ALLOCATED Temporary differences Italian companies 594 1,605 (1,010) Temporary differences foreign subsidiaries 53,123 60,146 (7,023) Total deferred taxes 53,717 61,751 (8,033) Total deferred taxes consolidation 621 620 0 Total deferred taxes in the financial statements 54,338 62,371 (8,033) CHANGES (THOUSAND EUROS) DECEMBER 31, 2023 DECEMBER 31, 2022 Opening balance 124,208 165,179 Acquisition balances 613 Use for discharges and advances (6,241) (5,564) Settlements of complementary pensions and treasury funds (2,525) (1,965) Allocation for the year 4,389 4,817 Effects of IAS 19 recalculation period (gross of taxes) 10,043 (38,259) Closing balance 130,487 124,208 Short term 7,859 5,792 Medium/long term 122,628 118,416 130,487 124,208 The balance of temporary differences Italian companies is mainly attributable to the adjustment of foreign currency items. The balance of foreign subsidiary temporary differences mainly
the deferred tax
Purchase
Allocation
and
includes
provision resulting from the
Price
process
increased in the year due to what was previously described with respect to the acquisition of e-comer.
The economic and equity effects of the period, compared with the previous year, are detailed below:
This item refers to:
- employee benefits governed by the rules and regulations in force in Italy and recorded in the financial statements of Italian companies.
- Benefit plans defined after employment calculated on the basis of the final salary for all employees of its WPG subsidiaries in Germany and the USA.
The negative effect for the period of 5,650 thousand euros before taxes is mainly reflected in the recognition of the actuarial gain accrued as a result of the adjustment of discount rates, as explained below.
With regard to the Italian branches, the total value of which amounts to 9,039 thousand euros, based on the actuarial valuation and interpretations available at the date of preparation of the financial statements, the Group has made the following distinction:
• Employee severance indemnity installments accruing as from January 1, 2007: considered a "defined contribution plan" in the case of both the option for complementary social security schemes as well as the option for the treasury fund of the National Security Institution (INPS). The accounting treatment is therefore the same as that in place for other types of contribution payments.
• Employee severance indemnity provision as at December 31, 2006: remains a "defined benefit plan" for which actuarial calculations must be made, although, compared to the calculations made to date (and reflected in the financial statements for the year ending December 31, 2006), excludes the component relating to future salary increases.
Liabilities for defined benefit plans have been determined on the basis of the following Group actuarial assumptions with value scales from 2020 to 2023:
86 2023 ANNUAL REPORT DESCRIPTION (THOUSAND EUROS) DECEMBER 31, 2023 DECEMBER 31, 2022 Current service cost (1,160) (2,431) Actuarial losses/(gains) 5,650 (39,320) Financial expenses 4,505 1,708 Tax effect on income statement (877) 202 Equity tax effect (1,938) 12,828 Overall effect 6,180 (27,014)
ITALIAN ACTUARIAL ASSUMPTIONS MEASURING UNIT DECEMBER 31, 2023 DECEMBER 31, 2022 Discount rate % 3.30 4.11 Expected rate of wage growth % 0.50 0.50 Expected % of employees who will resign before pension (turnover) % 5.0 5.0 Annual cost of living increase rate % 2.0 2.3 Annual rate of TFR increase % 3.0 3.2
In accordance with new regulations of IAS 19, the values of the employee severance indemnity provision that would have been obtained by changing the above actuarial assumptions are as follows:
The companies maintain defined benefit plans in the balance sheet at the end of the employment relationship calculated with the last salary. Employees generally receive a fixed pension for each year they work. Benefits vary based on date of entry, length of employment, and worker's compensation. With respect to the US subsidiaries, the entire value of the plans is fully covered by assets.
The interest rate used for discounting is based on the yields of high-grade corporate bonds with an average AA rating, decreased for Europe from 3.7% as of December 31, 2022 to 3.3% as of December 31, 2023, and for the United States from 5.37% as of December 31, 2022 to 4.70% as of December 31, 2023.
Liabilities for defined benefit plans have been determined using the following actuarial assumptions:
• If the discount rate is 0.5% higher, the defined benefit obligation will decrease by 7.7 million euros (7.7 million euros in 2022).
• If the projected future salary growth decreases by 0.5%, the defined benefit obligation would increase by 0.8 million euros (0.9 million euros in 2022).
The significant actuarial assumptions in determining the defined benefit obligations are discount rate and future salary growth. The sensitivity analysis was determined based on reasonable possible changes in the respective assumptions occurring at the end of the reporting period, holding all other assumptions constant:
87 COMER INDUSTRIES
CHANGES (THOUSAND EUROS) DISCOUNTED SEVERANCE INDEMNITY PROVISION Turnover rate +1.0% 9,079 Turnover rate -1.0% 8,995 Annual cost of living increase rate +0.25% 9,164 Annual cost of living increase rate - 0.25% 8,918 Discount rate + 0.25% 8,868 Discount rate - 0.25% 9,217 GERMAN ACTUARIAL ASSUMPTIONS MEASURING UNIT DECEMBER 31, 2023 DECEMBER 31, 2022 Discount rate % 3.30 3.70 Expected rate of wage growth % 2.75 2.75 Annual rate of TFR increase % 2.25 2.25
The composition of personnel by category, based on average data, is as follows:
As of December 31, 2023, the Group had 3,628 resources (including temporary workers), a decrease of 180 from December 31, 2022.
2.6.13 SHORT- AND LONG-TERM PROVISIONS
The provisions include:
88 2023 ANNUAL REPORT
CONTRACT CATEGORY AVERAGE NUMBER 2023 AVERAGE NUMBER 2022 Senior executives 31 34 White Collar and Managers 1,074 1,114 Blue Collar and Outsourced workers 2,588 2,520 Total 3,693 3,668 DESCRIPTION (THOUSAND EUROS) DECEMBER 31, 2023 DECEMBER 31, 2022 Provision for product warranty risks 26,555 20,200 Other provisions for risks 12,543 7,424 Short-term provisions 39,098 27,624 Provision for product warranty risks 9,865 8,786 Other provisions for risks 4,889 3,726 Other provisions for risks and legal charges 1,985 1,805 Agents provisions 236 247 Long-term provisions 16,975 14,563
The product warranty provision includes the estimation of specific risks reported before preparation of the financial statements and relating to past productions. It also refers to coverage of general risks (the result of a calculation based on historical data) for repairs or replacement of products that did not conform to expectations. The balance at the end of the year is due to the best estimate of these risks in relation to open claims, not yet settled at year end.
The Supplementary Agents Indemnity Fund includes provisions for reimbursements recognized in the event of termination of the agency relationship, quantified according to the methods indicated in the collective economic agreement signed March 20, 2002 for the regulation of agency relations and commercial representation in the industrial sectors and cooperation.
The provision for contingent liabilities and legal expenses represents the reasonable risk calculated in relation to litigation or potential liabilities still pending in court.
Lastly, the other short-term and long-term provisions for risks and charges cover the estimated liabilities mainly related to the completion of Group reorganizations also in relation to the acquisition of the German Group at the end of 2021.
2.6.14 TRADE PAYABLES AND OTHER SHORT- AND LONG-TERM PAYABLES
(i) Trade payables
The balance of 198,842 thousand euros shows a slight increase of 212 thousand euros from the previous year. The average payment days as of December 31, 2023 (calculated on the cost of the last quarter's came) amounted to 102 days compared to 91 days in the previous year.
There are no payables expiring after more than one year or expired for more than 12 months.
(ii) Other long and short-term payables
The balance of other short- and long-term payables is 54,546 thousand euros.
The short-term balance amounting to 32,168 thousand euros includes amounts due to employees for services accrued and not paid as of the year-end closing, as well as the best estimate of long-term benefits for directors and employees.
2.6.15 CURRENT TAX LIABILITIES
The details are as follows:
At the end of the year there were liabilities with tax authorities for current taxes calculated on income for the period.
The amount due to the tax authorities for withholding taxes on employee and self-employed income increased from the previous year by 611 thousand euros.
89 COMER INDUSTRIES
DESCRIPTION (THOUSAND EUROS) DECEMBER 31, 2023 DECEMBER 31, 2022 Tax authority balance for current taxes 27,543 17,731 Tax authority for IRPEF withholdings 2,333 1,722 Other amounts due to tax authorities for withholding tax and VAT owed by foreign companies 90 3,720 Current tax liabilities 29,966 23,173
2.6.16
INFORMATION ON FINANCIAL ASSETS AND LIABILITIES
MANAGEMENT OF LIQUIDITY RISK
Liquidity risk is related to the difficulty in raising funds to meet commitments.
The control and implementation of appropriate policies for the management of liquidity risk in the presence of contingency guarantee the Company's survival and minimize the cost of funding.
This particular risk, unlike the others, manifests its effects in a very short time, with devastating consequences for companies.
It can result from insufficient resources available to meet financial obligations under the terms and deadlines set in the case of sudden revocation of uncommitted credit lines or of the possibility that the Company must honor its financial liabilities before their natural expiry.
As previously commented, the treasury activities of the Group are substantially centralized at the parent company.
In FY 2023 the Group finalized a cash pooling project with leading financial institutions in order to optimize the cash flows of companies of the Group.
The management of liquidity risk implies:
• Maintaining credit lines defined as primary risk within a total of no more than 80% of total credit lines and a substantial balance between the short and medium/long-term lines. This is necessary in order to avoid liquidity strains in the case of requests for any reimbursement by the relevant financial partners.
• Maintaining adequate liquidity derived from the cash flow generated by current operations.
It should be added that in managing this type of risk, the Group always tries to finance its investments with medium- to long-term unsecured claims in the breakdown of net debt, while covering current expenses using the short-term credit lines above.
MANAGEMENT OF INTEREST RATE RISK
The Group is exposed to the risk of changes in interest rates associated with outstanding financial assets and liabilities. The objective of interest rate risk management is to limit and stabilize the negative effects on cash flows subject to changes in interest rates. As of December 31, 2023, the Group had no interest rate risk hedging instruments in place given its limited financial debt.
MANAGEMENT OF EXCHANGE RATE RISK
In addition to that already written in the previous paragraph, it should be noted that the Group has significant transactions in the currency of non-EU countries (mainly USD and CNY).
The exchange rate risk is hedged through purchase and sale of foreign currencies contracts (forwards).
Counterparties in these operations are the banks with which the Group normally operates.
The currencies involved are the USD and CNY, and any such transactions carried out to hedge cash inflows connected with budgeted sales transactions, scheduled on a monthly basis, may well fall within those defined as “highly effective” on “highly probable” future transactions, and their economic effect is recorded on an accrual basis.
The efficacy assessment is aimed at proving the high correlation existing between the technical-financial characteristics of the risk being hedged (maturity, amount, etc.) and those of the hedging instrument, by carrying out specific retrospective and prospective tests.
The fair value of a derivative contract is calculated using the official listing prices for instruments traded in regulated markets. The fair value of instruments that are not listed on regulated markets is calculated using valuation models that are appropriate for each category of financial instrument, with market data related to the balance sheet date (such as interest rates, exchange rates, and volatility), discounting the expected cash flows based on interest rate curves and converting amounts in other currencies to the Euro through exchange rates provided by the European Central Bank.
SENSITIVITY ANALYSIS
The following analysis has been prepared in order to better identify the economic risks and changes in equity arising from possible changes in exchange rates.
The analysis is performed on year-end and average exchange rates for the period adjusted with the maximum and minimum values recorded over an observation period of 52 weeks in 2023, the volatility index of the main currencies used by the Group. The aim of the simulation is to show the impacts on the Group’s net profit and equity deriving from the translation of the financial statements of subsidiaries into the currency of the consolidated financial statements according to potential maximum fluctuations predicted by the analysis.
90 2023 ANNUAL REPORT
The Group considers that it is not subject to significant economic and equity impacts deriving from the management of transactions of the single legal entities forming part of the scope of consolidation in foreign currency.
MANAGEMENT OF CREDIT RISK
The Group's policy is to sell to customers after an evaluation of their credit capacity and therefore within pre-set credit limits. Historically, the Group has not suffered significant losses on receivables.
With reference to the changed economic conditions that marked the year 2023, it is believed that the risk connected to the reference value is higher. Consequently, the Group has strengthened its procedures for the selection of customers, monitoring of
IMPACT ON EQUITY (THOUSAND EUROS)
IMPACT
recoveries of credit and has set up a specific insurance coverage for 95% of receivables generated by the Holding company (with the exception of several historical customers with a grade of highly reliable), in respect of the credit lines assigned. The risk of insolvency has been adequately reflected in the accounts by the allocation of the specific provision for bad debts.
MANAGEMENT OF PRICE RISK
The Group is subject to the risk of fluctuation in the price of raw materials, particularly that of: aluminum, cast iron, copper and steel. Group companies review the sales prices of the products annually, transferring to customers increases in purchase costs in percentage terms compared to forecast indices, on the basis of specific trade indexing agreements.
91 COMER INDUSTRIES LOCAL CURRENCY RANGE LAST 52 WEEKS 2023 RANGE LAST 52 WEEKS 2023 RANGE LAST 52 WEEKS 2023 Source: UIC NET EQUITY NET PROFIT MIN MAX SPOT 12.31.2023 MIN MAX 2023 AVG 365 days MIN MAX US dollar 163,126 18,946 1.047 1.126 1.105 8,193 (2,689) 1.081 575.3 (688.6) British pound 22,276 14,798 0.851 0.893 0.869 541 (698) 0.870 373.6 (449.2) Chinese renminbi 599,254 126,712 7.205 8.101 7.851 6,848 (2,360) 7.660 1,045.9 (901.2) India rupee 1,011,445 262,275 86.421 92.449 91.905 698 (65) 89.300 97.8 (100.0) Brazilian real 38,513 3,888 5.186 5.776 5.362 243 (515) 5.401 29.8 (46.7) Russian ruble 87,203 (74,218) 84.531 117.201 115.484 276 (11) 88.397 (38.4) 206.3
ON NET PROFIT (THOUSAND EUROS)
2.6.17 REVENUE FROM CONTRACTS WITH CUSTOMERS
The breakdown of revenues by geographic region is as follows:
The Group closed 2023 with a decrease of -1.1% in total sales volumes, which stand at 1,223,938 thousand euros. At constant exchange rates, sales increased by 0.4% over 2022. The reduction in volumes is mainly due to contractions seen in Asia Pacific and Latin America, especially the Agricultural sector.
The turnover generated outside national borders remained around 90% of the total, a figure that confirms the continued propensity for international expansion.
2.6.18 OTHER OPERATING REVENUES
The breakdown of other operating revenues is as follows:
92 2023 ANNUAL REPORT
DESCRIPTION (THOUSAND EUROS) DECEMBER 31, 2023 INC. % DECEMBER 31, 2022 INC. % CHANGE % EMEA 724,853 59.2% 694,634 56.1% 4.4% NORTH AMERICA 270,872 22.1% 265,315 21.4% 2.1% ASIA PACIFIC 178,198 14.6% 208,751 16.9% -14.6% LATIN AMERICA 50,015 4.1% 68,875 5.6% -27.4% Total turnover by geographical area 1,223,938 100% 1,237,576 100% -1.1%
DESCRIPTION (THOUSAND EUROS) DECEMBER 31, 2023 DECEMBER 31, 2022 Recovery of manufacturing, repair, service and transportation expenses 1,758 1,979 Scrap sales 968 665 Capital gains, photovoltaic refund 373 230 Capitalized costs 267 275 Income from insurance claims 20 0 Other revenues and income including out-of-period income 2,536 3,779 Total other revenues and income 5,922 6,929
The recovery of production, repairs, services and transport costs heading includes, among other things, bonuses and volume awards on supplies, charges for design and endurance test expenses, and the recovery of logistical and repair costs.
Costs capitalized during the year for industrial product development projects amount to 267 thousand euros.
Overall, other income and revenues decreased in 2023 compared with the previous year.
2.6.19 PERSONNEL COSTS
Personnel costs in absolute terms stood at 240,646 thousand euros, decreasing by 2,998 thousand euros compared to 2022.
The heading also contains the annual production bonus and provision of the variable salary recognized upon the achievement of the financial and profitability objectives established for 2023.
2.6.20 REMUNERATION OF DIRECTORS AND STATUTORY AUDITORS
The fees of the Directors and Statutory Auditors of Comer Industries S.p.A. for the performance of their offices in the Parent Company and in the other enterprises included in the consolidation are as follows:
The amounts include fees payable for the period resolved by the Shareholders’ Meeting and the remunerations established by the Board of Directors for Directors attributed particular responsibilities, including bonuses. The values do not include social security and insurance contributions.
The Group does not have any stock grant and/or stock option plans in place as of today.
93 COMER INDUSTRIES
DESCRIPTION (THOUSAND EUROS) DECEMBER 31, 2023 DECEMBER 31, 2022 Directors 1,426 2,299 Statutory Auditors 50 50 Total compensation 1,476 2,349
2.6.21 OTHER OPERATING COSTS AND WRITE-DOWNS
The item other operating costs includes indirect charges associated with turnover, production and the corporate organizational structure such as rentals, utilities, leases and maintenance, insurance expenses, sales commissions, expenses related to product quality as well as losses in value related to impairment tests on rights of use relating to leased properties. Write-downs include provisions for bad debts and warranty for the year, before any uses.
As required by Art. 149-duodecies of the Issuer Regulation amended by Consob Resolution no. 15915 of May 3, 2007 published in Official Gazette no. 111 of May 15, 2007 (SO 115), the remuneration for the year 2023 for services provided by the audit firm Deloitte & Touche S.p.A. is as follows:
• annual and infra-annual audit engagements on Italian companies for 229 thousand euros;
• annual and infra-annual engagements for the audit of subsidiary companies for 446 thousand euros;
• other non-audit services for Italian companies amounting to 210 thousand euros.
All the above-described fees are included in the “other operating costs” heading.
2.6.22 OPERATING RESULT
The operating result achieved is equivalent to 144,428 thousand euros, corresponding to 11.8% of the consolidated turnover, increasing compared to 10.3% of the previous year. The adjusted operating result, which excludes depreciation and amortization attributable to the accounting of the business combinations of WPG and e-comer, amounted to 164,560 thousand euros (+15.2% compared to the previous year).
This result is mainly due to the effect of the ongoing efficiency drive in production and management processes throughout the Group. Further information can be found in the Directors’ Report on operations.
94 2023 ANNUAL REPORT
2.6.23 NET FINANCIAL INCOME / (CHARGES)
The details are as follows:
This item includes both realized differences between the historical exchange rates of the relevant transactions and the reference exchange rates of receipts and payments in foreign currency, and unrealized differences due to the translation of monetary items at the spot exchange rate at the end of the financial year. The loss is mainly attributable to the latter case, and in particular to the devaluation of the Chinese yuan and of the US dollar against the euro.
Interest and other net financial charges
The amount of interest payable on advances and loans of a banking nature, both long- and short-term (equal to 8,778 thousand euros) has deteriorated compared to the previous period (4,197 thousand euros) as a result of the sharp rise in the six-month Euribor during the year.
The Interest payable heading for discounting the pension funds refers to the recalculation according to IAS 19 of the amount allocated to provisions for severance pay by Italian, German and American companies.
95 COMER INDUSTRIES
DESCRIPTION (THOUSAND EUROS) DECEMBER 31, 2023 DECEMBER 31, 2022 Exchange gain (loss) (429) 4,842 Exchange gains and losses (429) 4,842 Bank interest receivable 609 445 Other interest income 247 558 Total financial income from cash management 856 1,003 Interest on advances, loans and other short-term bank borrowings (854) (1,810) Interest on medium/long-term loans (7,924) (2,770) Interest on loans amortized cost (924) (781) Interest expense on discounted employee severance indemnities (4,505) (1,708) Economic result of interest rate hedging transactions fair value as at 12/31 137 Total financial costs from cash management (14,207) (6,933) Interest resulting from the application of IFRS 16 (1,484) (1,500) Interest and other Net financial charges (14,835) (7,430) Financial income balance (15,264) (2,588) Exchange
gain (loss)
2.6.24
INCOME TAXES
The total tax burden is 35,129 thousand euros (34,213 thousand euros in 2022).
The consolidated tax charge calculated net of withholding tax on dividends from subsidiaries and tax credits, stands on December 31, 2023 at around 26.9% against 26.7% calculated correspondingly on the 2022 period.
This difference is mainly attributable to the different taxation in the countries where the Group operates, especially the higher
German tax burden. For more details on changes in deferred tax assets and liabilities, see Sections 2.6.4 and 2.6.11.
In order to better understand the reconciliation between the tax burden recognized in the financial statements and the theoretical tax burden, the following explanatory table is provided wherein the IRAP is not considered as this, being a tax with a tax base different from income before taxes, would generate distortions between one year and another. The reconciliation was therefore determined with reference to the single IRES tax rate in force in Italy, equal to 24.0%.
96 2023 ANNUAL REPORT
DESCRIPTION (THOUSAND EUROS) DECEMBER 31, 2023 DECEMBER 31, 2022 Consolidated profit before taxes 129,164 124,929 Parent Company theoretical tax rate 24% 24% Theoretical income taxes 30,999 29,983 Tax effect permanent differences Italian companies (1,438) (629) Effect of foreign tax rates different from the theoretical Italian tax rates (2,518) (2,605) Tax effect of taxation of dividends from consolidated companies 92 150 Bonus tax credit Legislative Decree 91/2014 0 (25) Tax effect of tax relief for Italian companies ACE (162) (113) Tax effect R&D credit Law 190/2014 art.1, para. 35 and energy credit (1,398) (1,776) Tax effect super-amort/depr (Law 208/2015) and hyper-amort/depr (Law 232/2016) (366) (453) Prior-year taxes and provisions (61) (332) Tax effect of actuarial gain (loss) IAS 19 (25) 0 Deferred tax effect Withholding tax 366 817 Deferred taxes recognized in the income statement (2,360) (1,419) Tax impact on consolidating entries 8,118 7,588 Income taxes recorded in the financial statements, excluding IRAP 31,248 31,184 Current IRAP 3,881 3,029 Income taxes posted to the financial statements (current, deferred) 35,129 34,213
2.6.25 EARNINGS PER SHARE
At the bottom of the income statement, the earnings/(loss) per share is reported, determined according to that manner provided in IAS 33, as summarized below.
The means of calculation of diluted earnings (loss) per share are defined by IAS 33 – Earnings per share. The basic earnings (loss) per share is defined as the ratio between the economic result or the results of continuing operations of the Group attributable to the holders of ordinary shares and the average number of ordinary shares outstanding during the year.
2.6.26
SIGNIFICANT EVENTS AFTER THE CLOSE OF THE YEAR AND BUSINESS OUTLOOK
As concerns the significant events after the end of the financial year, on February 3, 2024 the shareholders' agreement signed on December 1, 2021 and subsequently amended on June 14, 2023 between Comer Industries S.p.A., Eagles Oak S.r.l. and WPG Parent B.V. was terminated.
With regard to the foreseeable development of operations, note that the agricultural market has benefited from particularly sustained growth over the last year and a half, and is now facing a phase of decline in this excess demand, moving towards more limited growth rates aligned with historical trends. The sector was down in the final quarter of 2023 and is also expected to decrease in the first part of 2024, with expectations for a slight improvement in the second half of the year. On the other hand, the industrial sector, after benefiting from the economic recovery to less of an extent, is expected to perform better than the agricultural sector.
Overall, Management expects 2024 sales to be in line with the forecasts of the market’s major OEM players mentioned above, and a margin slightly lower than what was recorded in 2023.
Lastly, net of extraordinary transactions, the Group is expected to continue on its path of improving its net financial position thanks to the continuous generation of cash.
Reggiolo, March 13, 2024
For the Board of Directors
Matteo Storchi
President & CEO
97 COMER INDUSTRIES
DESCRIPTION (EURO UNITS) DECEMBER 31, 2023 DECEMBER 31, 2022 Consolidated net income for the period attributable to Parent Company shareholders 94,034,636 90,716,070 Average number of shares in circulation 28,677,304 28,678,090 Basic earnings per share (EPS) (€) 3.28 3.16 Diluted earnings per share (€) 3.28 3.16
CERTIFICATION OF THE CONSOLIDATED FINANCIAL STATEMENTS PURSUANT TO ARTICLE 154-BIS OF ITALIAN LEGISLATIVE DECREE 58/98
1. The undersigned Matteo Storchi, in his capacity as Chair of the Board of Directors and Chief Executive Officer, and Stefano Palmieri, in his capacity as Financial Reporting Officer of Comer Industries S.p.A., also taking into account the provisions of Article 154-bis, paragraphs 3 and 4, of Italian Legislative Decree no. 58 of February 24, 1998, attest to:
• the adequacy of the financial statements with respect to the company’s characteristics, and
• the effective application of administrative and accounting procedures for the preparation of the consolidated financial statements for 2023.
2. No issues worthy of note emerged in this regard.
Reggiolo, March 13, 2024
Financial Reporting Officer
Stefano Palmieri
3. We further attest that:
3.1 The consolidated financial statements:
a) were prepared in accordance with the applicable international accounting standards recognized in the European Community pursuant to Regulation (EC) no. 1606/2002 of the European Parliament and of the Council of July 19, 2022;
b) correspond to the figures in the books and records;
c) provide a true and fair view of the asset, economic and financial situation of the issuer and all the companies included in the consolidation.
3.2 The management report includes a reliable analysis of the trends and results of operations as well as the situation of the issuer and all companies included in the consolidation.
Chairman of the Board of Directors and Chief Executive Officer
Matteo Storchi
98 2023 ANNUAL REPORT
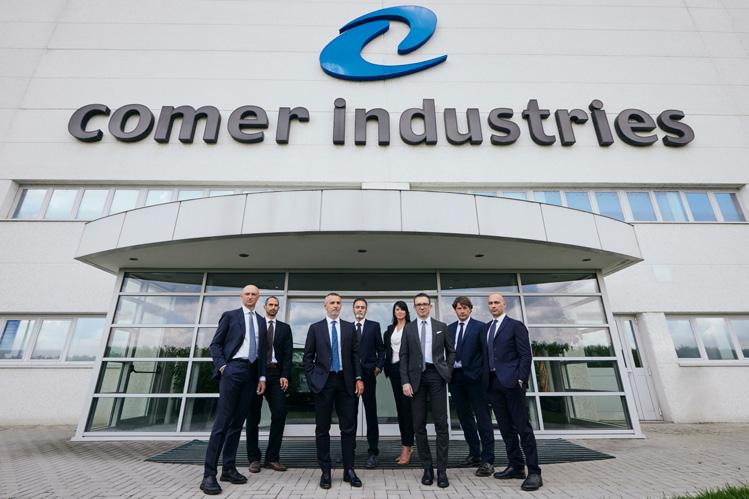
99 COMER INDUSTRIES
03 REPORT OF THE AUDIT FIRM
100 2023 ANNUAL REPORT
101 COMER INDUSTRIES

Opinion
We have audited the consolidated financial statements of Comer Industries S.p.A. and its subsidiaries (the “Group”), which comprise the consolidated statement of financial position as at December 31, 2023 and the consolidated statement of income, consolidated statement of comprehensive income, consolidated statement of changes in equity and consolidated statement of cash flows for the year then ended, and explanatory notes to the consolidated financial statements, including material accounting policy information.
In our opinion, the accompanying consolidated financial statements give a true and fair view of the consolidated financial position of the Group as at December 31, 2023 and of its consolidated financial performance and its consolidated cash flows for the year then ended in accordance with International Financial Reporting Standards as adopted by the European Union and the requirements of national regulations issued pursuant to art. 9 of Italian Legislative Decree no. 38/05.
B Bas is for Opinion
We conducted our audit in accordance with International Standards on Auditing (ISA Italia). Our responsibilities under those standards are further described in the Auditor’s Responsibilities for the Audit of the Consolidated Financial Statements section of our report. We are independent of Comer Industries S.p.A. in accordance with the ethical requirements applicable under Italian law to the audit of the financial statements. We believe that the audit evidence we have obtained is sufficient and appropriate to provide a basis for our opinion.
K Ke y A udit Matters
Key audit matters are those matters that, in our professional judgment, were of most significance in our audit of the consolidated financial statements of the current period. These matters were addressed in the context of our audit of the consolidated financial statements as a whole, and in forming our opinion thereon, and we do not provide a separate opinion on these matters.
Ancona Bari Bergamo Bologna Brescia Cagliari Firenze Genova Milano Napoli Padova Parma Roma Torino Treviso Udine Verona
Sede Legale: Via Tortona, 25 - 20144 Milano | Capitale Sociale: Euro 10.328.220,00 i.v.
Codice Fiscale/Registro delle Imprese di Milano Monza Brianza Lodi n. 03049560166 - R.E.A. n. MI-1720239 | Partita IVA: IT 03049560166
Il nome Deloitte si riferisce a una o più delle seguenti entità: Deloitte Touche Tohmatsu Limited, una società inglese a responsabilità limitata (“DTTL”), le member firm aderenti al suo network e le entità a esse correlate. DTTL e ciascuna delle sue member firm sono entità giuridicamente separate e indipendenti tra loro. DTTL (denominata anche “Deloitte Global”) non fornisce servizi ai clienti. Si invita a leggere
102 2023 ANNUAL REPORT
l’informativa completa relativa alla descrizione della struttura legale di Deloitte Touche Tohmatsu Limited e delle sue member firm all’indirizzo www.deloitte.com/about.
Deloitte & Touche S.p.A.
&
S.p.A. Piazza Malpighi, 4/2 40123 Bologna Italia
IND EPE NDE NT AUDITOR ’S R EPOR T PURSUANT TO ARTIC LE 14 OF LEG ISLA TIVE D EC REE No 39 OF JANUARY 27, 2010 A ND ARTICLE 10 O F TH E EU REGULATION 537/ 2014
©
Deloitte
Touche
Tel: +39 051 65811 Fax: +39 051 230874 www.deloitte.it
To the Shareholders of Comer Industries S p A REPORT ON THE AUDIT OF THE CONSOLIDATE D FINANCIAL STATEME NTS

G oodw ill Impairment test
D escri ption of the key au dit matter
A udit proc edures pe rformed
The consolidated financial statements include values of goodwill for a total amount of Euro 170 million, allocated to the three cash generating units (“CGUs”) identified by the Group as “Industrial Sector”, “Agricultural Sector” and “e-comer”.
During the year, in connection with the process of internal reorganization and simplification of the organizational and control model of the Group’s business, as well as the finalized integration of Walterscheid Group, acquired at the end of 2021, the Management identified a new CGU as a result of the acquisition of e-comer S.r.l. and reassessed the existing ones.
As required by the International Accounting Standard IAS 36, goodwill is not amortized and is subject to impairment test at least annually, by comparing the recoverable amounts of the CGUs identified by Group, determined according to the value-of-use methodology, and the related accounting values of net invested capital as at December 31, 2023.
The evaluation process provided for in IAS 36 is complex and is based on assumptions concerning, inter alia, the forecast of expected CGUs cash flows, the definition of an appropriate discount rate (WACC) and of a longterm growth (g-rate). The assumptions underlying the impairment tests are, by nature, influenced by future expectations about the evolution of the external market conditions connected also to the business, which determine elements of physiological estimation uncertainty.
In view of the subjectivity and uncertain nature of the estimates relating to the determination of CGUs cash flows and of the key variables of the impairment model, we considered the impairment tests as a key audit matter for the audit of Comer Group consolidated financial statements audit.
The explanatory notes to the consolidated financial statements in paragraph “2.6.2 Intangible fixed assets” describe the valuation process applied by Management and the significant assumptions used in the tests, including the results of the sensitivity analysis effects of changes in key variables used for impairment tests.
In the context of our audit we have carried out the following procedures, also using the support of our network experts:
understanding of the process and relevant controls designed and implemented by Management for the preparation and approval of the impairment tests , including the revisiting work of CGUs;
analysis of the reasonableness of the main assumptions adopted for the formulation of cash flow forecasts;
analysis of the actual results 2023 compared to the related expectations in order to assess the nature of the deviations and the reliability of the planning process of the forecast data;
103 COMER INDUSTRIES 2

assessing the reasonableness of the discount rate (WACC) and long-term growth rate (g-rate) applied, by identifying and observing external sources usually used in the practice;
test of the clerical accuracy of the model used to calculate the value in use for the CGUs;
analysis of the report prepared by the expert used by Management, in order to evaluation the independence and professional credentials;
test of the accurate determination of the carrying amount of the CGUs;
test of the sensitivity analysis prepared by the Management. Finally, we examined the adequacy and compliance of the disclosure provided by the Directors on impairment tests with respec t to IAS 36.
A ccounting of t he acquisition of e -come r S r l
D escri ption of the key au dit matter
A udit proc edures pe rformed
The consolidated financial statements of the Comer Group include the income statement and financial position arising from the purchase of 100% of e-comer S.r.l., which was finalized on January 9, 2023.
The acquisition was recognized in the consolidated financial statements in accordance with the international accounting standard IFRS3 “Business combinations” following the acquisition method and involved the purchase price allocation process that required Management to evaluate the acquisition-date fair value of the assets acquired and liabilities assumed. In consideration with the inherent estimation uncertainty that exists in fair value measurements mentioned above, we identified the Business Combination as a key audit matter for the audit of the Group’s consolidated financial statements.
The explanatory notes to the consolidated financial statements in the paragraph 2.5.1 “Accounting impacts of the Purchase Price Allocation derived from the acquisition of e-comer S.r.l.” describe in detail the accounting process applied by Management.
In the context of our audit, we have carried out the following procedures, also using the support of our network experts:
discussion with Group management focused on understanding the structure of the operation and its purposes;
analysis of the agreements between the parties and minutes of the corporate bodies in which the deal was discussed and deliberated;
verification of the accounting treatment adopted by the Group in accordance with the accounting standards applicable in the circumstance;
examination of the criteria of determining the cost of acquisition, for the identification of acquired assets and liabilities assumed, for the estimate of fair values and for the method of determining the residual goodwill, including by reviewing documentation prepared by the Management;
analysis of the report prepared by the expert used by Management, in order to evaluation the independence and professional credentials;
verification of the accuracy of the accounting entries.
104 2023 ANNUAL REPORT 3
Finally, we examined the adequacy of the disclosure provided by the Directors on the operation of business aggregation and its compliance with the provisions of the IFRS 3.
R Res ponsibilities of the Directo rs and the Boa rd of S tatutory Auditors for the Conso lidate d Financ ial Statements
The Directors are responsible for the preparation of consolidated financial statements that give a true and fair view in accordance with International Financial Reporting Standards as adopted by the European Union and the requirements of national regulations issued pursuant to art. 9 of Italian Legislative Decree no. 38/05, and, within the terms established by law, for such internal control as the Directors determine is necessary to enable the preparation of consolidated financial statements that are free from material misstatement, whether due to fraud or error.
In preparing the consolidated financial statements, the Directors are responsible for assessing the Group’s ability to continue as a going concern, disclosing, as applicable, matters related to going concern and using the going concern basis of accounting unless they have identified the existence of the conditions for the liquidation of the Company or the termination of the business or have no realistic alternatives to such choices.
The Board of Statutory Auditors is responsible for overseeing, within the terms established by law, the Group’s financial reporting process.
A Auditor’s R espons ibilities for the Audit
of the C onso lidated Fina ncial Sta tements
Our objectives are to obtain reasonable assurance about whether the consolidated financial statements as a whole are free from material misstatement, whether due to fraud or error, and to issue an auditor’s report that includes our opinion. Reasonable assurance is a high level of assurance, but is not a guarantee that an audit conducted in accordance with International Standards on Auditing (ISA Italia) will always detect a material misstatement when it exists. Misstatements can arise from fraud or error and are considered material if, individually or in the aggregate, they could reasonably be expected to influence the economic decisions of users taken on the basis of these consolidated financial statements.
As part of an audit in accordance with International Standards on Auditing (ISA Italia), we exercise professional judgment and maintain professional skepticism throughout the audit. We also:
Identify and assess the risks of material misstatement of the consolidated financial statements, whether due to fraud or error, design and perform audit procedures responsive to those risks, and obtain audit evidence that is sufficient and appropriate to provide a basis for our opinion. The risk of not detecting a material misstatement resulting from fraud is higher than for one resulting from error, as fraud may involve collusion, forgery, intentional omissions, misrepresentations, or the override of internal control.
Obtain an understanding of internal control relevant to the audit in order to design audit procedures that are appropriate in the circumstances, but not for the purpose of expressing an opinion on the effectiveness of the Group’s internal control.
Evaluate the appropriateness of accounting policies used and the reasonableness of accounting estimates and related disclosures made by the Directors.
105 COMER INDUSTRIES 4
Conclude on the appropriateness of management’s use of the going concern basis of accounting and, based on the audit evidence obtained, whether a material uncertainty exists related to events or conditions that may cast significant doubt on the Group’s ability to continue as a going concern. If we conclude that a material uncertainty exists, we are required to draw attention in our auditor’s report to the related disclosures in the consolidated financial statements or, if such disclosures are inadequate, to modify our opinion. Our conclusions are based on the audit evidence obtained up to the date of our auditor’s report. However, future events or conditions may cause the Group to cease to continue as a going concern.
Evaluate the overall presentation, structure and content of the consolidated financial statements, including the disclosures, and whether the consolidated financial statements represent the underlying transactions and events in a manner that achieves fair presentation.
Obtain sufficient appropriate audit evidence regarding the financial information of the entities or business activities within the Group to express an opinion on the consolidated financial statements. We are responsible for the direction, supervision and performance of the group audit. We remain solely responsible for our audit opinion.
We communicate with those charged with governance, identified at an appropriate level as required by ISA Italia, regarding, among other matters, the planned scope and timing of the audit and significant audit findings, including any significant deficiencies in internal control that we identify during our audit.
We also provide those charged with governance with a statement that we have complied with relevant ethical requirements regarding independence applicable in Italy, and to communicate with them all relationships and other matters that may reasonably be thought to bear on our independence, and where applicable, actions taken to eliminate threats or safeguards applied.
From the matters communicated with those charged with governance, we determine those matters that were of most significance in the audit of the consolidated financial statements of the current period and are therefore the key audit matters. We describe these matters in our auditors’ report.
O Other informa tion c ommunicate d pursua nt to art 10 of the E U R e gulation 537/201 4
The Shareholders' Meeting of Comer Industries S.p.A. appointed us on May 31, 2023 as auditors of financial statements and consolidated financial statements of the Company for the years until December 31, 2029.
We declare that we have not provided prohibited non-audit services referred to in art. 5 (1) of EU Regulation 537/2014 and that we have remained independent of the Company in conducting the audit.
We confirm that the opinion on the financial statements expressed in this report is consistent with the additional report to the Board of Statutory Auditors, in its role of Audit Committee, referred to in art. 11 of the said Regulation.
106 2023 ANNUAL REPORT 5
Opinion on the complia nce with the pro vis ions of the Delega ted Regulation (E U) 2019/8 15
The Directors of Comer Industries S.p.A. are responsible for the application of the provisions of the European Commission Delegated Regulation (EU) 2019/815 with regard to the regulatory technical standards on the specification of the single electronic reporting format (ESEF – European Single Electronic Format) (hereinafter referred to as the “Delegated Regulation”) to the consolidated financial statements as at December 31, 2023, to be included in the annual financial report.
We have carried out the procedures set forth in the Auditing Standard (SA Italia) n. 700B in order to express an opinion on the compliance of the consolidated financial statements with the provisions of the Delegated Regulation.
In our opinion, the consolidated financial statements as at December 31, 2023 have been prepared in XHTML format and have been marked up, in all material respects, in accordance with the provisions of the Delegated Regulation.
Due to certain technical limitations, some information contained in the explanatory notes to the consolidated financial statements, when extracted from XHTML format in an XBRL instance, may not be reproduced in the same way as the corresponding information displayed in the consolidated financial statements in XHTML format.
O Opinion pur sua nt to ar t 14 parag raph 2 (e) of Leg islative D ecree 39/10 and art 123-bis, parag raph 4, of Legislative Decre e 58/98
The Directors of Comer Industries S.p.A. are responsible for the preparation of the report on operations and the report on corporate governance and the ownership structure of Comer Group as at December 31, 2023, including their consistency with the related consolidated financial statements and their compliance with the law.
We have carried out the procedures set forth in the Auditing Standard (SA Italia) n. 720B in order to express an opinion on the consistency of the report on operations and some specific information contained in the report on corporate governance and the ownership structure set forth in art. 123-bis, n. 4 of Legislative Decree 58/98, with the consolidated financial statements of Comer Group as at December 31, 2023 and on their compliance with the law, as well as to make a statement about any material misstatement.
In our opinion, the above-mentioned report on operations and some specific information contained in the report on corporate governance and the ownership structure are consistent with the consolidated financial statements of Comer Group as at December 31, 2023 and are prepared in accordance with the law.
With reference to the statement referred to in art. 14, paragraph 2 (e), of Legislative Decree 39/10, made on the basis of the knowledge and understanding of the entity and of the related context acquired during the audit, we have nothing to report.
107 COMER INDUSTRIES 6 RE PO RT ON OTHER LEG AL A ND REGULATORY R EQ UIR EME NTS
Statement pu rsuant to ar t 4 of the Consob R egulation for the implementat ion of Leg isla tive D ec ree 30 Dece mber 2016, no 254
The Directors of Comer Industries S.p.A. are responsible for the preparation of the non-financial statement pursuant to Legislative Decree 30 December 2016, no. 254.
We verified the approval by the Directors of the non-financial statement.
Pursuant to art. 3, paragraph 10 of Legislative Decree 30 December 2016, no. 254, this statement is subject of a separate attestation issued by us.
DELOITTE & TOUCHE S.p.A.
Signed by S Stefan o Montan ari Partner
Bologna, Italy
March 20, 2024
This independent auditor’s report has been translated into the English language solely for the convenience of international readers. Accordingly, only the original text in Italian language is authoritative.
108 2023 ANNUAL REPORT 7
COMER INDUSTRIES