We are working towards endorsement of this title for the Cambridge Pathway.


We are working towards endorsement of this title for the Cambridge Pathway.
We are working towards endorsement of this title for the Cambridge Pathway.
We are working towards endorsement of this title for the Cambridge Pathway.
We
We
Chapter 1
By the end of this chapter, you will be able to:
• define and give examples of the basic economic problem
• explain the concept of scarcity
• give examples of the basic economic problem in the context of consumers, workers, producers/firms, gover nments
• explain the key resource allocation decisions answering the three basic economic questions of what to produce, how to produce and for who to produce
• explain the difference between economic goods and free goods.
Do you have everything you need to live? What about everything you would like to have? Some people do not have basic goods and services needed to live as they do not have enough food, clothing or adequate housing. Once our needs for sufficient food, clothing and housing are met, we will still want other products. Indeed, our wants are unlimited. The richer we get, the more, and the better, quality products we would like. Many of us would like, for instance, more holidays and the latest smartphone. This chapter will look at why we cannot have everything we would like.
Stuck in traffic
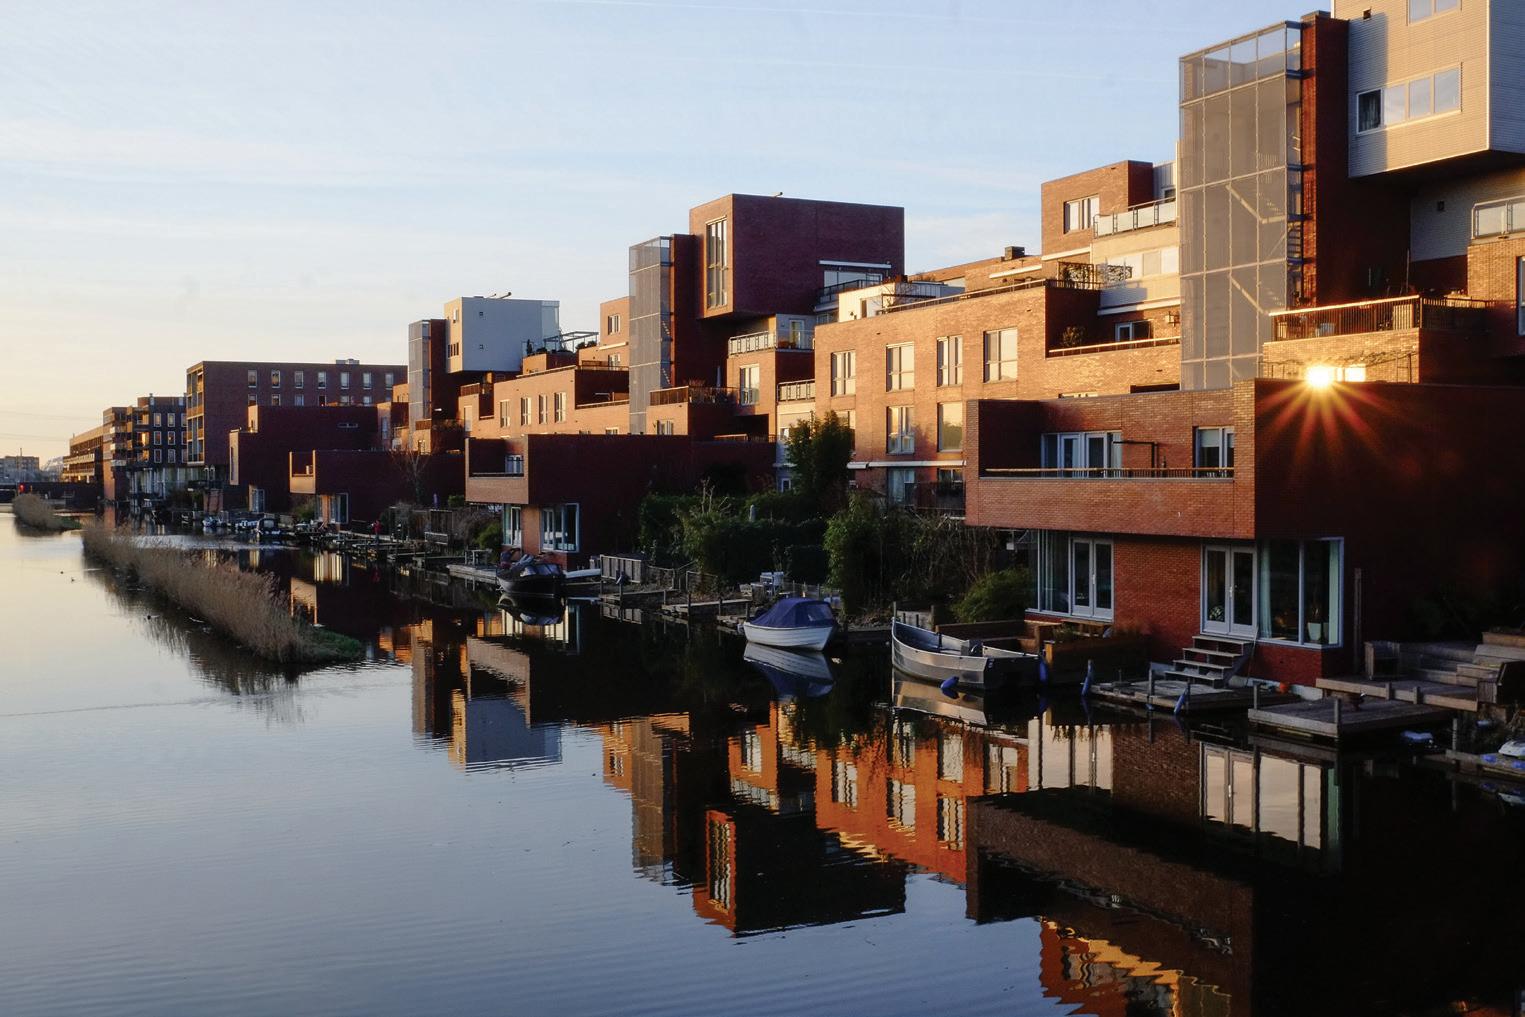
In October 2023, people sat in their cars for three hours, stuck in a traffic jam in Panathur, India. As a result, workers were late for work, students missed lessons and friends did not meet up. In many towns and cities throughout the world, drivers and their passengers waste time and often become stressed when stuck in long queues of slow-moving or stationary traffic (see Figure 1.1).
Traffic jams occur because the number of cars and other vehicles grows faster than road space. Every year more people own a car and some people own more than one car. The average number of cars per household in India is rising every year.
Discuss in a pair or group:
1 Does everyone who wants a car own a car?
2 Is there enough spare land available where you live to build more roads?
KEY TERM
wants: desires for goods and services.
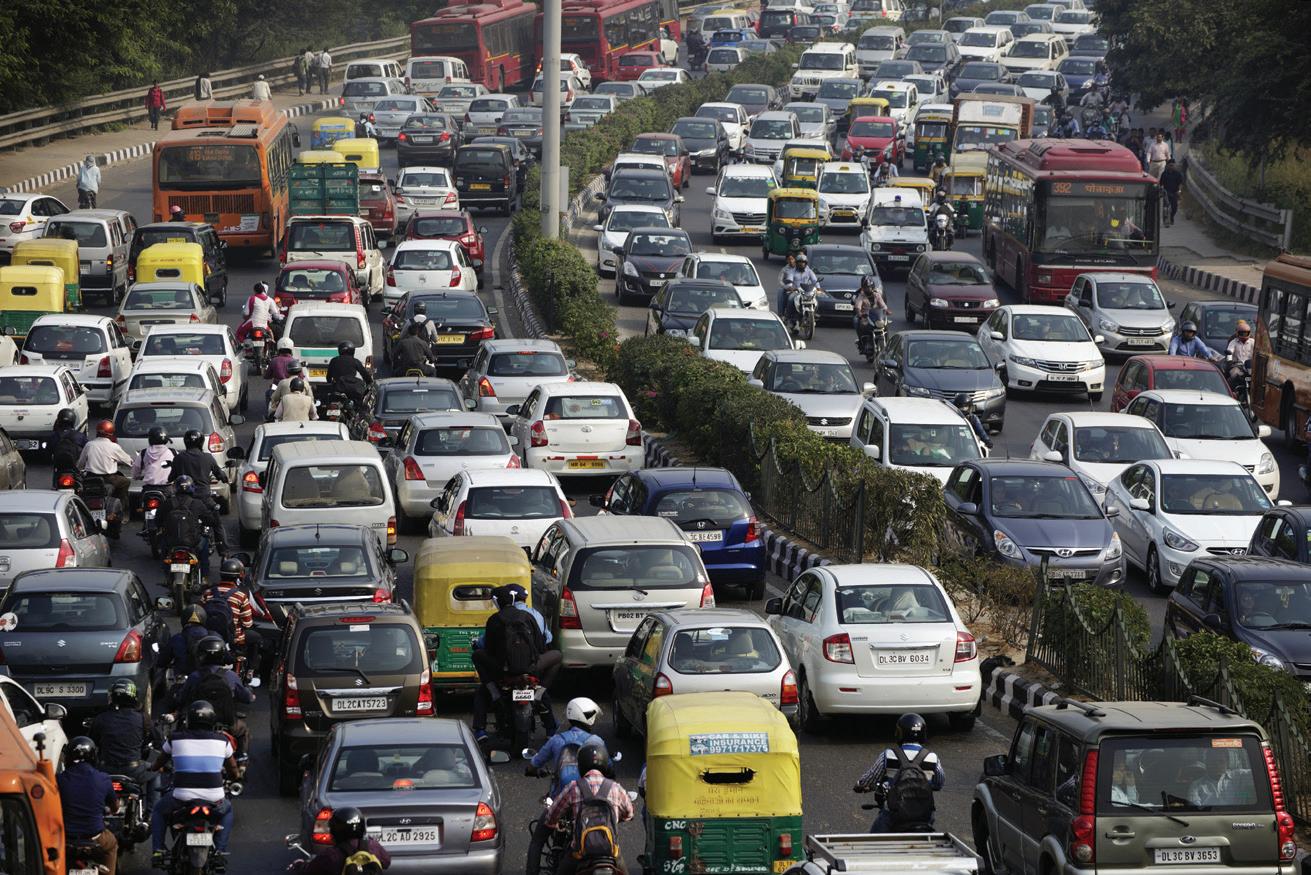
Figure 1.1: Increasing car ownership can cause problems
There is no limit to people’s wants. Wants are infinite (unlimited) while the resources that are required to make the things people want are finite (limited). For instance, people want more and better clothing, more and better healthcare and improved transport infrastructure. In contrast, resources, that is the number of workers, machines, offices, factories, raw materials and land used to produce goods and services, are scarce. For example, at any given time there are only a limited number of workers, and they can produce only a specified amount (see Figure 1.2).
The mismatch between what people want and the maximum that can be produced gives rise to the basic economic problem. The basic economic problem of not being able to satisfy everyone’s wants arises because of the scarcity of resources. Choices have to be made about how resources are to be used.
KEY TERMS
resources: inputs used to produce goods and services. the basic economic problem: where unlimited wants are greater than finite resources.
scarcity: a situation where there are not enough resources to satisfy everyone’s wants.
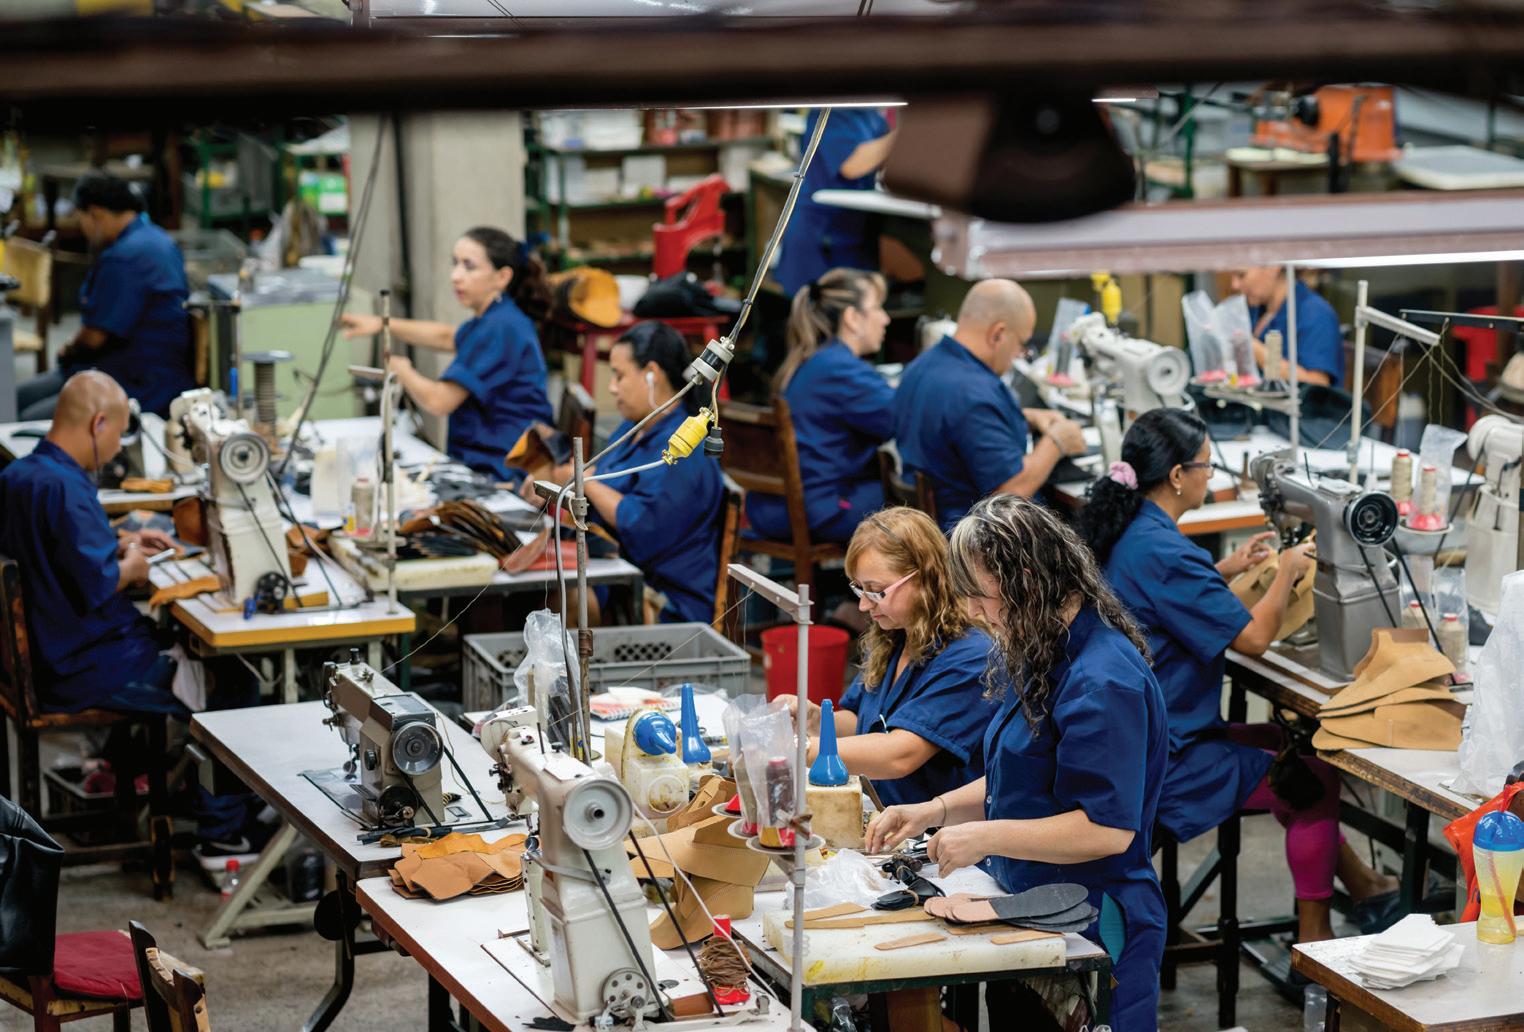
Figure 1.2: There is a limit to how much workers can produce
Scarcity continues to exist. More goods and services are being produced today than ever before, but the growth in wants is exceeding the growth of economic resources. People still want more products than the available resources can produce. Over time, wants continue to grow and change.
The fact that people have to choose which products to buy, which subjects to study, what jobs to do and which products to produce shows that there are insufficient (not enough) resources. As consumers, we cannot have everything we want. We have limited incomes. Students have to select which courses to study. It is not always possible to study economics and chemistry at the same time. Workers have to make choices about what jobs they do. Some teachers may carry out other work in the evening, but when they are teaching they are not working as writers! Time is in limited supply. Producers have to decide what to make. Farmers cannot grow rice and wheat on the same land. They have to select one crop as land is scarce. The government has to decide how to spend tax revenue. Deciding to build a new hospital may mean that it is not possible to build a new school.
It is very important to learn definitions of economic terms. The more you apply a term, such as ‘scarcity’, in your work, the sooner you will get used to using it. You may also want to compile your own economics dictionary by writing down terms in alphabetical order as you come across them.
In your group, discuss and decide which of the following are scarce:
a vacancies for university degree courses
b food
c healthcare.
Note down the group’s decision in each case and why you reached your decision.
Challenges facing the tourism industry in the Maldives
The Maldives is a country with more than a thousand islands. It is now one of the world’s most popular places to go for a holiday. The country opened its first holiday resort in 1972 and attracted a thousand tourists (see Figure 1.3). By 2023, 1.8 million tourists visited the country. Many Maldivian workers are employed directly in tourism or indirectly in jobs involved in supplying goods and services used in tourism. Some of the most popular islands now have no space left for hotels, restaurants or souvenir shops. Tourists also increase the amount of waste in the country, including plastic waste. Most of this waste is burnt which causes air pollution and some leaks into the sea which pollutes the water around the Maldives.
1 What may limit the number of holidays abroad a person can take?
2 What may limit the number of foreign tourists the Maldives can host?
All economies have to answer three fundamental economic questions:
1 What to produce?
2 How to produce it?
3 Who is to receive the products produced?

The economic questions arise because of the basic economic problem of infinite wants exceeding finite resources. A decision has to be made as to how the economy’s resources are to be allocated. For example, how many resources should be allocated to healthcare, how many to leisure goods and services and how many to education.
We are working towards endorsement of this title for the Cambridge Pathway.
Once the decision is made, an economy has to decide on how the products are to be produced, for example, whether a large number of workers should be used in agriculture or more machines used. Finally, because it is not possible to produce enough goods and services to satisfy the wants of everyone, it is necessary to decide how the products should be distributed. Should products be distributed to people according to their needs or their ability to earn a high income?
Decide whether each of the questions in Table 1.1 relates to what to produce, how to produce or who to produce for. Copy and complete the table.
Table 1.1
Question
1 Should a car manufacturer focus on producing electric cars?
2 Should a government provide free healthcare to all of its citizens?
3 Should everyone have the same income?
4 Should farmers make use of drones?
5 Should farmers use more of their land to grow maize and less to grow millet?
6 Should workers be used to produce luxury goods or necessities (essential goods)?
Key resource allocation decision
Compare your answers with another student. If you disagreed on any of the questions, were you able to explain your answer? If some of your answers were not correct, what strategy did you use to increase your understanding?
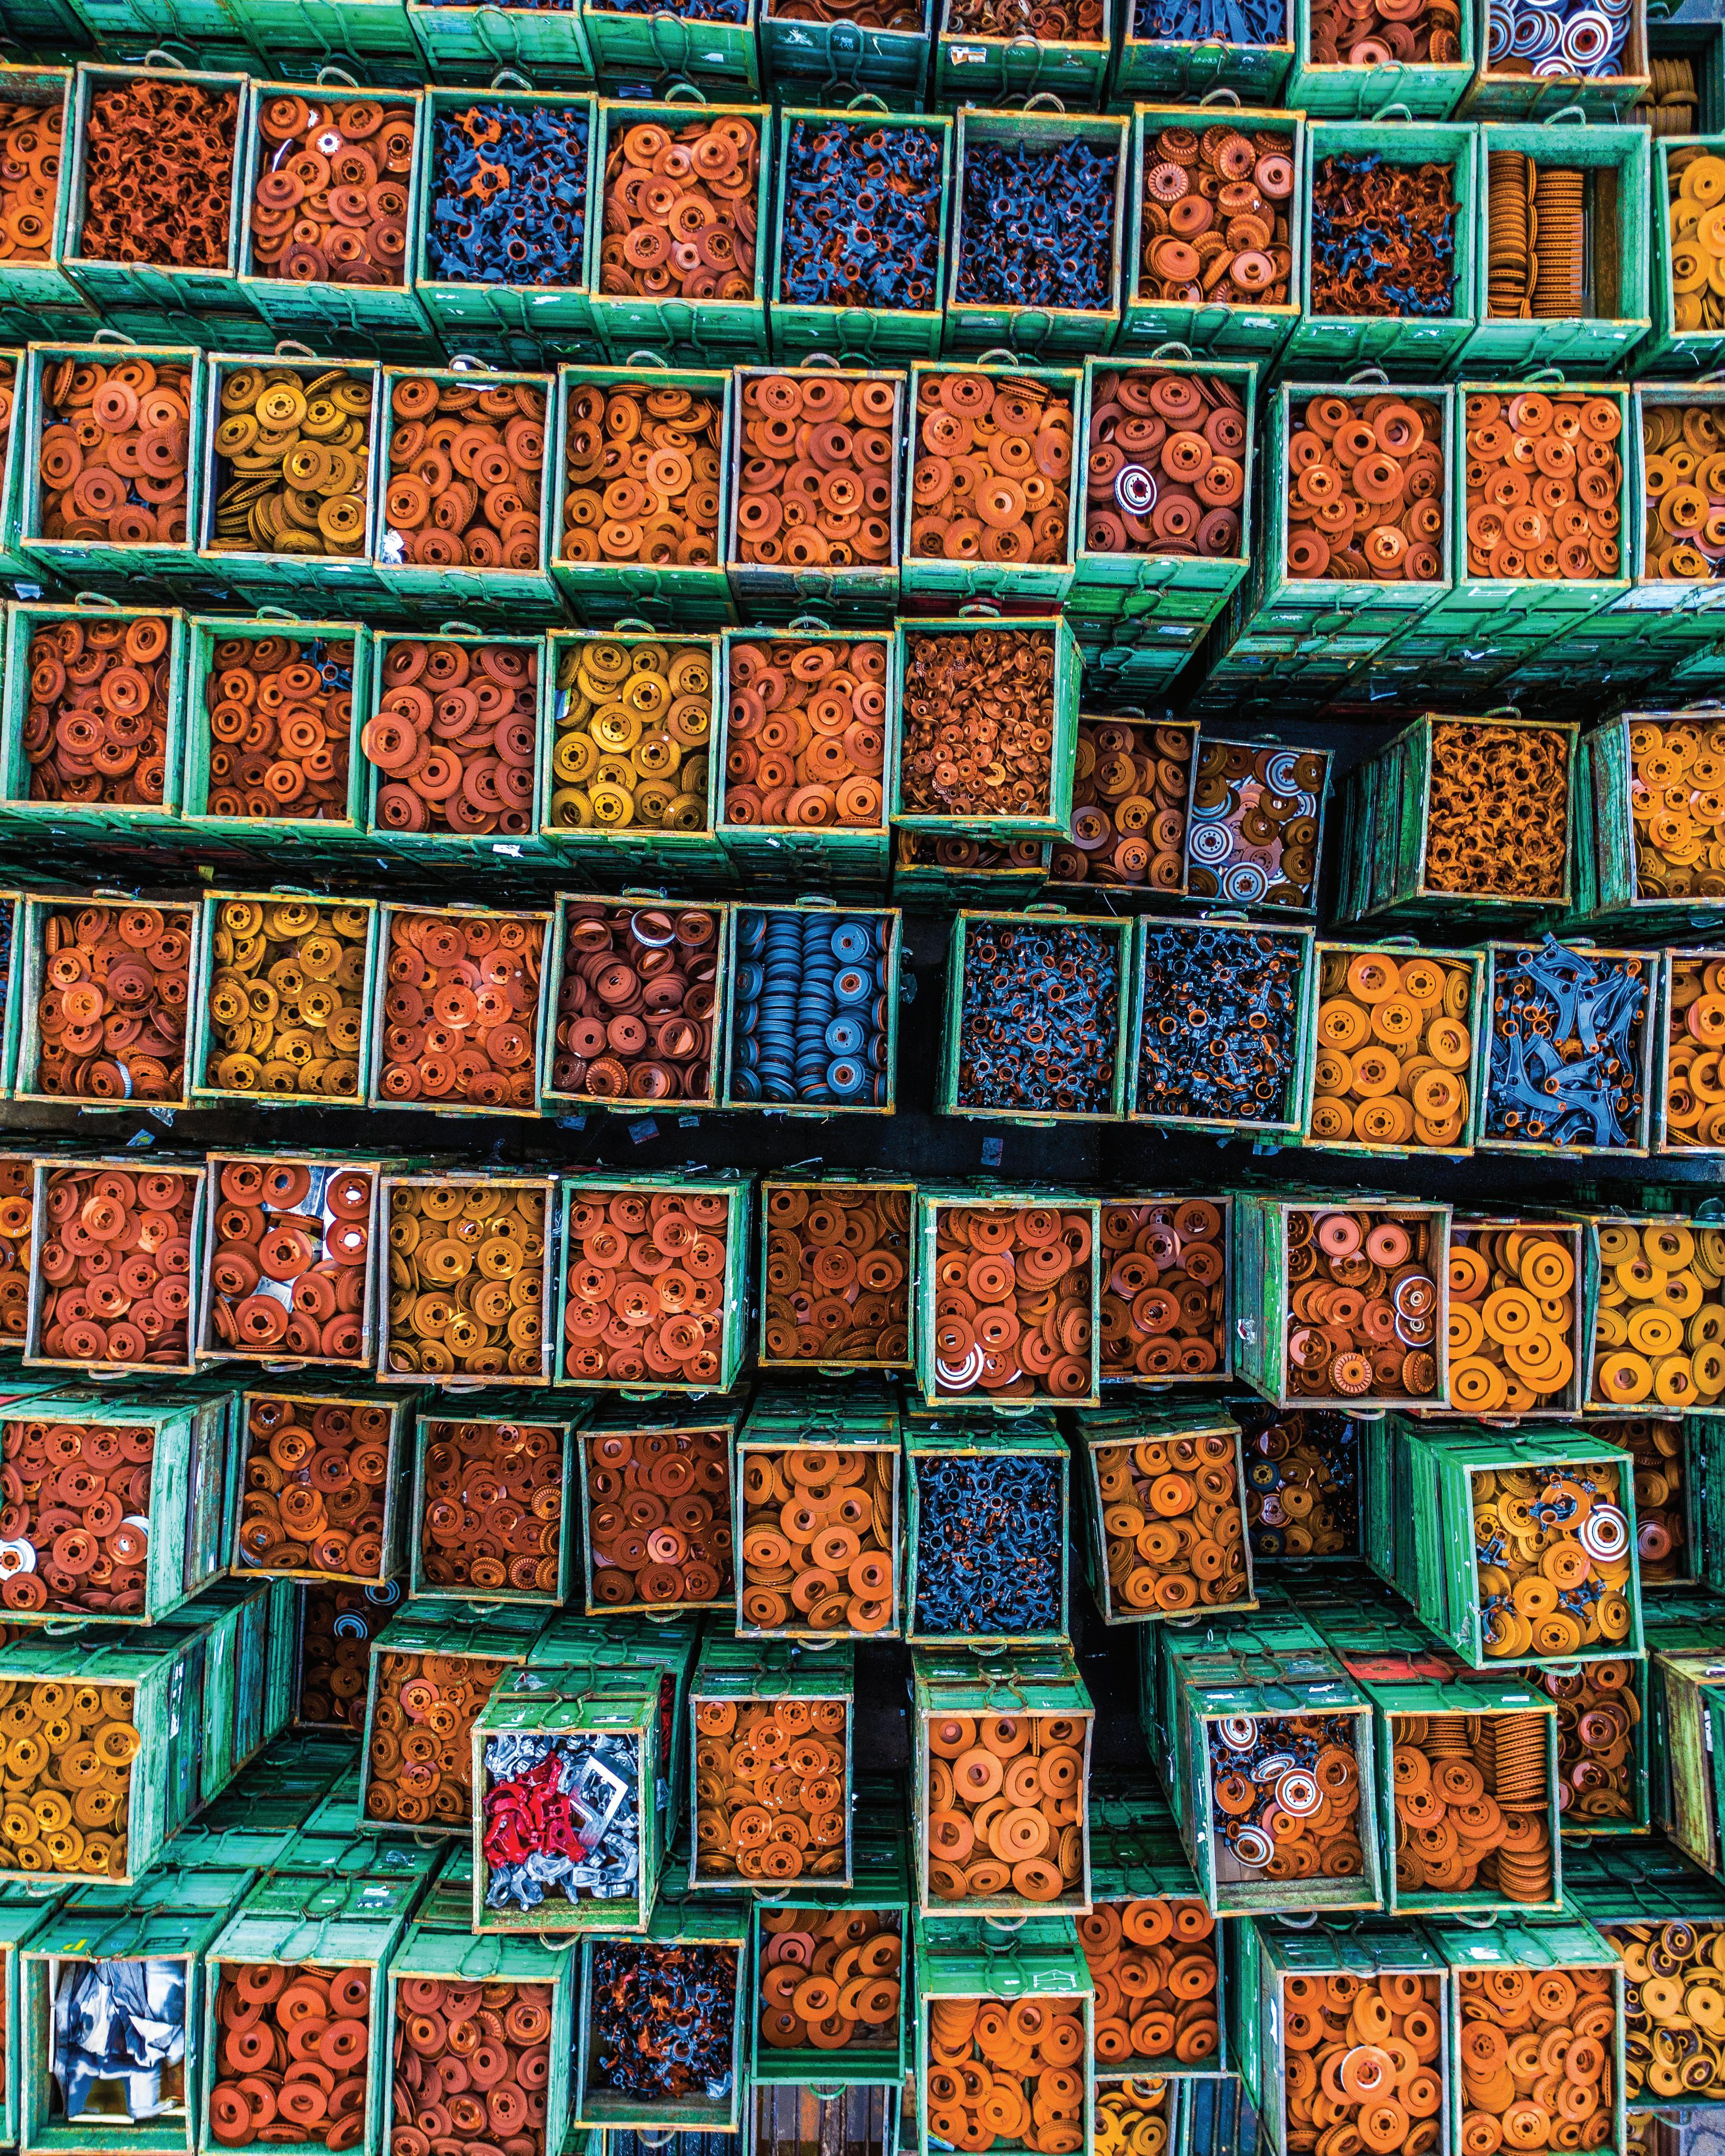
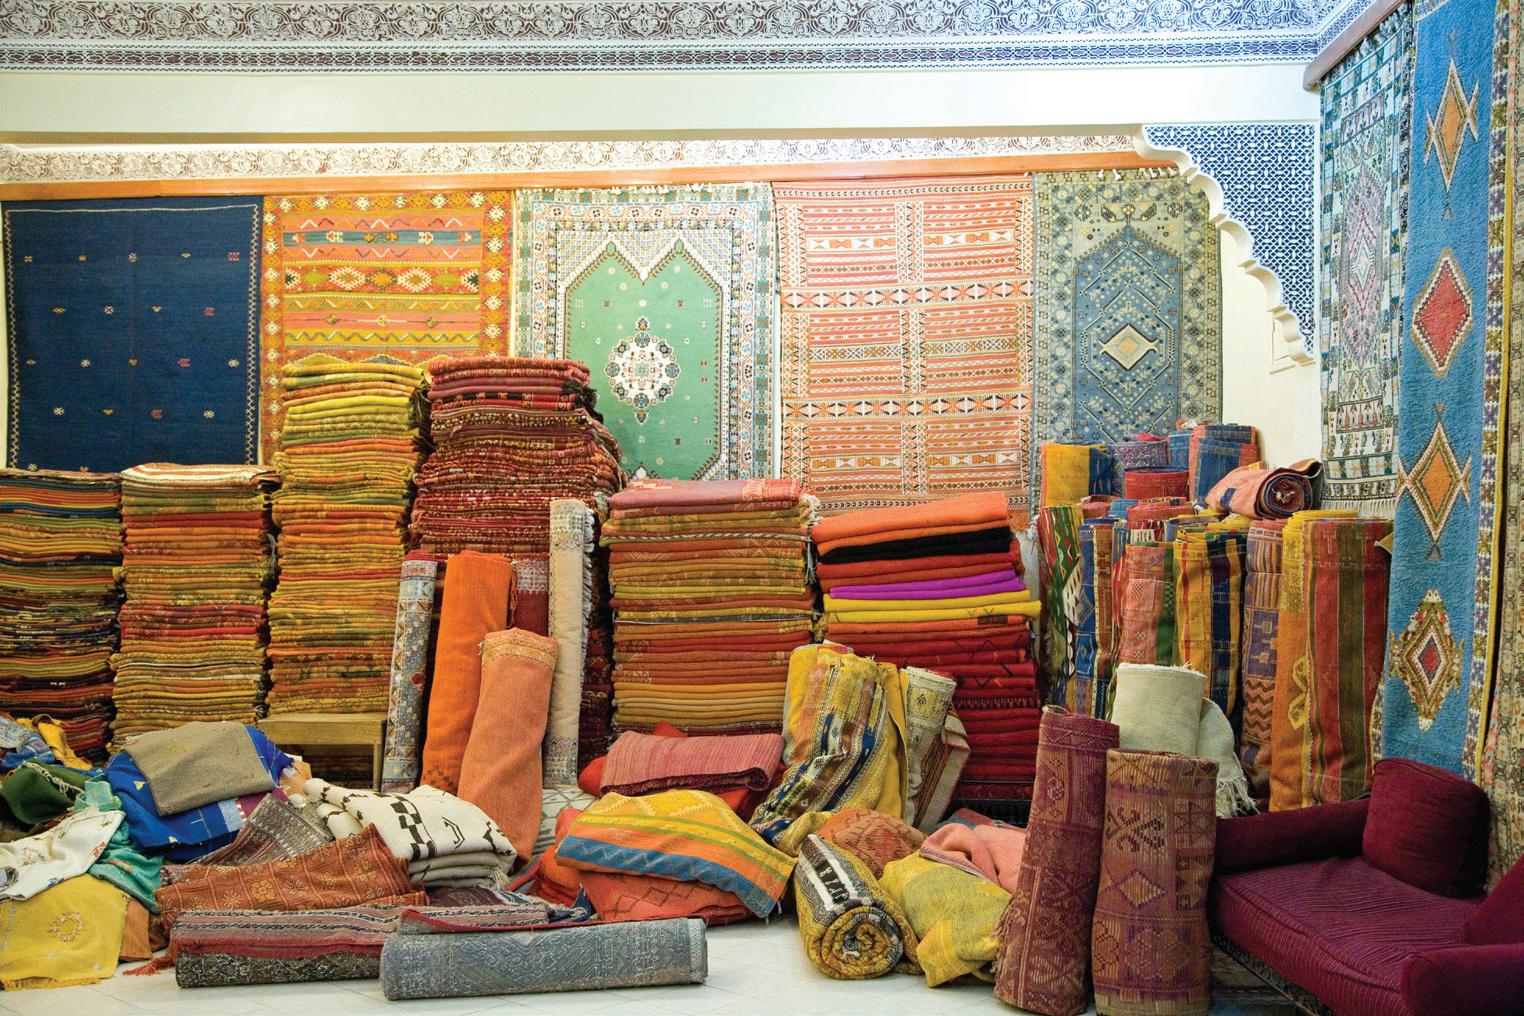
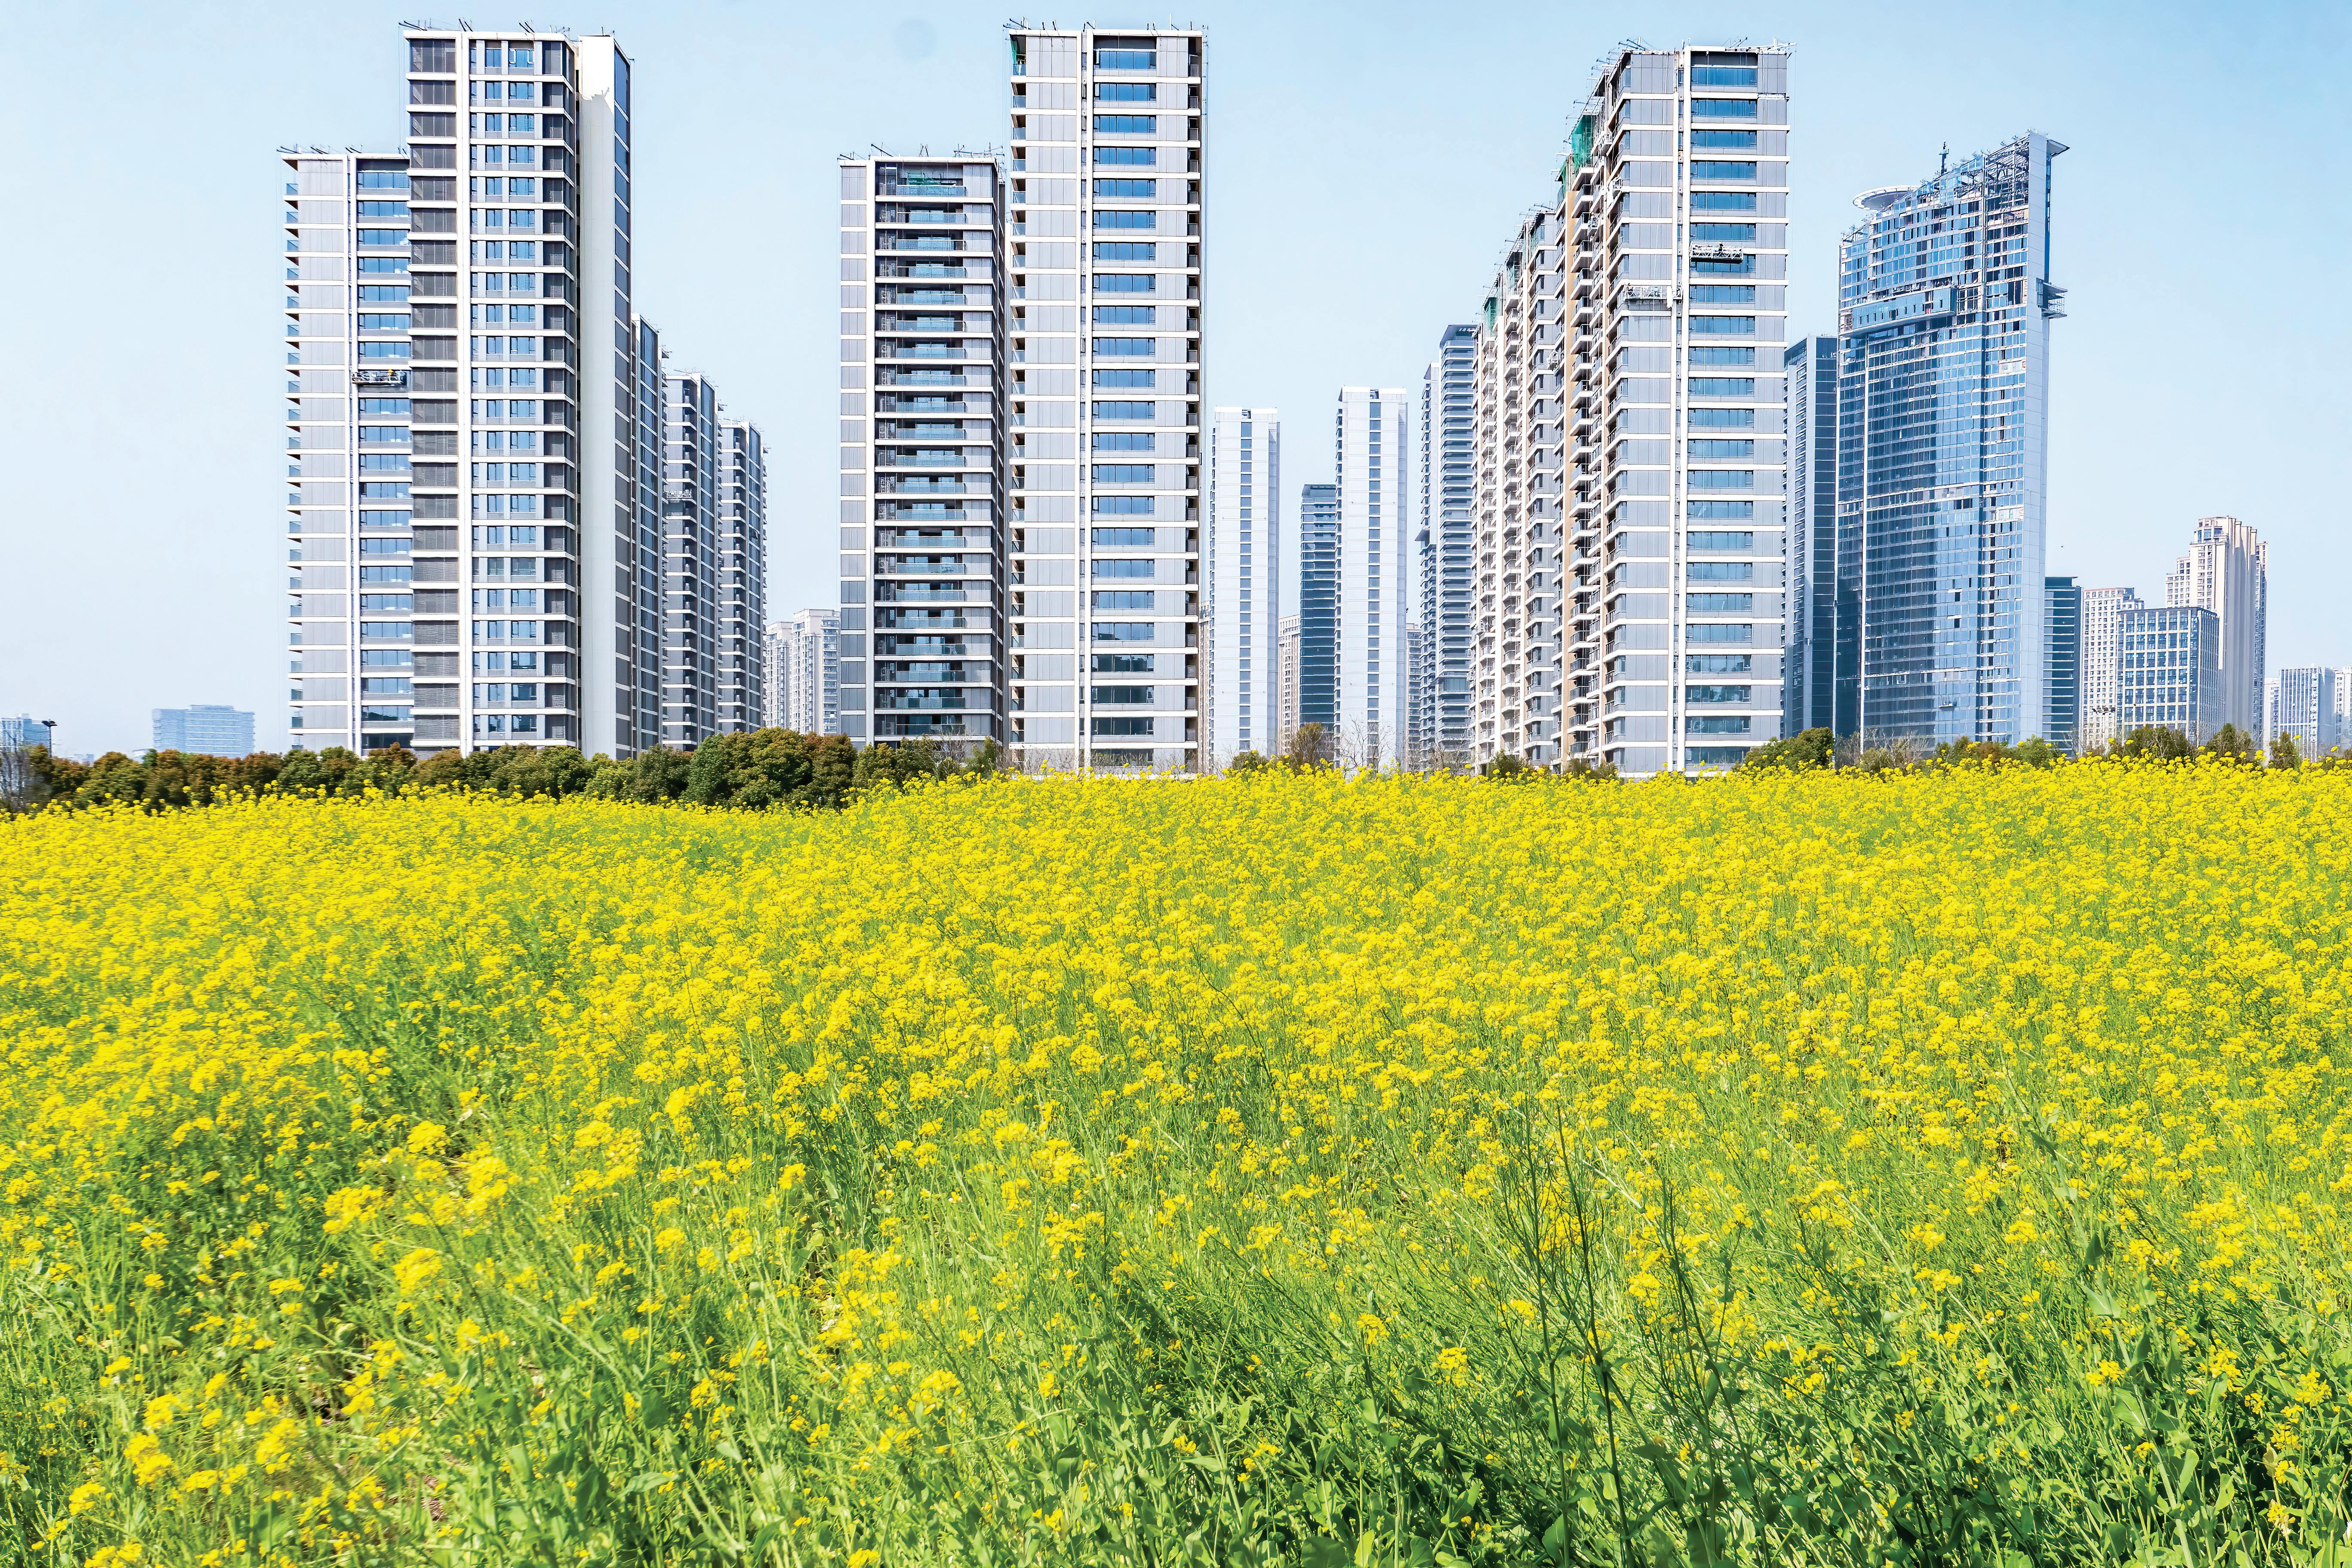
Most goods and services are economic goods. Resources are used to produce economic goods, and so they are limited in supply. For example, a carpet is an economic good (see Figure 1.4). The material and labour used to produce it could have been used to make another good (or goods). It is easy to find examples of economic goods. Almost every good and service you can think of is an economic good. Your education is an economic good, since your teachers and the other resources used to provide it could have been employed to make other products.
economic good: a product which requires resources to produce it.
Free goods are much rarer. When most people talk about free goods, they mean products they do not have to pay for. These are not usually free goods in the economic sense since resources have been used to produce them. Economists define a free good as one that takes no resources to make it. It is hard to think of examples of free goods. Sunshine is one such example, and so is water in a river (see Figure 1.5). However, as soon as this water is processed for drinking or used for irrigation of fields, it becomes an economic good.
free good: a product which does not require any resources to make it.
LINK There is another difference between an economic good and a free good. This is covered in Chapter 3.2 (Influence of opportunity cost on decision-making –Economic goods and free goods).
TIP
In economics, what determines whether a product is a free good is not whether people have to pay for it, but whether it takes resources to produce it.
We are working towards endorsement of this title for the Cambridge Pathway.
In a group of five, each person chooses one of the options below. Each person has 60 seconds to explain to the rest of the group whether their option is an economic good or a free good and why.
1 air
2 bicycle tyres
3 newspapers
4 public libraries
5 state education.
SUMMARY
You should now know:
• People’s wants continue to grow.
• Resources such as workers, machines and land are limited in supply.
• The economic problem is that infinite wants exceed finite resources.
• The three key resource allocation decisions are what to produce, how to produce it and who to produce for.
• Economic goods take resources to produce them.
• Free goods exist without the use of resources.
1 What is the reason for the existence of scarcity?
A each year workers tend to produce less than previously
B machines wear out with time
C there are not sufficient resources to produce all the products people want
D there is a limit to people’s wants
2 What will cause scarcity to continue to be a problem in the future?
A prices will rise
B the quantity of resources will decline
C wants will continue to increase
D world population will fall
3 Which combination would increase the basic economic problem?
Resources
A Decrease by 5%
B Increase by 10%
C Increase by 20%
D Remain unchanged
4 Which is a free good?
Wants
Decrease by 20%
Increase by 14%
Remain unchanged
Decrease by 5%
A products given away by a supermarket to attract customers
B recycled paper
C vaccination provided without charge by the state
D wind coming in from the sea
5 a What is meant by ‘the basic economic problem’?
b Explain why a car is an economic good.
Total: [4]
Total: [6]
How well do you think you have achieved the learning intentions for this chapter? Give yourself a score from 1 (still need a lot of practice) to 5 (feeling very confident) for each learning intention. Provide an example to support your score.
define the basic economic problem
explain the concept of scarcity
give examples of the basic economic problem
explain the key resource allocation decisions
explain the difference between economic goods and free goods.
By the end of this chapter, you will be able to:
• define the factors of production: land, labour, capital and enterprise
• identify the rewards to the factors of production: rent, wages, interest and profit
• analyse the causes of changes in the quantity and quality of the factors of production.
People are living longer. In 1963, the average life expectancy in Bangladesh was 47 years of age. By 2023, it had risen to 74 years. The Japanese could expect to live until 85 years in 2023. Figure 2.1 shows how the global average life expectancy has increased over the same period.
Figure 2.1: Global average life expectancy, 1963–2023
People are living longer because healthcare, education, housing, sanitation (systems for taking dirty water and waste products away from buildings) and nutrition have improved. This, in turn, is because of increases in the quantity and quality of factors of production. Factors of production is another term for economic resources. Factors of production can also be called inputs. Chapter 1 explained that economic resources are used to produce goods and services, and that they are in limited supply.
Taking a risk
Nguyen Thi Phuong Thao is a very successful businessperson. She made her first million dollars by selling office machinery when she was at university studying economics. Later she made a $2.7 billion fortune through co-founding Vietjet, an international airline (see Figure 2.2). Nguyen makes important decisions about which planes to buy, which routes to fly and how many workers to employ.
If Vietjet continues to be successful, Nguyen will add to her fortune. However, there is a chance that she could lose money if the airline runs into difficulties.
Discuss in a pair or group:
1 What difficulties might an airline experience?
KEY TERM factors of production: the economic resources of land, labour, capital and enterprise.
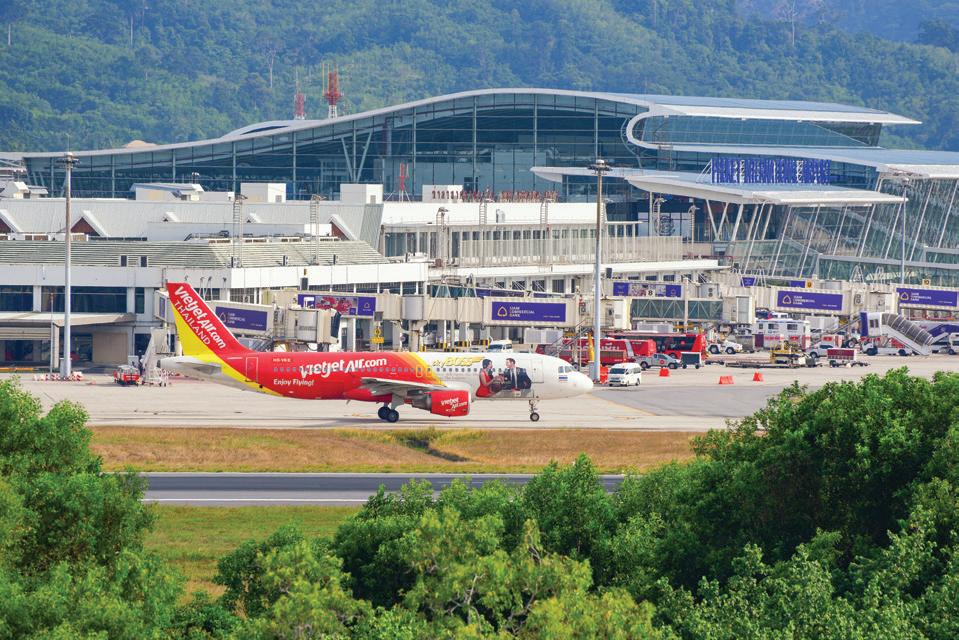
Figure 2.2: Flying towards success?
2 What other decisions may Nguyen make in running Vietjet?
We are working towards endorsement of this title for the Cambridge Pathway.
Most economists identify four factors of production:
1 land
2 labour
3 capital
4 enterprise.
Land generally includes the earth in which crops are grown, and on which offices and factories are built. In economics, land has a wider meaning. Land covers any natural resource which can be used in production. So, besides the land itself, it also includes:
• what is beneath the land, such as coal
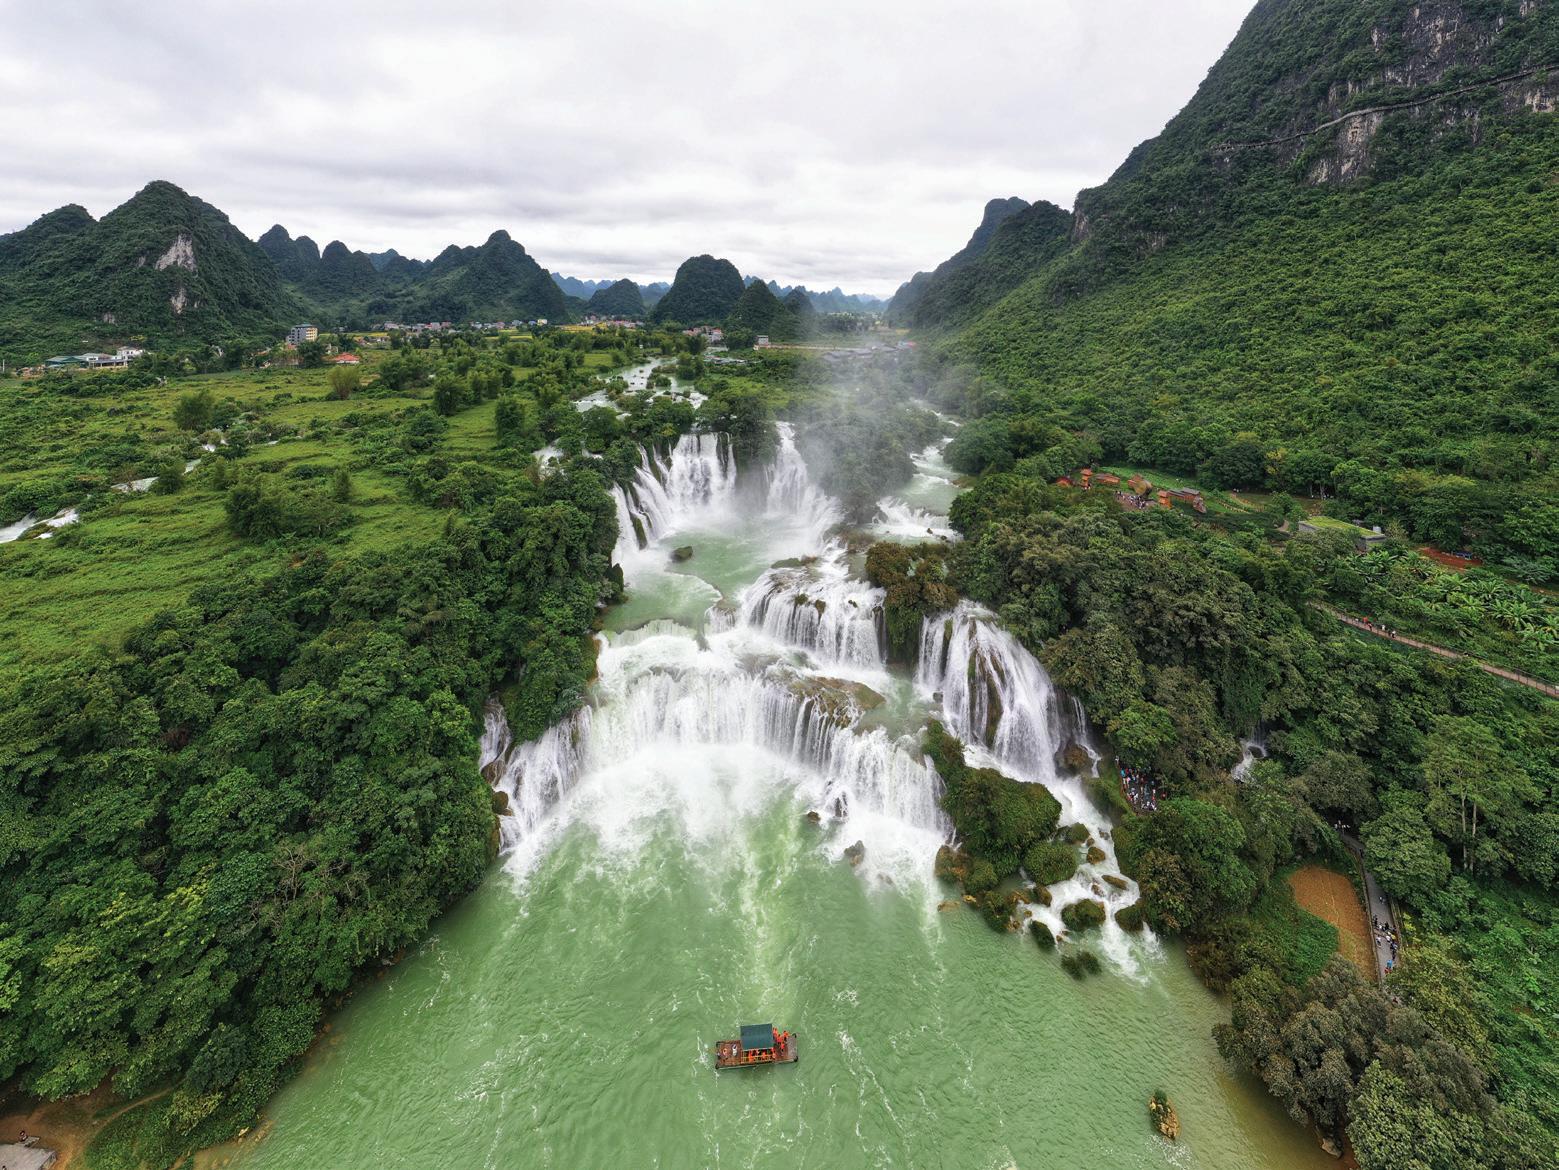
• what occurs naturally on the land, for example, rainforests, the sea, oceans and rivers and what is found in them, such as fish (see Figure 2.3).
Land can be described as the gifts of nature available for production, as the term covers things that occur in nature without any human intervention. So, for example, crops grown by farmers are not land, since they have not occurred naturally. They may be output sold directly to consumers, such as onions, or may be used as raw materials, such as cotton.
To attract tourists, for example, a travel company will show water in swimming pools, as well as the good climate and beaches in the holiday advertising it provides. Similarly, the land used by a safari park includes not only the grass on which some of the animals graze, but also the animals themselves.
land: natural resources used in production.
Labour covers all human effort used in production. Human effort includes both the mental and the physical effort involved in producing goods and services. A road sweeper, a steel worker and a bank manager all contribute their labour.
The education, training and experience that workers have gained can be called human capital. The more human capital workers have, the more goods and services they should be able to produce.
Capital is any artificial (manufactured) good used to produce other goods and services. It includes offices, factories, machinery, railways and tools, for example.
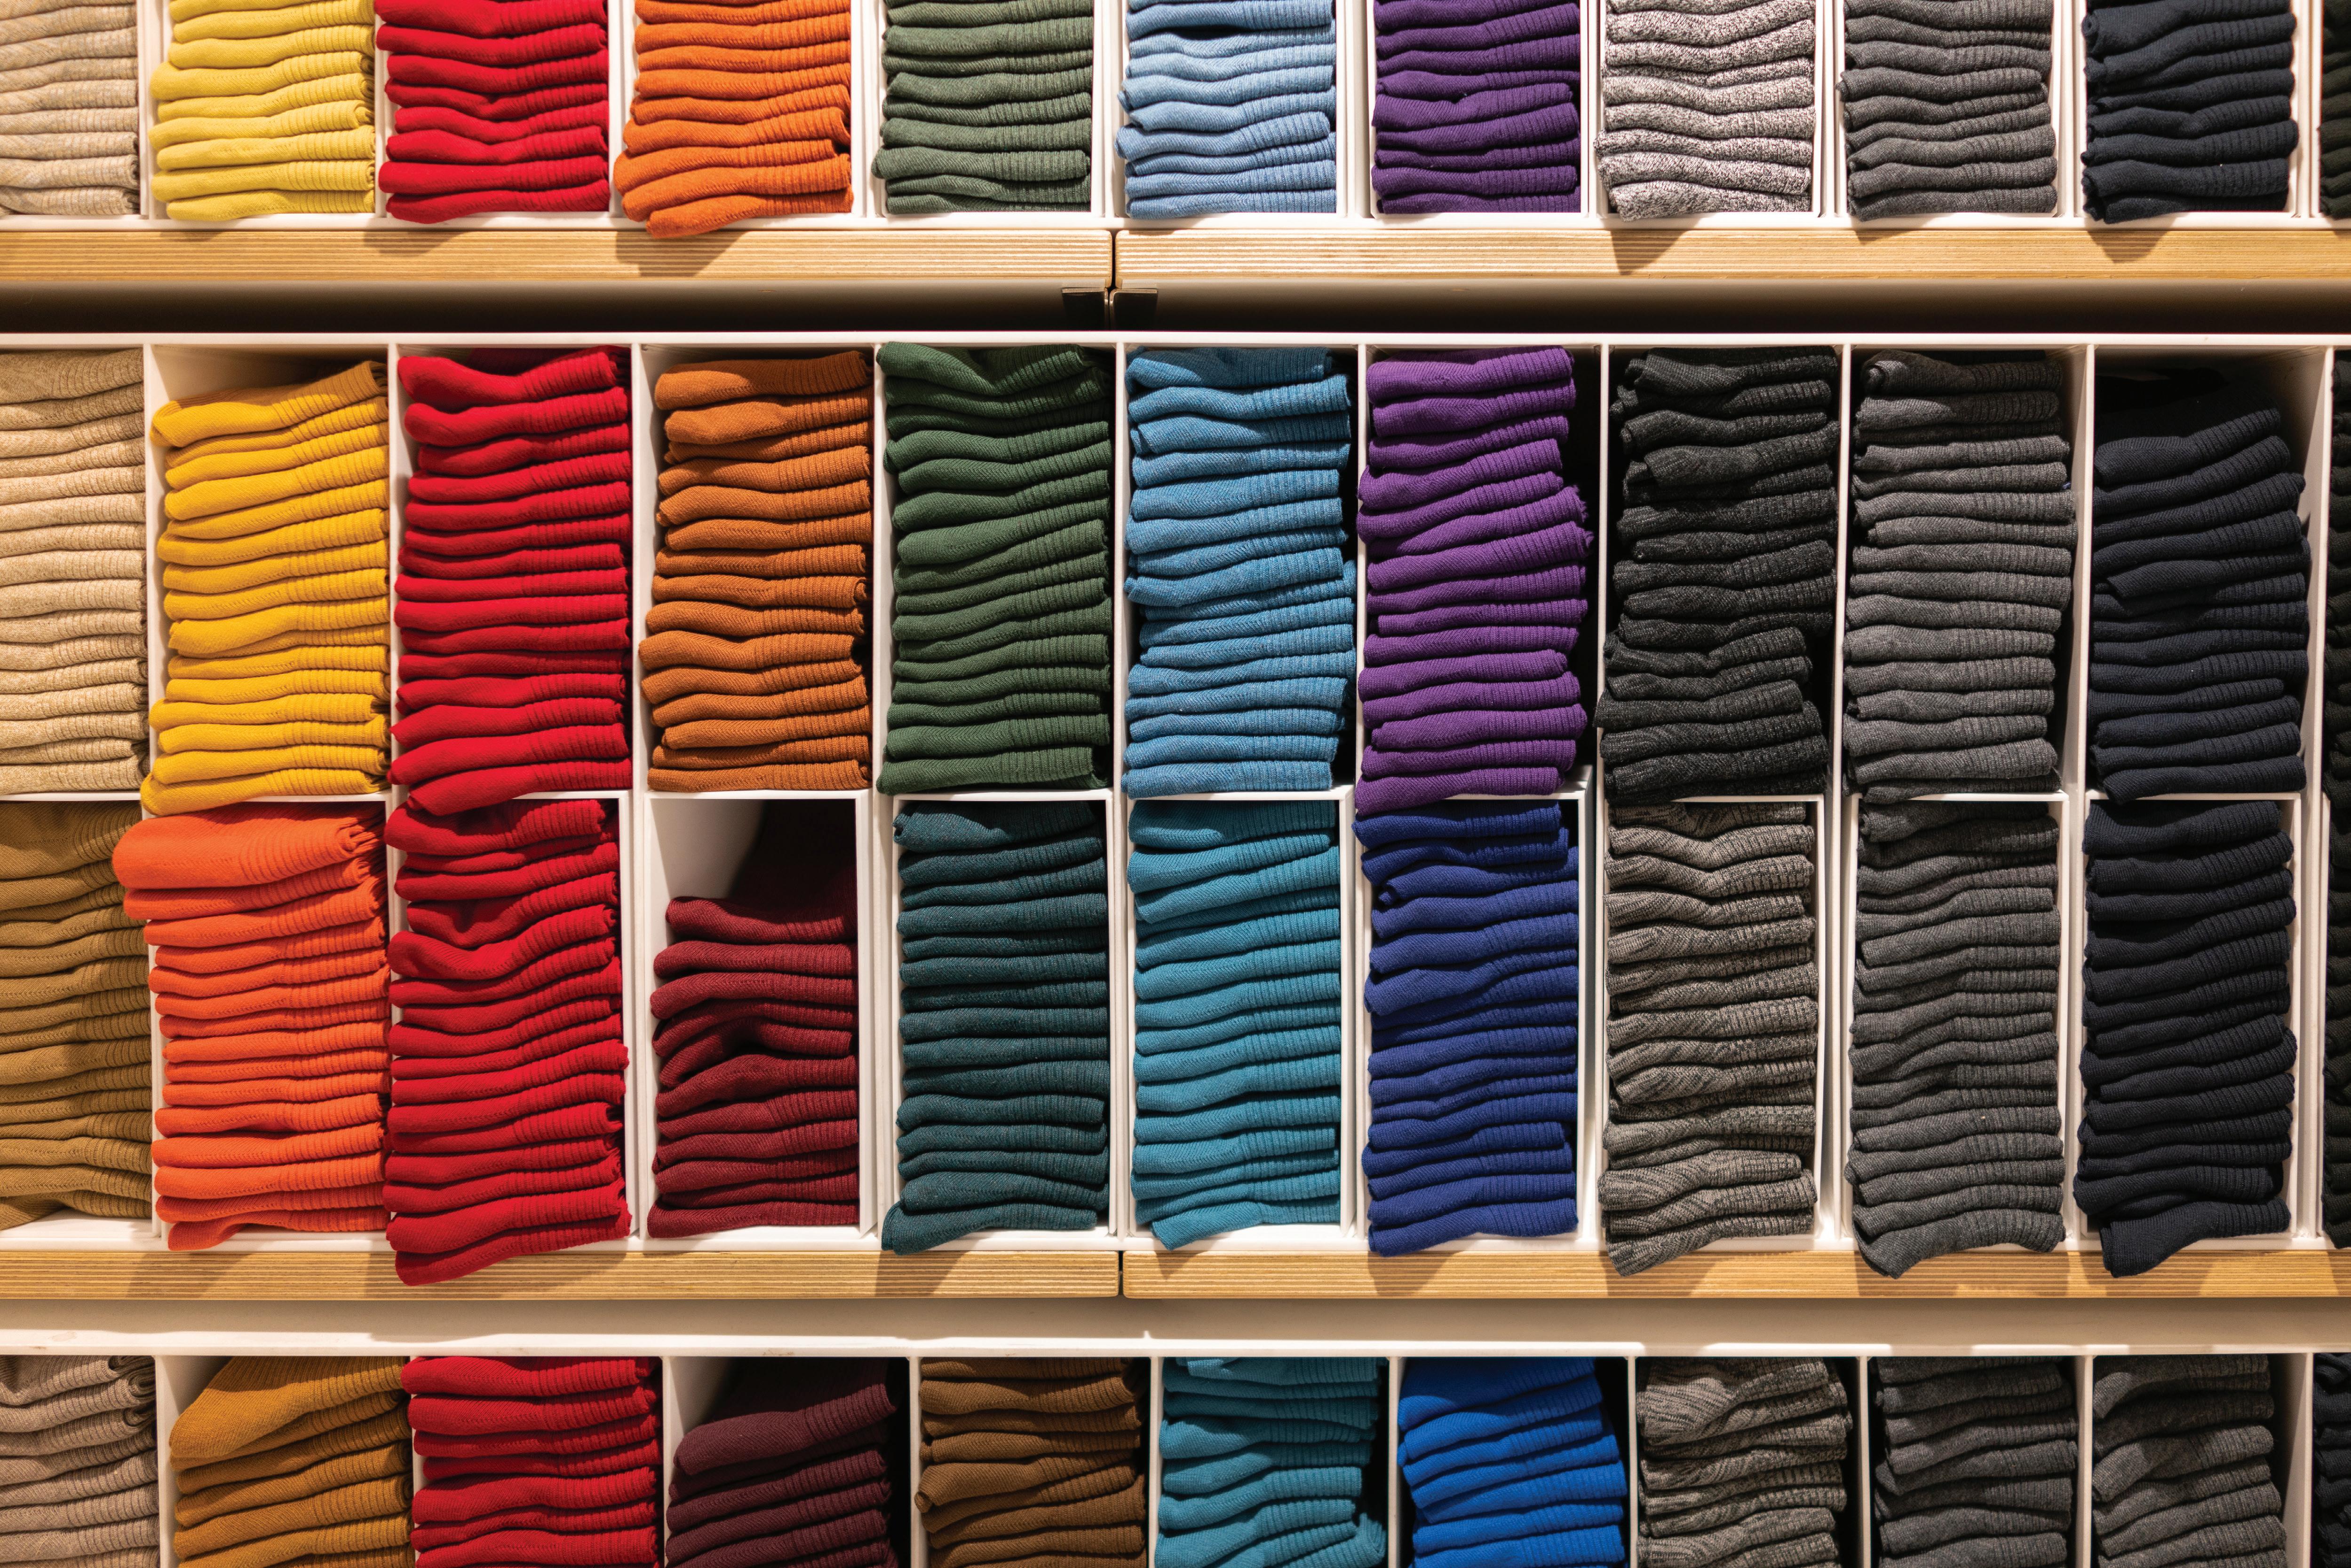
Capital is also referred to as capital goods and producer goods. Economists distinguish between capital goods and consumer goods. Capital goods are not wanted for their own sake, but for what they can produce, for example, equipment to build a road. In contrast, consumer goods, such as food, clothing and entertainment, are wanted for the satisfaction they provide to their buyers.
To decide whether a good is a capital or a consumer good, it is necessary to consider who the user is and the purpose of its use. A computer, for example, will be a capital good if it is used by an insurance company to process insurance claims – it is producing a service. However, if the computer is used by an individual to play games, it is a consumer good.
In your group, discuss which of the following are capital goods and which are consumer goods:
a a chocolate bar
b a car
c a child’s toy
d a farm tractor
e a dentist’s drill
f a courtroom.
labour: human effort used in production.
capital / capital goods: artificial goods used in production.
consumer goods: goods and services purchased by households for their own satisfaction.
Capital in everyday language usually means money that is used to start a business or expand an existing one. However, this money is not capital in an economic sense. This is because capital does not, itself, produce anything. It is the machines purchased with the money that are capital, for example. You can refer to money as financial capital but only use the term ‘capital’ for artificial goods used in production.
Enterprise is the willingness and ability to take risks and to make decisions in a business. Entrepreneurs are the people who organise the other factors of production and who crucially bear the risk of losing their money if their business fails. Entrepreneurs decide what to produce by taking into account consumer demand and how to produce it. Some of the risks faced by a business can be insured against, for example, fire, flood and theft. Other risks have to be accepted by entrepreneurs. This is because some risks cannot be insured against. These include the uninsurable risks of other firms bringing out rival products and the rising costs of production.
The two key tasks of an entrepreneur can be carried out by different people. In large companies, it is the shareholders who run the risk of losing their money if the companies go out of business, while the managing director takes production decisions and organises the factors of production.
Table 2.1 shows a list of economic resources. In each case, decide whether the resource is an example of land, labour, capital or enterprise. Copy and complete the table.
Table 2.1
enterprise: risktaking and key decision-making in business.
entrepreneur: a person who takes the risks and makes the key decisions in a business.
5 The initiative needed to set up and run a bicycle repair shop
Share your answers with another student. Discuss any that you have decided differently.
Rewards for the factors of production are the payments made for the use of the factors. The rewards or factor payments can also be called factor incomes and factor earnings. Firms pay wages for the services of the workers. For taking uncertain risks and organising the other factors of production, entrepreneurs earn profit. Landowners receive rent, and interest is a payment for capital.
LINK
Wages are explored in detail in Chapter 17.1 (Factors affecting an individual’s choice of occupation – Wages).
It may seem strange that interest is the reward to capital. However, entrepreneurs may have to borrow money to buy capital goods and will have to pay interest on the money they borrow. So, they are only likely to buy the capital goods if they think they will earn an amount at least equal to the rate of interest. If anyone else wants to make use of the capital goods, the payment received will again have to be at least equal to the rate of interest.
In a pair, produce a poster, based on the table below. Include a picture for each of the factors of production. Display the poster on your classroom wall if you are permitted to do so.
Did making the poster help you to understand the key features of the four factors of production?
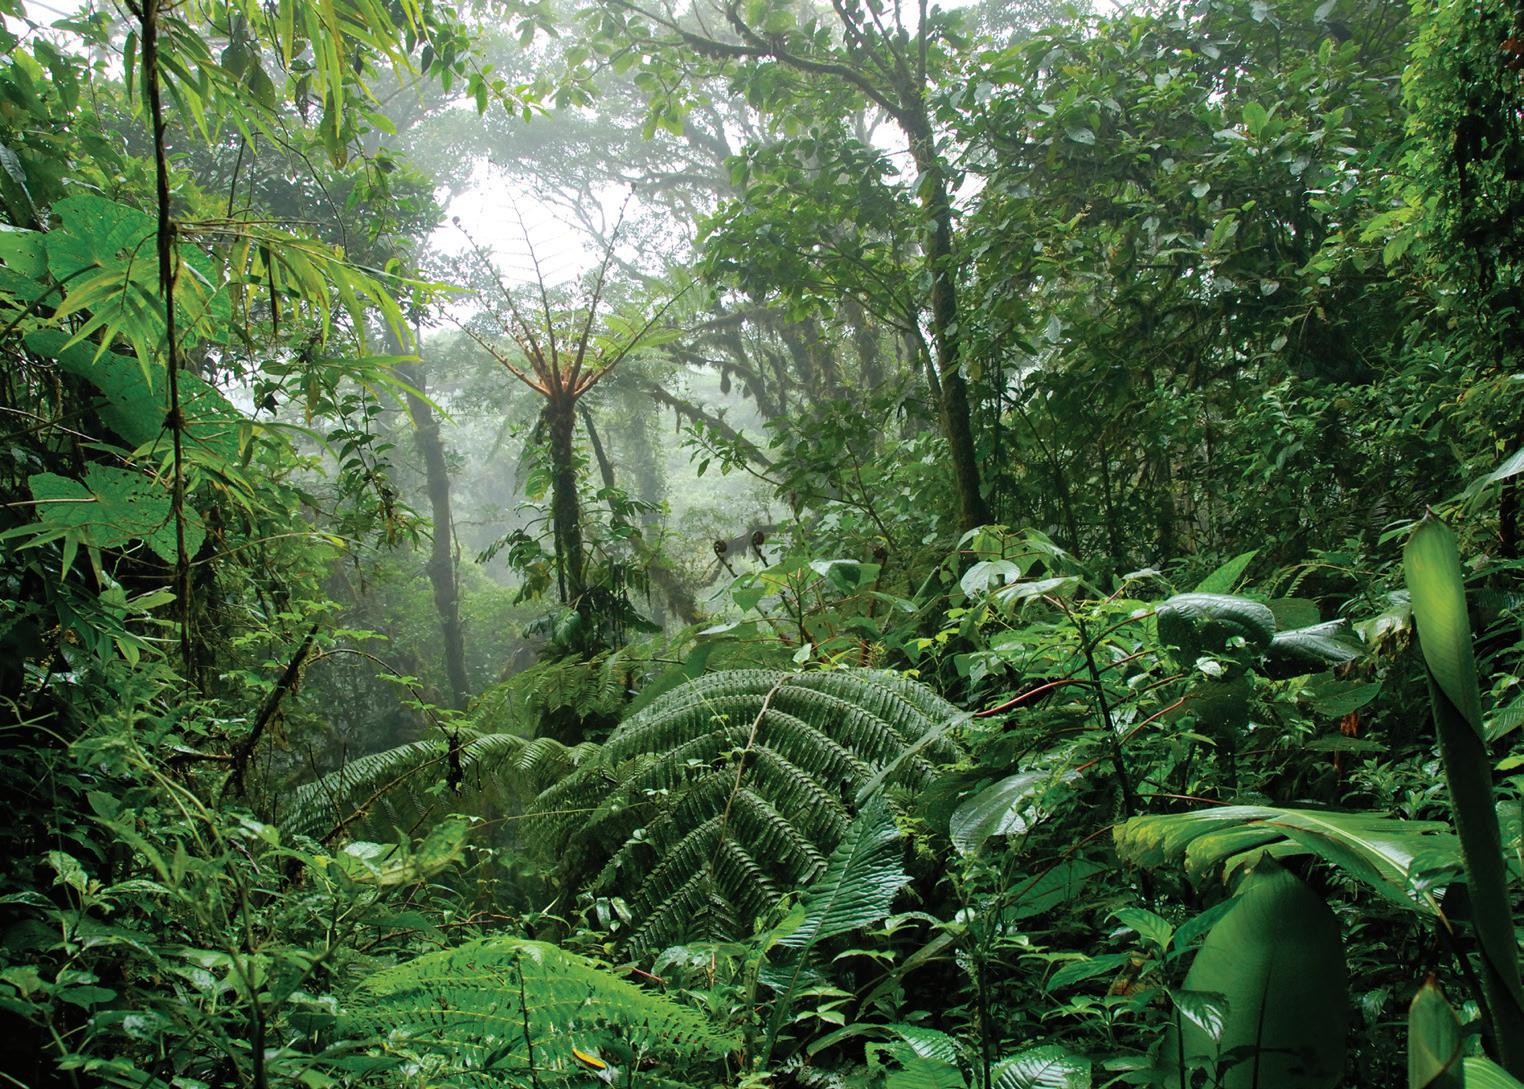
The amount of physical land can be increased by land reclamation and decreased by soil erosion. A number of countries, including China, Dubai, the Maldives, the Netherlands and Singapore, have reclaimed land to use for farming and to build towns and cities on (see Figure 2.4). One cause of soil erosion is changes in how land is used. For example, the destruction of rainforests due to timber firms and farmers cutting down trees results in the release of carbon dioxide and other greenhouse gases and reduces the future capture of greenhouse gases. Pollution contributes to a rise in the world’s average temperature. This climate change is causing more hurricanes, floods and droughts which result in widespread damage including soil being eroded.
We are working towards endorsement of this title for the Cambridge Pathway.
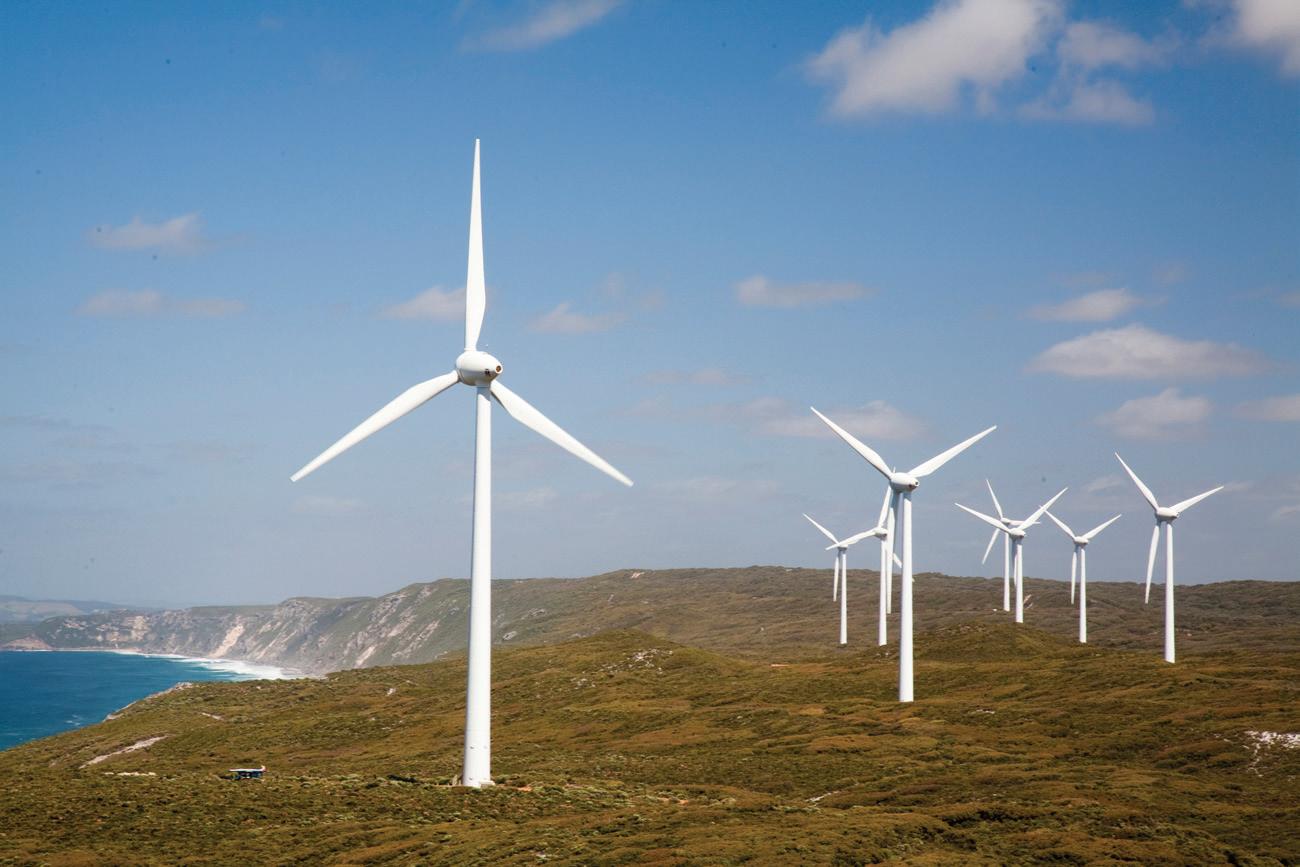
Some natural resources are renewable while others are non-renewable. For example, renewable resources, such as wind power, are replaced by nature and can be used again and again. In contrast, non-renewable resources, such as gold and oil, are reduced by use. There is a risk that renewable resources can be turned into non-renewable resources if they are overexploited (used at a faster rate than they are replenished). Overfishing and the hunting of wildlife can reduce numbers to a point where they cannot be restored.
There are a number of reasons why the quality of natural resources may increase. Fertilisers can be used to increase the fertility of the land. The purity of rivers, and so the health of fish in the rivers, can be improved by stopping the pollution of rivers. Providing good drainage can increase the yield from fruit trees.
The quantity of labour is influenced by two key factors. One is the number of workers available and the second is the number of hours they work.
The number of available workers is determined by:
• The size of the population. The larger the population, the more workers there are likely to be.
• The age structure of the population. A country with a high proportion of people of working age will have more workers than a country with the same population size, but a higher proportion of people who would be too young or too elderly to work.
• The retirement age. The higher the retirement age, the more potential workers there will be.
• The school-leaving age. Raising the school-leaving age would reduce the number of workers.
• Attitude to women in the labour force. Countries where it is acceptable for women to work have more workers to draw on.
labour force: people in work and those actively seeking work.
People who are working and those seeking work form the labour force. The labour force is also known as the workforce or working population. People of working age are everyone between the school-leaving age and the retirement age. In Singapore in 2023, the labour force included people aged between 16 and 63 years. Singapore plans to raise the retirement age to 65 years in 2030.
Not everyone of working age is in the labour force. Some may be in full-time education, some may have retired and some may be unable to work due to sickness or disability.
The number of hours which people work may be influenced by:
• the length of the average working day (for example, full-time workers in the USA tend to work for longer hours than those in European Union countries)
• whether they work full time or part time (for example, more people in the UK work part time than those in France)
• the amount of overtime a person may work
• the length of holidays taken by workers
• the amount of time lost through illness.
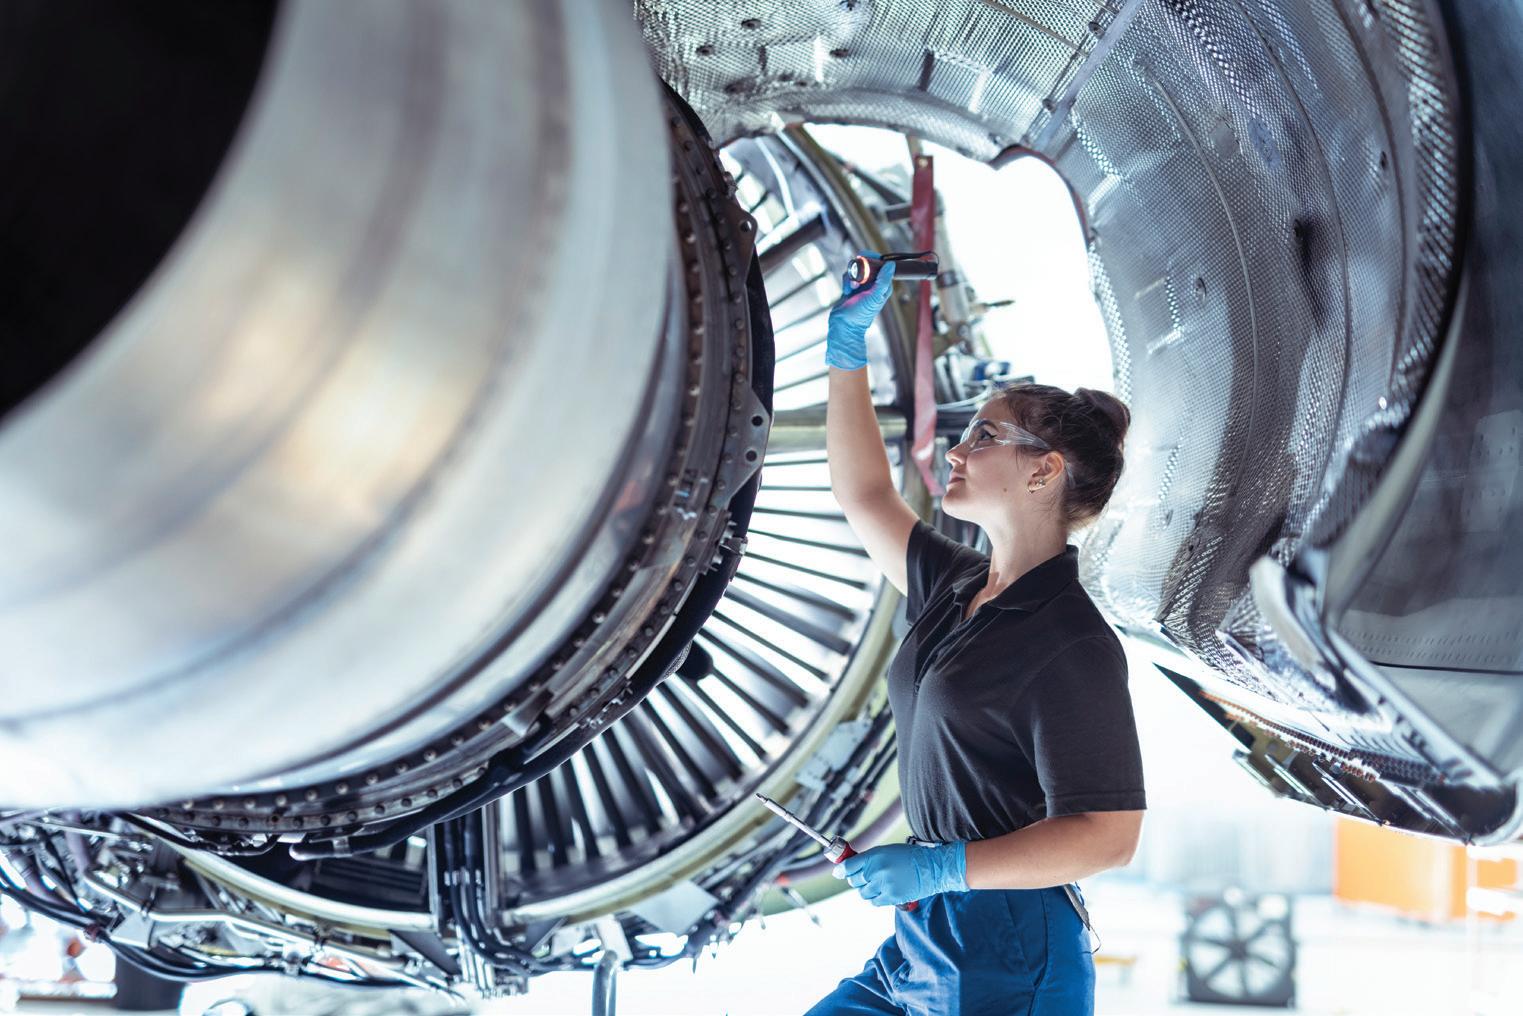
As with all the factors of production, it is not only the quantity of labour that is important but also the quality. More can be produced with the same number of workers if the workers become more skilled. An increase in productivity, including labour productivity, is a major cause of an increase in a country’s output
The quality of labour can be improved as a result of better education, better training, more experience and better healthcare. A better educated, better trained and more experienced labour force will be able to carry out more difficult tasks, work with more complex machinery and equipment and produce more and better quality products (see Figure 2.5). A healthier labour force will be able to concentrate more, be stronger
Increase your understanding of economics in the real world by finding out what has happened to the size of your country’s labour force in the last ten years and why it has changed.
productivity: the output per factor of production in an hour.
labour productivity: output per worker hour.
output: goods and services produced by the factors of production.
Decide which of the following would raise labour productivity:
1 improved education and training
2 better equipment
3 worse working conditions.
Write your answers in your notebook. Include reasons for your decision.
The quantity of capital is influenced by investment and tends to increase with time. Every year some capital goods physically wear out and some become outdated, for example, a farmer’s barn may fall down, and some machinery may be replaced by newer, more efficient machinery.
New capital goods usually take the place of worn-out or outdated goods that firms are unable (or choose not) to use anymore. Capital goods produced to replace those capital goods that cannot be repaired or are obsolete are referred to as replacement capital. The total value of the output of capital goods produced is known as gross investment The value of replacement capital is called depreciation or capital consumption.
Net investment is the value of the extra capital goods made. It is equal to gross investment minus depreciation. For example, if a country produces $200 million of capital goods one year and there is depreciation of $70 million, net investment is $130 million. The country will have more capital goods. These additional capital goods will allow it to produce more goods and services.
Occasionally, gross investment may be lower than depreciation. This means that some of the capital goods taken out of use are not replaced. This is known as negative net investment.
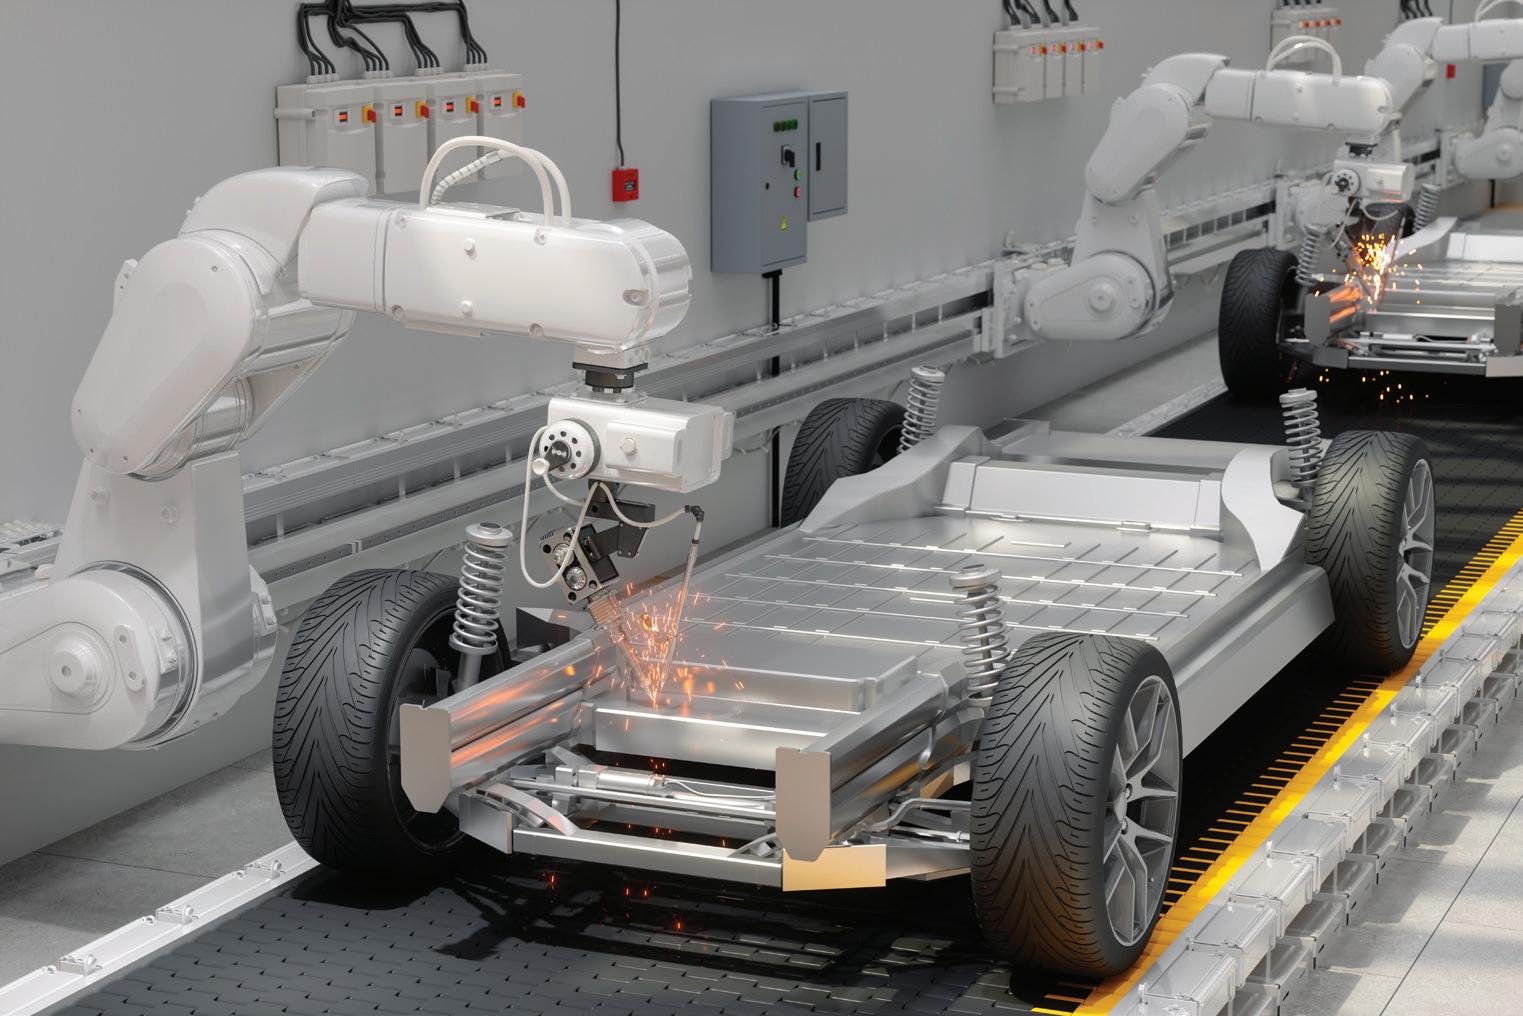
Advances in technology enable capital goods to produce a higher output and a better quality output. For example, the development of robotics in car production has greatly increased the number of cars that a car factory can produce (see Figure 2.6).
investment:
spending on capital goods.
gross investment: total spending on capital goods.
depreciation (capital consumption): the value of capital goods that have worn out or become obsolete.
net investment: gross investment minus depreciation. negative net investment: a reduction in the number of capital goods caused by some obsolete and worn-out capital goods not being replaced.
A firm produces air conditioning units. It is currently using 12 machines. Each machine can produce 100 units, giving it a capacity to make 1 200 units. Three of the machines will wear out during the year. The firm expects to sell 1 600 units next year.
1 Individually:
a decide how many replacement machines the firm should buy
Discuss how advances in technology have changed:
a students’ learning experience
b people’s medical care
c food production.
The development of AI
More of the machines and devices we use employ artificial intelligence (AI). This is the technology that enables machines to learn from the data they gather, to solve problems and to learn from past mistakes. For instance, AI can enable your smartphone to recommend products to you based on your previous spending patterns, and a video game you play may be adapted based on the skills you show.
In a few years’ time, many people may have a home heating or cooling system controlled by AI, work with machines that use AI and travel on driverless buses (see Figure 2.7).
b calculate how many machines it should buy to expand its capacity
c calculate how many machines in total it should buy.
Share your answers with others in the group.
2 Discuss why, in the future, fewer machines are likely to be needed to produce the same output.
AI will enable machines to think and make decisions more like humans. Scientists disagree about whether or not machines will ever become more intelligent than humans. Both scientists and economists debate whether AI will be good for people. Some economists suggest that it will cause jobs to be lost. Others argue that it will increase output and create new jobs.
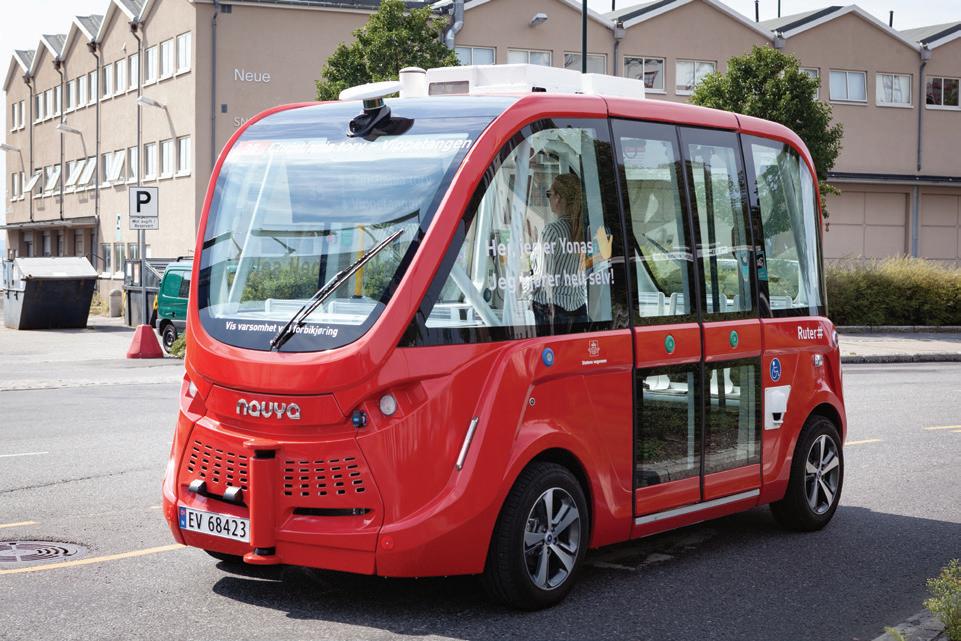
Figure 2.7: Driverless buses will make use of AI to take decisions based on road and traffic conditions
1 How is AI likely to affect the quantity and quality of capital goods?
2 Why might the development of AI result in the loss of jobs?
We
The quantity of enterprise will increase if there are more entrepreneurs. A good education system, including university degree courses in economics and business studies, may help to develop entrepreneurs in an economy. Lower taxes on firms’ profits (corporate taxes) and a reduction in government regulations may encourage more people to set up their own businesses. A disproportionate number of migrants become entrepreneurs. These are people who have had the drive to leave where they have been living in search of a better or different life. This drive often leads them to become entrepreneurs in another country or a different region of their own country.
The quality of enterprise can be improved if entrepreneurs receive better education, better training, better healthcare and gain more experience. More experience can be very important in the case of entrepreneurs. Very successful entrepreneurs have often set up businesses in the past, some of which may have failed. The knowledge and understanding they have gained of the products people like to buy and the best sources of raw materials can help them make a success of a new business.
ACTIVITY 2.5
In a group:
1 Research which entrepreneur founded each of the following firms and whether they have a university degree:
• Biocon, a biotechnology firm
• Lenovo, a computer firm
• Silverbird Group, a group of property, media and entertainment companies
• Sofizar, an internet marketing firm.
2 Find an example of a successful entrepreneur who does not have a degree.
3 Produce a poster from the information you have found.
SUMMARY
You should now know:
• The four factors of production are land, labour, capital and enterprise.
• Land is a term covering all natural resources.
• Labour involves the mental and physical effort workers put into producing goods and services.
• Capital goods are used to make other goods and services.
• Enterprise involves taking risks and making production decisions.
• Land receives rent, labour receives wages, capital receives interest and enterprise receives profit.
• Some natural resources are renewable whereas others are non-renewable.
• Labour involves the mental and physical effort workers put into producing goods and services.
• The quantity of labour is influenced by the number of workers and the number of hours they work.
• The size of the labour force is influenced by the size and age structure of the population, the school-leaving age, the retirement age and attitudes to women in the workforce.
• Net investment increases a country’s stock of capital goods.
• Improved education, lower taxes and less regulation can encourage enterprise.
1 Which factor of production’s function is to make the key business decisions and take risks?
A capital B enterprise C labour D land
2 Which type of factor of production is a road? A capital B enterprise C labour D land [1]
3 A country produces 3 000 new capital goods in a week. Of these, 500 replace worn-out capital goods. What is the net investment made? A 500
4 What is the difference between rent and wages?
A rent is a payment to capital, while wages are a payment to entrepreneurs
B rent is a payment to a factor of production that is scarce, whereas wages are a payment to a factor of production that is infinite
C wages are paid to a human resource, whereas rent is a payment to a natural resource
D wages are paid every day, whereas rent is paid annually [1]
5 It is decided to cut down a forest and build a new factory on the cleared site. What effect will this have on the quantity of capital and the quantity of land?
A Decrease Increase
B Increase Decrease
C Increase Remain unchanged
D Remain unchanged Increase
6 a Identify two non-human factors of production. [2]
b Explain two causes of an increase in the quantity of labour. [4]
c Analyse why the quality of labour may increase over time. [6] Total: [12]
How well do you think you have achieved the learning intentions for this chapter? Give yourself a score from 1 (still need a lot of practice) to 5 (feeling very confident) for each learning intention. Provide an example to support your score.
define the factors of production: land, labour, capital and enterprise give examples of the factors of production identify the rewards to the factors of production: rent, wages, interest and profit
analyse the causes of changes in the quantity and quality of the factors of production.
By the end of this chapter, you will be able to:
• define opportunity cost
• give examples of opportunity cost in different contexts
• explain the influence of opportunity cost on decisions made by consumers, workers, producers/firms and governments when allocating their resources.
There are many subjects that schools could teach. Several examination boards offer numerous subjects. Each school offers only a proportion of the subjects on offer. Why is this? It is because schools do not have enough classrooms, teachers and equipment to teach all subjects. For example, a classroom can be used to teach English or economics in the same room, but not at the same time.
There are not enough economic resources to produce all the goods and services we may like to have, as we saw in Chapter 1 (The nature of the basic economic problem). Land, labour, capital and enterprise are scarce, so decisions have to be made about the method and purpose of their use. In deciding what to use the classroom for, and in making other decisions, the concept of opportunity cost is important.
Making the best choice
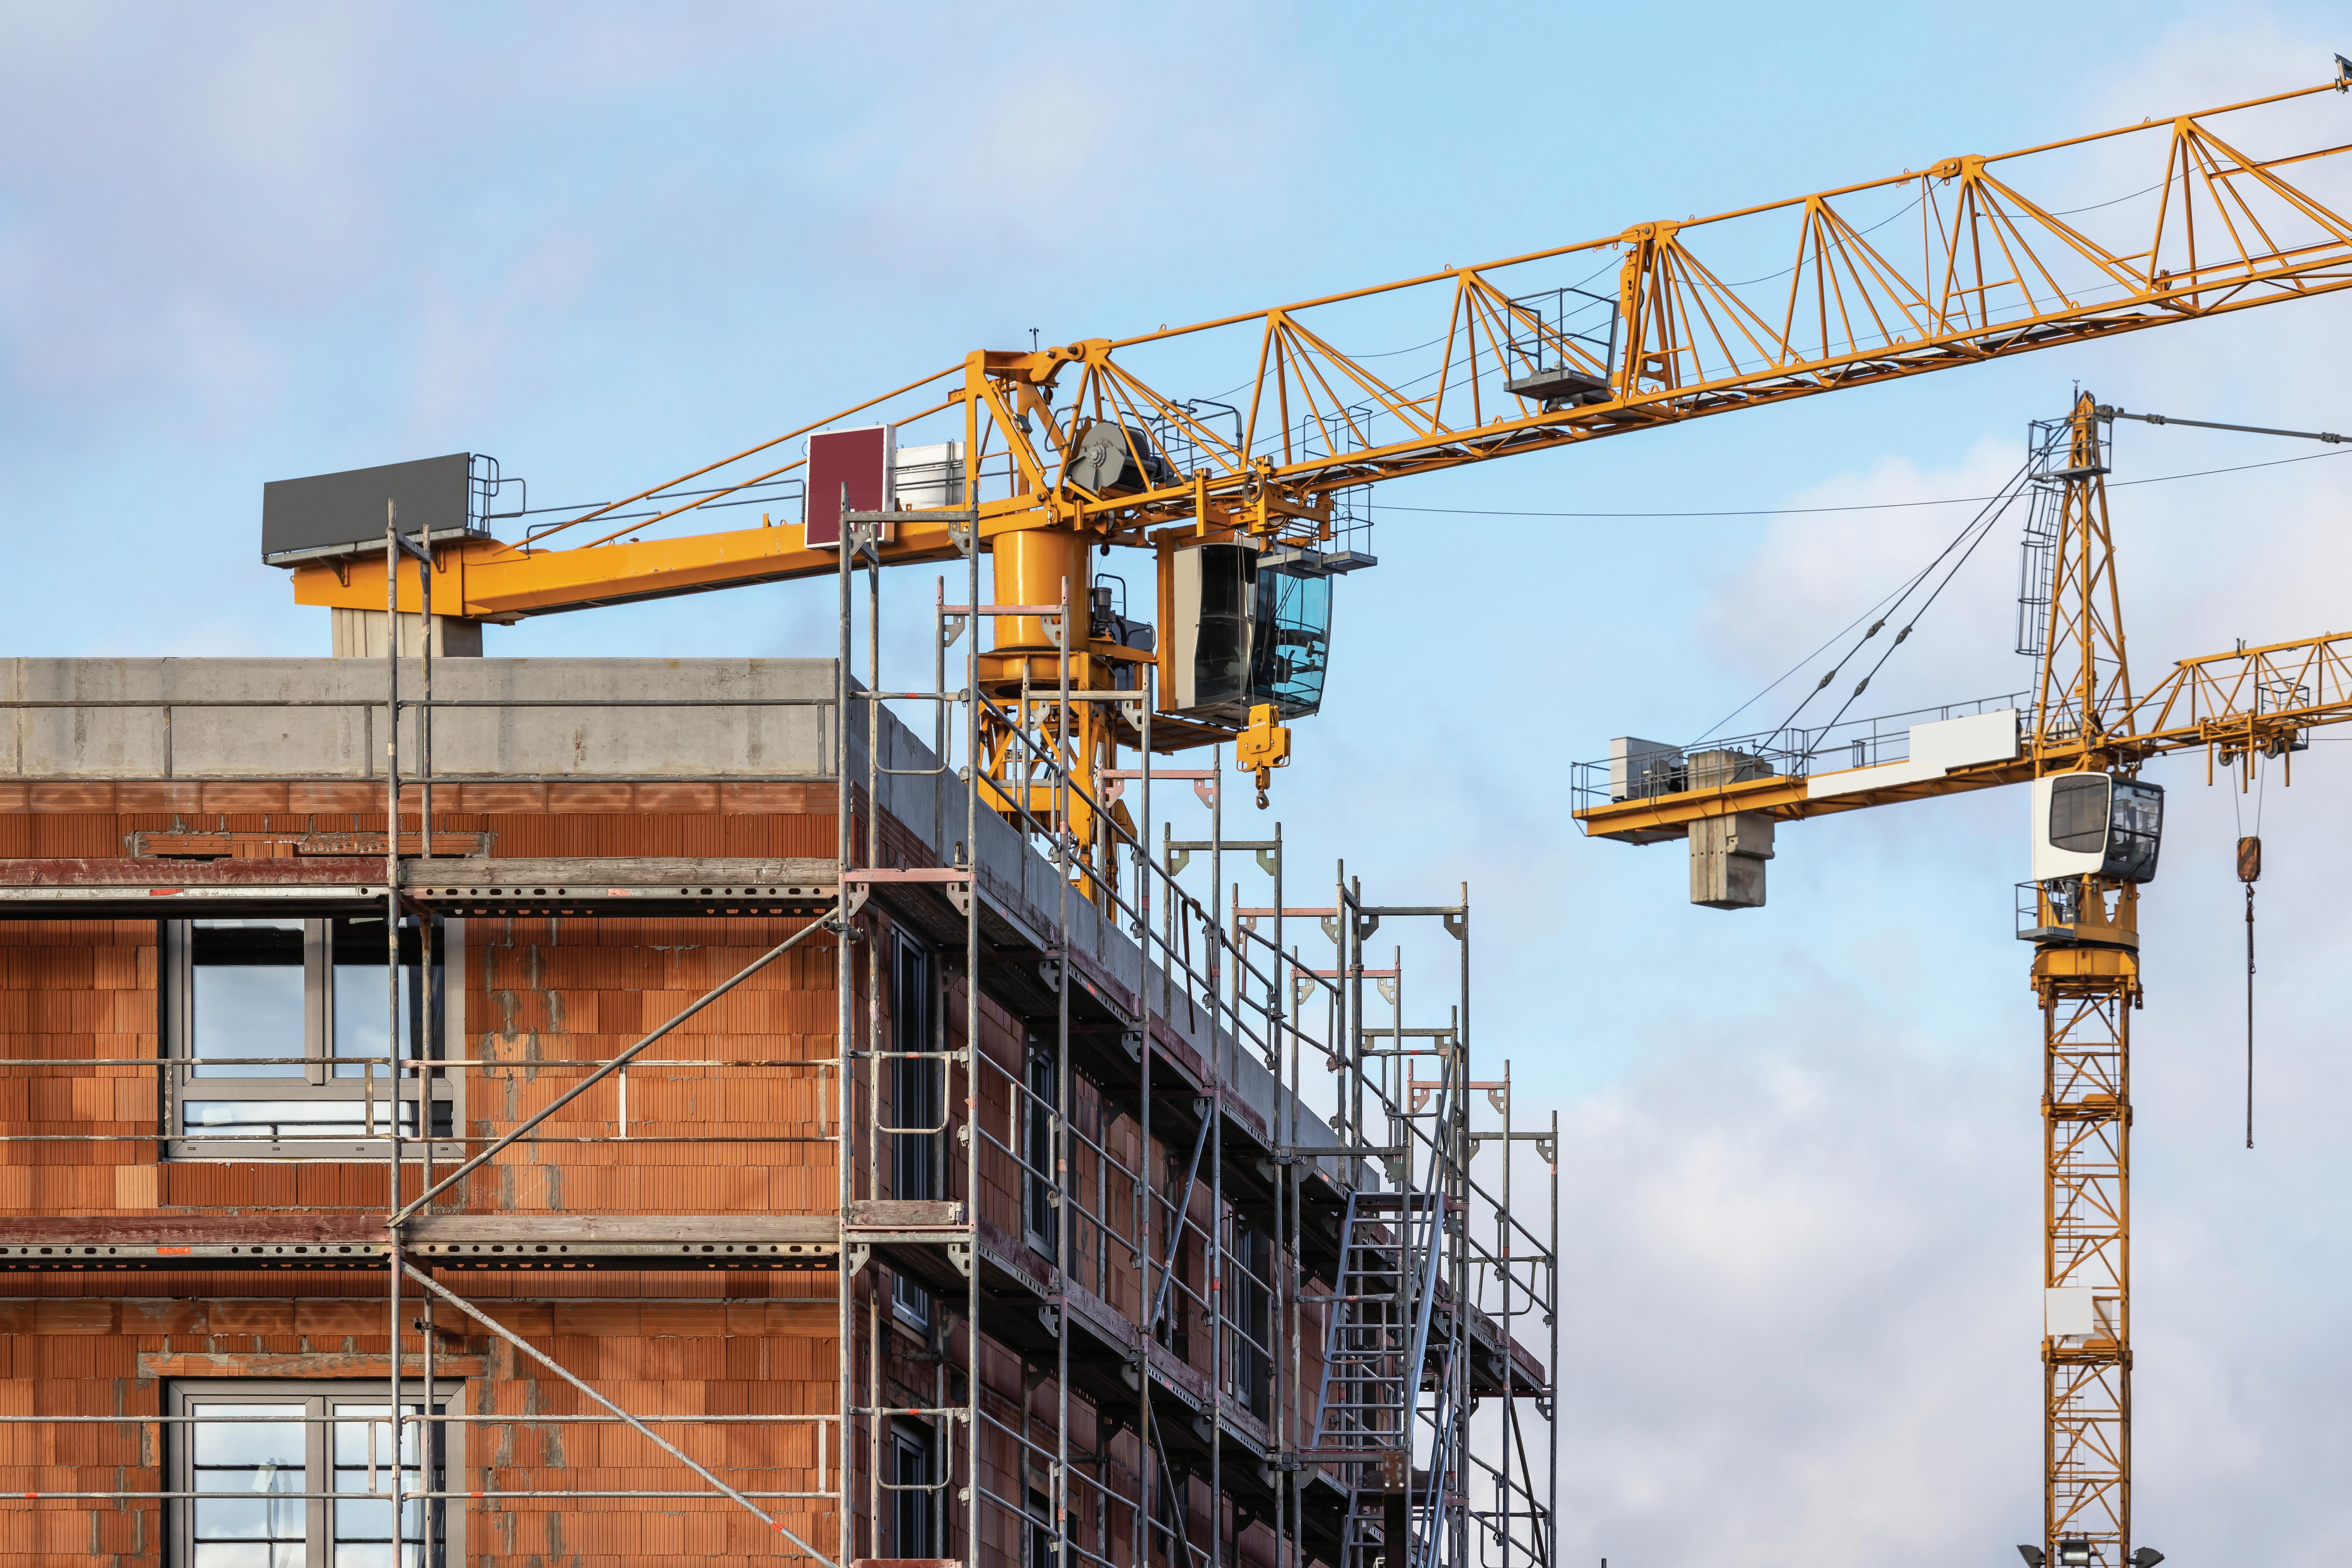
Choices are not always easy. In 2023, work started on the construction of a large onshore wind farm in Golden Plains in the state of Victoria, Australia. The wind farm is expected to bring major benefits over the course of the next 30 years. It will produce enough clean, renewable energy to supply electricity to least 450 000 homes a year. This will reduce the need to use fossil fuels, such as coal, which causes pollution. It is also predicted that the wind farm will create approximately 700 jobs.
The site of the wind farm is near a small town. It is being built on agricultural land previously used to grow crops and raise livestock.
The wind farm is funded jointly by a French firm and the Australian government. Some Australians argue that government money could be better spent on a new hospital, for example.
Discuss in a pair or group:
1 What may have happened to agricultural output in Victoria as a result of the building of the wind farm?
2 Should the Australian government have spent the money building the wind farm or a new hospital?
When we decide to do one thing, we are also deciding not to do something else. To ensure that we make the right decisions, it is important that we consider the alternatives, particularly the best alternative. Opportunity cost is the cost of a decision in terms of the best alternative given up to achieve it. For example, there are a variety of things you could do tomorrow between 5 p.m. and 6 p.m.
KEY
opportunity cost: the best alternative forgone.
These may be to go shopping, to read a chapter of an economics book, to do some paid work or to visit a friend (see Figure 3.2). You may narrow those choices down to reading the chapter or visiting a friend. You will have to consider very carefully which one will give you the best return. If you choose to read the chapter, you will not be able to visit your friend and vice versa.

We have unlimited wants but only limited resources. So, we have to make choices, and these choices involve an opportunity cost –see Chapter 1.1 (Finite resources and infinite wants).
When explaining opportunity cost, it is always useful to give an example.
The importance of opportunity cost Opportunity cost is one of the key concepts used in economics. The concept can be used to analyse almost every issue in economics and in your everyday life. For example, you may find it helpful to spend time at the end of the week to review the work you have done in the different subjects you are studying. You have limited time, so you need to consider carefully how you use it. If you decide to spend 15 minutes producing a mind map on factors of production, you may have to sacrifice three mathematics practice questions you could have answered.
1 If you decide to go on to study A levels, how may the concept of opportunity cost be useful in making your choice?
2 How may opportunity cost be applied to a football manager’s decision on who should take a penalty kick? (See Figure 3.3.)

Consumers are buyers and users of goods and services. We are all consumers. Most of us cannot buy everything we like. You may have to choose which economics dictionary to buy, for example. You will probably consider several different ones, taking into account their prices. The choice will then tend to settle on two of them. You are likely to select the one with the widest and the most accurate informative coverage. The closer the two dictionaries are in quality and price, the harder the choice will be.
An individual working in one job involves an opportunity cost. People employed as teachers might also be able to work as civil servants. They need to carefully consider their preference for the jobs available. This would be influenced by a number of factors, including the wage paid, chances of promotion and the job satisfaction to be gained from each job. If the pay of civil servants or their working conditions improve, the opportunity cost of being a teacher will increase. It may even increase to the point where some teachers resign and become civil servants instead.
Discuss why the opportunity cost of working as an accountant is likely to be higher than that of working as a window cleaner.
Producers have to decide what to make. If a farmer uses a field to grow oilseed, they cannot keep cattle on that field. If a car producer uses some of their factory space and workers to produce one model of a car, they cannot use the same space and workers to make another model of the car at the same time.
In deciding what to produce, private sector firms will tend to choose the option which will give them the maximum profit. This will involve the firm considering the demand for different products and the cost of producing those products.
In 2023, a firm spent a month producing four types of naan (see Figure 3.4). It calculated the profit earned per hour from the sale of the different types of naan as:
• garlic naan: $45
• keema naan: $48
• peshwari naan: $50. We
• paneer naan: $39

Figure 3.4: Naan, a type of flatbread
As a result, the firm decided to concentrate on making peshwari naan. By 2025, costs and prices had changed. The firm decided to try producing the four types again, to see which would be the most profitable. This time it finds that the profit that can be earned is:
• garlic naan: $52
• keema naan: $26
• paneer naan: $43
• peshwari naan: $55.
In a pair, discuss these questions. Then write out your answers individually. Remember to explain your answers.
1 What was the opportunity cost of producing peshwari naan in 2023?
2 What happened to the opportunity cost of producing peshwari naan in 2025?
Government has to carefully consider its expenditure of tax revenue on various things. If it decides to spend more on education, the opportunity cost involved may be a reduced expenditure on healthcare. Government could, of course, raise tax revenue in order to spend more on education. In this case, the opportunity cost would be put on the taxpayers. To pay higher taxes, people may have to give up the opportunity to buy certain products or to save.
Opportunity cost is one of the most important concepts in economics. You will find that you can use it in answers to a wide range of structured questions.
We
In a pair, copy and complete Table 3.1 by giving a possible opportunity cost of each decision.
Table 3.1 Decision
Travel by car
Consumers
Buy basmati rice
Buy clothing online
Work overtime
Workers
Producers
Government
Work in a foreign country
Work full-time
Rent an office building
Employ more workers
Produce skincare cream
Build new schools
Instruct state schools to start at 9 a.m.
Employ foreign economic advisers
How did your understanding of opportunity cost help you to choose appropriate examples in Activity 3.2? Has the activity helped to reinforce your understanding of the concept of opportunity cost?
In a group, discuss what might be the opportunity cost in each of the following examples:
1 A person wanting to buy fruit, decides to buy apples.
2 A person decides to study economics at a university.
3 A factory is built on farmland.
Now each share an example of an opportunity cost in your daily lives. How do your opportunity costs vary?
Resources are used to produce economic goods, so their production involves an opportunity cost. In contrast, no resources are used to produce free goods, so they do not involve an opportunity cost.
You should now know:
• Opportunity cost is an important concept as it emphasises that people should consider what they are sacrificing when they make a decision.
• Consumers, workers and producers should consider opportunity cost when deciding what to buy, what job to do and what to produce.
• Governments should take opportunity cost into account when deciding what to spend their tax revenue on.
• Economic goods have an opportunity cost whereas free goods do not.
1 A person decides to go to university for three years to study economics. If they had not gone to university, they could have taken up a job which would have paid them $15 000 a year. After the person graduates, they expect to find a job paying them $40 000 a year. What is the opportunity cost of going to the university for them?
A
000 B
2 What are the characteristics of a free good?
A Has an opportunity cost Takes resources to produce it
B Has an opportunity cost Takes no resources to produce it
C Has no opportunity cost Takes no resources to produce it
D Has no opportunity cost Takes resources to produce it [1]
LINK
The difference between economic goods and free goods explains why economic goods involve an opportunity cost while free goods do not – see Chapter 1.3 (Economic goods and free goods).
3 When Kamran reaches 16 years of age, he receives $200 from his aunt, $50 of which he decides to save. He is taken out by his father to watch a movie at a local cinema. His father pays for the cinema tickets. Kamran spends the afternoon playing football. Which of these activities involves an opportunity cost?
C
4 A person receives an invitation to a free lunch. What is a possible opportunity cost to them of accepting the invitation?
A the food that could have been eaten by another person
B the food that they do not select from the menu
C the time taken to produce the food they eat
[1]
D the time they could have spent playing tennis [1]
5 A firm can produce gloves and scarves. The table shows the combination of the two products it could make.
Based on the data, if the firm is currently producing 18 pairs of gloves and 70 scarves, what would be the opportunity cost of producing 16 more pairs of gloves?
A 15 scarves
B 20 scarves
C 50 scarves
D 85 scarves [1]
Total: [5]
6 a Define ‘opportunity cost’. [2]
b Explain why opportunity cost is an important concept for producers. [4]
c Analyse what effect the building of an airport may have on the decision of how to use an area of land nearby. [6]
Total: [12]
How well do you think you have achieved the learning intentions for this chapter? Give yourself a score from 1 (still need a lot of practice) to 5 (feeling very confident) for each learning intention. Provide an example to support your score.
define opportunity cost give examples of opportunity cost in different contexts
explain the influence of opportunity cost on the decisions made by consumers, workers, producers and governments.

We
By the end of this chapter you will be able to:
• define a production possibility curve (PPC )
• draw a PPC
• interpret points under, on and beyond a PPC
• analyse movements along a PPC
• analyse the causes and consequences of shifts in a PPC in terms of an economy’s growth.
The USA produces many more goods and services than Mauritius. In 2023, the output of the USA was valued at $26 265 billion, whereas it was only $14 billion in Mauritius This is because the USA has a much larger economy with a much larger labour force, more capital equipment, more entrepreneurs and more natural resources. The productive potential of an individual, producer/firm or a country can be shown on a production possibility curve (PPC) diagram. A PPC diagram can also illustrate opportunity cost and efficiency.
Changes in the quantity and quality of factors of production
The number and quality of resources are regularly changing. For example, between 2000 and 2023, the labour force of India increased from 400 million workers to 525 million (see Figure 4.1). More workers increase the total output a country can produce. The availability of more workers usually results in the country producing more goods and services.
Over the same period, the labour force of Latvia, a small European country, fell from 1.1 million to 0.9 million workers. Some Latvian workers left the country to live and work in other European countries. They were attracted by higher wages in countries such as Germany. However, despite the fall in the number of workers that Latvia had, its total output increased. This was because it had an increase in another factor of production, capital, and because the quality of its remaining labour force rose with improved education and training.
More and better factors of production increase the potential output of a country, but countries do not
always make use of the factors of production they have. Not using factors of production means that a country is not producing as much as it could be.
Discuss in a pair or group:
1 Do you think your country has more factors of production than it did five years ago?
2 What would you advise your school/college to do with extra factors of production?

A production possibility curve (PPC) shows the maximum output of two types of products and combinations of those products that can be produced with the existing quantity and quality of resources and technology. A production possibility curve is also known as a production possibility frontier or a production possibility boundary.
Figure 4.2 shows that a country can produce either 200 capital goods or 300 consumer goods or a range of combinations of these two types of goods.
production possibility curve (PPC): a curve that shows the maximum output of two types of products and combination of those products that can be produced with existing resources and technology.
Make sure you draw a PPC to each axis –do not leave a gap.
While a PPC shows the maximum amount that can currently be produced, a production point shows what is being produced or what may be produced in the future. A point anywhere on the curve, such as Point Y in Figure 4.3, means that resources are used optimally. This is an efficient output. Any point inside the curve, that is to the left of the curve, means there is not full use of resources. Point X in the diagram shows output is being produced where there are unemployed resources.
There are not enough resources to produce outside the limit set by the PPC. So, a point such as Z is not currently achievable.
A country’s output may fall with the production point moving from the maximum possible output – see Chapter 26.2 (Causes and consequences of economic growth)
When labelling a PPC, make sure the labels show two types of products, such as capital goods and consumer goods or manufactured goods and agricultural goods.
4.3: A PPC and production points
Figure 4.4 shows a country’s PPC. Before looking at the questions below, discuss the diagram with another student. Then, individually, write your answers in your notebook.
1 If a country is producing at Point X, what is its output of capital goods and consumer goods?
2 If a country’s output moves from Point X to Point Y, how many more capital goods and how many more consumer goods will it produce?
3 What is the maximum number of capital goods that can be produced if all resources are devoted to capital goods?
Share your answers with your partner.
Figure 4.4: A country’s PPC
Were you confident in your answers to Activity 4.1? Did you find it helpful to discuss the PPC diagram with a partner before you looked at the questions? Did you reread Sections 4.1 and 4.2 to ensure you fully understood the information on PPC diagrams before jotting down your answers?
A movement along a PPC shows that resources are being reallocated. It also shows the opportunity cost of that decision. Figure 4.5 shows a country initially deciding to produce 80 units of manufactured goods and 75 units of agricultural goods. If the country then decides to produce 100 units of agricultural goods, it will have to switch resources away from producing manufactured goods. The diagram shows the reduction of output of manufactured goods to 60 units. In this case, the opportunity cost of producing 25 extra units of agricultural goods is 20 units of manufactured goods.
Figure 4.5: A movement along the PPC
PPC diagrams are a good way to analyse the opportunity cost involved in deciding what to produce –see Chapter 3.2 (Influence of opportunity cost on decision-making). We are
ACTIVITY 4.2
Figure 4.6 shows a country’s PPC. Write down your answers to the questions.
1 What is the maximum number of capital goods the country can produce if it devotes all its resources to making capital goods?
2 Calculate the opportunity cost of increasing the output of consumer goods from 80 to 90 units.
Check your answers with another student. If you disagree, can you explain how you arrived at your answers? If you think you have made a mistake, think why this has occurred. Are there aspects of PPCs that you need to check over?
Figure 4.6: A country’s PPC
PPCs are usually bowed outwards as shown in Figures 4.2–4.6. This is because the best resources are used first to produce a particular type of product. In Figure 4.5, we noted the opportunity cost of increasing the output of manufactured goods from 60 to 80 was 25 agricultural goods.
To increase the output of manufactured goods by a further 20 to 100 would involve a higher opportunity cost of 75. The last resources switched from producing agricultural goods would have been the least suited to producing manufactured goods.
In the less common situation where resources are equally suited to producing both types of products, the opportunity cost remains constant. In this case, the PPC is shown as a straight line, as shown in Figure 4.7.
Figure 4.7: A straight-line PPC
The opportunity cost of producing 1 more pair of socks remains at 2 ties as the output of socks changes.
The PPC will shift to the right if there is an increase in the quantity or quality of resources (see Figure 4.8). For example, if there is an increase in the size of the labour force, the maximum output that a country can produce will increase.
Capital goods
Figure 4.8: A shift in a PPC
A shift to the left of the PPC will be caused by a reduction in the quantity or quality of resources.
In a group, discuss and decide whether scenarios in Table 4.1 will cause a shift of a country’s PPC to the left or the right. Individually, copy and complete the table. Explain each of your decisions. One has been done for you.
Table 4.1
Discuss how a production point to the right of an economy’s current PPC could be achieved in the future.
A shift to the right of the PPC increases a country’s productive potential. The country will be able to produce more. This is referred to as potential economic growth. To take advantage of this increased capacity, extra or better quality resources have to be used. Figure 4.9 shows both the PPC and the production point moving to the right, so output increases. A rise in a country’s output is actual economic growth.
The reasons why economic growth, and so a movement of the production point and/or a shift of the PPC to the right may occur, are discussed in Chapter 26.2 Economic growth (causes).
Figure 4.9: Economic growth
The use of PPCs
Economists use PPCs to illustrate the choices facing individuals, producers/firms and economies, how resources are currently being used and the effects of changes in the quality and quantity of resources.
One change which is altering the PPCs of many countries is the increase in the average age of populations. Having a higher proportion of older people and a smaller proportion of children may change the pattern of demand. For example, more holidays or leisure activities for retired people may be demanded while fewer children’s video games may be demanded (see Figure 4.10). A change in the pattern of demand can alter how firms allocate their resources. An older population may also alter the number of workers available to an economy and the skills of the workers. For example, older workers may be more experienced but may not be as up to date with advances in technology.
PPCs can be used to model the effects of a range of issues facing individuals, producers/firms and the economy, including the effects of an ageing population.
You should now know:
1 What is the difference between how a change in resource allocation is shown in a PPC diagram and how a change in the quantity of resources is shown?
2 How would a failure to make full use of advances in technology be shown in a PPC diagram?

• A PPC can be used to illustrate opportunity cost. It shows what can be produced with existing resources and current technology.
• A point inside a curve indicates unemployed resources, a point on the curve shows full use of resources and a point to the right of the curve is currently unachievable.
• A movement along a PPC shows a reallocation of resources and the opportunity cost involved.
• A bowed outwards PPC shows an increasing opportunity cost, whereas a straight-line PPC shows a constant opportunity cost.
• An increase in the quantity or quality of resources will cause a shift of the PPC to the right and an increase in productive potential.
1 A country experiences a fall in unemployment. How would this be shown on a PPC diagram?
A a movement of the production point away from the curve
B a movement of the production point towards the curve
C a shift of the PPC to the left
D a shift of the PPC to the right [1]
2 Which points in the diagram are attainable?
A R and S
B V and W
C R, S, T and U
D T, U, V and W [1]
3 The diagram shows a country’s production possibility curve (PPC) showing the potential output of movies and TV programmes. The PPC is a downward sloping straight line. What can be concluded from the shape of the PPC?
A all resources are equally good at producing movies and TV programmes
B resources cannot be switched between producing movies and TV programmes
C the country is able to produce 50 movies and 200 TV programmes
D TV programmes take more resources to produce than movies [1]
4 The diagram shows a production possibility curve (PPC) with two different types of goods: basic goods and luxury goods. What would be the opportunity cost of increasing the output of luxury goods from 25 to 35?
A 8 basic goods
B 10 luxury goods
C 25 luxury goods
D 92 basic goods [1]
5 The diagram shows a production possibility curve (PPC) with two goods: food and clothing. What could have caused the change in the shape of the PPC shown below?
A a change in consumer preferences towards clothing
B advances in technology in the clothing industry
C an increase in the size of a country’s labour force
D more resources being devoted to producing clothing [1]
Total: [5]
6 a What is the difference between a point inside and a point on a PPC? [2]
b Explain two causes of a shift in a PPC. [4]
c Analyse how a PPC illustrates scarcity, opportunity cost and efficiency. [6]
Total: [12]
We
How well do you think you have achieved the learning intentions for this chapter? Give yourself a score from 1 (still need a lot of practice) to 5 (feeling very confident) for each learning intention. Provide an example to support your score.
Now I can…
define a production possibility curve (PPC) draw a PPC
interpret points under, on and beyond a PPC
analyse movements along a PPC
analyse the causes and consequences of shifts of a PPC.
Score Example

Section
1 Read the source material carefully before answering all parts of the question.
The output of more fertilisers and better irrigation have contributed to higher agricultural output for each unit of land in Africa in recent years. More significant, however, has been the increase in the quantity of land used for agriculture, particularly to grow crops.
Despite the rise in agricultural output, the quantity of high-quality food that people would like to consume is not keeping pace with the rise in population in all African countries. Africa’s population is set to double by 2050, which will increase the demand for food even further. As incomes increase in Africa, the desire for a range of products is increasing. People in Africa are, for example, wanting more and better housing. Indeed, the desire for housing usually outstrips the growth in resources devoted to housing. People constantly strive for better living standards.
The expansion of the housebuilding industry is encouraging some farm workers to switch to working in the building industry. Changes in the pattern of demand are causing not only agricultural workers but also other workers to change their occupation and where they work.
Agricultural output can fluctuate quite significantly as it can be influenced by, for example, floods, droughts and heatwaves. The contribution of agricultural output varies between countries. For example, in 2023, agriculture accounted for a much lower percentage of South Africa’s total output than of Nigeria’s total output (see Table 1)
The total output a country produces is influenced by the size of the labour force. Table 1 shows the size of the labour force and total output for a group of selected African countries.
Refer to the information in the source material in your answers.
a Calculate the value of agricultural output in South Africa in 2023. [2]
b Identify two reasons why the productivity of land has increased in Africa. [2]
c Explain the opportunity cost of working on a farm. [2]
d Explain two examples of the economic problem. [4]
e Analyse the relationship between the size of a country’s labour force and its output, as shown in the table. [4]
f Discuss whether or not an increase in the output of food will reduce the output of other products. [6]
Total: [20]
2 In 2023, a floating turbine, moored in the sea off the coast of the north of the UK, started to produce electricity from wave power. More entrepreneurs are becoming interested in making use of wave power, which is a free good. All four factors of production are employed in making use of wave power, including labour. The quality of labour usually increases over time. However, it can be more difficult to predict what may happened to the quantity of labour in a country in the future.
a Define ‘entrepreneur’ [2]
b Explain the difference between a free good and an economic good. [4]
c Analyse, using a production possibility curve (PPC), the effect on an economy of an increase in the supply of labour. [6]
d Discuss whether or not the quantity of labour in your country is likely to increase in the future. [8]
Total: [20]