17 minute read
Chronic Disease Management and the Healthcare Workforce
from DJPH - Delaware's Healthcare Workforce
by Delaware Academy of Medicine and the Delaware Public Health Association
Tim Gibbs, M.P.H. Nicole Sabine, B.S.
While this report is about the healthcare workforce, it is difficult to talk about capacity, demand for services, and growth potential without a discussion of the disease and wellness management. To that end, the next section of the report looks at the healthcare workforce through the lens of key chronic diseases, their prevention and management. We look at Chronic Disease because “currently, some 50% of the US population has a chronic disease, creating an epidemic, and 86% of healthcare costs are attributable to chronic disease.”1 Furthermore, according to the CDC “90% of the nation’s $4.1 trillion in annual healthcare expenditures are for people with chronic and mental health conditions.”2 The differences between acute and chronic disease are numerous and are illustrated in Table 1.
2
Table 1. Differences Between Acute and Chronic Disease
Acute Disease
Sudden Onset
Cure Usual
Course Short
Patient Passive
Physician Dominant Return to Normal Likely Future Uncertainty Rare Chronic Disease
Gradual Onset
Cure Rare
Course Lengthy Patient Active, Caregiver Team Care, Patient Included Return to Normal Unlikely Future Uncertainty Common
The capacity of medical practice to address acute disease and injury has dramatically reduced the incidence of death from these diseases, and increased life expectancy for the population overall. This increase is not consistent across demographics, nonetheless, it is a population wide change. In its place, chronic disease has grown to replace acute disease and injury as the leading cause of death and disability, and an aging population (see Table 2) is more likely to develop chronic disease as a natural result of the aging process.
Table 2. Population Projections for Persons Aged 60 and Older State of Delaware.3
Year 2016 2017 2018 2019 2020 2025 2030 2035 2040 2045 2050
60 -64 60,237 62,231 64,219 66,165 66,649 68,921 64,322 59,971 60,299 66,918 70,051 65 -69 54,915 57,057 56,764 57,124 56,770 64,196 66,801 62,600 58,624 59,105 65,576 70 -74 40,415 41,631 45,052 47,523 48,412 52,270 59,412 62,141 58,415 55,021 55,727 75 -79 28,367 29,490 31,087 33,143 33,922 42,382 45,828 52,342 54,934 51,857 49,235 80 -84 19,578 20,056 20,566 21,545 22,236 27,656 34,689 37,531 42,964 45,259 42,983 85 + 20,410 21,206 21,912 22,552 22,482 26,460 32,709 41,218 47,617 54,472 59,584 Totals 223,922 231,671 239,600 248,052 250,471 281,885 303,761 315,803 322,853 332,632 343,156
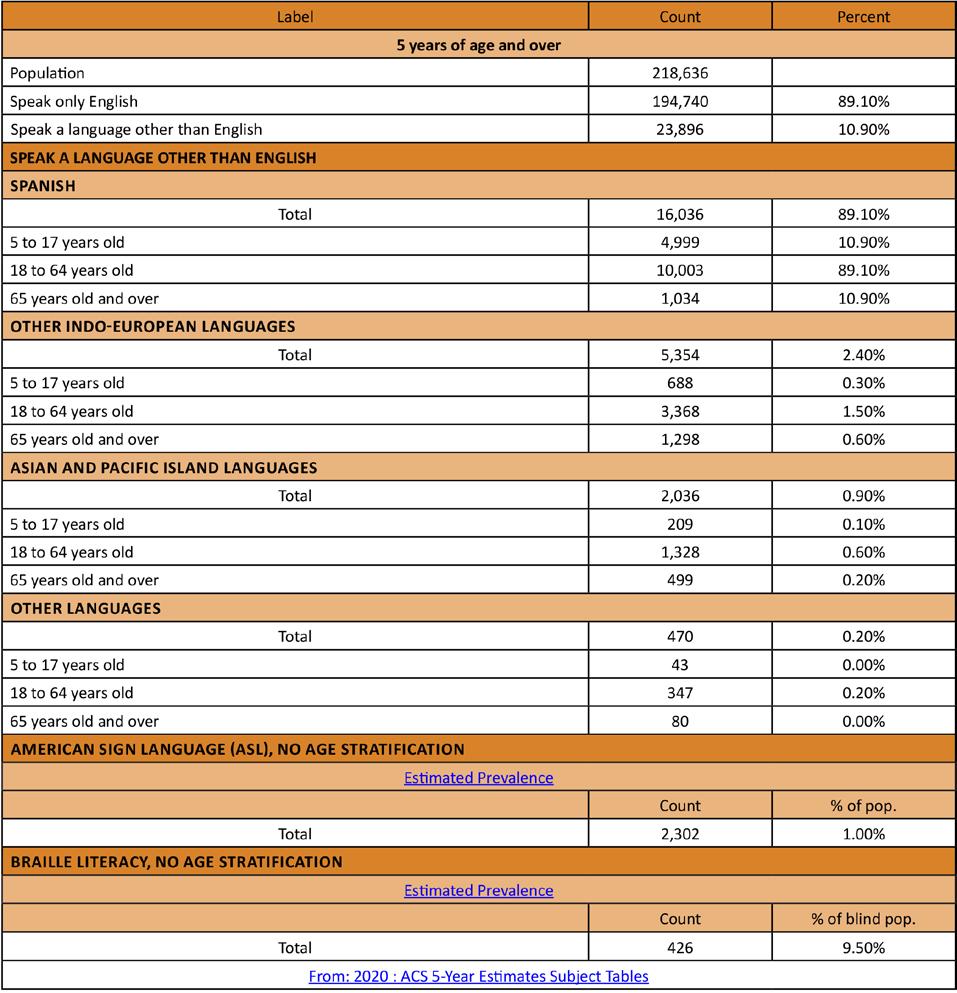
The next section of this report uses the following format. • 1) Sections are alphabetical by chronic disease name. • 2) State level data is presented first, and are based on CDC, Behavioral Risk Factor Surveillance System, 2020 data. • 3) Additional information as compiled by County Health Rankings, US Census Data, and other sources are located immediately below State data. • 4) The first group of pages will contain three sections representing New Castle, Kent, and Sussex County disease prevalence among adults aged 18 years and older (see figures 1-6). The data source will be identified at the top of each table and is not uniform from one chronic disease to another as there is no single source for all diseases. • 5) The next group of pages looks at the number of individuals, by census tract per 100 persons, with the given chronic disease. • 6) The following pages also contain health claims data for all publicly and privately insured Delawareans as reported to and captured by the Delaware Health Information Network (DHIN). The information is displayed based on census tract per 100 persons. This section looks specifically at healthcare utilization, which brings disease management into alignment against demands on the healthcare workforce.
An important limitation of this data is that an estimated 15% of transactions are not captured in the DHIN as some providers are not yet aligned with the DHIN. It is also important to note that data is not captured on self-insured & uninsured individuals, so any conclusions based upon this data must be carefully considered.
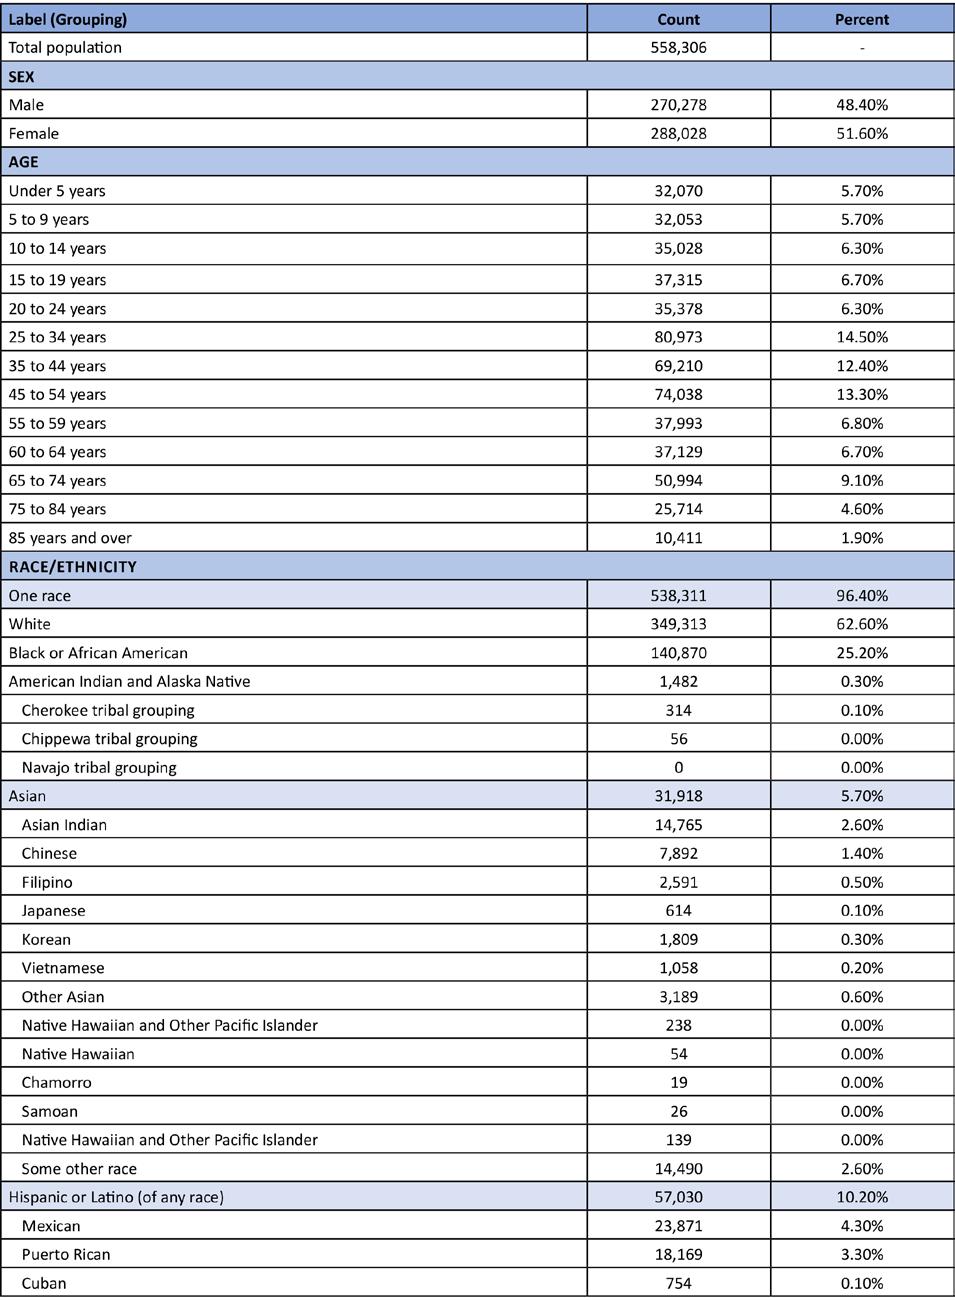
Figure 1. New Castle County Basic Demographics

Figure 2. New Castle County Language Stratified by Age Groupings
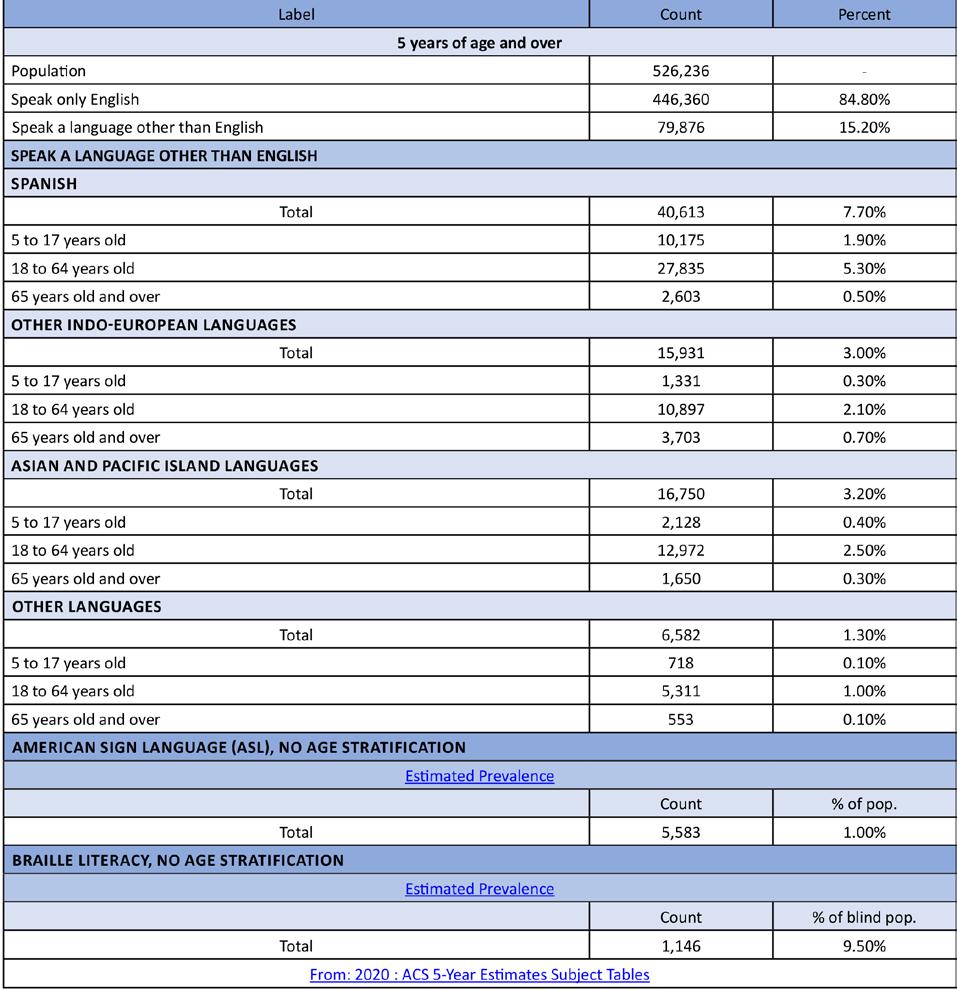
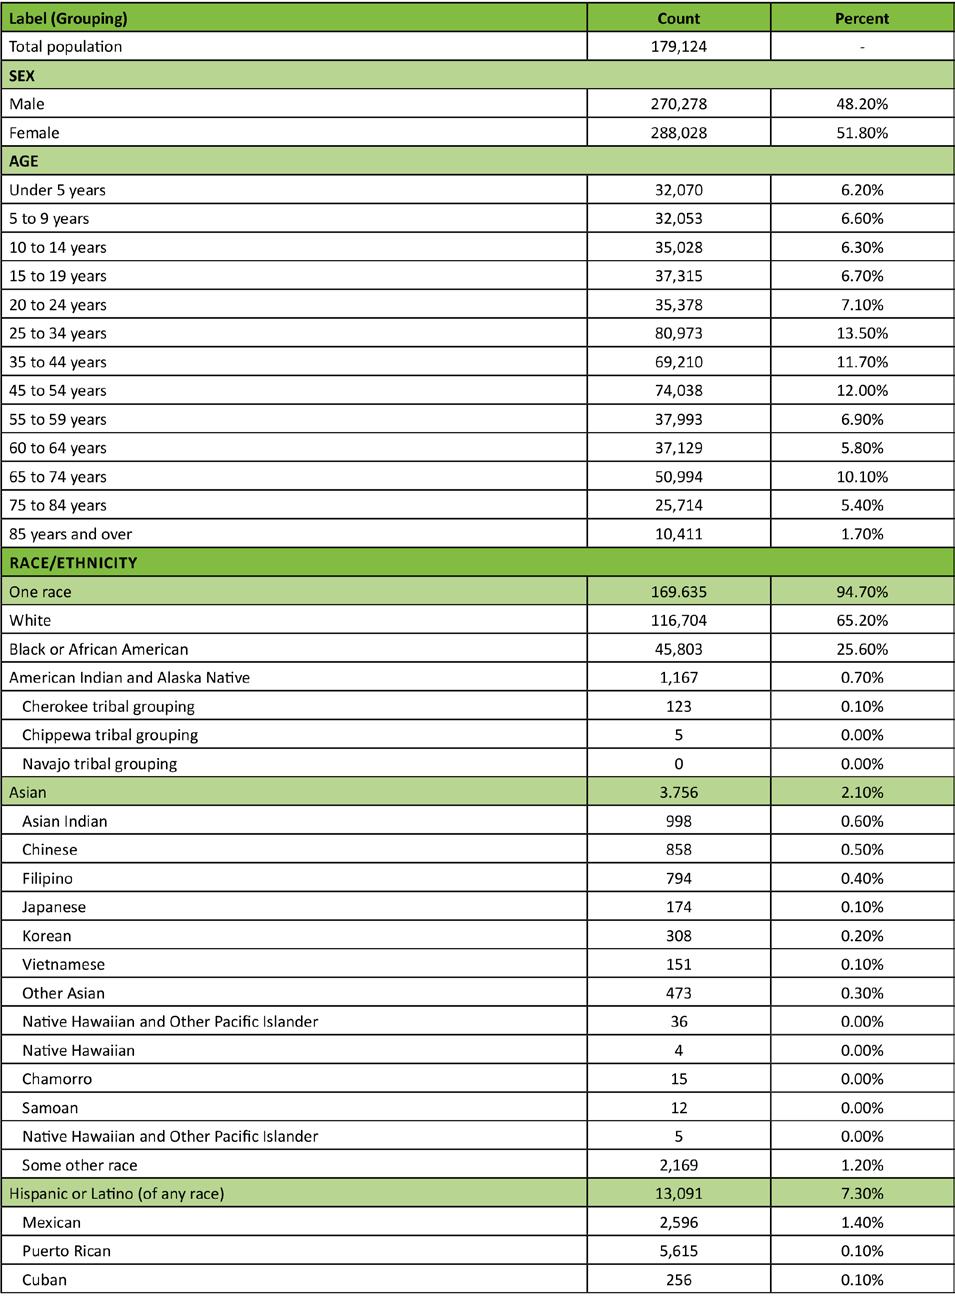

Figure 4. Kent County Language Stratified by Age Groupings
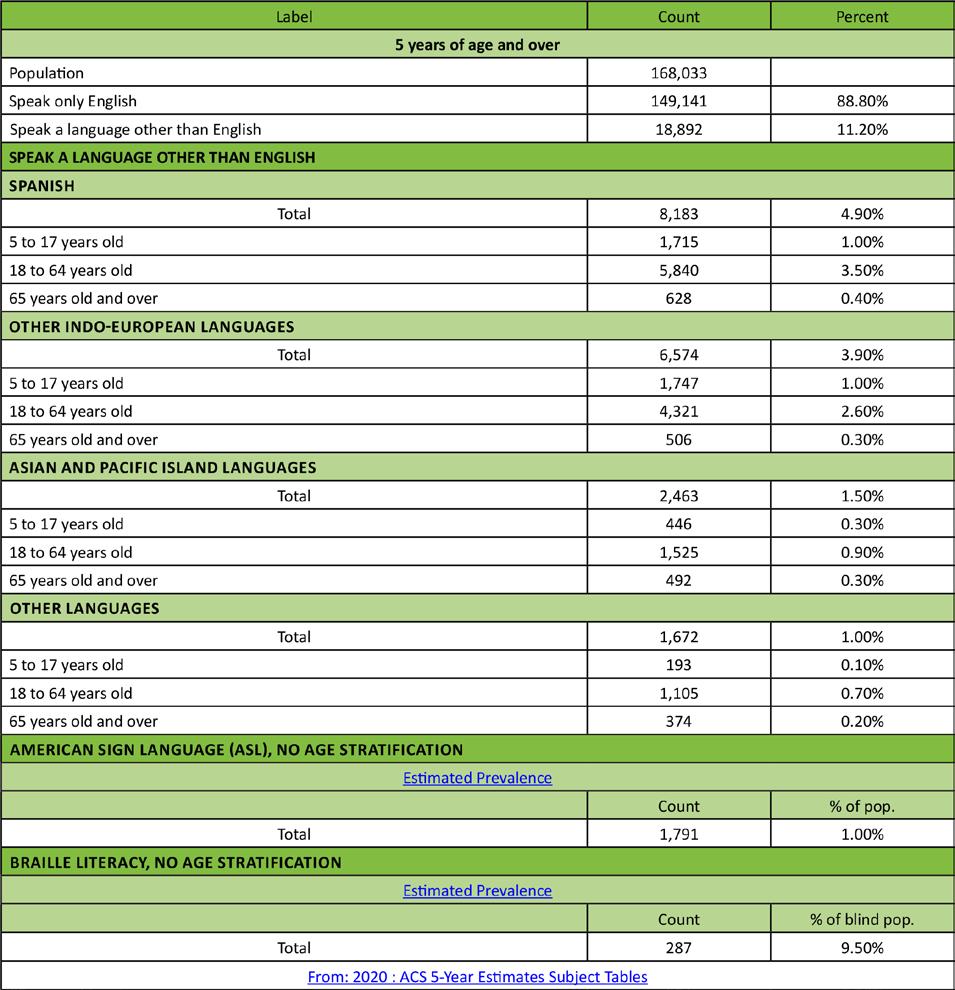
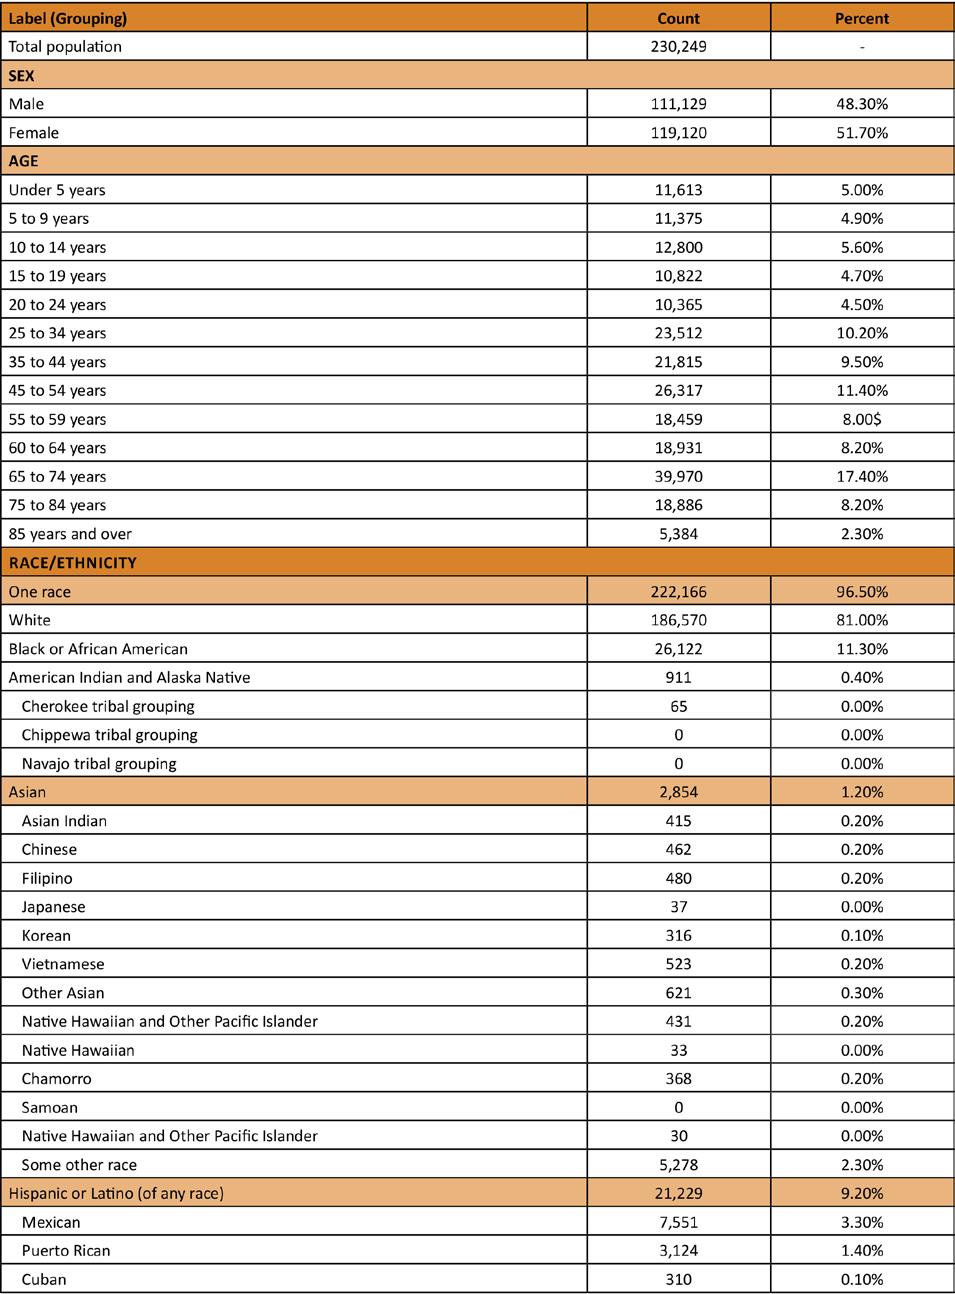

Figure 6. Sussex County Language Stratified by Age Groupings
The data indicates that there are areas of an increased incidence of Alzheimer’s and other dementia disease in each of Delaware’s three counties. Interestingly, these areas seem to correlate with the areas in which Delaware’s healthcare institutions are located (Wilmington Hospital and Christiana Hospital in New Castle County, Bayhealth in Kent County, Tidal Health and Beebe in Sussex County (see figures 7 & 8). This suggests an increased reporting due to the increased number of healthcare providers in these areas. Individuals living with Alzheimer’s and/or dementia may live elsewhere, and travel to the major healthcare institutions for care. The data suggest that keeping a workforce of providers specializing in Alzheimer’s and other dementias in these areas would be prudent to the continuation of care for these individuals. Specialists in neurology and neuropsychology (specific to the type of dementia), geriatrics, psychiatry and/or psychology are likely warranted. Allied health professionals in the fields of speech and language, physical, and occupational therapy and memory may also be included.
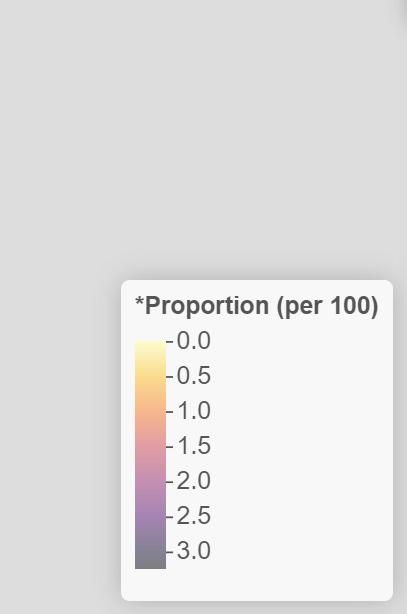
Figure 7. 2020 Proportion of the Total Insured Delawarean Population by Census Tract (per 100 persons) with Alzheimers Disease, Related Disorders, or Senile Dementia
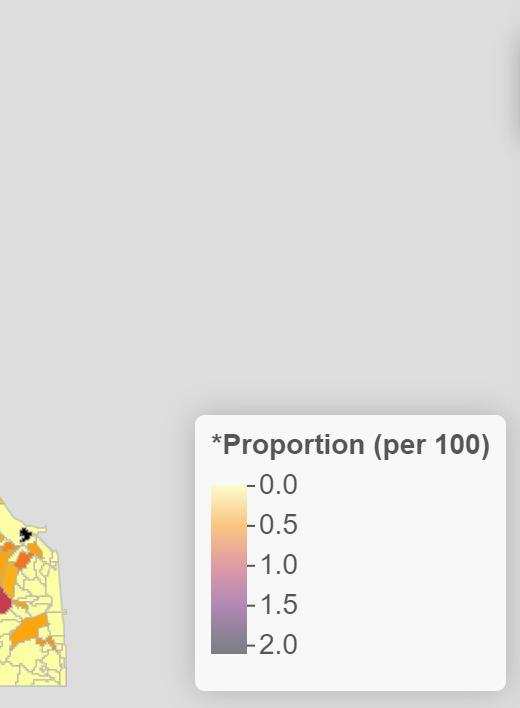


Figure 8 shows that the incidence of osteoporosis, a degenerative bone disease, is higher in the beach town communities, which are well known for their higher population of older Delawareans and retirees. Rheumatoid arthritis is an autoimmune disease, and has similar risk for all populations (figure 9). The incidence of rheumatoid arthritis is lower in New Castle County, and higher in Kent and Sussex Counties. Despite the low numbers of individuals living with these diseases, there is a need for specialists in all three counties due to complications like fractures of the hip (figure 10).
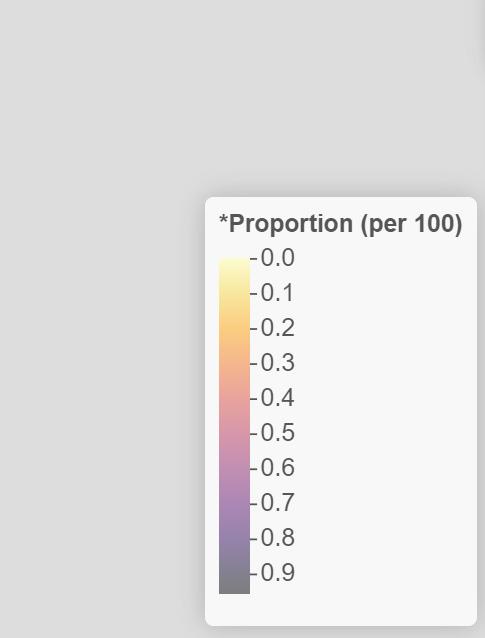
Figure 8. 2020 Proportion of the Total Insured Delawarean Population by Census Tract (per 100 persons) with Osteoporosis Figure 9. 2020 Proportion of the Total Insured Delawarean Population by Census Tract (per 100 persons) with Rheumatoid Arthritis or Ostoarthritis


Figure 10. 2020 Proportion of the Total Insured Delawarean Population by Census Tract (per 100 persons) with Pelvic Hip Fracture


The data for the incidence of breast cancer (figure 11) indicates that there is no geographical component to a breast cancer diagnosis, although there are greater numbers of individuals with this diagnosis living in or around Delaware’s healthcare institutions. The data also shows a very low incidence of colorectal cancer (figure 12) in Delaware. Increased incidence of breast cancer may be due in part to increased screening (breast exams and mammograms) and thus, increased positive cases. In the same fashion, increased use of colonoscopy to screen for colon cancer may have led to Delaware’s low numbers of cases. Prostate cancer incidence higher in those areas known for retirement communities and an older population are indicative of the slow growth of prostate cancers, and the increased screening and testing for this cancer with age (figure 13). While it is important for oncologists and other cancer specialists to practice in all three counties and provide cancer care, it is equally important for primary care physicians and medical homes to be available to assist these individuals with their ongoing healthcare. Healthcare specialists who work with people with cancer include a general oncologist, an oncologist specializing in the type of cancer, surgical and radiation oncologists, social workers, patient navigators, psychiatrists, dieticians, home health aides, and a pharmacist.
Figure 11. 2020 Proportion of the Total Insured Delawarean Population by Census Tract (per 100 persons) with Breast Cancer Figure 12. 2020 Proportion of the Total Insured Delawarean Population by Census Tract (per 100 persons) with Colorectal Cancer
Figure 13. 2020 Proportion of the Total Insured Delawarean Population by Census Tract (per 100 persons) with Prostate Cancer


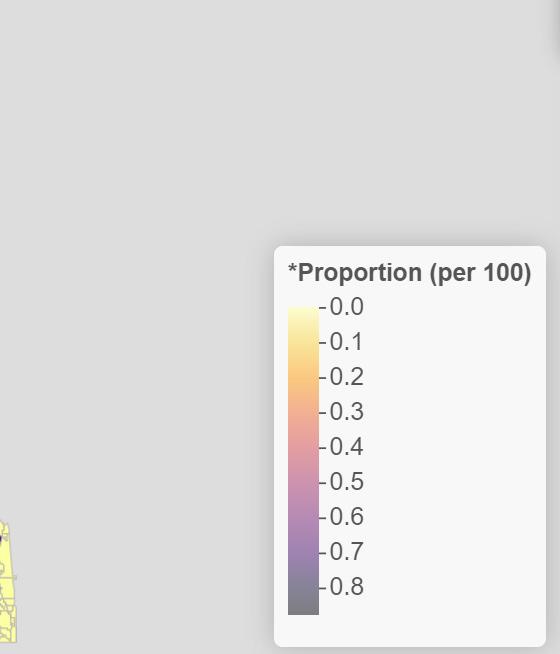

A cardiovascular team will likely consist of specialists in cardiovascular disease, nephrology, and/or neurology (depending on the mechanism of action of the disease) to treat cardiovascular diseases like acute myocardial infarction (figure 14), atrial fibrillation (figure 15), heart failure (figure 16), and ischemic heart disease (figure 17). Community health workers (for blood pressure maintenance and tracking), allied health professionals, radiologists, and medical technicians may also be appropriate.
Figure 14. 2020 Proportion of the Total Insured Delawarean Population by Census Tract (per 100 persons) with Acute Myocardial Infarction
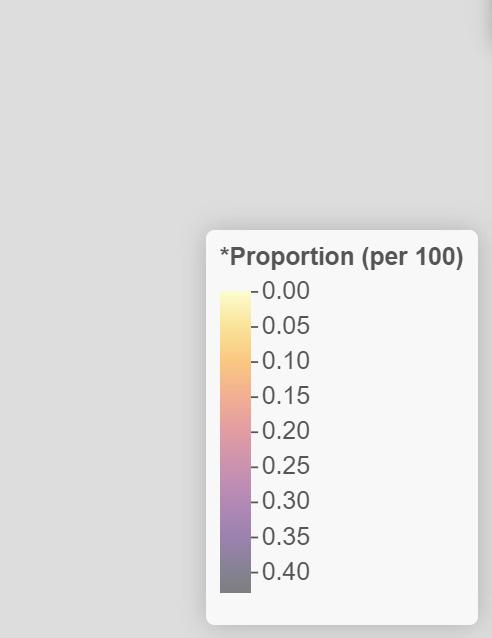


Figure 16. 2020 Proportion of the Total Insured Delawarean Population by Census Tract (per 100 persons) with Heart Failure Figure 15. 2020 Proportion of the Total Insured Delawarean Population by Census Tract (per 100 persons) with Atrial Fibrillation
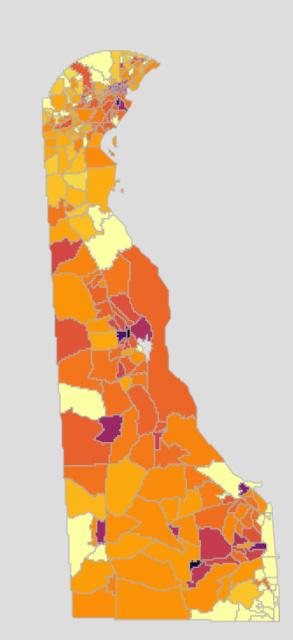


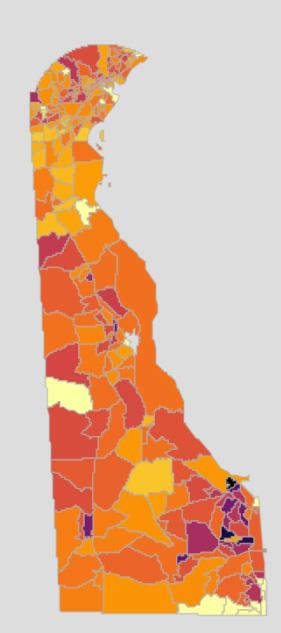

Figure 17. 2020 Proportion of the Total Insured Delawarean Population by Census Tract (per 100 persons) with Ischemic Heart Disease

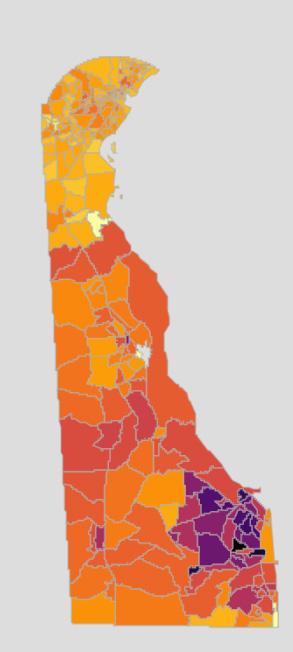

According to the data, the incidence of depression (figure 18) and suicide does not follow any kind of geographical border. There are more cases in urban areas, which may in part be due to an increased population, and highlights the need for mental health professionals throughout the state. Mental health diagnoses are complex, and require a multidisciplinary team including a psychiatrist and/or psychologist, social workers and therapists. Other professionals may be called upon for assistance as needed (i.e. long-term care nurses, pharmacists, community health workers).
Figure 18. 2020 Proportion of the Total Insured Delawarean Population by Census Tract (per 100 persons) with Depression

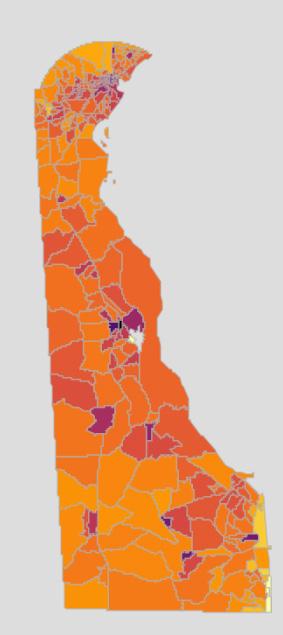

Diabetes (figure 19) is ubiquitous throughout the state and may be due to an auto-immune disorder (type I, seen in children and adolescents); due to obesity, poor diet, or other chronic disease (type II); or due to pregnancy (gestational diabetes). Despite the reason, the data proves the need for diabetes specialists, care teams, and education throughout the state. Managing diabetes requires a multi-disciplinary approach, and includes endocrinologists, dieticians, and community health workers like diabetes care and education specialists. It may also require the use of podiatrists, dermatologists, ophthalmologists and/or optometrists, long term care nurses, home health aides, dentists, fitness professionals, mental health workers, and pharmacists.
Figure 19. 2020 Proportion of the Total Insured Delawarean Population by Census Tract (per 100 persons) with Diabetes

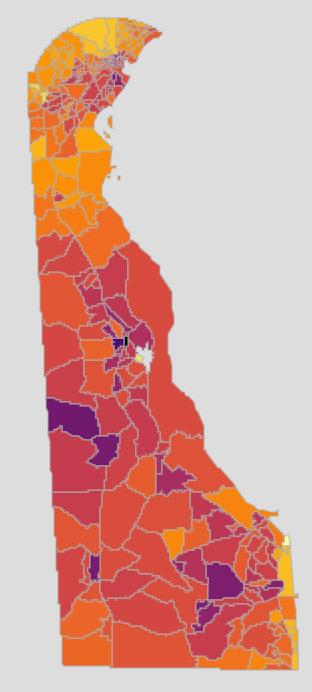

As evidenced in the data showing the incidence of hypothyroidism (figure 20) in Delaware, endocrine disease does not follow any geographical border. There is an increased risk of being diagnosed with an endocrine disease as a person ages, particularly hypothyroidism. Other disorders of the endocrine system (i.e., diseases of the pituitary, diabetes) may be more likely seen in children and young adults. This indicates the need for endocrine specialists. Endocrinologists will work with various specialties to give the appropriate care, based on the specific disorder. These specialists may include geneticists, orthopedists, dieticians and nutritionists, gastroenterologists, fertility specialists, mental health providers, renal specialists, ophthalmologists and/or optometrists.
Figure 20. 2020 Proportion of the Total Insured Delawarean Population by Census Tract (per 100 persons) with Acquired Hypothyroidism
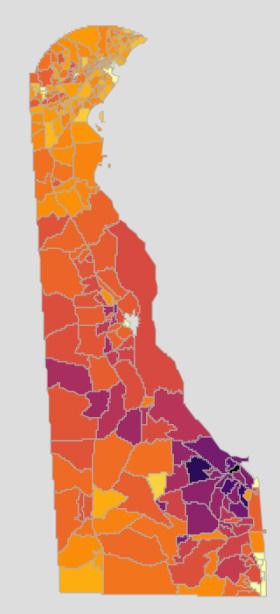

Anemia can be seen throughout the State of Delaware, with pockets of increased incidence in some communities (figure 21). Anemia is generally managed by primary care physicians and continuity of care is important. Hypertension (high blood pressure) is one of the leading causes of morbidity and mortality throughout the nation and in Delaware (figure 22). All three counties in Delaware show high incidence rate of hypertension, with increased numbers in and around the major urban areas. Although the incidence of hyperlipidemia (high blood pressure) are not quite as high, they also spike around the urban areas in the State (figure 23). This suggests a need for cardiovascular specialists in the major healthcare institutions, and primary care physicians throughout the state to provide timely check-ups and ongoing care.
Figure 21. 2020 Proportion of the Total Insured Delawarean Population by Census Tract (per 100 persons) with Anemia Figure 22. 2020 Proportion of the Total Insured Delawarean Population by Census Tract (per 100 persons) with Hypertension
Figure 23. 2020 Proportion of the Total Insured Delawarean Population by Census Tract (per 100 persons) with Hyperlipidemia
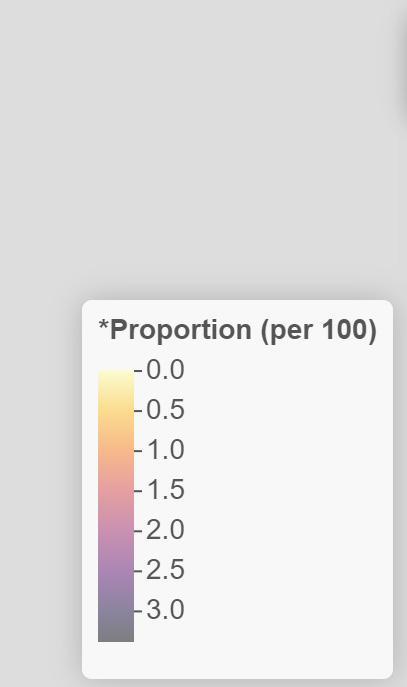
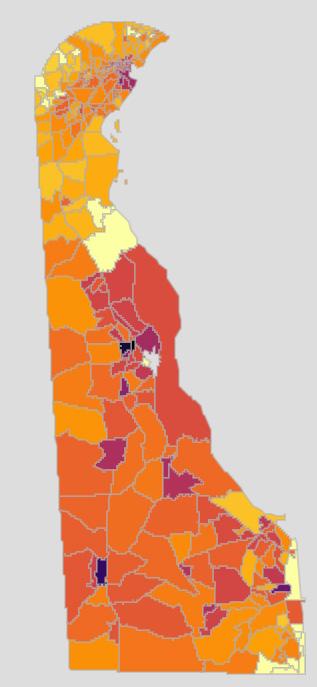

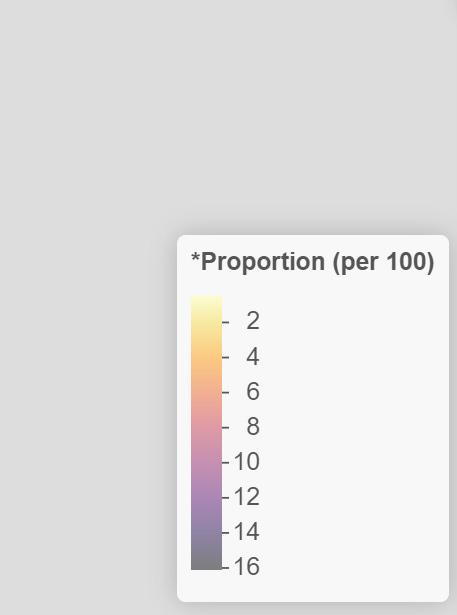
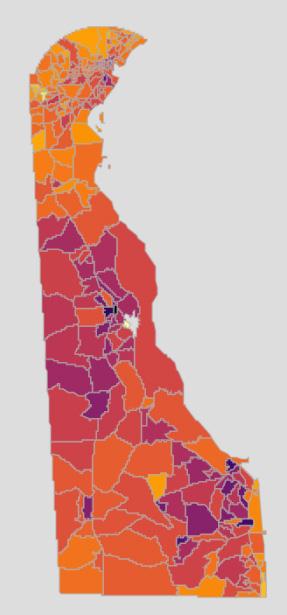

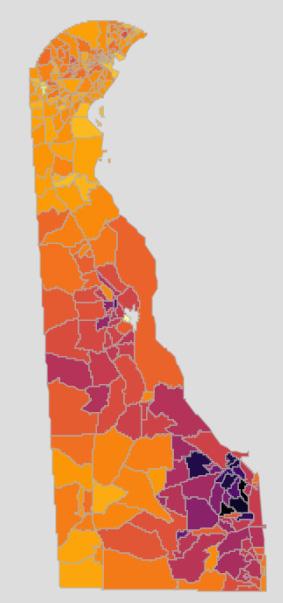

As shown in Figure 24, the incidence of stroke is higher in Delaware’s urban areas, which may be due to an increased population. Although the greatest risk factor for a stroke is age, high blood pressure, high cholesterol, obesity, and kidney disease can all contribute to increased risk. This map illustrates the need for both acute stroke treatment at healthcare institutions as well as ongoing post-stroke care throughout the state. Stroke care teams will likely consist of specialists in cardiovascular disease (including atherosclerosis, heart disease); cardiovascular surgery, pharmacy, and radiology; and neurology immediately after a stroke occurs. Once a patient has been treated, a care team consisting of allied health professionals (occupational, physical, and speech language therapy) and psychiatrists and/or psychologists will likely be added.
Figure 24. 2020 Proportion of the Total Insured Delawarean Population by Census Tract (per 100 persons) with Stroke / Transient Ischemic Attack

According to the data (figure 25), the incidence of renal disease is higher in Kent County than New Castle and Sussex County. There are also areas of high incidence around the urban areas of Delaware. Not only does this show the need for renal specialists throughout the state, it also illustrates the need for dialysis centers, home care providers, and other renal specialists throughout the state. If renal disease progresses, an individual will also need the skills of transplant surgeons. Individuals with chronic kidney disease or end stage renal disease will probably have a care team that includes a nephrologist, a nephrology nurse, a dietitian, and potentially a social worker. If a patient is placed on dialysis, their care team will expand to include patient care technicians and renal technologists. If a patient is matched with a kidney transplant, the care team will expand again to include a transplant surgeon, transplant coordinator, and a donor coordinator.
Figure 25. 2020 Proportion of the Total Insured Delawarean Population by Census Tract (per 100 persons) with Chronic Kidney Disease
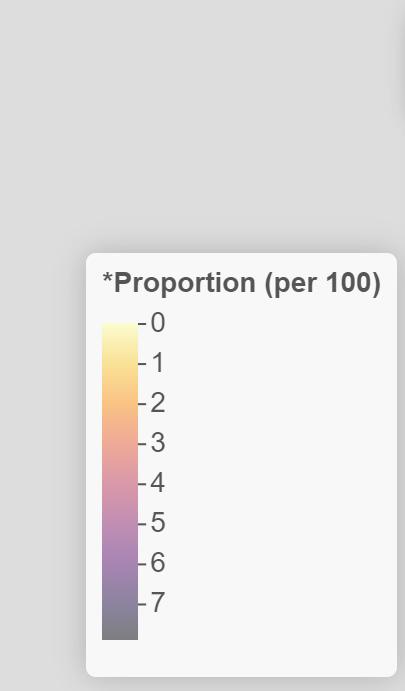
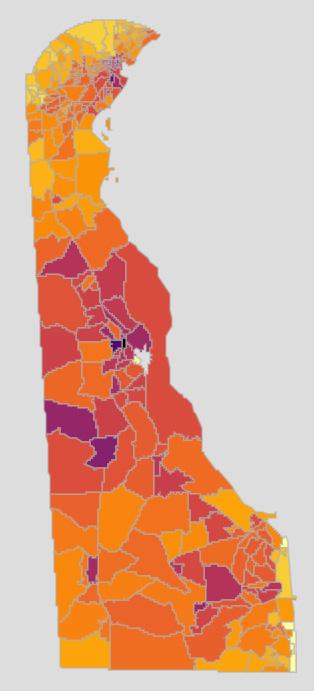

Asthma can be diagnosed at any age. As seen in Figure 26, incident rates increase in urban areas, perhaps due to increased air pollution due to traffic and industry. Chronic Obstructive Pulmonary Disease (COPD) incidence in Delaware is lower in New Castle County than in Kent or Sussex Counties (figure 27). This could be due to a lack of pulmonary specialists in these counties, increased risk of COPD with age, or a difference in air pollutants in these counties. The data illustrates the need for pulmonary specialists in these areas, as well as care teams specializing in COPD. Data on lung cancer has only been reported in a few census tracts (figure 28). These areas may contain larger populations of individuals at increased risk for lung cancer (i.e., history of smoking, increased age), and thus have an increased screening rate. There may also be an association with cancer treatment centers and their reporting. Allergies Individuals with food allergies will require a care team consisting of an allergist and a dietitian. Those with respiratory allergies may create a team of pulmonologists, respiratory therapists, and pharmacists. Asthma Asthma care teams may include a pulmonologist, an allergist, pharmacists, exercise physiologists, respiratory therapists, and mental health providers. Chronic Obstructive Pulmonary Disease Individuals with COPD will likely include a pulmonologist, a pulmonary rehabilitation therapist, pharmacists, mental health providers, and a nutritionist on their care team. Depending on the severity of their COPD, the team may also include a thoracic surgeon and/or a palliative care provider.
Figure 26. 2020 Proportion of the Total Insured Delawarean Population by Census Tract (per 100 persons) with Asthma


Figure 28. 2020 Proportion of the Total Insured Delawarean Population by Census Tract (per 100 persons) with Lung Cancer
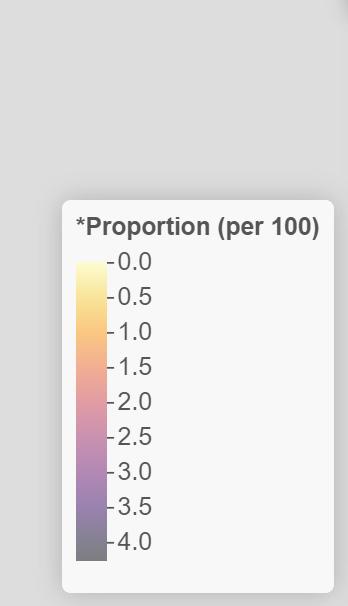
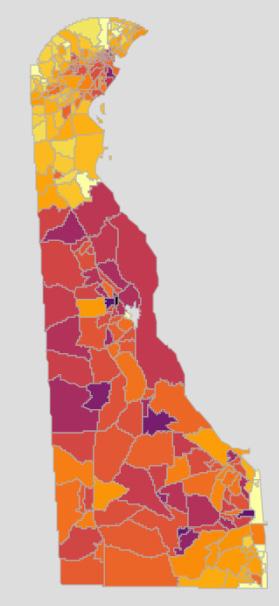


Incidence of benign prostate hyperplasia and prostate cancer increase with age, as shown in figures 29 and 13. These data illustrate the need for urologists and prostate specialists throughout the state, but especially in areas with older populations.
Figure 29. 2020 Proportion of the Total Insured Delawarean Population by Census Tract (per 100 persons) with Benign Prostatic Hyperplasia

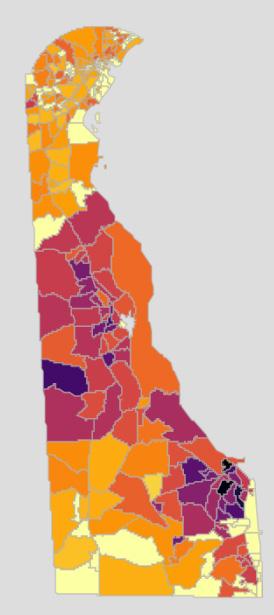
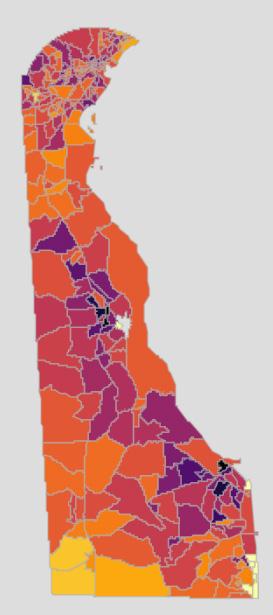
The risk of cataracts increases with age, as the data in figure 30 shows. Glaucoma is more ubiquitous, and can affect individuals at any age, although it is more likely seen in adults. Figure 31 shows that there is an increased incidence of glaucoma in areas of increased populations. There is a need for healthcare providers specializing in ophthalmology and optometry to assist these individuals with their vision needs.
Figure 30. 2020 Proportion of the Total Insured Delawarean Population by Census Tract (per 100 persons) with Cataracts Figure 31. 2020 Proportion of the Total Insured Delawarean Population by Census Tract (per 100 persons) with Glaucoma


REFERENCES
1. Holman, H. R. (2020, March). The relation of the chronic disease epidemic to the healthcare crisis. ACR Open Rheumatology, 2(3), 167–173. Epub2020Feb19. https://doi.org/10.1002/acr2.11114 2. Council on Aging. (2020, Mar 9). Chronic vs. acute medical conditions: What’s the difference?
Retrieved from: https://www.ncoa.org/article/chronic-versus-acute-disease 3. Office of State Planning Coordination. (n.d.). Demographic Information.
Retrieved from: http://www.stateplanning.delaware.gov/demography/documents/dpc/DPC-2021v0-report.xls


