
52 minute read
Maps of the World


Voyages of exploration to seek out new commercial opportunities were an integral part of the Company’s activity, with the direction of voyages often determined by reports heard in the East, of countries and islands that offered great riches. As a result, the VOC and its subsidiaries were the first joint stock companies in history, and the forerunners of modern corporations; eventually giving rise to a multi-national global empire, where money, and the ability to manipulate and move it, becomes the principal resource and driving force.
The route to the East
Smuggling of closely guarded charts of all the routes to the east, and the source of immense wealth and power, often took place, and piracy by both English and Dutch vessels was rife. The VOC employed teams of chartmakers to record the most up-to-date navigational information, of which the principal vector was the “Pascaert”. Item 4 is a previously unrecorded set of the first large-scale printed “Pascaerts” to show the entirety of the route from Europe to the East Indies on Mercator’s projection - an apparently unique survival. The conquest of Jakarta by the Dutch, who immediately renamed the port Batavia, in 1619, gave the VOC its Asian headquarters, from which it commanded a vast trading empire, eventually extending from southern Africa to Japan, that lasted for nearly two hundred years. Items 9, 10, and 11, are Pascaerts from the kaaretenmakers-winkel - mapmaker’s workshop - in Batavia. The war of attrition on all VOC charts, but particularly those on paper, as these are, from conditions at sea, theft, official destruction, political intrigue, and the degenerative effects of time and environment, has been great, and all charts from the kaartenmakers-winkel are exceptionally rare.
“... by way of Traffic and Merchandize to the East-Indies...” (Queen Elizabeth I, original EIC charter)
The English were every bit as ambitious as the Dutch in their imperial plans for Southeast Asia, in the late sixteenth century. When, in 1600, Queen Elizabeth I granted a charter to a private syndicate, the English East India Company – EIC, that henceforth allowed it a monopoly on all English trade with the East Indies, her commercial savvy was well in advance of the Dutch. The EIC gained its initial foothold in Southeast Asia in India in 1612, in Surat. In 1634, the Company was given special trading privileges in the wealthy region of Bengal, the centre of the subcontinent’s lucrative textile trade. The EIC expanded its operation to the Coromandel Coast, founding Fort George (Madras) in 1639. By 1647, when Robert Dudley, published his ‘Dell’Arcano dell mare’ – Secrets of the
Sea - the Company had twenty-three factories spread throughout coastal India. The ‘Dell’arcano del mare’ (item 13) is one the “greatest atlases of the world” (Wardington): the first sea atlas of the world, but also the first to use Mercator’s projection; the earliest to show magnetic deviation; the first to show currents and prevailing winds; the first to expound the advantages of ‘Great Circle Sailing’ – the shortest distance between two points on a globe; and “perhaps less importantly the first sea-atlas to be compiled by an Englishman, albeit abroad in Italy” (Wardington). The EIC’s ascendancy in the Indian Subcontinent had reached a highpoint by 1668, when the Islands of Bombay (today’s Mumbai) were given to England by Portugal as part of Charles II’s wedding dowry. In 1711, the EIC opened up a massive new market when China’s Kangxi Emperor granted the Company rights to trade for tea and silver at Canton (Guangzhou). By 1720, the EIC’s activities accounted for fifteen percent of Britain’s total imports. It was not long before the Company had established factories in Banten (Java), Ayuthaya, and Patani, and was conducting limited trade with Cambodia and Cochin-China.
From Calcutta through the Malacca Strait and beyond
While the EIC was preeminent in mainland India, the Dutch still dominated Indonesia, the Malay Peninsula. Nevertheless, the largest separately-issued chart of the Straits of Malacca and Singapore of the eighteenth century was published in England (item 14), by the firm of Mount and Page. James Larken’s ‘A new and correct chart of the straits of Malacca, with the coast of malacca & part of the Island of Sumatra’ (1754-1761), based on VOC sources, is a very graphic illustration of growing English interest in the region. Even though the early Dutch and English voyages to the Spice Islands had used the Sunda Strait to access the Indonesian archipelago, the most proven route to the Moluccas was via the Malacca and Singapore Straits, held by the Portuguese from 1511 to 1641, when it came under Dutch rule. Imagine the surprise and delight of the English, in 1795, when as the result of an extraordinary turn of events, including the French Revolution, the exiled ruler of the Netherlands, Prince William of Orange, offered his English custodians control of all Dutch colonies, to prevent them too falling into the hands of the French. The EIC immediately occupied Malacca. Java followed in 1811, with Thomas Stamford Raffles, who is credited with being the founder of modern Singapore, appointed Lieutenant-Governor of the colony. In 1818, Raffles persuaded the EIC to establish a base at Singapore, the strategic location of which one Captain Alexander Hamilton had identified in 1703: “a proper place for a company to settle a colony on, lying in the center of trade, and being accommodated with good rivers and safe harbours, so conveniently situated that all winds served shipping
both to go out and come into those rivers”. James Horsburgh knew these waters well, and between 1783, until his retirement in 1805, he sailed with various crews plying a trade between India and China. From 1810 he was chief Hydrographer of the EIC, responsible for collating, editing, revising and publishing all charts returned from Company voyages (see items 16, 18, 19, 20, and 22). British control of the strategic island of Singapore helped to establish their supreme dominance of the China trade during the 1820s. It was soon settled by Europeans and Chinese, and became a financial centre, as well as an international shipping hub. In 1824, the British signed an agreement with the Dutch, which carved up Southeast Asia between them: Britain held the mainland, and the Dutch the islands. British law had given the EIC a monopoly on the China trade, however, by 1833 that had been completely undermined by independent entrepreneurs.
Chinoiserie...
The French East India Company, was not one, but many successive companies, ultimately controlled by the French government. The “Compagnie des Indes”, founded, firstly in 1664, with large contributions from the Royal Court at Versailles, was modelled after its Dutch counterpart, the VOC, at the very beginning of Louis XIV’s reign, and intended to compete head on with them and their English counterpart, the EIC. Soon, “Chinoiserie”, the imitation and/or evocation of Chinese, and other Asian inspired, motifs in Western art, was all the rage; nowhere more so than in the Rococo salons of eighteenth century France. Luxurious porcelain, silk and lacquerware, flowed into Europe from East Asia, from expeditions funded by both the “Compagnie” and increasingly profitable private enterprise. In the 1720s, the “Compagnie des Indes”, vastly expanding its trade with both China and India. After 1745, however, it began to decline, when the war of the Austrian Succession, and then the Seven Years War, caused a hiatus in trading relations. By 1769, after the defeat of the French in India, the Compagnie gradually lost influence in the east, their monopoly on trade, and soon went into liquidation. Nevertheless, interest in Chinoiserie persisted into the nineteenth century, but became unfashionable following the First Opium War of 1839 – 42, when China closed its ports to foreign traders. Le Sage’s threesheet manuscript ‘Carte depuis la fin du Detroit de la Sonde jusqu’a la fin D’Etroit de Banca faitte en l’anne 1734 – [Singapore Strait] – [South China Sea]’ (1734) (item 33), charts a voyage of nearly two thousand nautical miles from the Sunda Strait to Hong Kong, of Captain Louis Dryas’s voyage in the French East Indiaman, La Paix. The northernmost

sheet shows the route to the South China Sea, and includes the coastlines of Malaysia, Cambodia, Vietnam, Hainan, to the coast of mainland China beyond Hong Kong, where the voyage ends. Sage’s map precedes the publication of Jean-Baptiste Bourguignon D’Anville’s ‘Carte particuliere de l’entrée de Canton’, which attempts to accurately chart the islands of the Pearl River estuary, by a year; and Jacques Nicholas Bellin’s by fifteen. The centralisation of hydrography in France began in earnest when Jean-Baptiste Colbert became First Minister of France in 1661. Under his watch, the first Royal School of Hydrography began operating, as did the first survey of France’s coasts (1670-1689). The anonymous manuscript chart of Java (item 32) is clear evidence of a hostile interest that is directed at the very the heart of the Dutch empire. It was probably prepared by the DépÔt de la Marine, known more formally as the DépÔt des cartes et plans de la Marine, the central charting institution of France. Jean Baptiste Nicolas Denis d’Apres de Mannevillette, sailed with his father to Bengal at the age of twelve. After his return, he studied astronomy and geometry in Paris. During a long career in the French merchant marine, starting as fourth officer in 1726, he visited many parts of the world and collected valuable navigational information. During his voyage to China in 1728 he was the first to use the octant (or Hadley’s quadrant) on a voyage to measure latitudes, and determined longitudes by measuring the angular distance between the moon and sun and succeeded in correcting the latitudes of many place. During his many voyages d’Apres de Mannevillette created a number of charts for a hydrographic atlas which, with the support of the Academie des Sciences, was published in Paris in 1745 under the title ‘Le Neptune Oriental’ with twenty-five maps (item 34). In 1762 the Compagnie des Indes appointed D’Apres de Mannevillette as director of maps and plans at Lorient. His comprehensive atlas was used on all French ships for navigating the Indian Ocean, eventually replacing its English and Dutch counterparts: the ‘English Pilot’ published by John Thornton in 1700; and the charts of the van Keulens, the hereditary hydrographers of the VOC.
1 HONDIUS, Jodocus
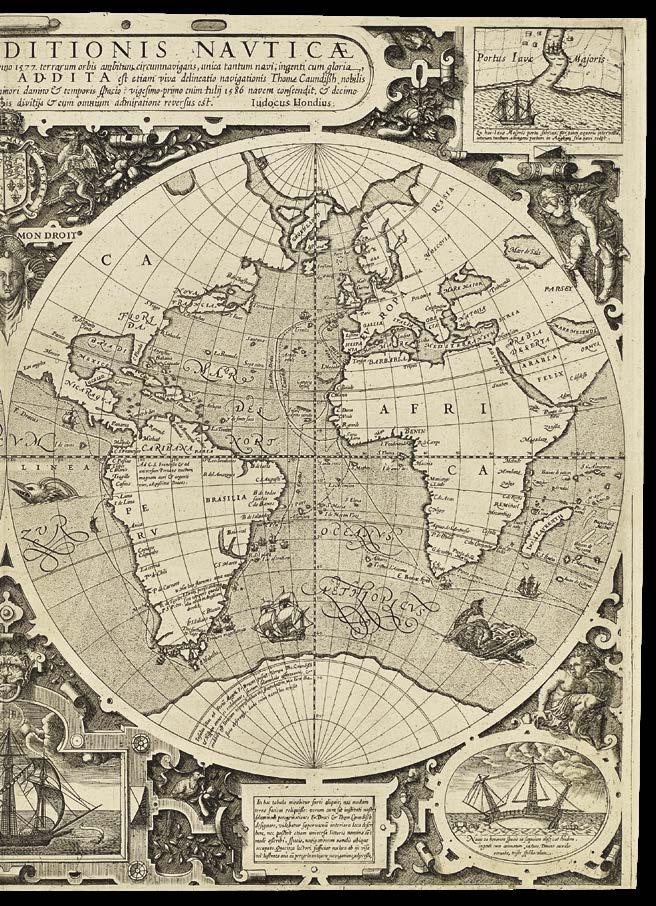
Vera Totius Expeditionis Nauticae... Jodocus Hondius.
Publication [Amsterdam and/or London, Jodocus Hondius, c.1589-1595].
Description Separately issued engraved map, close margins, slight reinforcing of centrefold.
Dimensions 380 by 550mm (15 by 21.75 inches).
References Shirley 188; RGS 264.g.3 and 264.h.14; BL M.T.6.a.2; MMR WAER 844; Fite & Freeman 27; Hind, vol. 1 pp. 173-176 and pl. 94; Schilder, Map 15; Wagner 176. Rare separately issued world map depicting the voyages of Drake and Cavendish, by one of the greatest map engravers of his day. This rare broadsheet map is a homage to Francis Drake and Thomas Cavendish - the first Englishmen (and only the second and fourth men) to circumnavigate the globe. The Latin text below the title gives a brief description of both men’s voyages: Drake left England on the 13th December 1577 with five “well equipped ships”, returning on the 27th of September 1580 “with great glory but with one ship only the others destroyed by fire and storms at sea”; Thomas Cavendish, who fared rather better, “took the same course round the world but with less loss and in a shorter time”, leaving on the 21st July 1586 and returning on the 15th September 1588. “He acquired great riches and the admiration of all his countrymen”. The voyages were of huge significance at the time, as they directly challenged Spain’s hegemony of the New World, at the same time that England was confronting her power over Europe. The map highlights the voyages’ importance by stripping much of the descriptive text from the land, leaving only the information pertaining to the expeditions. The map also takes the uncommon step of splitting North America between its eastern and western hemispheres. Although unusual, it does have the effect of highlighting the voyages’ ports of call in South America, the western coast of North America and the Spice Islands. The map’s cartographic importance lies in its depiction of the great Southern Continent, with Tierra del Fuego clearly distinct from Terra Australis. Shilder states that, “Hondius was the first to see the true implication of Drake’s voyage”. Below the title is the royal coat-of-arms of Elizabeth I, with a vignette of the Golden Hind, Drake’s flag ship, below. The text to the left of the vignette states that the ship now resides at Dartford. To the corners are four further illustrations of the ship: Drake’s landing at “Nova Albion” in California where he was crowned king by the natives, upper left; sailing round the southern coast of Java - the first person to do so - upper right; Drake’s welcome by the King of the Moluccas, lower left; and the Hind cast upon rocks near the Celebes. Although, as Fite and Freeman point out these “are probably the only [contemporary] representations of the famous ship in existence”, today one is rather spoilt for choice as there are not one but two full size replicas of the Hind, one upon the Thames, and the other at Brixham in Devon.

The map was the work of Jodocus Hondius (1563-1612) one of the leading Dutch cartographers and engravers of his day. Between approximately 1584 to 1593 he lived and worked in London. Whilst there, he took a particular interest in Drake’s voyages and the man himself, with several engravings of the explorer attributed to him. Hondius’s residence in London also bears witness to the close ties between the English and the Dutch at the time. Both were young seafaring nations who were keen to wrench the riches of the New World and the Spices of the Moluccas from the grasp of the Iberian powers. The exact dating of the map is uncertain. It is highly unlikely to have been published earlier than 1589 - a year after Cavendish returned. Some have stated that it was produced sometime in the early 1590s, whilst Hondius was still in London. Shirley counters that the map is too highly finished to be attributed such a date; this, together with the fact that some copies are mounted as broadsides with Dutch text, makes a date of post 1594 - when Hondius had returned to Amsterdam - more appropriate. One might equally argue that both theories are true. As Hondius must have owned the copper plate, publication in both London and Amsterdam is most probable. Extremely rare. Shirley states there are some seven or eight known examples of the map. He gives the location of four of these: two in the Royal Geographic Society; one in the British Library; and one in the Maritime Museum Rotterdam. Of the other three or four he states that they are in American and Parisian collections. The OCLC records several in the American institutions, however, the majority seem to be facsimiles. The exceptions would seem to be the Library of Congress, and the University of Texas.


2 HONDIUS, Jodocus
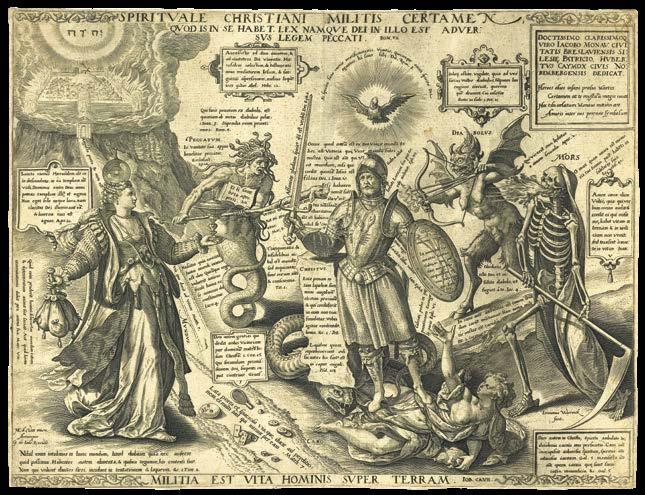
Typus Totius Orbis Terrarum, In Quo & Christiani militis ceramem super terram (in pietatis studiosi gratiam) graphice designatur. a Iud. Hondio caelatore. [together with] Spirituale Christiani Militis Certame Quod is in se habet lex namque dei in illo est adver svs legem peccati.
Publication [?Amsterdam, c1597].
Description Broadsheet engraved map, here together with the broadsheet engraving by Hieronymous Wierix after an original drawing by Maerten de Vos upon which the figures on the map are based.
Dimensions 370 by 485mm (14.5 by 19 inches).
References Shirley 198. The “Christian Knight” map of the world is the first map on Mercator’s projection to be produced after the great geographer’s death. Mercator’s projection is one of the great intellectual inventions of man, solving the ancient classical problem how to map the spherical earth onto a flat sheet of paper, while preserving the bearings of the compass as straight lines. The projection was first used on a huge wall map made by Mercator, only three examples of which survive (BNP, Paris; Basle; and Rotterdam). Mercator’s projection severely distorts and exaggerates the size of regions far from the equator, as the scale increases from the equator to the poles. Greenland takes as much area on the map as Africa, while in fact Africa is fifteen times greater. Antarctica appears the biggest continent, although it is actually the fifth in size. But the fact that lines of true bearing or course are straight lines outweighs these distortions. The map is legendary also for its allegories with deep philosophical levels, with the Christian Knight and King fighting the Rulers of Darkness. The map is famous for the depiction of Roanoke, the first English colony in America. John Milton owned an example of this map that inspired him for his ‘Paradise Lost’. Representing the three-dimensional spherical earth on a twodimensional flat map can be done in infinitely many different ways, but is impossible without introducing distortions. In 1569 the great geographer and cartographer Gerard Mercator came up with the brilliant idea of the cylindrical map projection, which became the standard map projection ever since. Despite the distortion, it has the essential property that directions of the compass are preserved as straight lines on the map, making it ideal for navigation. Mercator himself could not solve the mathematical calculations for his projection. It turned out that this required the “Integral of the secant function of trigonometry”, which became one of the “outstanding open problems” of the sixteenth and seventeenth century, a famous problem also addressed by Isaac Newton but not solved until 1668 by James Gregory. But a numerical solution (by what we would today call Riemann sums) was developed by mathematician Edward Wright in London as early as 1596, specifically for the practical navigational purpose of constructing a perfect Mercator map. Wright finally published his findings in 1599 in his famous work ‘Certaine Errors in Navigation’, but his draft manuscript of 1596 had already been used by his friend Jodocus Hondius for the “Christian Knight” map of the world. Hondius however employed Wright’s calculations without asking permission. Although Hondius sent apologetic letters to his friend, Wright condemned Hondius’s deceit and greed in the preface to ‘Certaine Errors’. He wryly commented: “But the way how this [Mercator projection] should be done, I learned neither of Mercator, nor of any man els. And in that point I wish I had beene as wise as he in keeping it more charily to myself”.


In addition to being a revolutionary map for its advanced projection, it is one of the best-known and mysterious of all maps, decorated with elaborate artwork and allegories with deep philosophical and ideological levels. The scenes at the foot of the map show the Christian Knight fighting the rulers of darkness: Vanity, Sin, Carnal Weakness, the Devil and Death. Hondius derived the scene from a very rare print, also present here, by Hieronymous Wierix after an original drawing by Maerten de Vos. Peter Barber, in “The Christian Knight, the Most Christian King and the rulers of darkness” (‘The Map Collector’ 48, 1989, 2-8) makes a convincing case that portrait is that of Henry IV of France and that the purpose behind the maps production was to rally protestants in England and throughout Europe to the side of Henry IV of France at the moment of crisis in his struggle against Spain and the Catholic powers of Europe. The map is also famous for its up-to-date mapping, including Walter Raleigh’s lost colony of Roanoke, and showing the results of the circumnavigations by Drake and Cavendish. Only six other examples are recorded today: Ann Arbor, William L. Clements Library (Maps 8-C-19); London, The British Library (Maps 188.k.1 [5]); London, The Royal Geographical Society (264 H 14 [4]); Nürnberg, Germanisches Nationalmuseum (Qu. 4 H 2229)1; Wellsnext-the Sea, Holkham Hall (Innys Collection) UK; Wien, Österreichische Akademie der Wissenschaften (Woldan Collection [K-V(Bl):WE 49]).
3 TEIXEIRA, Luis
Magna Orbis Terrarum Nova universalis et accurata tabula Geographica ac Hydrographica deli nata in hauc ajcrem formam manu celeberrimi regiae Majesatis cosmographi Ludovici Texeirae.
Publication Antwerpiae, apud Joannem Baptistam Vrient, 1604.
Description Engraved map, printed on twelve sheets, flanked by four sheet letterpress description annotated with several woodcut animals, with fine contemporary hand-colour heightened gold, trimmed to neat lines, laid on linen, extensive areas of restoration. A full conservation report is available on request.
Dimensions 1670 by 2970mm (65.75 by 117 inches).
References Schilder, Günter, ‘Monumenta Cartographica Neerlandica’, III, pp. 1-102; ibid. pp. 39-51, No. 5 and No. 6; Shirley, Rodney, ‘The Mapping of the World’, No. 183 (Plancius 1592), No. 243 (van den Ende/BNF), No. 248 (Teixeira); Destombes, Marcel, ‘La Mappemonde de Petrus Plancius gravée par Josua van den Ende 1604’, Hanoi, IDEO, 1944, Publications de la Societé de Géographie de Hanoi; Destombes, Marcel, ‘Quelques rares Cartes nautiques Néerlandaises du XVII Siècle’, in: Imago Mundi 30, 1978, pp. 56-70. Woodward, David (ed.), ‘History of Cartography’, vol. 3, part 2, pp. 1347-1351. A spectacular wall map of astonishing beauty made at the beginning of the Dutch Golden Age.
Cartography The present map draws on the cartography of Luis Teixeira (fl 1564-1613) - whose name appears in the large pasted title - a Portuguese cartographer from a famous mapmaking dynasty. He worked in Lisbon and the Portuguese colonies, but was also a friend of and collaborator with Dutch cartographers, contributing a map of Japan to Abraham Ortelius’s atlas. Ortelius and Cornelis Claesz published five of his maps between them, and all were specifically advertised as based on his work, indicating that he was highly respected in Amsterdam. The map is based upon a simple cylindrical projection and follows very closely the 1592 wall map drawn by Petrus Plancius, “a milestone in the emergence of Dutch cartography [and] the first large wall map of the world to be published in the north” (Schilder). The work was engraved by Baptista and Jan van Doetecum and is known only in a single extant example: that in the Colegio del Corpus Cristi in Valencia, Spain. Plancius drew heavily on Mercator’s 1569 world map, as well as contemporary manuscript maps by the Portuguese cartographers Pedro de Lemos and Bartolomeo de Lasso. The present Teixeira map shows a number of significant improvements over Plancius’s prototype: the redrawing of Guiana following Sir Walter Raleigh’s exploration of 1595; the insertion of the Davis Strait, Novaya Zemblya, and the tributaries of the Congo; and amendments to the southern parts of South America and Africa. This updated geographical information was derived from accounts of voyages collected by Linschoten, De Bry, Hulsius, Claesz and others. The map is noteworthy for its portrayal of a vast southern continent, and its depiction of the Southern Pacific at the dawn of Dutch exploration of southeast Asia and Australasia. The true form of the island of New Guinea had not yet been ascertained, and so, bizarrely, it appears twice: once as an island on the left hand side of the map, and again as part of the mythical continent of Magellanica on the right. The Gulf of Carpentaria is tantalizingly hinted at in the sweeping bay in Magellanica at the far right of the map. The myth of the Great Southern Continent was propagated by the belief that, in order to balance the earth, there must be a landmass in the southern hemisphere of a size commensurate with that in the north. It was, in part, this erroneous assumption that spurred Dutch exploration of Australia in the seventeenth century, and Captain Cook’s voyages over one hundred years later. It was not until the twentieth century, and the explorations of Captain Scott and Roald Amundsen, that the lands of the southern hemisphere were finally charted with any degree of accuracy.

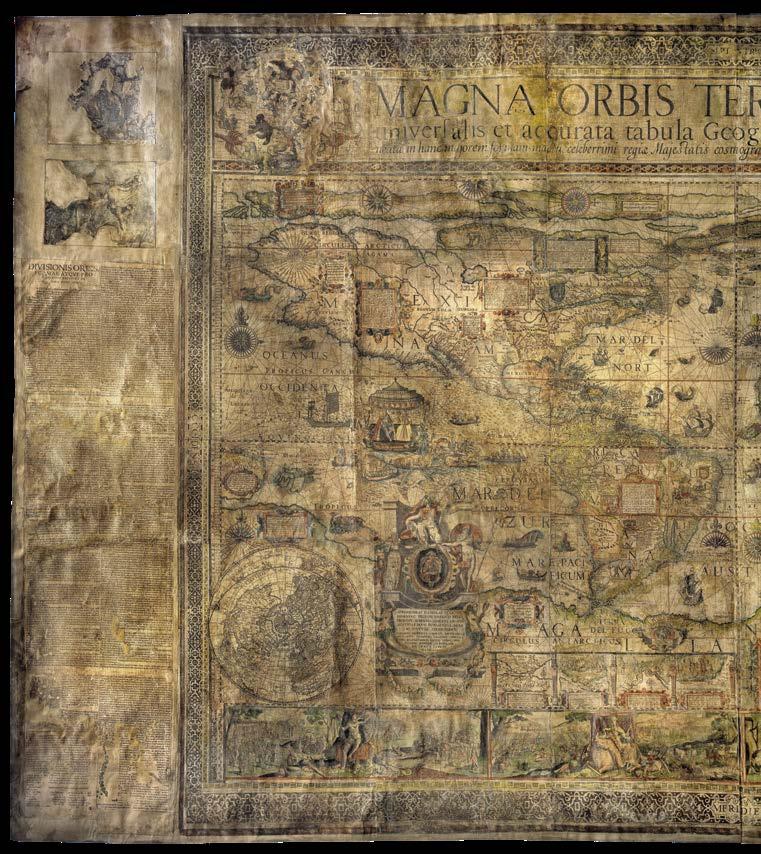

Towards the lower corners of the map are representations of the northern and southern hemispheres, and along the bottom of the map are ten small panels containing detailed maps of Magellan’s Strait (according to Drake in 1579, Noort in 1599, and De Weert, also in 1599); of Rio de la Plata; Northern Europe; Novaya Zemlya (according to Barentsz in 1598), and the straits of Sona (off Java); Anian; Manilla; and Gibraltar. Below the map, printed on separate strips, are long engraved panels presenting the four continents, each personified by a woman riding a symbolic mount. Background scenes show the typical architecture or dwellings of each region, indigenous animals, and the local peoples engaged in battle. These scenes relate to the text panels flanking the map, which are printed in letterpress interspersed with depictions of local flora and fauna. This text is trimmed from the only known institutional example of this map, making the present example, together with a further privately held copy, one of only two known maps surviving in its original form.
Publication The existence of an extremely large wall map of the world by Luis Teixeira, sold by Jean Baptiste Vrients and Cornelis Claesz, is recorded by Schilder in ‘Wall Maps of the World published in Amsterdam before 1619’ (MCN, vol. III, p. 39 No. 5), and Shirley in ‘Mapping the World’ (248). Although neither Schilder nor Shirley record any extant examples, the evidence for its production comes from two contemporary sources; first in the archives of the publishing house of Plantin-Moretus: “On 14 December 1604 the Antwerp publisher and map dealer Joan Baptista Vrients delivered to Balthasar Moretus several maps of the world, among which were the maps of Teixeira: ‘Adi 14e Decembre [1604], 2 Groote Mappa Texerae 6 fl., 2 Cleyn Mappa Texeirae 3 fl. 10’” (Schilder) And second in a catalogue by Cornelis Claesz: “A much more detailed description of Teixeira’s world maps is provided by Cornelis Claesz in his catalogue of 1609. As was mentioned in the description of map no. 1 [i.e. Plancius’s world map of 1592], this is not a stock list, but a catalogue comprising only of the engravings and maps that were printed from copper plates owned by Cornelis Claesz. In the section ‘All kinds of large maps’ two maps of the world by Teixeira of different sizes were offered for sale, whilst the customers could choose the language in which he wanted the accompanying description. ‘Mappa Mundi Lodovici Tessairae, 22. large folios in Latin, Italian, Spanish, French, English, Dutch and German” (Schilder). Although neither of the sources refers to a date of publication, the Spanish writer Leon Pinelo referred in 1629 to two Teixeira maps dated 1598 and 1604 respectively. Whether or not they were two unique maps, or simply different editions of the same work, is unclear.

As well as bearing the names of Teixeira and Vrients, the present map also carries the name of the engraver Joshua van den Ende. Both Shirley (243) and Schilder (MCN III, p.45 No. 6), record a large wall map on twelve sheets engraved by van den Ende, and dated circa 1604. The sole institutional copy referenced by both Shirley and Schilder – in the Bibliothéque Nationale in Paris - is undated, untitled, and unsigned by any author or publisher. Only van den Ende’s name, as the engraver, appears on the sheets. After consultation of the BNF map, it is clearly printed from the same plates as the present example. The discovery of the present work therefore allows us to confirm Schilder’s date of 1604, and to add both Vrients as vendor and Teixeira as the work’s cartographer. It also allows us to correct the map’s erroneous attribution to Willem Blaeu. The editors of the ‘History of Cartography’, Destombes (in his monograph on the BNF’s van den Ende map) and Schilder all suggest that Willem Blaeu may have published the map, for three reasons. First, neither Hondius nor Claesz in his 1609 catalogue mention such a map; second, van den Ende is known to have engraved much of Blaeu’s earliest published work; third, in 1604 Claesz and Plancius’ privilege for their 1592 wall map ended, thus allowing Blaeu (or any other publisher) to reproduce the map. However, with the discovery of the present work, we can conclude that it was in fact Vrients, in association with Claesz, who decided to publish the new map in 1604, updating the hugely successful Plancius map of 1592 with the latest developments from Teixeira.

Rarity Dutch world wall maps from this era are incredibly rare. Due to the rapid rate of discovery at the beginning of the seventeenth century “many maps soon lost their value; the owners replacing the obsolete maps with new ones. This development is one of the causes of the great percentage of losses which wall maps of the world suffered; they are extremely rare nowadays” (Shirley). The present work is only the third surviving, and second complete, example of the Teixeira/Vrient map of 1604. The example in the BNF lacks the accompanying text and title. Schilder records five examples prior to the present map in his census of Dutch world wall maps published in Amsterdam before 1619 (MCN III, p. 19-102):
1. PLANCIUS, Petrus. ‘Nova et Exacta Terrarum Orbis Tabula Geographica ac Hydrographica’. Amsterdam, 1592. Map on 19 sheets. One recorded example, Collegio del Corpus Cristi in Valencia.
2. LANGREN, Hendrik van. ‘Nova et Accurata, Totius Orbis Terrarum Geographica et Hydrographica’. [Amsterdam, c.1600]. Map on (?)20 sheets. One recorded example Stadtbibliothek of Breslau, now lost due to military action during World War II.
3. CLAESZ, Cornelis. [No Title] [Amsterdam, Cornelis Claesz., c.1602]. Map on four sheets. No known extant example of the first edition.
4. HONDIUS, Jodocus. ‘Nova et Exacta Totius Orbis Terrarum Descriptio Geographica et Hydrographica’. [Amsterdam, Cornelius Claesz, 1603]. Map on four sheets. No known extant example of the first edition.
5. TEIXEIRA, Luis. [No Title] [Amsterdam, Joan Baptist Vrients, (?) 1604]. Map on nine sheets. No known extant example of the first edition.
As the list shows, the present work is only the second surviving example from the first twelve years of world wall map publication in Amsterdam. In fact, of the seven further maps that Schilder goes on to list as published before 1619, only four are known to exist in their first edition.

4 GOOS, Pieter [and] JACOBSZ, A[nthonie]
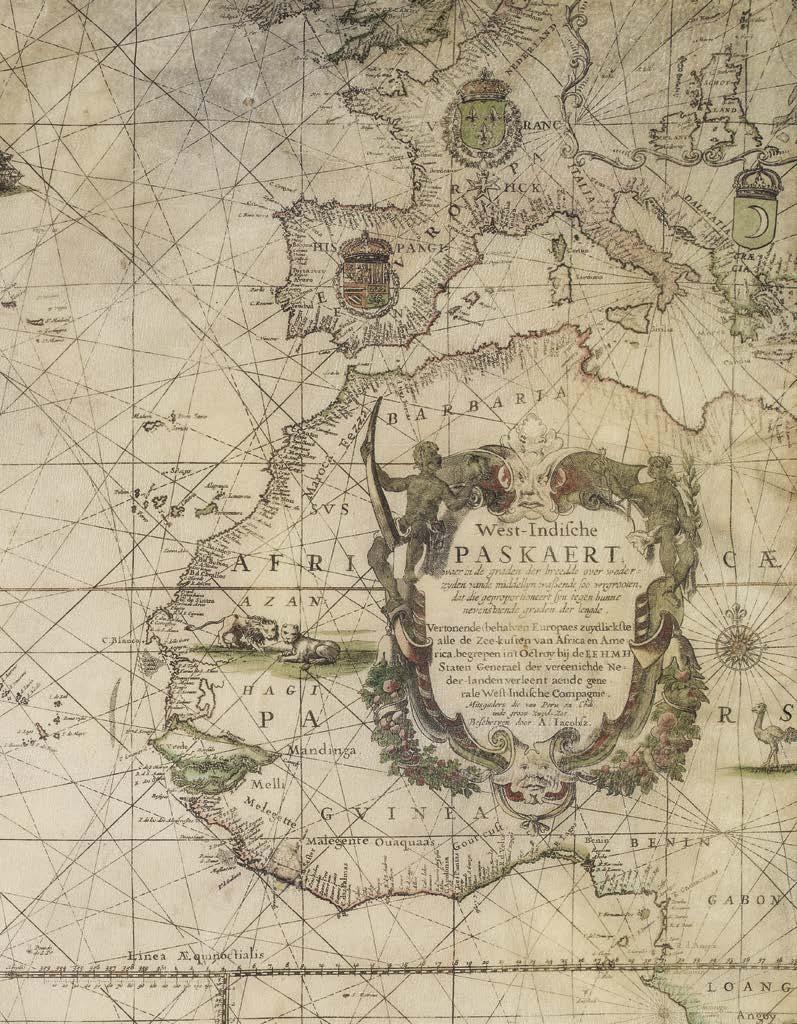
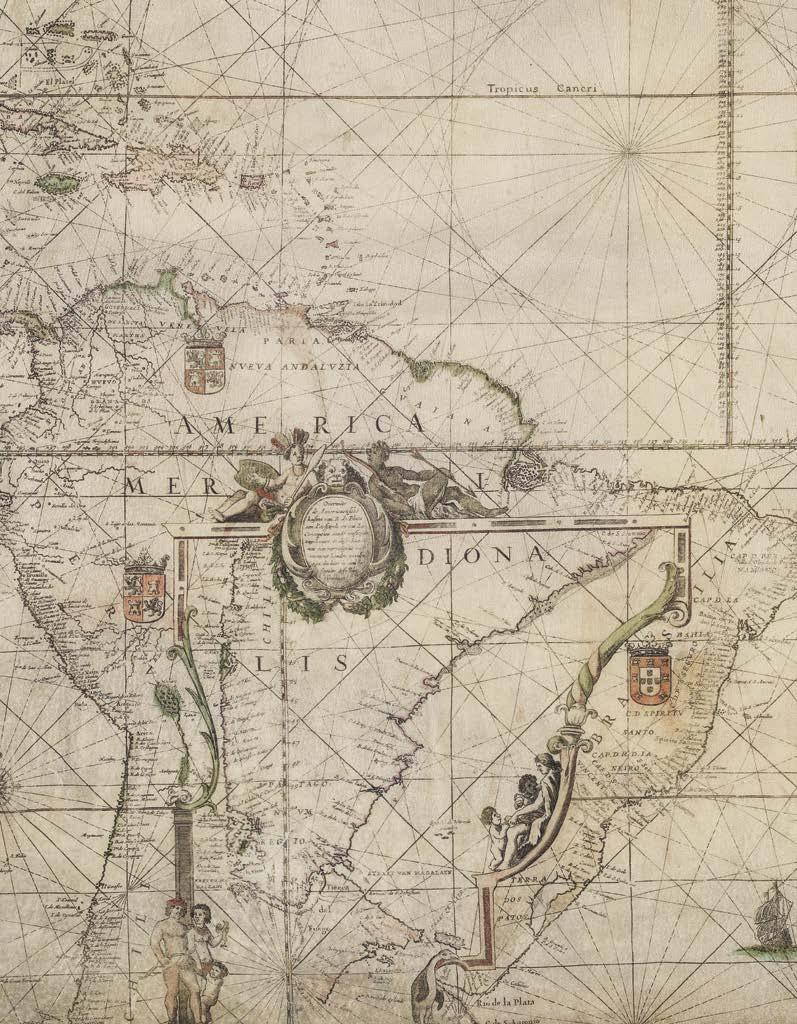
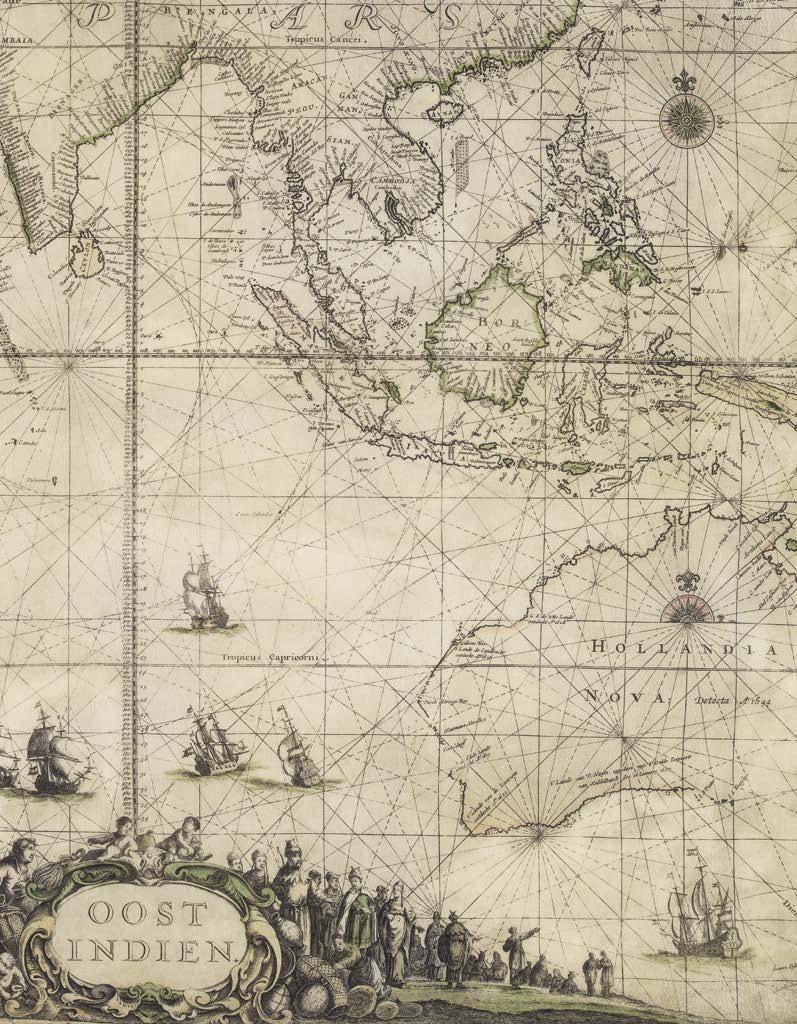
[The route to the East Indies - three sea charts printed on vellum] [1] Wassende graade Paskaart vertonende alle de Zeekusten van Europa [; 2] West-Indische Paskaert waer in de graden de breedde over weder zyden vande middllyn wassende soo vergrooten, dat die geproportioneert syn tegen humne nevenstaende graden der lengde [; 3] Oost Indien.
Publication [1] T’ Amsterdam by Pieter Goos op t’water inde Vergulde Zee Spiegel [; 2] Beschreven door A. Jacobsz [; 3] T’ Amsterdam by Pieter Goos op het water inde Vergulde Zee Spiegel c1646-1665.
Description A set of three engraved maps, each printed on a single, large, vellum skin with fine original hand-colour, each chart with remnant mount perforations at sheet edges.
Dimensions (to neatline): 1. Europa - 695 by 876mm 2. West Indische - 710 by 887mm 3. Oost Indien - 686 by 853mm
References Destombes, Marcel and Gernez Désiré, ‘La West Indische Paskaert de Willem Jansz Bleau’ in ‘Un atlas nautique du XVI° siècle à la Bibliothèque royale de La Haye (Pays-Bas)’, Lisbon, 1961. Jonkers, A.R.T., ‘Parallel meridians: Diffusion and change in early modern oceanic reckoning, in Noord-Zuid in Oostindisch perspectief’, The Hague, 2005. Schilder, Günter and Kok, Hans, ‘Sailing across the World’s Oceans – History & Catalogue of Dutch Charts Printed on Vellum 1580-1725’, Koninklijke Brill NV, Leiden, 2019. Waters, D., ‘Art of navigation’, London, 1958. A previously unrecorded set of the first large-scale printed ‘Paskaerts’ to show the entirety of the route from Europe to the East Indies on Mercator’s projection - an apparently unique survival as a set. The set should be seen as both the acme of the navigational achievements of the Dutch Golden Age, and the pivot point signifying the Dutch East India Company’s (Vereenigde Oostindische Compagnie - VOC) acceptance of the dispersal of their hitherto arcane information into general commercial use. The ‘Oost Indien’,‘West Indische’, and ‘Europa’ plotting charts, on vellum, show, for the first time, the route to the East Indies in a uniform format, on Mercator’s projection, and with the prime meridian located on Tenerife. The ‘Oost Indien’ chart is also the first printed map to name all the seventeenth century Dutch discoveries in Australia. Produced at the height of the “Golden Age”, these charts present a rationalisation of the geographic discoveries and advances in navigation and cartography made by the Dutch over the preceding 60 years: from the foundation of the VOC in 1602; via Hendrik Brouwer’s 1611 route to Indonesia; the first landfall in Australia in 1616; the adoption of Mercator’s projection for trans-oceanic voyages; consensus on a prime meridian; and Tasman’s voyage of 1642-1644. Prior to their publication, much of this information would have been the secret preserve of the VOC’s monopoly.
The Spice Trade Nearly 2500 years ago, Arab traders told stories of the ferocious cinnamon bird, or cinnamologus. This weighty fowl made its nest from delicate cinnamon sticks, the traders said. One way to get the cinnamon was to bait the cinnamologus with large chunks of meat. The birds would fly down from their nests, snatch up the meat, and fly back. The precarious cinnamon nests would collapse when the bird returned laden with its catch. Then quick-witted traders could gather up the fallen cinnamon and take it to market. As enticing as the tale is, the fabled cinnamologus never existed. The story was most likely invented to ward off curious competitors from attempting to seek out the source of the spice. For many years, the ancient Greeks and Romans were fooled. It might seem odd that something as seemingly inconsequential as a spice – a food flavouring or something to burn and perfume the air – would need such jealous guarding with elaborate tall tales. But the world’s demand for spices grew throughout the Roman era and into the medieval period, defining economies from India to Europe. The result was a lasting change to people’s diets in Europe, which, with the arguable exception of the United Kingdom, became a lot less bland and monotonous. More important, in Europe, spices became another way to define what it meant


to be wealthy and powerful, which had a profound social, emotional and economic impact. As a result, the hunger for spices went well beyond their aromatic flavour; they became a new symbol of high social status. The demand for spices gave rise to some of the first truly international trade routes and shaped the structure of the world economy in a way that can still be felt today.
The Route to the East Indies For nearly one hundred years, after Vasco da Gama discovered a sea route to India in 1499, the Portuguese and the Spanish were dominant in the eastern and western hemispheres respectively. This dominance was aided by a policy of extreme cartographic secrecy by both crowns, and returning ships were required to surrender both their charts and information on any discoveries made: all charts were state property, and illegal use or copying was punishable by death. However, smuggling often took place, and piracy by both English and Dutch vessels meant that, eventually, the routes to both the “Old”, or East, and “New”, or West, Indies became available to northern Europe. Using this purloined information, the British East India Company (EIC) and Dutch Vereenigde Oostindische Compagnie (VOC) were established - in 1600 and 1602 respectively - to cash in on the lucrative trade in nutmeg, pepper, cinnamon, cloves, and other spices. These monopolistic giants continued the tradition of jealously guarding the secret charts that laid the path to the source of their immense wealth and power. Both organisations employed teams of chartmakers or hydrographers to record the most up-to-date navigational information for speedy distribution in order to obtain commercial advantage with the quickest routes to the most profitable markets. The principal vector for this information was the ‘Paskaert’.
Paskaerts The large format long-range plotting charts of the journey (or passage, hence ‘paskaerts’), were initially unique manuscript charts, amended and issued to their ships one at a time. However, as operations grew in size, printing became a convenience, either on paper or on vellum. Vellum charts were often preferred as they were more durable than paper and had the advantage that they could be repeatedly re-used for laying down tracks for each voyage. Unlike paper, a vellum sea chart could be wiped clean of the plotted tracks of each voyage after its completion, insuring a clean template for the next expedition. Further, vellum charts were easily rolled and kept in a metal tube. Paskaerts existed in a number of versions: the equal degree plane chart, the unequal degree plane chart, the spherical, and charts on Mercator-projection.
“Although already available after 1600, the Mercator charts with their ‘waxing degrees of latitude’ were little liked by sailors, who regarded them as ‘difficult’. Nonetheless, they were superior to equi-rectangular (plane) charts and more suitable to ocean voyages” (Kok and Schilder, p.94).
The West Indische Paskaert In c1630, Willem Blaeu, who was, himself, chief hydrographer to the VOC, published his ‘West Indische Paskaert’: “Blaeu’s West Indische Paskaert in Mercator-projection is a keystone in the cartography of the Atlantic ocean in the seventeenth century. In the title it says clearly that this chart was intended for navigating the areas of Africa and America where the Dutch West India Company’s monopoly applied. The South American continent is completed all the way down to Cape Horn by means of an inset chart” (Kok and Schilder). Campbell says that only “a few examples at most” of each state have survived. The title indicates that the Paskaert was designed to show the area chartered to the West India Company in 1621. Destombes and Gernez suggest that the lack of a privilege on the first state indicates that it was used exclusively by the company and not available to the general public. However, it would appear that the chart’s existence was no secret and, at some point after 1630, it was revealed to the wider public. Blaeu’s chart: “[the] earliest printed chart of the Atlantic… became immediately the standard chart for navigation to America and the Cape of Good Hope” (Waters). Destombes and Gernez further praise the ‘West Indische Paskaert’ as “an extremely interesting chart because it is one of the earliest engraved and printed to include latitude… this scientific and artistic document of the first order marks an important date in the history of nautical cartography and is one of the most important contributions that the Lowlands produced in the XVII century”. After Blaeu, no fewer than ten publishers brought out twenty one editions of the ‘West Indische Paskaert’, either by printing them from the same copper plate or from copies with the aid of new copper plates. Chief amongst these was Anthonie Jacobsz, author of the ‘West Indische Paskaert’ in the present set: “… it appears that among Blaeu’s followers, Anthonie Jacobsz. Should be especially mentioned. He was the only one who strived to improve this long range plotting chart, where possible, and the only one who produced original work” (Kok and Schilder). Determination of longitude at sea was not possible without a considerable margin of error until the mid-eighteenth century. One of the methods that was used instead was dead reckoning, from the last point of land sighted. Jacobsz improved Blaeu’s original by shifting the whole map eastwards one degree within the Canary Islands to move the

location of the prime meridian from Ferro to the sailor’s preferred landmark of the 3,718 metre peak of Pico de Teide on Tenerife, in order to facilitate dead reckoning. He also included an inset of Scotland and Ireland to assist with the northern navigation.
The final reveal – the Oost Indien Paskaert Despite the success of Blaeu’s chart and its successors, the VOC would keep the final piece of the puzzle – the navigation of the Indian Ocean and the all-important route to the East Indies – hidden from general release until sometime later. It was not, in fact, until c1658, that Pieter Goos, a private Amsterdam publisher, decided that the information initially restricted to VOC use only had entered the public realm to a sufficient degree that he felt emboldened to offer a printed chart of the Indian Ocean for general release. Goos’ ‘Oost Indien’ chart shows the VOC shipping lane outbound from Cape of Good Hope to Sunda Straits, and, for the first time, names all the Dutch discoveries in Australia, from the first landfall in 1616, to Abel Tasman’s voyage of 1642-1644. This chart, on its own, however, did not detail the entirety of the route to the East Indies. In order to complete the navigation, two further charts would be required – the aforementioned West Indische Paskaert, and, for the beginning of the voyage, a European chart to assist with the tricky navigation from the Dutch ports and out into the Atlantic.
A set of connected charts The potential demand for a uniform series of charts detailing the route to the East Indies was not missed by Pieter Goos and, in c1658, his intention to publish a chart of Europe on Mercator’s projection is recorded in a notorial agreement dated 17 July 1658. In this agreement, the publisher Gerrit van Ghoesbergen states his intention to produce a manuscript chart by Dirck Rembrantsz [van Nierop] with Pieter Goos. Having published both an East Indian Paskaert, and a European Paskaert, one might suspect that Pieter Goos would embark upon his own ‘West Indische Paskaert’ on Mercator’s projection. The survival of the present set of three charts, combined with a careful examination of both the format and composition of the charts suggests an alternative: Goos produced both his ‘Oost Indien’ and ‘Europa’ charts following on from, and as companions to, Anthonie Jacobsz’ version of the ‘West Indische Pascaert’. The evidence for this is fivefold: all three charts are landscape in format; all three charts are on Mercator’s projection; all three charts are printed from a single, large, copper plate of similar dimensions; all three charts take Tenerife, not Ferro as their prime meridian; and all three charts overlap geographically and allow navigation from one to the other.

Indeed, of the twenty one editions that follow Blaeu’s ‘West Indische Paskaert’, all bar Jacobsz’s chart are between 755 and 780mm tall, whereas Jacobsz’s chart is noticeably shorter at 700mm. The range of European Pascaerts by all other publishers, according to the dimensions given by Kok and Schilder, is between 605 and 710mm tall. Goos’s comparable chart on Mercator’s projection is here at the larger end of that range at 695mm, bringing it neatly into line with both Goos’s ‘Oost Indien’ at 710 by 870mm, and the ‘West Indische Pascaert’ at 700 by 880mm. These slightly tighter dimensions permitted the mapmaker to use slighter smaller skins, making sourcing of materials easier and cheaper, whilst, at the same time, retaining sufficient scale to plot a course. The idea for a uniform sequence of charts may well, of course, have been that of Anthonie Jacobsz himself, as he published two different ‘West Indische Paskaerts’; one in c1646, and a second – the present example – in c1650. The main differences between the two being a shift in the prime meridian, the inclusion of an inset of Scotland to facilitate navigation in the north, and a format that more closely matches that required for charts of Europe and the Indian Ocean. Jacobsz, however, died in 1650, and no record has, thus far, been discovered of his intention to publish the additional charts. Further, evidence that Goos issued the three charts as a set is provided by an advertorial included in Johannes van Keulen’s ‘De Groote Nieuwe Vermeerdere Zee-Atlas ofte Water-Werelt’ of 1688 that tells of four vellum charts that are now available from him and that these charts are printed from plates formerly in the possession of Goos. The survival of the present set suggests that Pieter Goos made the set available at some point after the publication of the first state of the ‘Oost Indien’ chart in 1658, and definitely by 1665 (the date of the ‘Oost Indien’ chart in the present set). Therefore, about sixty years after the foundation of the VOC, a uniform set of connected plotting charts on Mercator’s projection was finally available for purchase by boats heading East.
Description of the Individual Charts
The Chart of Europe The chart of Europe is separated in two parts at 61º North by a double longitude scale. The northern part is displaced relative to the southern part by c39º counting in the east. The main chart covers the area to the west of Ireland, still showing the Azores whilst Cyprus in the east is shown at the easternmost limit, retaining part of the Black Sea. In the north-south direction the main chart runs from southern Sweden down to the north coast of Africa. The secondary chart in the north is compressed by a factor of about three in order to ensure transfer of navigation to the ‘West-Indische Paskaert’. This has the convenient side-effect of making
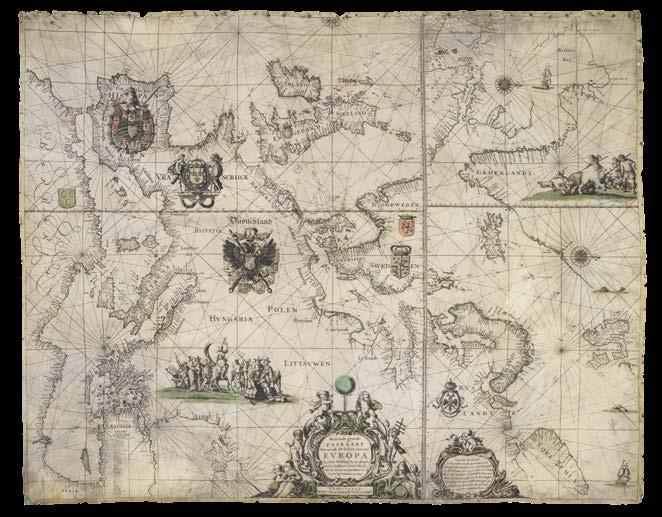
both parts of the map similar in dimension, and so permits both to be displayed on a single piece of vellum. This section covers the area from Buttons Bay in the west to just part Nova Zemlya in the east. The secondary chart is limited to the north by a line north of Spitzbergen, passing through mid-Greenland to the West. The chart may be dated from the notarial agreement between Gerrit van Ghoesbergen, Dirck Rembrantsz van Nierop, and Pieter Goos mentioned above. This agreement lays down a minimum price (2½ Guilders) for the product. A later state of the chart, published by Van Keulen, played a role in the quest for longitude. In 1687 the horologist Christiaan Huygens (1629-1695) was commissioned by the VOC to supervise an experiment with two of his pendulum clocks for the purpose of determining the correct longitude at sea. The ship ‘Alckmaar’ was dispatched to the Cape of Good Hope; on the outbound voyage the experiment failed because of mechanical problems with the clocks and because Thomas Helder, one of the pilots in the project died. Huygens used a then common chart for the southern part, but for the area north of 27º he relied on the present chart. According to Huygens’s report to the VOC, the experiment was successful in principle. The official report is on file in the National Archives in The Hague. Orientated with West to the top. The primary compass rose is located over the Öresund. Baffin Island is shown with a hypothetical northwestern coastline, as applies to the mainland coast opposite. The western part of Hudson Bay is labelled ‘Buttons Bay’. Novaya Zemlya is shown. Two large decorations are provided west of the Black Sea and in Greenland; the latter depicts a polar bear hunt, the former consists of an allegorical image figuring ‘Europe’ on a bull and a party of seventeenth century persons, using various tools, including a cross staff. Latitude scale on the southern part 30 degrees N - 61º20’ N, sub-divided per full degree and per two German miles. Longitude scale on the southern part: 000-057º 40’ minutes East.
The Chart of the Atlantic A scale of 0-150 German miles appears just south of the equator at 353 degrees east. A double latitude scale split at the equator, located in mid-ocean with German miles from the equator posted along the scale: 53º20’N37º10’S, sub-divided per degree, for 20º and two German miles. The dual longitude scale is provided along the equator from 270ºE to 040º30’E, sub-divided per degree and in 20’. The prime meridian runs over Tenerife.

With two inset maps; one in South America, showing the continuation of the continent down to Cape Horn. The other in the upper right, depicting northern England and Scotland on a scale different from that of the main chart. The South American inset has a dedicated latitude scale, centrally through South America, showing the continuation of the main scale down to 58º40’S, again in German miles along the scale. A longitude scale is not provided for this inset. The inset is ornamented at the lower left with a Patagonian family group, and its cartouche is flanked by a Native American with a shield and spear on the left, and an African figure bearing a bow and arrow on the right. The Scottish inset has a dedicated latitude scale from 53ºN to 62º40’N, and a dedicated longitude scale ranging from 0º-022E. In several countries coats of arms are displayed, including those of France, the Dutch Republic, England, and Spain on the north eastern seaboard of north America. Other decoration includes various ships, a sea monster at lower left and various animals dotted around the interior of Africa. The cartouche is decorated with the Lootsman family emblem – a sailor holding a lead and line, and the official coat of arms of the Dutch West India Company. The present chart is Jacobsz’s second ‘West Indische Paskaert’, and represents a considerable improvement on both Blaeu’s original, and Jacobsz’s first attempt. The required change in longitude provided the opportunity for a number of corrections. An inset was added to provide the capability for sailing north around Scotland, facilitating better use of prevailing winds and catering for problems of politics and piracy brought on by sailing too close to English harbours.
The Chart of the Indian Ocean The chart shows a practically complete outline for Australia, except for the East and Southeast coasts. Latitude scale in mid-ocean just east of Ceylon from 45ºN to 35ºS, subdivided in full degrees and 20’. The equivalent number of German miles from the equator is posted on its left. The latitude scale is continued at the very left in full degrees without German miles down to 46º20’S. A dial longitude scale is provided along the equator from 37º20’E to 166º20E, sub-divided in full degrees and in 20’. Careful comparison with the ‘West Indische Paskaert’ shows that the prime meridian runs through Tenerife. This detail seems to have been overlooked by previous bibliographers, who suggest that the prime meridian runs through Ferro, although Kok and Schilder are aware of some inaccuracy in this and state (incorrectly) that “[t]he prime meridian runs over Ferro in the Canary Islands, within the tolerance of longitudinal presentation”.
The chart is decorated with two large scenes at the top and the bottom, whilst a smaller one is situation at the left just above the equator. The interaction between the Europeans and Asian people is depicted with reference to trade in general.
New Holland: the Dutch Discoveries In 1602 the States General granted the newly-formed United East India Company (VOC) a monopoly of Dutch navigation in the vast area east of the Cape of Good Hope, and to the west of Estrecho de Magallanes: the combination of the Pacific and Indian Oceans. The Company immediately centred its operations on the Malay archipelago, and in a remarkably short time established a trading empire that extended from Southern Africa to East Asia. Voyages of exploration to seek out new commercial opportunities were an integral part of the Company’s activity, with the direction of voyages often determined by reports heard in the East, of countries and islands that offered great riches. This desire to open new trade led the merchants to undertake a number of voyages to the south land shortly to be named ‘Nova Hollandia’, but not all Dutch discoveries of its coasts reflect this conscious purpose. Much of the knowledge of its western and southern regions came from accidental discovery made as a consequence of masters following the VOCs instruction in 1616, that they use the ‘Brouwer route’ and sail one thousand German miles directly east after passing the Cape of Good Hope before turning north for Bantam, via the Sunda Straits. Given the prevailing difficulties in measuring longitude accurately, and, therefore, knowing the exact distance covered, this injunction led to a series of unintended sightings which played a part in the “unveiling” of the southern continent. The chart reflects the results of Dutch explorations in the 1640s, including those of François Jacobsz, Visscher, Abel Tasman, and Maerten Gerritsz. Vries. These comprise the improved depiction of the Gulf of Tonking, the additions in the area around Japan, and the results of the discoveries as manifest as the south coast of Australia, and those present at Australia’s north coast, in particular on the shores of the Gulf of Carpentaria. Just clear of the decorative cartouche, the islands of Amsterdam and St Paul may be seen, delineating the VOC shipping lane outbound from Cape of Good Hope to Sunda Straits. This, second, state of the chart includes the islands of Dina and Marseveen. These islands were discovered by the VOC ship Maarsseveen under the command of Barend Barendsz Lam during the spring of 1663. The islands are situated southeast of Cape of Good Hope and are currently named Marion Island and Prince Edward Island.
The Mapmakers
Anthonie Jacobsz (c1606-1650) Theunis or Anthonie Jacobsz was the founder of a flourishing printing and publishing house in Amsterdam. As there was more than one printer of the same name, he added the adjective “Lootsman” [pilot] to his, and his sons took this as their surname.
Pieter Goos (1616-1675) Son of the engraver, Abraham Goos (1590-1643). “He was one of the best known maritime booksellers of Amsterdam… [In] the imprint of his works, Pieter Goos is always mentioned as a bookseller, never as a bookprinter… The well-made pilot guides and the beautiful sea-atlas reflect a high professional standard. The many editions published over 25 years is an indication of the customers’ appreciation” (van der Krogt). He bought the copperplates of the famous guide book for sailors, ‘De Lichtende Columne ofte Zeespiegel’ (Amsterdam 1644, 1649, 1650), from Anthonie Jacobsz. There is some further evidence that the Jacobsz (Lootsman) and Goos family firms, despite being apparent competitors, cooperated on several occasions: the charts in a 1688 English edition of the Lootsman’s ‘Sea-Mirrour’ in the Maritime Museum, Rotterdam are all by Goos, and a notary act of 1680 survives signed by Caspar Lootsman and Hendrick Goos – Anthonie and Pieter’s sons – stating that they had made “since many years, a sea book of the Eastern, Western and Mediterranean Navigation called ‘Stiermans Zeespiegel’, ‘Lootsman’s Zeespiegel’, and ‘Nieuwe Groote Zeespiegel’ respectively” (Koeman 223). Goos published his own editions of this work in various languages, while adding his own maps. In 1666, he published his ‘De Zee-Atlas ofte Water-Weereld’, which is considered one of the best sea atlases of its time. Goos’s sea charts came to dominate the Dutch market until the 1680s.
Rarity We have been unable to trace any other set of the three charts, and the present examples have not been recorded previously. It appears that, until now, no bibliographer has made the connection between the shared format and prime meridian of the three charts, and the prospect that they were offered as a set. This prospect is re-enforced by the fact that there exists an advertisement for them (albeit in later states) in Johannes van Keulen’s ‘De Groote Nieuwe Vermeerdere Zee-Atlas ofte Water-Werelt’: “An advertorial included in Johannes van Keulen’s ‘De Groote Nieuwe Vermeerdere Zee-Atlas ofte Water-Werelt’ of 1688 reports that four vellum charts [the present three charts, and his plane chart of Europe] are now available from him and that these charts are printed

from plates formerly in the possession of Goos. Both the European plane and Mercator charts are mentioned expressis verbis to be amongst these four: ‘… als mede Europa Plat en Europa Wassende graden, door Dirk Rembrandtsz. Van Nierop’. This statement is repeated in the impressum cartouche centrally at the lower edge: ‘Seyn nu te Bekoomen by Johannes van Kuelen [!]…; the spelling errors are remarkable” (Kok and Schilder, p749).
Known individual examples of the three constituent charts are as follows:
Chart of Europe In their 2019 census of charts printed on vellum, Schilder & Kok identify only two examples of the present chart: 1. One on vellum in Amsterdam Universiteitsbibliotheek (OTM:HBKZL L.K. VI4) 2. An uncoloured example printed on paper in Paris, Bibliothèque nationale de France (Ge DD 2987 B(181))
Chart of the Atlantic Schilder & Kok identify four examples of Jacobsz’ second West Indische Paskaert chart: 1. Amsterdam Het Scheepvaartmuseum (S2680) 2. Den Haag, Nationaal Archief (4.AANW 00030) 3. Rotterdam, Maritiem Museum (N358) 4. New York, New York Historical Society (L4.4.14)
Chart of the Indian Ocean Schilder & Kok’s survey reveals seven recorded examples of Goos’ chart: three in the first state: 1. Amsterdam Universiteitsbibliotheek (OTM: HB-KZL L.K.VI.4) 2. Paris, Bibliothèque nationale de France (Ge 2987 [9670 B]), uncoloured and printed on paper 3. Sydney, State Library of New South Wales (Dixson Library Cc 67/1) And four examples of the second state, like the present example: 4. Greenwich, National Maritime Museum (250:1/2) 5. Paris, Bibliothèque de l’Institute de France (Ms 1288, nr 6) 6. London, Sotheby’s, Travel, Atlases, Maps, & Natural History, 2010, lot 67 (missing about 25% at top, sold for £205,250) 7. American Private Collection (Richard B. Arkway Inc. New York, Catalog 62 [2005], nr 1 – very damaged)

Longhi’s monumental and exceptionally rare doublehemisphere wall map of the world
5 LONGHI, Giuseppe; and Frederick de WIT, [after]
Nova Totius Terrarum Orbis Tabula.
Publication Bologna, Olim a Friderico de Wit in lucem primum edita , nunc vero nouis relationibus auctior atque correctior studio, et impensis losephi Longi Bononiae. Carolus Scottus, sculpsit, [c1675].
Description Large engraved wall map on 12 sheets, joined and mounted on archival paper, skilful facimile reinstatement to areas of loss to printed border at sheet edges. A full conservation report is available on request.
Dimensions 1258 by 1880mm (49.5 by 74 inches).
References Cesari, ‘New Evidence for the Date of Five Rare Dutch-Italian Wall Maps: F. de Wit’s World Map and W. J. Blaeu’s Four Continents’, Imago Mundi , 2012, Vol. 64, No. 1 (2012), pp. 41-59; Shirley cf 471. “One of the most active map printer-publishers in Bologna in the later seventeenth century. Longhi’s cartographical enterprise - the publication of ten large multi- sheet wall maps in a single decade - must stand as a unique achievement in Bologna’s publishing history” (Mariarosa Cesari). Impressively proportioned and beautifully decorated, Longhi has incorporated into the geography of his map important revisions that surpass the ambitions of its closest relatives. The map includes the addition of a tentative coastline of “Terra Jessi” between North America and Japan, incorporates the coastline of the large Antarctic continent, divides the large island in Hudson’s Bay into three, and adds the “Desertum Amo” (pocked to resemble sand) in northern China. In spite of these innovations, the imprint to Longhi’s map humbly acknowledges his debt to an earlier twelve-sheet map of the world, published by Frederick de Wit in 1660 – 1661: “Published for the first time by Frederick de Wit, now improved with the latest reports and further revised with accuracy, [and consigned to press] at the expense of Giuseppe Longhi in Bologna. Carlo Scotti engraved [it]”. In fact, Frederick de Wit’s (1630-1706) first world map, ‘Nova Totius Terrarum Orbis Tabula Auctore F. de Wit’ (1660), had been printed on a single sheet. This was followed soon afterwards by a large wall map, printed on twelve sheets, ‘Nova totius terrarum orbis tabula’ (c1661). It was this map that Longhi used as a model for his wall map of the world. In turn, de Wit had based his map on Joan Blaeu’s twenty-one sheet map of the world published in 1648. De Wit had apprenticed with the Blaeus when he moved to Amsterdam in 1648, and may well have worked on their monumental map. While clearly drawing on some aesthetic elements of de Wit’s map, Longhi made subtle and significant changes to the border that reflect cultural differences between the time and place of the maps’ separate origins. The combined effect is to give Longhi’s map a more scientific aspect: new detailed polar projections have been placed between the celestial hemispheres and the Copernican and Braheian hemispheres, in the lower border; most of the more fanciful elements of de Wit’s map, which included putti and garlands, have been replaced by scenes from the natural landscape of the nationalities that people the corners of the map; de Wit’s map was prominently dedicated, beneath his arms and portrait in a plinth on the map, to Prince Johann Maurits of Nassau-Siegen, in Longhi’s map this has been replaced by an armillary sphere.
Publication date Longhi issued his map without a date, however Cesari draws on circumstantial evidence to date the map after 1675, the year that Giovanni de’ Rossi issued a very similar twelve-sheet map in Rome. While the geography expressed is the same, there are significant differences to the border: the legend “Copernici Herronea Hipothesis” has been omitted from the Copernican


