12 minute read
What is the potential effect of trawling on current eelgrass carbon stocks?


4.1 Method
On sedimentary C-stocks built up in the eelgrass meadows
To assess the impact of trawling on current eelgrass C-stocks, we used the same GAM model as in question 1 (section 2) to predict the spatial variability of sediment C-stocks, with the difference that we now included trawling as a predictor variable together with the previously used environmental predictor variables. By doing so, we could assess if trawling has a significant impact on the spatial variability of sediment C-stocks while accounting for the effect of other environmental variables that we know can influence sediment C-stocks.
Trawling information on the available high-resolution presence-absence datasets (see section 3) was introduced in both models as a categorical variable with two possible levels: presence and absence of trawling. The coastal Cstock GAM model was also run with the integrated and scaled numerical trawling intensity (see section 3).
On eelgrass standing stocks and accumulation rates
To obtain a spatial layer with estimates of eelgrass standing biomass, we used the model described in Carstensen et al. (2016). This model was based on functional relationships that convert eelgrass cover into aboveground biomass, using site-specific information on light attenuation: where Bmax is a parameter describing the maximum attainable biomass at a given depth in August, I0/Isat is a parameter describing the relative amount of surface radiation where light reduces growth by 24%, and kc is another parameter describing how fast the relationship between biomass and cover levels off. For these parameters, we used the estimated values in Carstensen et al. (2016). The spatial layers fed to the formula were: the coefficient of light attenuation with depth (kd), water depth ( Z) and eelgrass cover ( C), for which we used the eelgrass coverage values obtained by the eelgrass habitat suitability model by Stæhr et al. (2019) and Timmermann et al. (2021)
To get the C-stocks associated to the standing biomass, the predicted eelgrass standing biomass was multiplied by 0.34, which is the average organic carbon content in eelgrass shoots in Denmark estimated with data from Leiva-Dueñas et al. (2023).
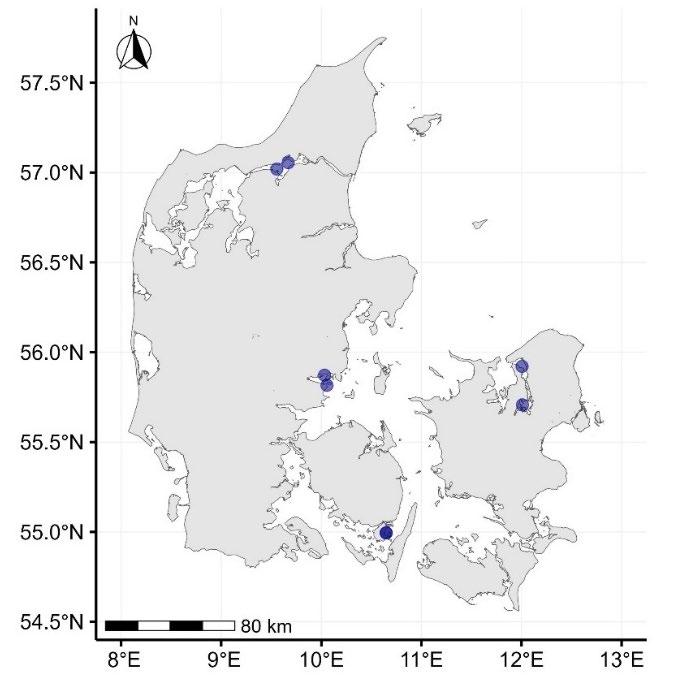
Figure 4.1. Spatial distribution of the eight eelgrass meadows where C accumulation rates were assessed and used to build the GAM aiming to model the spatial variability in C-accumulation rates.
To model the spatial variability in C-accumulation rates in eelgrass meadows, another GAM was built. The data used in this model came from only eight seagrass meadows (two in each of Nibe Bredning, Horsens Fjord, Southern Funen, and Roskilde Fjord) where C-accumulation rates had recently been measured by Leiva-Dueñas et al. (2023), providing detailed 210Pb analyses and C-accumulation rate calculations (Figure 4.1). Due to the very limited number of data points, a very simple approach was used to avoid over-parameterising the model. A total of ten candidate models were built using one predictor variable per model. The predictor variables considered were the same as those used for the eelgrass C-stock model. The model chosen, with the lowest AIC, was the one with wave relative exposure index as explanatory variable.
Eelgrass standing biomass and C-accumulation rates were predicted within the current potential eelgrass extent as delimited by the area modelled with at least 10% eelgrass cover (Staehr et al. 2019; Timmermann et al. 2021) within the coastal waterbodies.
Spatial information on trawling (presence-absence format and based on merged trawling high-resolution data from within coastal waterbodies and Natura 2000 areas) was transformed into a polygon vectorial layer and used as a mask to extract the values of C- stocks in aboveground eelgrass biomass and C-accumulation rates within the current potential areas of eelgrass affected by trawling. This approach assumes that the standing biomass and accumulation rates of eelgrass are completely lost due to trawling, which we believe is a realistic scenario. The total eelgrass biomass C-stocks and C-sediment accumulation flux impacted by trawling were calculated by multiplying the C-biomass stock or C-accumulation rate pixel value by pixel area and adding up the resulting C-mass.
4.2 Results
On sedimentary C-stocks built up in the eelgrass meadows Trawling did not have a significant impact on sediment C-stocks in either of the GAMs including trawling as a predictor variable. The coastal C-stock GAM showed no impact from trawling at all, not even a trend, on the overall sediment C-stocks, neither when using the numerical intensity trawling variable (p = 0.87) or its categorical presence-absence form (p = 0.65). The lack of significance of trawling on sediment C-stocks across coastal seabed sediments is in line with results from Epstein et al. (2022), who conducted a literature review and observed that 61% of the compiled studies directly investigating the impact of trawling on seabed C-stocks reported no significant effects, while 29% reported lower C-stocks and 10% higher C- stocks in trawled areas.
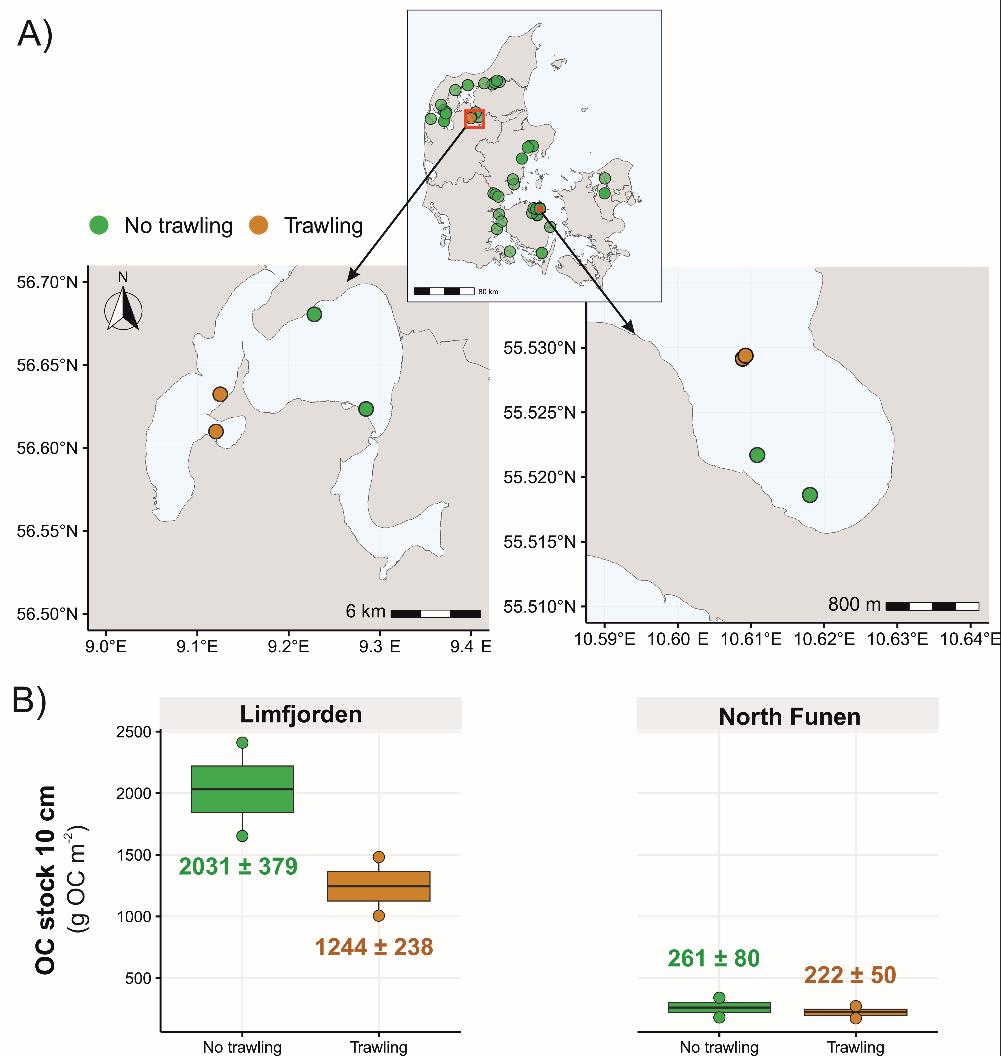
In the eelgrass C-stock GAM, trawled areas showed lower C-stocks, although not significantly so (p = 0.17). Out of the 48 data points, distributed across Denmark, used to train the eelgrass C-stock model, only four had direct trawling impact on top of them. The unbalanced number of sites within trawled and non-trawled zones may have prevented the model from showing a significant trawling impact on eelgrass sediment C-stocks. Even when comparing C-stocks at a local-scale (in fjords where trawling over eelgrass was recorded) there is no significant difference in C-stocks between trawled and nontrawled areas (two-way ANOVA with fjord and trawling, F-statistic of 2.44 and p-value for trawling of 0.179). Despite not being significant, results point to lower C-stocks in the trawled areas at a local-scale (Figure 4.2). These results should be interpreted with caution due to the small sample size, which may have prevented the detection of a significant difference
Previous studies on the impact of physical disturbance on the sediment Cstocks of seagrass meadows have shown inconsistent results. The variation appears to be linked to the degree of intensity of the disturbance. Small-spatial scale physical damage due to boat anchor damage (Macreadie et al., 2014) or traditional harvesting activities (Branco et al., 2018) did not exhibit detectable decreases in the superficial sediment C-content or C-stocks. However, more intense mechanical destruction over space and time by mooring activities, boat propeller scarring, and clam harvesting has significantly decreased the sediment C-stocks of seagrass meadows (Macreadie et al. 2015; Serrano et al. 2016; Arney et al. 2020; Román et al. 2022). Thus, the limited impact of trawling detected with our data could be attributed to a trawling activity limited in space and time over the Danish eelgrass meadows by the large trawling vessels included in our study. However, we cannot discard the possibility that the potential eelgrass area under trawling influence is underestimated due to large uncertainties in the available trawling data because of lack of inclusion of smaller vessels, lack of activation of the tracking systems during fishing (Petersen et al. 2020) or due to the short-time period covered by the trawling data (four years). Another point to consider is that the sediment C-stocks in soft coastal sediments might be subject to considerable horizontal redistribution due to resuspension by physical disturbance (e.g. hydrodynamics, bioturbation, trawling). In this way, trawling would contribute to blurring its own impact signal on C-stocks by causing resuspension and redistribution of sediment material.
Assuming that the non-significant impact of trawling identified by the eelgrass GAM model is probably due to insufficient trawling data and in order to proportionate a rough estimate of the C-stocks potentially lost due to trawling in eelgrass meadows, we used the eelgrass C-stock GAM, including the categorical trawling variable, to predict C-stocks in eelgrass sediments for the following two scenarios:
• No trawling over the potential eelgrass distribution.
Figure 4.2. A) Spatial distribution of all sediment cores obtained in eelgrass meadows for which C stocks down to 10 cm were estimated and used in the eelgrass C-stock GAM model, with a zoom in the two fjords where trawled and non-trawled areas occur over potential eelgrass meadows. B) Boxplot of C-stocks comparing trawled and non-trawled areas in each of the fjords where trawling and non-trawling areas occur together (left plot is in Limfjord and right plot in North Funen). Values over or under the boxplots indicate the average and standard error in C-stocks for each corresponding category.
• Trawling in areas where current trawling activity is recorded and overlaps with the potential eelgrass distribution.
In the trawled areas with potential eelgrass distribution, which covers about 204 km2, the mean C-stocks showed average values of 278 ± 213 g C m-2 when non-trawled as opposed to 185 ± 140 g C m-2 when trawled. The trawling impact according to GAM led to decreases in the sediment C-stocks of, on average, 34%. The total C-stocks for the two scenarios were computed to 792 (3522394) Gg C for the non-trawling scenario and 787 (350-2380) Gg C for the trawling scenario. The total stock difference between the scenarios, 6.3 (2-14) Gg C, could be considered a rough estimate of the cumulative disturbance of trawling in the top 10 cm of sediment C-stocks within Danish eelgrass meadows. The sediment C-stock that would be currently impacted by trawling is equivalent to a very low percentage (< 1%) of the total sediment C-stock modelled within areas with potential eelgrass distribution in coastal waterbodies.
On eelgrass standing stock
To assess how realistic the modelled eelgrass standing biomass values are, we compared the modelled values with measured field data in the literature. The modelled average eelgrass aboveground dry weight (DW) biomass, 80 ± 55 g DW m-2 (range 0.03-201), falls at the lower end of the range of measured biomasses in Danish Z. marina meadows, namely 52-830 g DW m-2 by Leiva-Dueñas et al. (2023), but corresponds well with the aboveground biomass values of 76-210 g DW m-2 observed also in Denmark by Röhr et al. (2016).
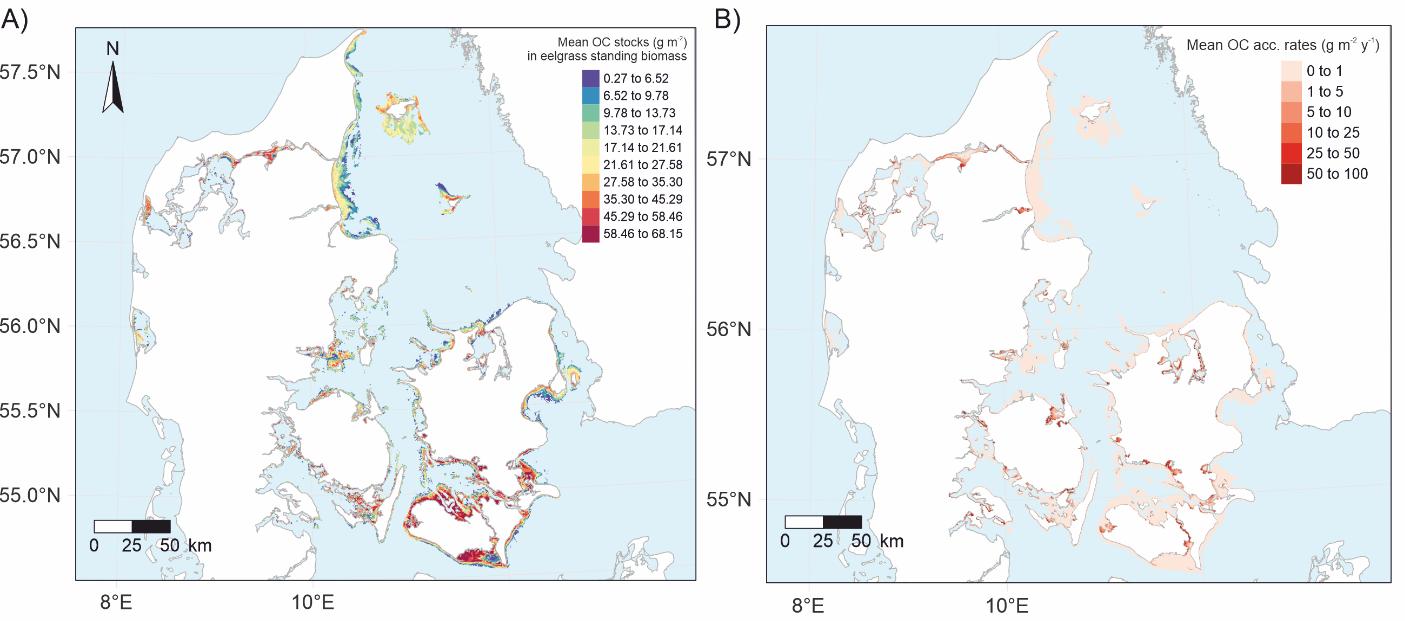
The C-stocks in eelgrass aboveground biomass show a similar spatial pattern to that of sediment C-stocks, with higher values in inner fjords and along the southern coasts of the islands of Funen and Zealand (Figure 4.2A). Out of these predicted C-stocks in eelgrass aboveground biomass, those likely affected and lost due to current trawling activity have an average value of 18.2 ± 13 g C m-2, with the total stock amounting to ca. 3.8 Gg C, which is equivalent to 2.4% of all the C-stocks in the eelgrass standing biomass modelled within potential meadows located inside coastal waterbodies.
On eelgrass carbon accumulation rates
As mentioned above, C-accumulation rates are only available for eight eelgrass meadows (Leiva-Dueñas et al., 2023), which have been upscaled to a coarse C-sequestration map for eelgrass meadows in Denmark based on the main identified driver of the spatial variability, which turned out to be the wave relative exposure (Leiva-Dueñas et al., in prep.). Therefore, the predicted C-accumulation rates are clearly higher in sheltered areas, i.e. inner fjords (Figure 4.3B). On this basis, the main area where trawling impacts wider zones with higher C- accumulation rates in potential eelgrass areas are in the southern areas of Limfjorden and in Horsens Fjord, and the overall impacted sediment C-accumulation rates across Denmark average 0.8 g C m-2 y1 (range from 0 to 309 g C m-2 y-1). The total sediment C flux currently impacted by trawling is around 0.35 (0-0.71) Gg C y-1, which is equivalent to 1.9% of the modelled total C-accumulation rate within potential meadows located inside coastal waterbodies.
What is the potential future effect of a trawling ban on eelgrass carbon stocks?
5.1 Method
On sedimentary C-stocks built up in the eelgrass meadows
To assess the impact of trawling on future eelgrass carbon stocks, we used the eelgrass C-stock GAM including categorical trawling information as a predictor variable together with the previously used environmental predictor variables to predict C stocks in eelgrass sediments for the following two scenarios:
• No trawling over the future potential eelgrass distribution.
• Trawling in the same areas where current trawling activity is recorded and overlaps with the future potential eelgrass distribution.
In both scenarios, the irradiance predictor variable used in the GAM was modified to account for an improvement in sea bottom irradiance levels according to a fulfillment of the WFD requirements. The future potential distribution of eelgrass is estimated using the Habitat Suitability Model (Stæhr et al. 2019) and considers the abovementioned improvement in water environment conditions. As before, the trawling data used in the model were categorical with two possible levels: presence or absence of trawling. The difference between the two scenarios in stocks per area and in the total stock integrated over the future potential eelgrass distribution gives a rough estimate of the amount of sediment C that could be affected by trawling in the future.
On eelgrass standing stocks and accumulation rates
To obtain a spatial layer with estimates of eelgrass standing biomass in a future situation, we again used the model already described in Carstensen et al. (2016), although this time we used two of the spatial layers with modifications:
• Eelgrass coverage values and potential distribution of eelgrass in a future scenario in which water conditions are improved as required by the WFD. The layer was obtained using the eelgrass habitat suitability model by Stæhr et al. (2019) and Timmermann et al. (2021)
• The “coefficient of light attenuation” spatial layer was systematically reduced by 22% relative to current values, which is the average improvement of light conditions needed to fulfil the WFD requirements for eelgrass depth limits (Timmermann et al. 2020).
To determine the C-stocks associated with the standing biomass, we followed the same approach as in question 3 (section 4).
The C-accumulation rate model used to predict the spatial variability in a future potential distribution of eelgrass was the same GAM as described in question 3 (section 4). Carbon accumulation rates were also predicted within the future potential eelgrass distribution as delimited by the area modelled with at least 10% eelgrass cover and within water basin boundaries.
Spatial information on trawling (presence-absence based on merged trawling data within waterbodies and Natura 2000 areas) was transformed into a polygon vectorial layer and used as a mask to extract the values of C-stocks in eelgrass aboveground biomass and C-accumulation rates in future eelgrass areas overlapped by current trawling activity. This approach assumes that eelgrass standing biomass and accumulation rates are completely lost due to trawling. The total eelgrass biomass C-stocks and sediment C-accumulation flux impacted by trawling were calculated by multiplying the pixel values of biomass C-stocks or C-accumulation rates by the area of the pixel and adding up the resulting Cmass.
5.2 Results
On sedimentary C-stocks built up in the eelgrass meadows
Over the trawled areas within the areas with potential distribution of eelgrass in the future, the mean C-stocks showed an average value of 82 ± 93 g C m-2 when not trawled and a decrease to 54 ± 61 g C m-2 when trawled. The total C-stocks for the two scenarios were 794 (356-2453) Gg C in the non-trawled scenario and 788 (352-2439) Gg C in the trawled scenario. The difference in total C stocks between the two scenarios, 7.6 (4-14) Gg C, can be considered a rough estimate of the cumulative disturbance of trawling, which may be avoided with a ban, in the top 10 cm of sediment C-stocks within Danish eelgrass meadows in the future scenario. Again, the sediment stock that would be impacted by trawling in a future situation equals a very low percentage (< 1%) of the total sediment C stocks modelled within areas with potential eelgrass distribution in coastal waterbodies.
On eelgrass standing stocks
The total C-stocks in the aboveground eelgrass biomass that could be recovered after a trawling ban is estimated to ca. 5.8 Gg C, which is equivalent to 3% of all the C stocks in eelgrass standing biomass modelled within future potential meadows located inside coastal waterbodies. Carbon stocks in eelgrass standing biomass per area basis showed an average value of 19.5 ± 13 g C m-2 with a spatial pattern that did not greatly differ from the current scenario except for the fact that the eelgrass area for which the values are predicted reaches deeper zones due to improved light conditions (Figure 5.1 A).
On eelgrass carbon accumulation
Because the relative exposure index was assumed to be similar to that in the current scenario, the highest predicted C-accumulation rates in a future scenario remain within sheltered areas (Figure 5.1 B). The main future areas where a trawling ban could benefit eelgrass C- accumulation rates are, still, in the south of Limfjorden and in Horsens Fjord but also in the inner southern areas of the Isefjord, with sediment C-accumulation rates averaging 1 g C m-2 y-1 (range from 0 to 310 g C m-2 y-1).
The total sediment C flux that could be recovered after a trawling ban is estimated to 0.73 (0-1.7) Gg C y-1, which is equivalent to 3.8% of the total C accumulation rate within future potential meadows located inside coastal waterbodies. Since we base the assessment on a scenario of fulfillment of the WFD with respect to eelgrass by 2027, the effect of a trawling ban on eelgrass meadows would lead to storage of approximately 2.18 (0-5.1) Gg C by 2030 (i.e. after three years of storage) and of 19.7 (0-46) Gg C by 2050 (i.e. after 23 years of storage). As reestablishment of eelgrass is a long-term process, the scenario should be seen as an upper limit.
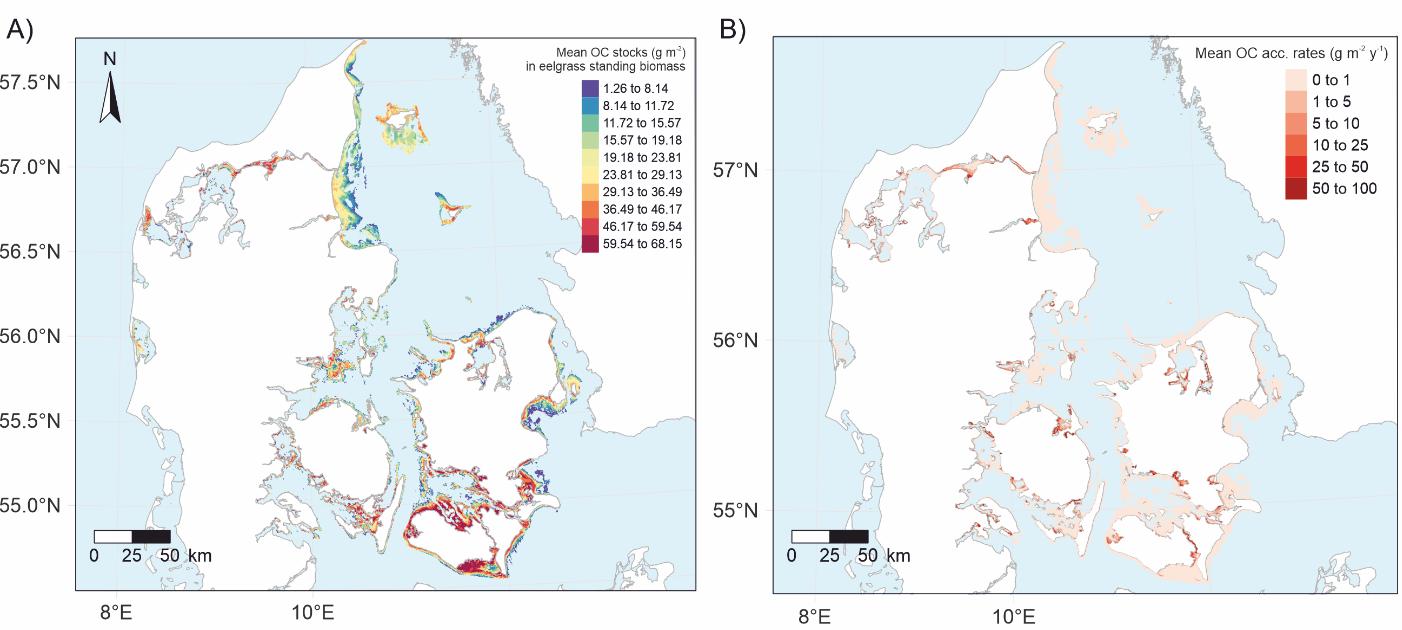
Figure 6 1. A) Temporal trends of Secchi depth and eelgrass depth limits in Nibe-Gjøl Bredning, Limfjorden over the period 19882021. Depth limits are represented by the deepest occurrence of single shoots (max depth limit) and the deepest occurrence of 10% eelgrass cover (main distribution limit). B) Temporal trends of mussel landings in Nibe-Gjøl Bredning over the same time period.


