19 minute read
The Data Scientist Magazine - Issue 3

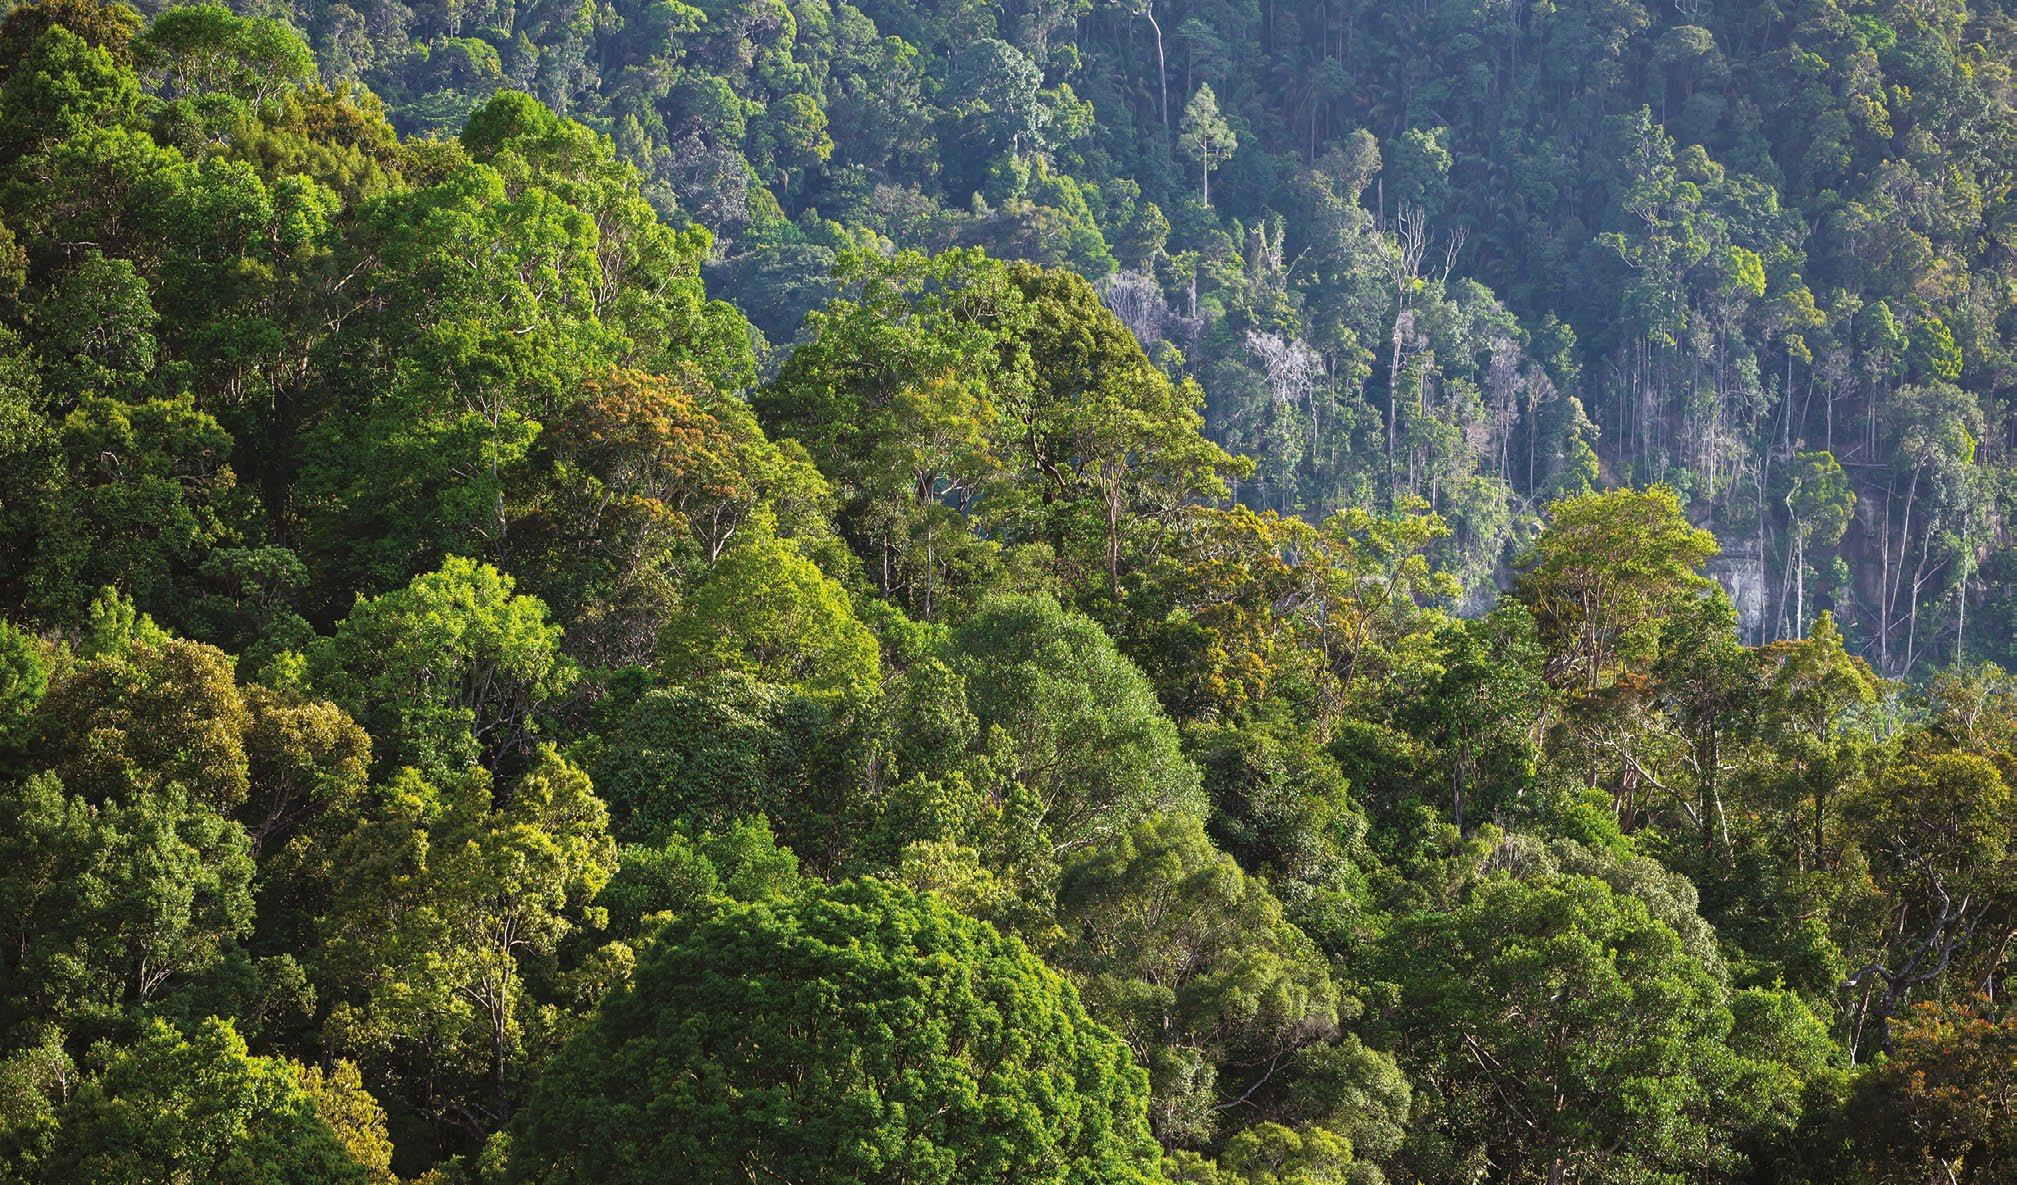
USING AI TO MAP FORESTS
IN PART 2 OF OUR INTERVIEW WITH HEIDI HURST, WE ONCE AGAIN LOOK AT THE RAPIDLY DEVELOPING FIELD OF SATELLITE IMAGING. In this issue, Heidi discusses her work at Pachama, where there is a key focus on using satellite imaging to help to tackle the complex problem of deforestation.
SATELLITE IMAGING
Heidi, can you tell us about what you’ve been up to over the past couple of years, because the field you’re in now is still satellite imaging but in a very different sector?
Of course. Around two years ago, I was working more on the defence and intelligence side of things, working on imagery analysis and machine learning to identify objects from satellite imagery. It was really interesting, and with a lot of open questions. Then, an opportunity arose to transition to working in climate tech and I was very excited to find that a lot of these same questions, around how we use satellite imagery and aerial imagery, are relevant in the world of climate as well. So, a lot of the same tools but a very, very different domain.
I transitioned to working at my current company, Pachama, in March of 2021. Pachama’s main aim is restoring nature to solve climate change: we verify carbon credits and sell them. There are a lot of claims about carbon credits that you may see online and in general. The purpose of a carbon credit is to offset an emission, for example, if I have a factory that belches out 100 tons of carbon dioxide or a carbon dioxide equivalent and I want to offset that.
Additional means that this wouldn’t have happened without the project being in place, and that’s where we find a lot of carbon projects fail - they’re in areas that would have been protected anyway or they would have regrown anyway. Traditionally verification is done through in-person measurements, which means that we send a team of guys into the forest with tape measures and wait for them to come back, which as you can imagine is a really expensive arduous time-consuming process. And there are two main consequences…
Firstly, it’s difficult to verify carbon projects, and therefore it isn’t done very frequently. And secondly, it means that it’s expensive, and because it is expensive, smaller landowners don’t have as much of an opportunity to participate. We do find that they fail from time to time and that’s why this technology is important, to give people confidence that these offsets are providing a real tangible climate benefit.
So, when you say that you sent teams into existing forests, the carbon offset is then a kind of a negative or a threat of deforestation that is being averted by providing some financial stimulation, or would it be the other way around - that there has been deforestation and it’s been reverted by planning new trees again?
Obviously, the best thing we can do for the climate rate is to reduce emissions entirely, but if we can’t do that, we can offset them, and there are a number of different ways of doing that. One way is through naturebased solutions, so either regrowing or preserving forests. However, there are a lot of difficult technical challenges in doing that. We want to make sure that when people say, “I emitted one ton of carbon, have you captured one ton of carbon?”, that the maths really adds up. You can imagine, given how wild some of these forests are, that quantifying this is non-trivial.
So, before I go too deep into that rabbit hole, that’s the overview and that’s how satellite imagery can be used.
Heidi, you mentioned that you’re verifying this carbon offset… what’s your experience with that? Are there many times when the verification fails or most of the time, it actually can be verified, it’s legitimate?
It really depends on the project. There are a number of pillars that we look for when verifying the offsets. One is, are the offsets real? Secondly, are they additional?
There are a number of different types of carbon projects. There are ones that are called ‘Avoided deforestation project’ and they are basically saying that “we think someone’s going to cut this down, but if we get in there and protect it, they won’t”. So that’s one category. Then there are ‘Reforestation projects... these are basically saying that “this area has been deforested, we’re going to plant it, monitor the trees, make sure they grow back and that will capture carbon”. And then there are also projects that are a little bit more nuanced called ‘Improved forestry management’, that improve the amount of carbon that a forest can hold, but they’re not quite as clear-cut as either don’t cut them down or we’re going to regrow them. Basically, they are somewhere in the middle.
Any landowner with a forest can make claims that there will be plans of cutting something down and then to try to make money from it. Is this a scenario that you have to deal with?
Yes, it is. It is something that we see in the broader market.
The most useful tool in understanding the value of a carbon credit is something called a ‘baseline’, and this is counterfactual as it’s what would have happened
Carbon credits are, in general, issued based on the difference between what the project developer says is happening versus what they say would have happened anyway - the difference between what the project did and what would have happened without it.
anyway. Carbon credits are, in general, issued based on the difference between what the project developer says is happening versus what they say would have happened anyway - the difference between what the project did and what would have happened without it.
The reliability of this baseline is incredibly important, because if someone comes in with a project and they say, “everything would have been deforested without me”, that puts them in a position to gain quite a lot of carbon credits if that’s true. So, a lot of our work and our research at Pachama is around understanding different baseline methodologies and ensuring that the projects that we evaluate have a reasonable baseline.
That makes a lot of sense. Can you give us a rough number, in your experience, of how many of these projects are reforestation versus deforestation projects?
In my experience, I would say there’s a lot of both. Certainly, I would say that reforestation projects are flashier and something that we’re seeing a lot of market demand for because they’re very easy to understand and provide a very compelling narrative for clients who do need verification because it turns out growing trees is really non-trivial. You have these small areas in plots of land that just don’t grow trees because of microenvironmental conditions. So, verification is still important to make sure that trees are growing and that they’re being planted in a way that gives them the chance for success.
Are there any alternatives to trees, other plants maybe? Why do trees hold so much carbon
compared to other plants?
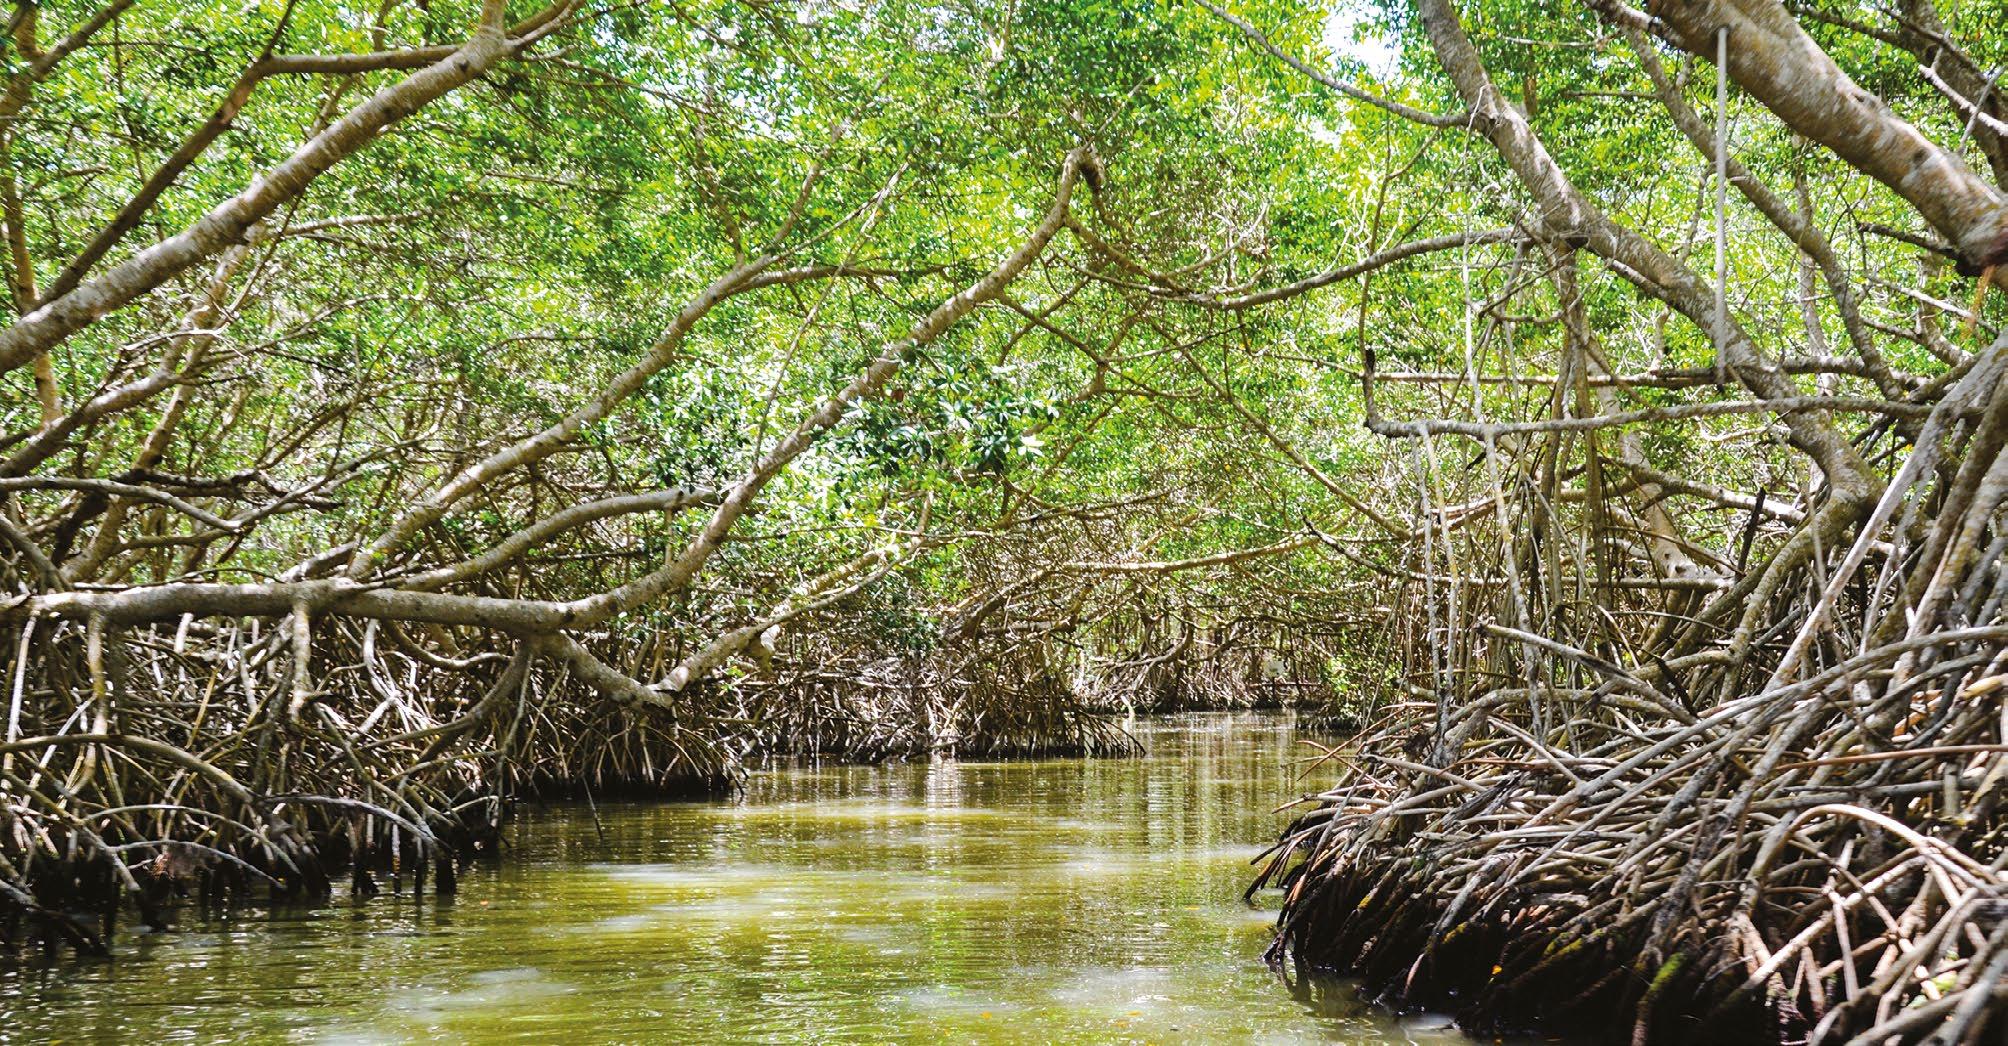
There are certainly a lot of other options, in particular, there’s a lot of interesting research going on around blue carbon which is a source of carbon that is based in the ocean. The likes of seagrasses, kelp forests, mangroves… those are harder to monitor frankly. It’s very difficult to monitor mangroves because a lot of the carbon that’s captured is underwater. So, from a remote sensing perspective we can’t see it in the satellite image and we can’t really get a lidar return on it. It’s very difficult to monitor.
Trees are great at storing carbon. They’re just a stellar version. They also offer a relative amount of permanence. So, when we’re saying, “we want to offtake carbon”, we don’t want to offtake it for five minutes and spit it back out again. That’s not providing a tangible kind of benefit. Preferably, we want this carbon to be stored for a really long time. If you think about the lifespan of some of these organisms, there are trees that have been around for hundreds of years in the Americas, which is incredible. That carbon is being captured and embodied for a very long time in comparison to shrubs for example, which don’t last that long.
And how do you use satellite imagery for this?
We use satellite imagery in combination with a couple of other data sources, mostly lidar, to estimate the amount of biomass in a given area. The idea being that if we can estimate biomass at several different points in time, we can see how the biomass, and therefore the captured carbon, has changed - and we can use that to evaluate the validity.
In general, that’s using a lot of multispectral
imagery… things like Landsat, or imagery from private satellite constellations to train neural networks to estimate the amount of biomass available. That requires a lot of training data from what are called field plots, which are field estimates of people who have gone in with tape measures and measured trees and figured out the amount of carbon. This is a difficult and important dataset. Field plots are the gold standard estimate of how much biomass and therefore how much embodied carbon is stored by an area of forest. A field plot is a forestry inventory that needs to be taken on the ground by teams that go in and measure the diameter of a tree, the height of a tree, and other forestry characteristics. We then use that to estimate the amount of carbon stored in the trees in that area.
So, that’s the core training dataset that we use in combination with remote sense imagery and then also lidar to develop these models.
And what are these neural networks trained to predict?
A lot of this work is still being developed. So, in some cases we’re training it to estimate canopy height. If we can estimate canopy height, that can be a useful proxy for biomass. In some cases, we have tried to estimate biomass directly. There are a lot of different components to understand these models, and sometimes canopy height can be an input into a larger model. So, maybe we try and extract canopy height from imagery and then use some of the hyperspectral bands that get us into chlorophyll, for example, to sense how green something is, and use that as a proxy for how much vegetation there is.
There are a lot of different things that we’re trying to train for.
So, does the foliage play a major role in storing the carbon?
No, the foliage doesn’t play a huge role in the carbon capture. Most of the carbon is either captured in the body of the tree and the wood, or in its root systems. Depending on the type of tree, it’s usually broken into above ground biomass and below ground biomass. So, a lot of carbon can be stored in the root and the root system. That doesn’t even begin to touch the carbon that can be stored in the soil, which is not something that we work on estimating and is a separate, very difficult problem.
To be a little bit more specific, often what we’re looking at estimating is the above ground biomass portion. Leaves can be a useful indicator of where there’s a tree and so, it’s not so much that the leaves
themselves are where the carbon is being stored but rather that the leaves are a good way to identify highlywooded areas.
There is a lot of really cool innovation going on right now in climate tech in general. There are start-ups that are trying to do direct air capture, so they literally just hoover CO2 right out of the air and bury it underground or compress it, or use it for other sources. There are also a lot of cool sort of manmade initiatives. Trees are like the original, they’ve evolved for thousands of millennia to do exactly this. So, they’re such a great tool in the fight against extreme climate change.
We talked about basically measuring the capacity of existing forests - how about areas where deforestation already took place, do you use satellite imagery also for that?
Yes, we do. Areas where deforestation has already taken place where you’re initiating a reforestation project come with a different set of challenges. One of the challenges is that, depending on the dataset you are using, trees are really small from space if they’re babies. So, if you’re looking at a fully grown forest, if you’re looking at a really dense rainforest, you can see that from space. If you’re looking at twigs in a field that you’re hoping will become trees, you can’t really see that.
So, in the earlier stages of reforestation projects, we rely much more heavily on either field crews or local airborne imagery, because spaceborne imagery just doesn’t have the resolution to pick up on some of those things.
You mentioned a third type of carbon capture, increasing the carbon density of existing forests. Can you explain how that works?
These projects are called IFM or Improved Forestry Management. Basically, these focus on supporting whoever owns the forest and helping them to manage the forest in a better way, a way that allows it to capture more carbon without sacrificing some of the objectives of whoever owns it.
One example… in some particular forests, there has been some really compelling pieces of research showing that most of the carbon or a good chunk of the carbon is contained in relatively few trees. So, the older grizzlier, gnarlier trees that have been around for a long time hold much more carbon than some of the younger trees. So if
There’s a lot of interesting research going on around blue carbon which is a source of carbon that is based in the ocean
you are holding an IFM project, perhaps one way of making sure that you contain as much carbon as possible is by only removing younger trees or by creating opportunities for larger trees to continue to grow.
That’s one example, there are many more.
There’s more carbon in the atmosphere to make plants grow faster, isn’t that helping with reforestation?
That’s a great question.
We are seeing some instances of what’s called ‘global greening’, so things are, overall, more green. But I think the difficulty is that it’s not just about more carbon. We’re seeing these broader weather systems at play and so we’re seeing desertification happening. We’re seeing human-induced destruction of the Amazon rainforest. And so, I think there’s a lot of complex things happening beyond just additional carbon dioxide in the atmosphere.
So, when you work with this kind of data, what is the biggest challenge that you’re facing? Well, it’s a lot of data. I think this is a challenge that anybody who works with satellite imagery faces. So, there is a lot of data - and you need to be able to process it. A lot of the challenges in the technology are similar, and so the data is large and you need a lot of it, and you need high resolution data for certain things.
So, when I was looking at aircraft previously, if you want to be able to differentiate different types of aircraft you need higher resolution. And similarly, if you care about delineating tree crowns for example, you’re going to need high resolution imagery. Those are similar challenges.
Another challenge is co-registration of different
pieces of information. If you have satellite imagery, lidar, and field plots - and you’re trying to make use of those altogether, you need to make sure that they’re aligned properly. This can be very challenging. If you have a field plot, even one that has the latitude and longitude of every tree, it’s very difficult to get a reliable GPS signal under a dense forest canopy, and so making sure that those pieces of data are all properly aligned so that your models are meaningful is a kind of a non-trivial challenge at times.
And can you give us a sense of the scale of the data that you feed into a model when you’re training it, and maybe also for the scale of the neural network that you are using?
With regards to the scale of the data, recently, one of my colleagues has been developing a model in Brazil. It’s a country that contains a lot of the world’s rainforest, and people talk about the Amazon as the lungs. That was around 10 terabytes of data, at a relatively low resolution, and that’s just for the optical data. That doesn’t include any of the lidar or hyperspectral stuff.
When I first started working at Pachama, I was all ready to build all the models, realised we didn’t have all the data pipelines and have gone further and further into the backend pipelines…
On the modelling side, are you still experimenting and trying to find the right approach?
Yes, definitely. I think that it’s an area of active research in the private sector, Pachama, and also within the academic community at large. I expect that we’ll continue to see, as new sensors come on, more and more
different approaches proliferating.
From this huge amount of input data, what are the most important sources of input? You mentioned measurements in the field, satellite imagery and basically data in different types of the spectrum… what is the most important, does the visible spectrum play a role at all or are there other parts that are more important?
Yes, the visible spectrum does play a role. But I think in general, multispectral is something that we pull from. Simple things, like the Normalised Density Vegetation Index or NDVI is composed from just the eight multispectral bands from Landsat, of which I think it uses four.
What does multispectral mean, is it infrared, or UV or is it even further away from visible light?
It will be infrared and UV, yes, and the only distinction that we make at least between multispectral and hyperspectral is something like Landsat would be considered multispectral. You’ve got eight bands, three of which are in the visible spectrum. Whereas hyperspectral, you have hundreds of bands or much more narrow wavelengths. So, at present we’ve only been using multispectral imaging.
And do weather obstructions play a role? I would imagine if you look at a forest from above with a lot of fog or clouds and things that can happen, maybe there’s no daylight.
Correct. Weather obstructions are a huge pain point because a lot of the areas that we’re trying to monitor right now are in dense rainforests, and there’s dense rain there all the time and it makes data collection really challenging. If you want to get a cloud-free image your options sometimes are very limited and in some cases, we can’t find a single cloud-free image because these areas receive such dense rain.
So yes, it’s a huge challenge. Occasionally we collect our own data from airborne sources and sometimes the people that we work with in Brazil will say “We can try flying again next month but, it’s going to rain forever.” Definitely, in these tropical environments, weather obstructions can be a huge challenge.
Is the humidity or the probability for rain related to the vegetation maybe? Could that be even used in a positive way?
That’s a good question, because we do see areas that have been deforested experiencing a sense of desertification, because in addition to the carbon storage benefits, trees provide a huge benefit for the landscape as a home for a wide range of animals, but also they hold on to soil, they improve broader drainage quality.
So, I don’t know. I’ll run that by the team and see if anybody can think of anything. That’s a great question though.
For trying to solve this problem basically of verifying carbon capture technologies, what do you think is the impact that machine learning has on this? Would this be something that would possibly be without it or is the use of data and machine learning a massive improvement in this area?
Our hope, and the premise on which Pachama was founded, is that machine learning is going to be a huge force-multiplier in this space . As I said before, previously the industry standard for carbon verification was sending people into the forest maybe once every five years. This is time consuming, costly, and prevents scaling. By using machine learning technologies, we can scale this to have more frequent updates of the state of different forests. So, we can provide higher quality, higher update data about projects which will in turn provide higher confidence in the value of these credits. And we can scale it up to larger areas, so you don’t have to be a big landowner to be incentivised to protect your forest or your land.
The hope is that it makes it faster, more reliable, cheaper, and more widely available.
Does the scalability of the approach completely depend then on data and evidence that you are developing at the moment?
Yes, absolutely, and that depends on biome. You can’t take a model that you trained in Brazil and try and run it in Sweden, it’s just not going to work. There are a lot of regional complexities that come into play.
What advancements, if any, have you seen in the last couple of years in the field of satellite imaging?
I think around two years ago, one of the things that I said was going to be really hot was small satellite constellations. And not to toot my own horn - but that was right! There have been so many small satellite constellations that have come up over the past two years.there were larger players like Planet and Digital Globe that we were already aware of, but also smaller players as well, and they ran different types of sensors. The more niche, smaller companies have really come to the fore.
I still think there’s a gap in capitalising on that data. Being a start-up in the hardware specific space and launching satellites with sensors on them is really challenging - so they haven’t taken off super rapidly. However, I do think there’s a lot of potential there.