
Contents lists available at ScienceDirect

Agriculture, Ecosystems and Environment
journal homepage: www.elsevier.com/locate/agee
Evaluating the impacts of alternative grazing management practices on soil carbon sequestration and soil health indicators
JungJin Kim a, b , Srinivasulu Ale a, * , Urs P. Kreuter c , W. Richard Teague a , Stephen J.
DelGrossod , Steven
L. Dowhowera Texas A&M AgriLife Research, P.O. Box 1658, Vernon, TX 76385, USA
a
b Institute of Environmental Technology, Seoul National University of Science & Technology, Seoul 01811, Republic of Korea
c Department of Ecology and Conservation Biology, Texas A&M University, College Station, TX 77843, USA
d Agricultural Research Service, US Department of Agriculture, Fort Collins, CO 80526, USA
ARTICLE INFO
Keywords:
Adaptive Multi-paddock grazing
Continuous grazing
Grazing land
Soil health indicators
Soil organic carbon
ABSTRACT
Globally, grazing lands represent a major carbon (C) sink. However, improper use of these ecosystems can degrade their soils and their C storage capacity. Specifically, prolonged high stocking rates in livestock production can result in significantly less soil organic carbon (SOC) and soil fertility in grazing lands. This underlines the need to assess key soil health indicators to determine the ecological efficacy of grazing management. The objective of this study was to identify the impacts of alternative grazing management practices, including heavy continuous (HC), light continuous (LC), and adaptive multi-paddock (AMP) grazing, on SOC and soil health indicators at the ranch and watershed scales in the Lower Prairie Dog Town Fork Red River Watershed in Northwest Texas. The stocking rate was the same under AMP and HC grazing, and it was reduced by half under LC grazing. The Soil and Water Assessment Tool-Carbon (SWAT-C) model was modified and used to conduct this assessment over a 40 year period (1979–2018), after a 900-year spin-up simulation (800 years under natural condition and 100 years under the HC grazing) to initiate the SOC pool. The simulated SOC was validated using observed data from several sampling locations. The study results indicated that when grazing management at the study ranch was changed from the current AMP grazing to hypothetical HC grazing, simulated average annual SOC decreased from 84 to 81.8 Mg/ha (a 2.6% decline). At the watershed-scale, when the grazing management was changed from the baseline HC grazing to AMP grazing, the simulated average annual SOC increased from 35.6 to 38.3 Mg/ha (a 7.5% increase). The net primary productivity (NPP), evapotranspiration (ET), biomass C, and soil nitrogen (N) increased, while C losses from runoff, and sediment loads decreased under AMP grazing. These results indicate that compared to HC, AMP grazing performed better with respect to SOC increase, and improvement of soil ecosystem and hydrological functions at both the ranch and watershed scales in the study watershed. Our findings suggest the need to shift from continuous to AMP grazing in order to improve soil health at multiple spatial scales.
Data availability statement: The data that support the findings of this study are available from the corresponding author upon reasonable request.
1. Introduction
Grazing lands are the earth’s most extensive land type category covering 40–54% of the terrestrial surface (without and with desserts, respectively) and 31% of the USA (Ajtay, 1979; Mitchell, 2000; International Livestock Research Institute (ILRI) et al., 2021). They provide many ecosystem services upon which human-wellbeing depends, including atmospheric carbon (C) sequestration; surface water capture
* Correspondence to: 11708 Highway 70 South, Vernon, TX 76385, USA.
E-mail addresses: sriniale@ag.tamu.edu, Srinivasulu.Ale@gmail.com (S. Ale).
https://doi.org/10.1016/j.agee.2022.108234
and filtration; nutrient cycling; soil formation; biological integrity and biodiversity support; wildlife habitat and forage supply; and provision of open space (Daily, 1997; Reid et al., 2005). Soil is a key component of the terrestrial C pool with soil organic carbon (SOC) being a source or a sink for atmospheric C (Smith et al., 2008). Given their extensiveness and higher C stocks in a given climate regime than other land cover types, grazing lands represent a potentially substantial C sink (Ajtay, 1979; Bai and Cotrufo, 2022; Penman et al., 2003). Soil organic matter
Received 30 August 2022; Received in revised form 16 October 2022; Accepted 18 October 2022
0167-8809/©2022ElsevierB.V.Allrightsreserved.
(SOM) is an indicator of the fertility, water retention capacity, and structure of a soil, including that of grazing lands (Tiessen et al., 1994; Lal, 2004) although some evidence is mixed (Minasny and McBratney, 2018). However, sequestration and storage of C in grazing lands are differentiated by climate, location in the landscape, and plant community type as well as land use (Milchunas and Lauenroth, 1993; Reeder and Schuman, 2002; Wu et al., 2003).
Importantly, herbivory by native and domestic grazers can also substantially affect SOC as well as nitrogen (N) cycling on grazing lands (Frank and Evans, 1997; Teague et al., 2016; Teague and Kreuter, 2021). While constant severe grazing pressure by livestock can lead to reductions in plant biomass, SOC, and soil N and other nutrients in grazing lands, intermittent concentrated grazing separated by adequately long plant recovery periods has been shown to have a reverse effect over time (Mosier et al., 2021; Teague and Kreuter, 2021). Adaptive Multi-Paddock (AMP) grazing has been developed as a conservation-oriented grazing management approach for improving the ecological function of grazed ecosystems by continuously adjusting the number of grazing animals and the duration of herbivory in response to changes in forage availability (Teague et al., 2013). To achieve this goal, AMP grazing employs multiple paddocks per herd to enable short grazing periods leaving sufficient post-herbivory plant residue for regrowth, and long recovery periods to accommodate seasonal variation in plant regrowth (Conant et al., 2003; Teague and Barnes, 2017; Teague and Kreuter, 2021). Several studies have evaluated the environmental benefits of AMP in comparison to heavy continuous (HC) grazing. Teague et al. (2011) found that, based on water conservation, restored soil health, and improved ecosystem services, AMP grazing was superior to HC grazing on nine neighboring commercial ranches in north Texas. Hillenbrand et al. (2019) similarly found that AMP grazing improved the water infiltration, forage biomass, and total soil C compared with the HC grazing in semiarid short-grass prairies in South Dakota shortgrass prairie. Using hydrological models, Park et al. (2017a, 2017b, 2017c) confirmed the effectiveness of long-term AMP grazing at the ranch and watershed scales in North Texas in terms of water balances, streamflow, and water quality. However, research to evaluate long-term SOC variations and soil health under alternative grazing management practices at watershed scales is lacking. This knowledge gap needs to be filled because soil C sequestration has a significant effect on the ecosystem services provided by grazing lands (Teague et al., 2021).
Comprehensive field measurements that capture spatial and temporal variation in SOC are expensive, time-consuming, and cannot characterize the full range of ecological and environmental conditions (Conant and Paustian, 2002; Kravchenko and Robertson, 2011). By contrast, when adequately informed by field observations, ecosystem-process-based models are a powerful tool to investigate the impacts of complex spatial and temporal variabilities of environmental conditions and management practices on greenhouse gas (GHG) emissions or SOC in diverse ecosystems. Various biogeochemical models are available for SOC simulation, including CENTURY (Parton et al., 1994), CArbon
Nitrogen-Dynamics (CANDY; Franko et al., 1995), Danish Simulation (DAISY; Hansen et al., 1991), DeNitrification–DeCompositon (DNDC; Li et al., 1994), Rothamsted organic carbon turnover (RothC; Coleman and Jenkinson, 1996), and Soil Organic Matter Model (SOMM; Chertov and Komarov, 1997). However, they are mostly landscape-scale models with limited simulation capacity at the watershed scale. Zhang et al. (2013) modified the popular watershed model, Soil and Water Assessment Tool (SWAT; Arnold et al., 1998) to assess C flux at the watershed-scale and named it as SWAT-C model. They developed this model by formulating a series of equations describing the addition, decomposition, transformation, and loss of SOM-residue through combining equations used in CENTURY (Parton et al., 1994, modified Environmental Policy Integrated Climate model (EPIC; Williams, 1990; Izaurralde et al., 2006, 2007), and Decision Support System for Agrotechnology Transfer (DSSAT; Jones et al., 2003, Gijsman et al., 2002) models. Several studies evaluated SWAT-C model for simulation of
carbon dioxide (CO2) fluxes at 16 eddy covariance flux towers (Yang and Zhang, 2016; Zhang et al., 2013) and long-term sediment and C losses (Zhang, 2018). However, thus far it has not been used to predict long-term trends of SOC and soil health indicators on grazing lands under alternative grazing management practices at the watershed scale.
The primary goal of this study was to assess C dynamics and soil health under alternative grazing management practices at the ranch and watershed scales. The specific objectives were to: 1) modify the SWAT-C model to simulate SOC and soil health parameters in the top 5 cm layer (instead of default top 1 cm layer) and develop an effective methodology to evaluate the watershed-scale impacts of HC, light continuous (LC), and AMP grazing, 2) evaluate the performance of the modified SWAT-C model in simulating SOC at the sampling locations, and 3) simulate and analyze long term (40 yr) results and characteristics of each grazing management practice on the SOC balances, soil health indicators and hydrological parameters on grazing lands. Our study results provide significant insights into the selection of appropriate grazing management practices in grazing land-dominated area of North Texas and elsewhere.
2. Materials and methods
2.1. Modified Soil and Water Assessment Tool
SWAT is a continuous, long-term, semi-distributed hydrological biophysical model. It simulates the impact of land use and management practices on hydrology, sediment load, and nutrient transport (Arnold et al., 1998). The SWAT-C model simulates addition, decomposition, transformation, and removal of residue in each SOM pool on the surface and in subsurface soil layers (Zhang et al., 2013). Depth of soil layers and soil texture, bulk density, and organic C content in each layer are adjustable input parameters depending on the soil properties at the location of interest.
SWAT-C divides the watershed into sub-watersheds connected by a stream network, which are further delineated by Hydrological Response Units (HRUs) consisting of relatively homogeneous land use, soil characteristics, and topography. Major hydrological variables (e.g., infiltration, surface runoff, evapotranspiration [ET], lateral flow, groundwater flow, or soil moisture redistribution and deep percolation) and SOC are simulated by SWAT-C model within each HRU (Arnold et al., 2012). The grazing component in SWAT-C simulates grazing impacts on SOM in all grazing land HRUs. Grazing parameters in SWAT-C include commencement of grazing during the year, length of the grazing period (GRZ_DDYS), amount of biomass removed (BIO_EAT), amount of manure deposited (MANURE_KG), type of manure deposited (MANURE_ID), and biomass harvest efficiency (HE), which is the percentage of total available forage that is consumed by grazing livestock. Additionally, minimum plant biomass for grazing (BIO_MIN) is specified to prevent over-simulation of plant biomass removal and soil erosion; when plant biomass reaches the assigned minimum value, the model will not allow grazing, trampling, or application of manure on grazing land HRUs (Neitsch et al., 2011). More detailed information on hydrological simulation and the grazing component of SWAT-C can be found in the technical documentation provided by Neitsch et al. (2011).
Soil depth is a primary factor affecting soil C and N biogeochemical processes due to the oxygen-dependent spatial separation of microorganisms and extracellular enzyme activity that affect microbial mineralization (Rumpel and Kogel-Knabner, 2011). Soil C stabilization with soil depth is affected by the interactions between soil organic matter and minerals (Mathieu et al., 2015). Even though the mineralization rate of soil C has a tendency to decrease in deeper soil, the decomposition rate does not always decrease with soil depth (Salom´ e et al., 2010) because soil organic matter is protected from microbial decomposition at deeper depths by spatially disconnecting substrates and enzymes. Soil depth classification should therefore be carefully considered to evaluate Soil C variation when the hydrologic model is implemented.
Several studies found that the impacts of grazing management on soil proprieties in rangeland were pronounced in the top 50 mm depth of the soil (Letaw et al., 1984; Whitehead, 1995; Berg, 1988; Bardgett et al., 1997). For example, Letaw et al. (1984) recommended 50 mm soil depth as appropriate for determining grazing management effects because it accurately reflects the depth where major changes in soil proprieties (e. g., soil C) take place. In addition, Bardgett et al. (1997) reported that microbial biomass and activity were the highest in the top 50 mm soil depth in the grassland. Therefore, we modified the SWAT-C algorithm by increasing the depth of the topsoil layer from 10 to 50 mm. The other soil layers were simulated based on soil profile information for the study area.
The modified source code was recompiled to predict grazing management effects on SOC, nutrients, and soil moisture in the topsoil. Our modified SWAT-C (mSWAT-C) simulation results provided SOC and soil health indicators (soil N [total N stock in the soil], plant available N [inorganic N in the soil that is available for plant use], biomass C, net primary productivity [NPP] and soil respiration, plant residue, and C loss from surface runoff and sediment load) for each grazing land HRU for efficiency analysis. While NPP is usually used as a vegetation indicator, it can also be used as an indicator of soil and ecosystem health as it is positively correlated with soil C input, soil nutirent diversity and reduction in surface runoff and soil erosion (Zhou et al., 2017; Chen et al., 2019; Taelman et al., 2016).
2.2. Study area
The Lower Prairie Dog Town Fork Red River Watershed was selected as the study area (Fig. 1). This grazing land-dominated watershed encompasses approximately 3,645 km2 of geographical area in northwest Texas. A USGS stream gauge exists within the watershed, and it has produced long-term observed streamflow and water quality data for model calibration and validation. Land cover and land use in the study watershed includes, 72.1% grazing lands, 21.7% agricultural land, 3.1% developed land, 1.9% barren, 1.1% forest, and 0.1% water bodies based on the 2016 Cropland Data Layer (CDL). The average elevation of the watershed is 727 m with about 3.3% average slope. Mean (1979–2018) summer and winter temperatures in this watershed are about 26.9 ◦ C and 5.1 ◦ C, respectively. Mean annual and summer precipitation is about 583.1 and 206 mm, respectively. Dominant soil types of this study area are fine sandy loam and loam. About 22.7%, 37.0%, 23.0%, and 17.3% of the watershed soils are as assigned to Hydrologic Soil Groups A (high infiltration rate), B (moderate infiltration rate), C (slow infiltration rate), and D (very slow infiltration rate), respectively.
The Montgomery Ranch, located within the study watershed was selected to obtain field data to validate the mSWAT-C model outputs (Fig. 1). This ranch was selected because the AMP grazing management has been adopted for several years, thereby overcoming prior grazing management legacy effects, while HC grazing is the common practice on adjacent ranches. To evaluate the model performance in simulating SOC under different grazing management, soil sampling data were collected from three locations within the study ranch (AMP grazing area), three
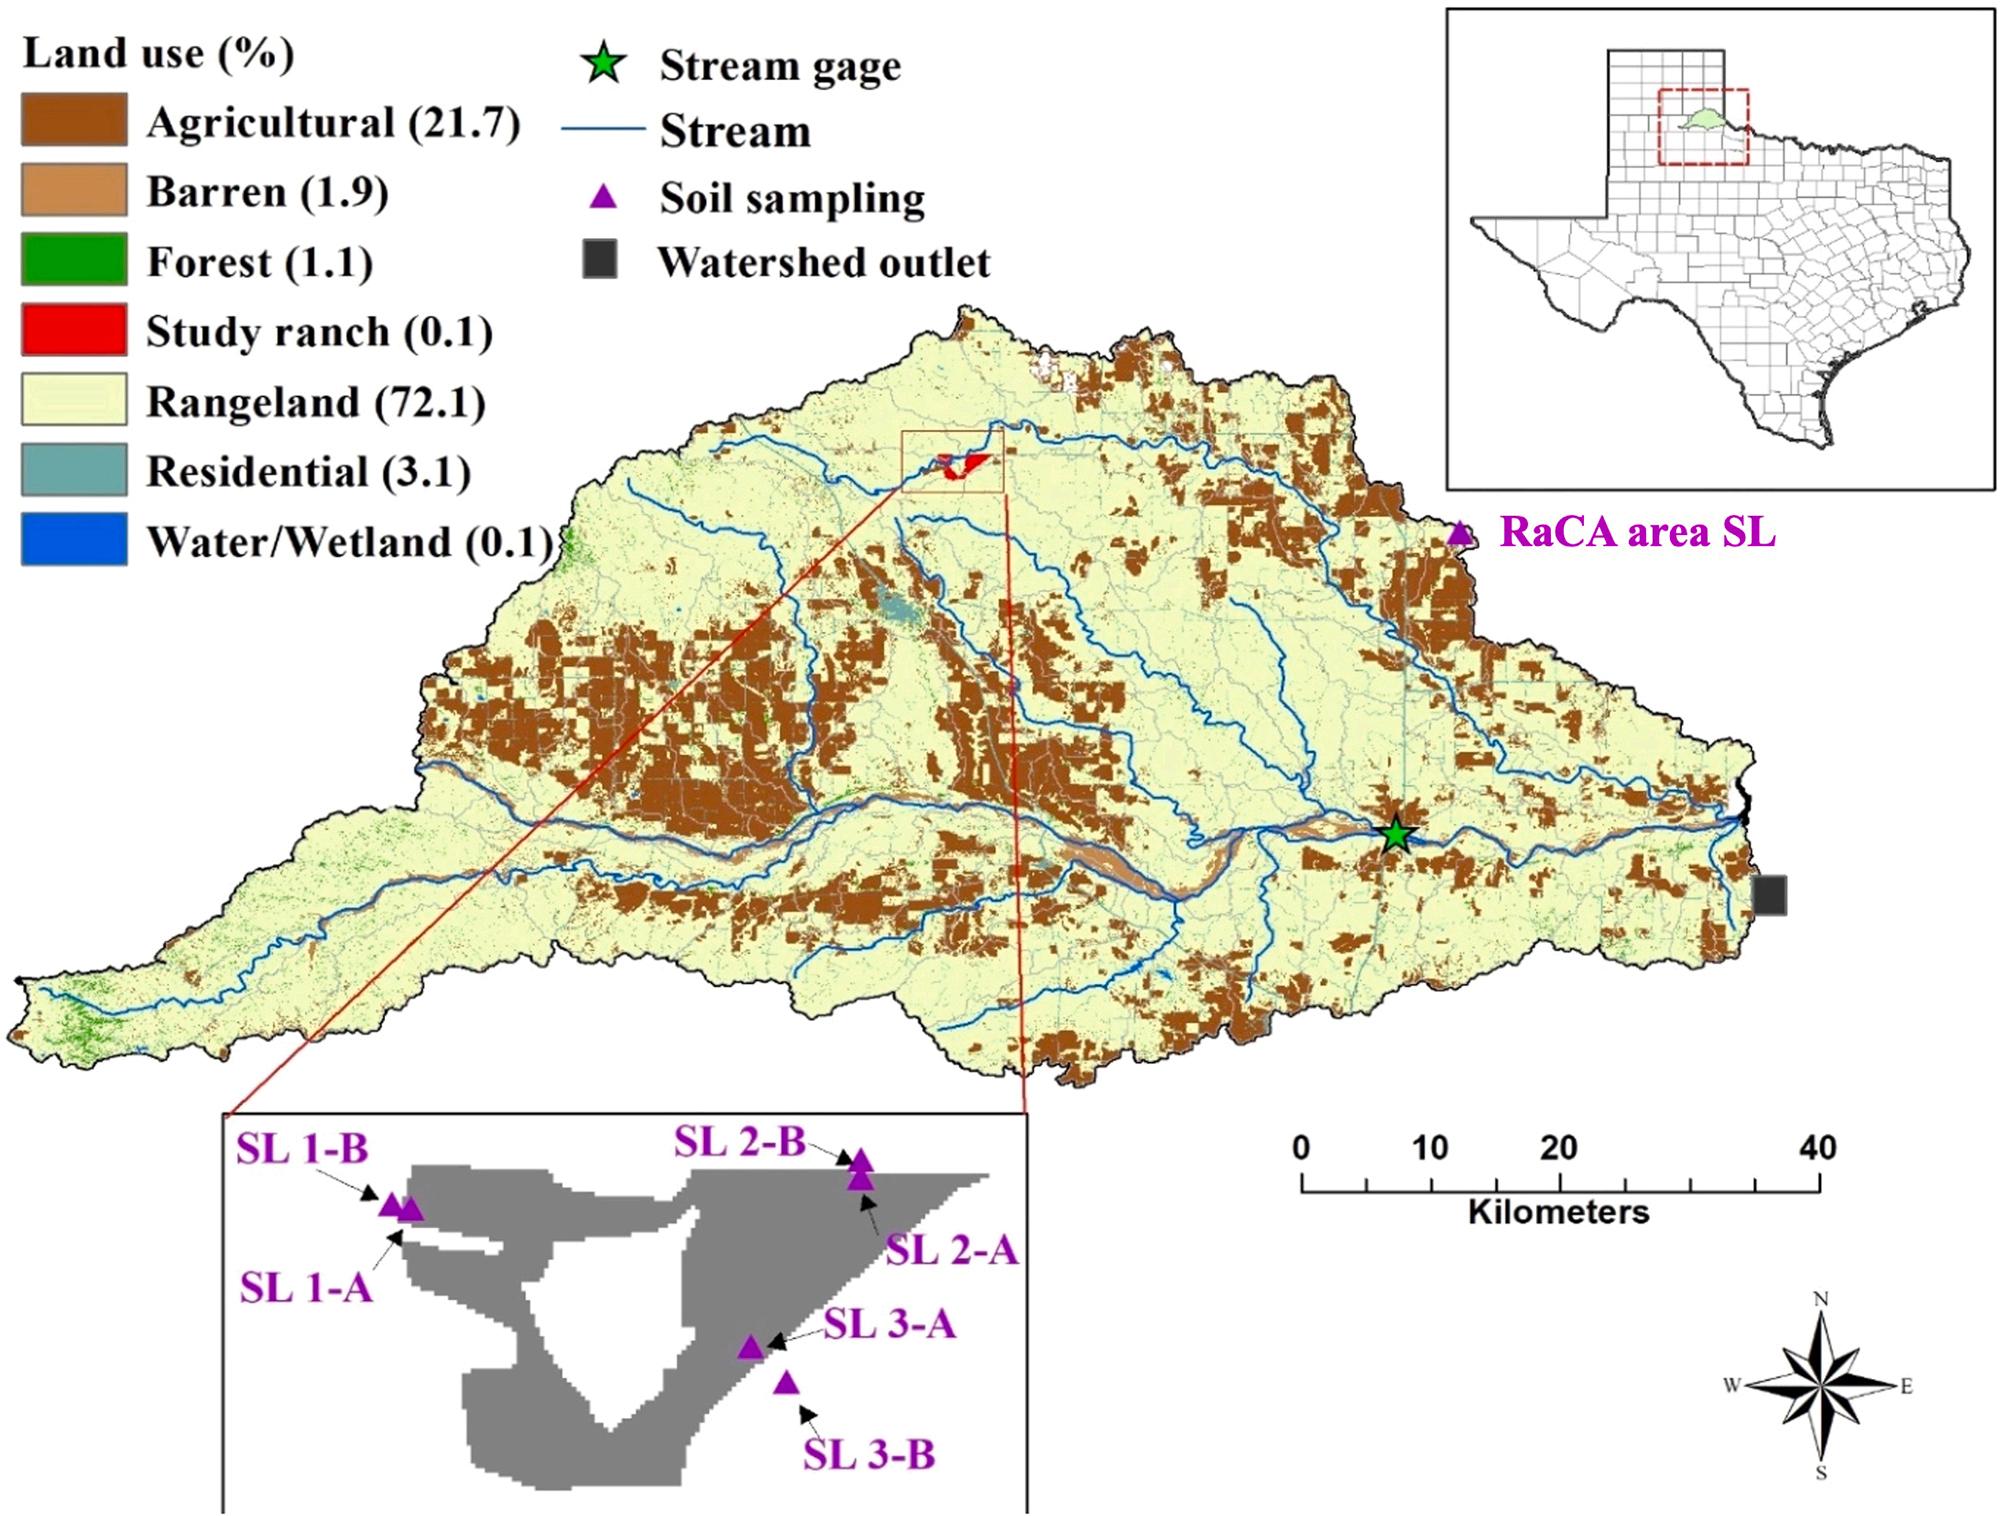
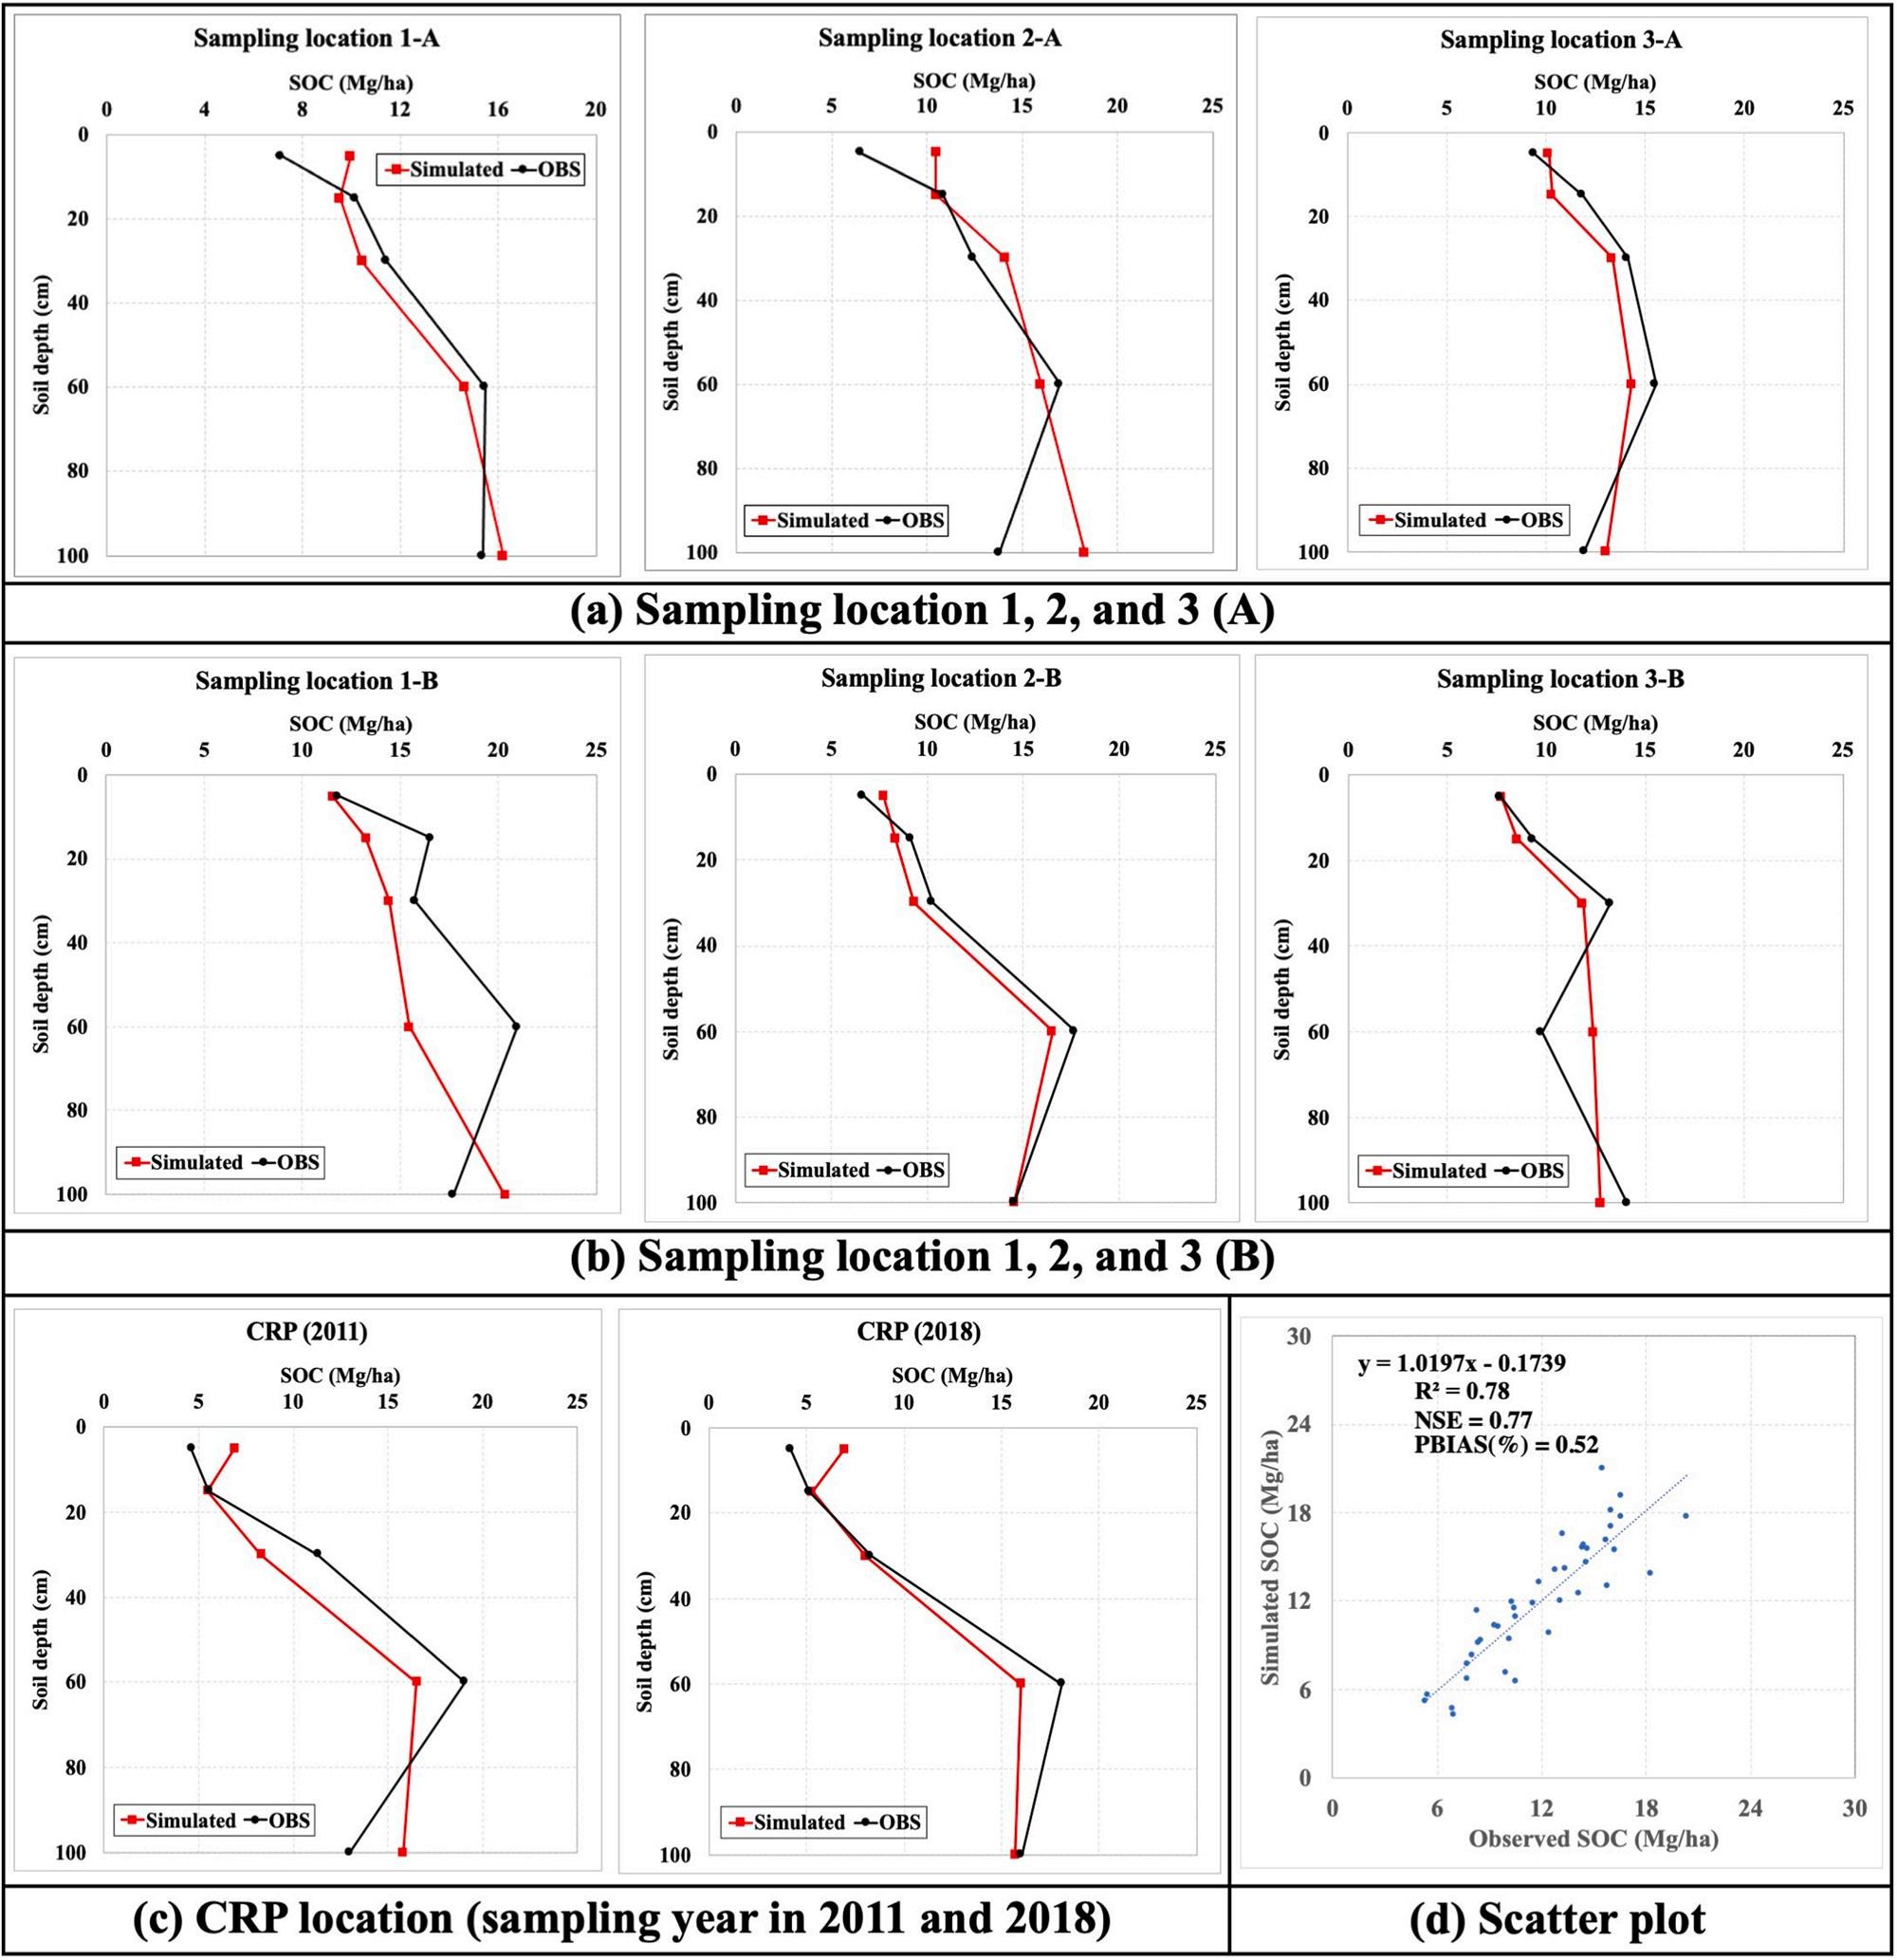
locations outside of the study ranch (HC grazing area), and one location in CRP (Conservation Reserve Program) land (no grazing area) (Fig. 1). Soils samples were obtained from six depths of the soil profile (0–5 cm, 5–15 cm, 15–30 cm, 30–60 cm, 60–100, 100–152 cm). Detailed information on the sampling sites is provided in Supplementary Materials Table S1 While calculating the measured SOC content, adjustments were made for bulk density of each depth of the soil profile.
2.3. Model setup and inputs
A 30 m resolution Digital Elevation Model (DEM) was obtained from the U.S. Geological Survey (USGS) and used to delineate the watershed and compute flow direction. The 30 m resolution 2016 CDL was downloaded from the U.S Department of Agriculture (USDA) National Agricultural Statistics Service (NASS) website and was used to classify 27 land cover types in the watershed. The USDA Soil Survey Geographic Database (SSURGO) was used to obtain the soil attributes for model inputs. The study ranch representing the pasture boundaries was then defined from high-resolution imagery by an on-screen digitization method using global positioning system (GPS) data based on the reconnaissance ranch surveys. The digitized maps of the study ranch created in this manner were merged into to 2016 CDL. To simulate the effects of alternative grazing management practices at the study ranch, individual paddocks were considered as HRUs. During the watershed delineation process, the study watershed was divided into 95 subwatersheds (consisting of 84 grazing land sub-watersheds and 11 study ranch sub-watersheds) with a total of 8,182 HRUs. Based on the 2016 agricultural census report (USDA-NASS 2016), HC grazing is the predominant grazing management practice in the watershed. Accordingly, we applied HC grazing management to all grazing lands as the baseline scenario, while the AMP grazing management was implemented in the study ranch. Soil physical and hydrological parameter values used in the mSWAT-C model are summarized in Table 1 Detailed explanation for the calculation of grazing parameter values is provided in Kim et al. (2022).
The mSWAT-C model requires precipitation, minimum and maximum temperature, wind speed, dew point, and solar radiation as primary input data. Daily precipitation and temperature data were obtained from the National Climatic Data Center for four stations within the study watershed (Memphis, Turkey, Wellington, Northfield) for the
model.
40-year period from January 1, 1979, through December 31, 2018. Missing data were interpolated per the heuristic gap filling method recommended by Kim and Ryu (2016). Wind speed, relative humidity, and solar radiation data were estimated using the WXGEN weather generator model (Sharpley and Williams, 1990). Given that daily streamflow data at the outlet of the study watershed were not available, we used data from USGS gauge 08051500 located within the watershed (Fig. 1). More detailed information about model calibration and validation processes for streamflow, crop yield, sediment, and nutrient loads are provided in the Supplemental Materials
2.4. Carbon pool initialization and evaluation
Initialization of C pools was required to determine soil C equilibrium for undisturbed vegetation conditions on grazing lands. Long-term spinup simulation was performed to initialize the C pools under two grazing land conditions. The mSWAT-C model was used to conduct an 800-year (1079–1878) spin-up simulation for the native prairie ecosystem, and then it was run for a 100-year period (1879–1978) under the HC grazing management to reflect the initial SOC state at the start of the grazing scenario operation. Initial SOC values were obtained from the National Resources Conservation Service’s Gridded SSURGO (gSSURGO) data. This is a 10-m resolution dataset that provides county level raster data about soil series and soil characteristics across the United States. These data can be easily integrated with data from the National Land Cover Database (NLCD), NASS CDL, and DEM. For the soil input files of the mSWAT-C model, the initial SOC value for each soil layer in each HRU was extracted from the sSSURGO National Value-added Look Up (NVADLU) table. Daily weather data inputs for the 900-yr initialization period were artificially created by repeating the detrended daily weather dataset from 1979 to 2018. The initial soil water and residue were set to zero because of the lack of prior information for the status of soils.
After initialization of the C pools, the mSWAT-C model was evaluated for the study ranch/watershed by running the simulations for 40 years from 1979 to 2018. The initial 2-years (1979–1980) were used for the warm-up period for model simulations. Simulated streamflow, sediment, and nutrient losses at the USGS gauge and SOC at the sampling locations were compared with observed values and the model performance was evaluated using four statistical criteria, including the Coefficient of determination (R2), Nash-Sutcliffe efficiency (NSE) Ratio of Root Mean Square Error and Standard Deviation of observations (RSR), and Percentage of Bias (PBIAS) (Supplemental Materials S2).
2.5. Grazing management scenarios
Light Continuous, and AMP: Adaptive MultiPaddock.
b
c 2016 CDL (US. USDA). d SSURGO data (USDA).
e Kim et al. (2022)
HC grazing was used as the baseline scenario on all grazing lands in the study watershed, while AMP grazing was the baseline scenario for the study ranch. Hypothetical grazing scenarios were simulated in the study watershed by replacing the baseline HC grazing practice with the LC and AMP grazing management on all grazing land HRUs. The same level of high stocking rates were assigned to HC and AMP grazing (Table 1). Stocking rate is the ratio of the total number of livestock divided by the total area of grazeable land for the entire grazing season and represents total forage consumption and fecal matter production on the land area in question. When livestock are concentrated on a fraction of the total grazable area for a limited period, as in the case of AMP grazing, the overall stocking rate does not change but the stocking pressure and therefore grazing intensity increase. Adequate post-grazing rest period for the defoliate grasses is necessary for them to regrow before they are grazed again. The same principle was used in the study ranch HRUs by replacing the baseline AMP grazing with the HC and LC grazing. To represent each grazing management condition in the mSWAT-C model, we adopted runoff Curve Number (CN) values suggested by the NRCS Engineering Division (1986) for different hydrological conditions and hydrologic soil groups on grazing lands. Kim et al.
(2022) and Park et al. (2017a) used the same approach for simulating different grazing management practices using the SWAT model.
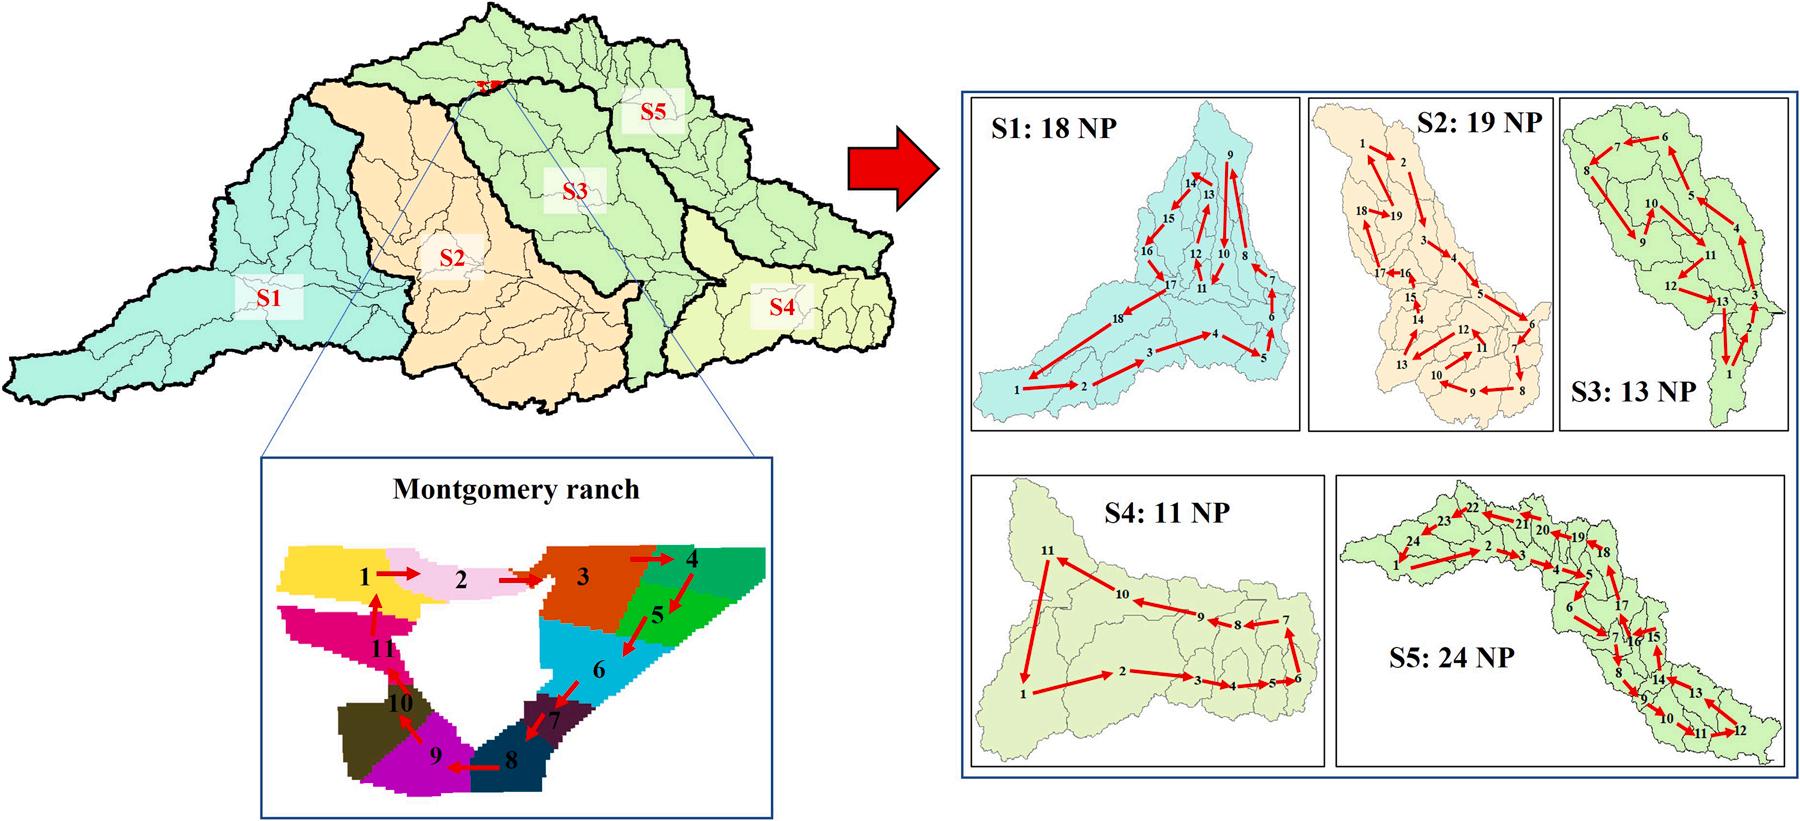
Under the AMP grazing scenario, we assumed each sub-watershed as a paddock (Park et al., 2017a), and moved livestock from one sub-watershed to another depending on the number of grazing days and period of plant recovery. The study watershed is a much larger AMP grazing implementation area than the watershed modeled by Park et al. (2017a), (2017b). Therefore, the 95 sub-watersheds were grouped into six sections (one section of 11 sub-watersheds for the study ranch and 5 sections of 13–24 sub-watersheds for the remaining portion of the study watershed) such that AMP grazing practice could be implemented independently in each section (Fig. 2) (Kim et al., 2022). Detailed information about AMP grazing implementation for each section and the study ranch within the watershed is provided in Table S2. Six grazing rotations per year were assumed, and the days of grazing and forage recovery differed according to the number of paddocks in each section. For example, in the study ranch with 11 paddocks, 3 days were allowed for grazing and 30
39 days for forage recovery per rotation during the fast grass regrowth season, while 6 days for grazing with 40 – 60 days for forage recovery were operated during slow grass growth season. During winter season, 12–13 days for grazing a–d 69–137 days for recovery were allowed. Section 5 of the watershed had 24 paddocks so that it was operated 2
3. Results
3.1. Evaluation of soil organic carbon (SOC) prediction
After the mSWAT-C model was calibrated and validated for hydrologic and water quality characteristics (Table S3), and crop yields (Fig. S1), the initialized SOC values were used to evaluate the model performance in simulating SOC at each soil depth at each soil sampling location (Fig. 3(a) – (c)). Simulated annual SOC matched well with the observed values at each soil depth after the 900 year initialization phase (Fig. 3(d)). According to Moriasi et al. (2007) performance criteria, a PBIAS of 0.52%, an R2 of 0.78 and NSE of 0.77 indicated good model performance. While it was not possible to evaluate the model for SOC prediction for the entire watershed, the evaluation results at the seven sampling locations indicated that the simulated SOC was likely predicted well for all grazing land conditions in the study watershed.
3.2. Grazing effects on soil organic carbon (SOC)
4 days for grazing and 46
92 days for forage recovery depending on grass regrowth rates. Based on the number of paddocks in each section, different dry matter intake and manure production (ASABE standards, 2005) values were assigned to effectively simulate the AMP grazing scenarios.
2.6. Statistical analysis
Statistical analyses were conducted to compare the differences in SOC values of soil samples collected from paired sites under AMP (study ranch) and HC (adjacent ranch) grazing management, and to assess the significance of the effect of change in grazing management practice on soil quality indicators. Paired t-tests were performed to identify significant response differences (p < 0.05) for each soil quality indicator when the baseline grazing management was replaced with an alternate grazing management practice (e.g., HC to LC, HC to AMP, LC to AMP at the watershed scale).
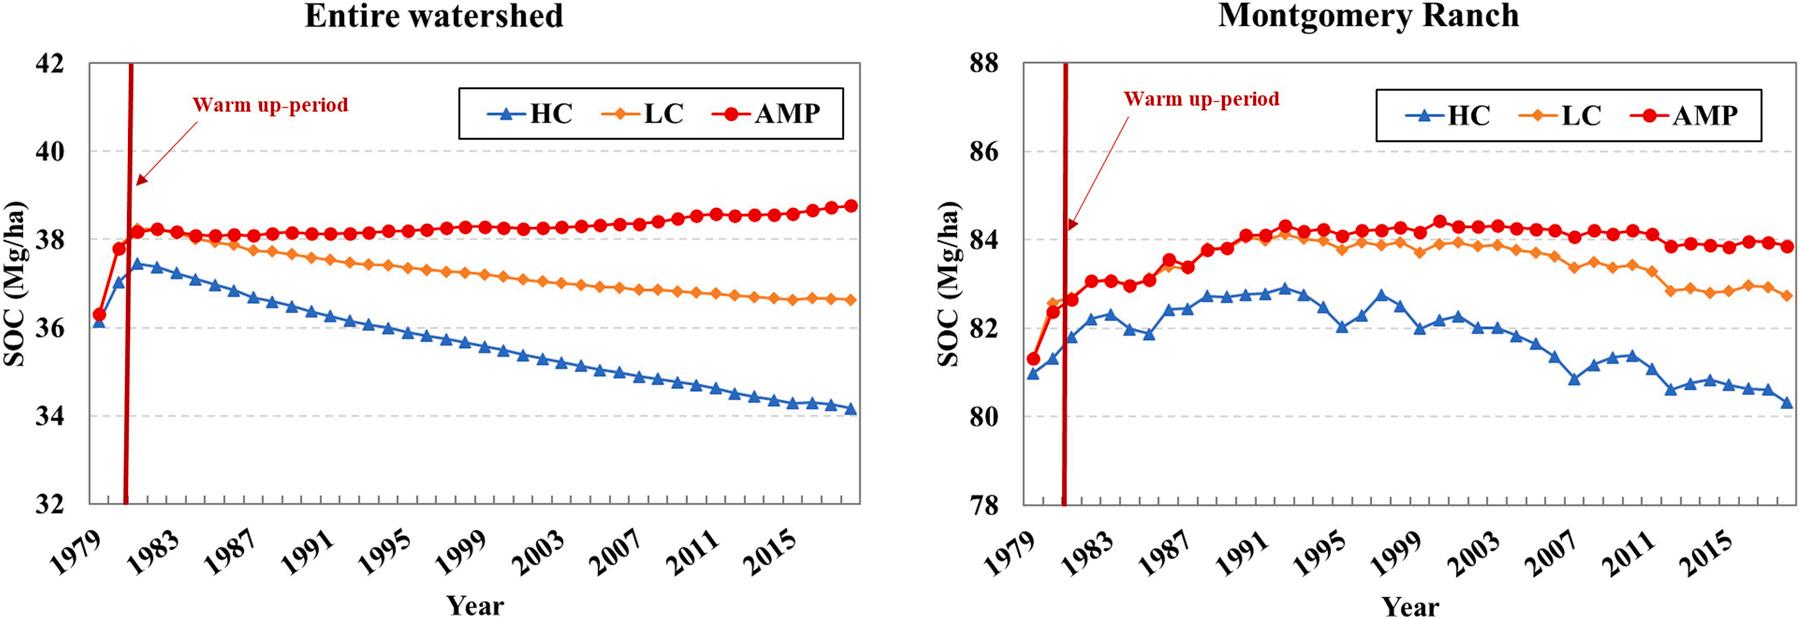
The annual predicted SOC under HC, LC, and AMP grazing management over the simulation period from 1979 to 2018 was compared at the ranch and watershed scales (Fig. 4). At the study ranch, compared to the baseline AMP grazing management, HC and LC grazing resulted in average annual SOC decreases of 2.6% and 0.6% (Table 2). At the watershed scale, average annual SOC increased by 4.5% under LC grazing and 7.6% under AMP grazing relative to baseline HC grazing (Table 3). When compared to LC grazing, annual SOC increase under AMP grazing was about 3.0% at the watershed scale. Both HC and LC simulations showed a continuous decline in SOC, whereas under AMP grazing, SOC increased gradually at the watershed scale. At the study ranch, SOC remained stable under AMP grazing and reduced steadily under HC grazing even though the stocking rate was the same under AMP and HC grazing (Fig. 4).
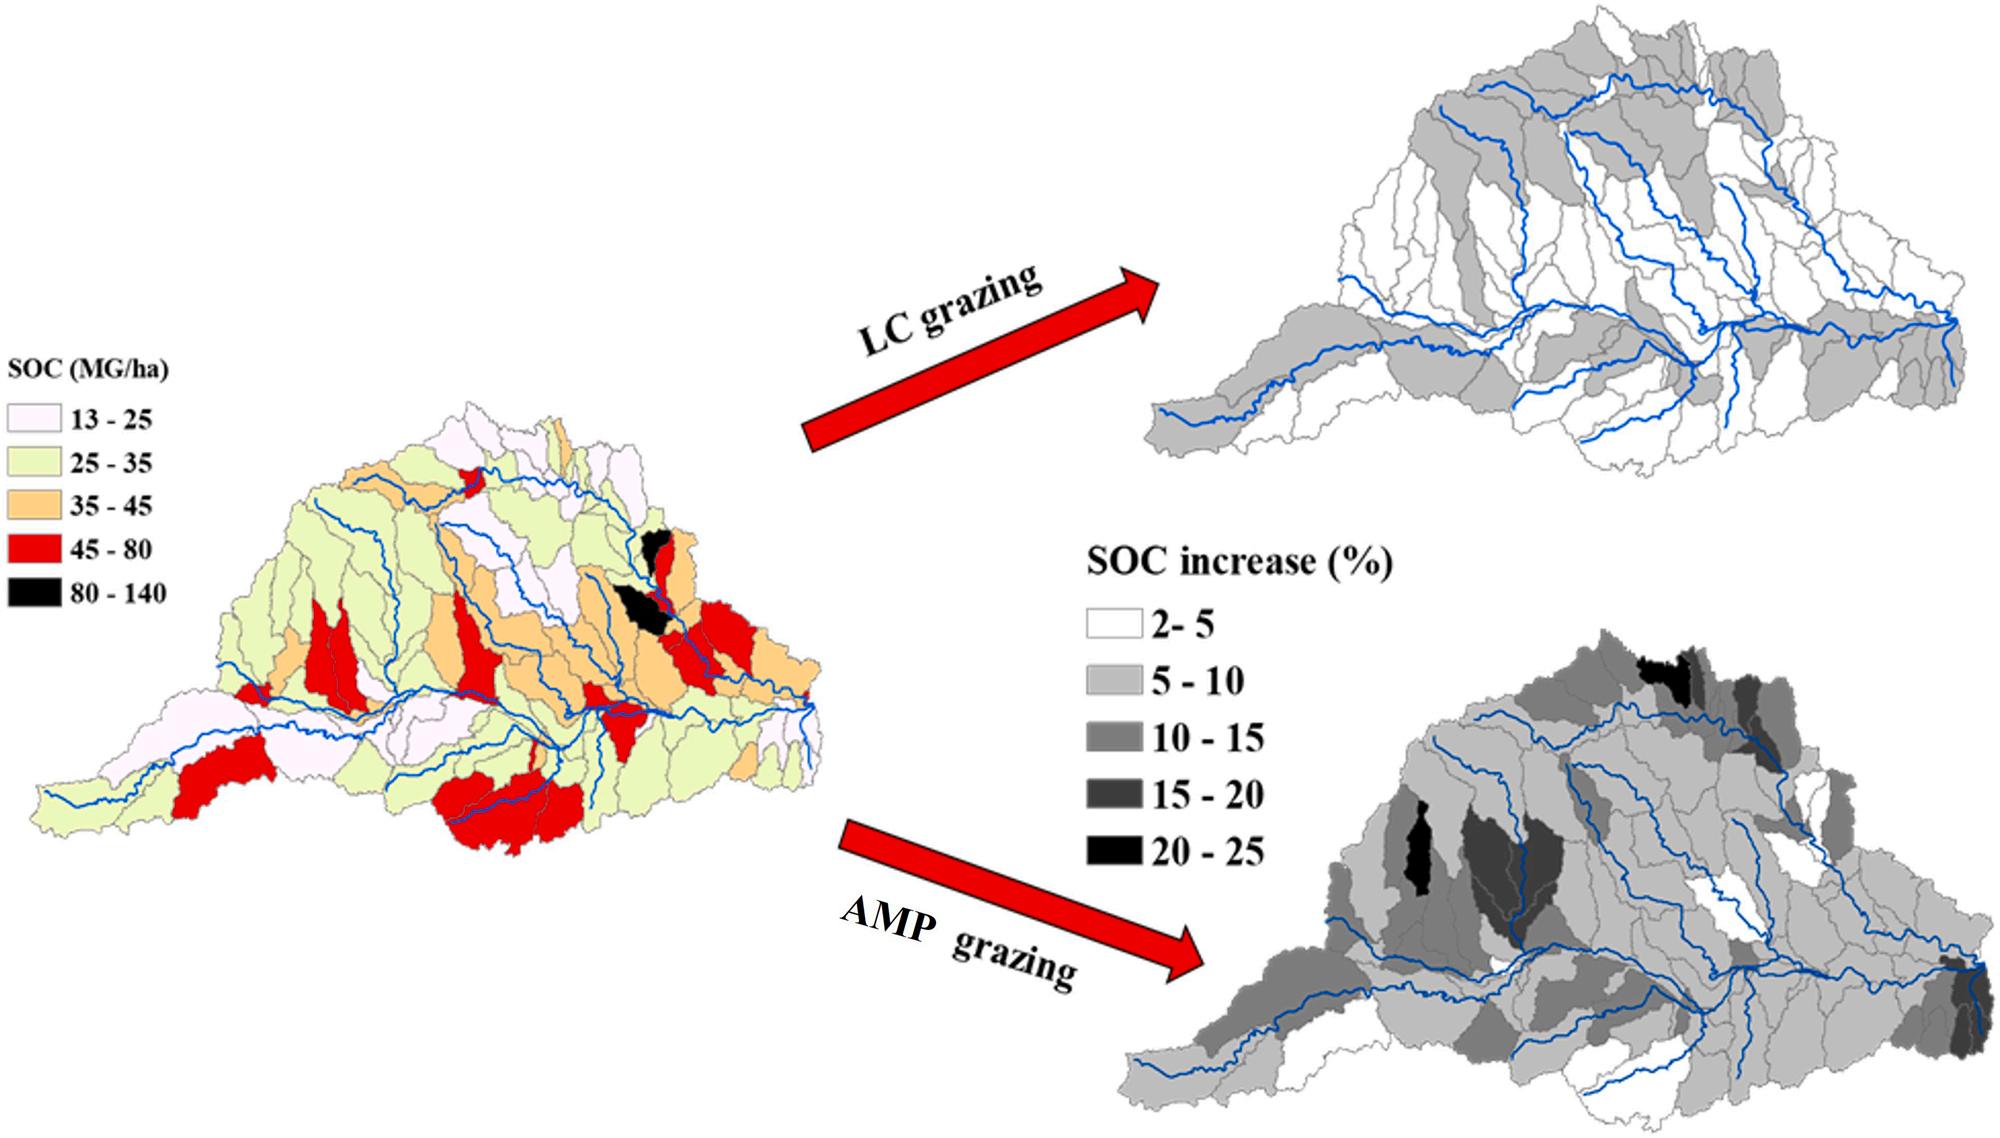
Sub-watershed SOC variations were also investigated as the difference in average annual SOC (1981–2018) between the grazing treatments (Fig. 5). Relative to HC grazing, the sub-watershed area-weighted average annual SOC increased significantly under LC and AMP grazing. The spatial SOC distribution showed that all sub-watersheds had at least 2% higher SOC and two of the sub-watersheds had 20
25% more SOC under AMP than HC grazing. In general, the level of increase in SOC under improved grazing was inversely related to the initial SOC under HC grazing.
3.3. Ranch scale grazing effects on soil quality and hydrological indicators
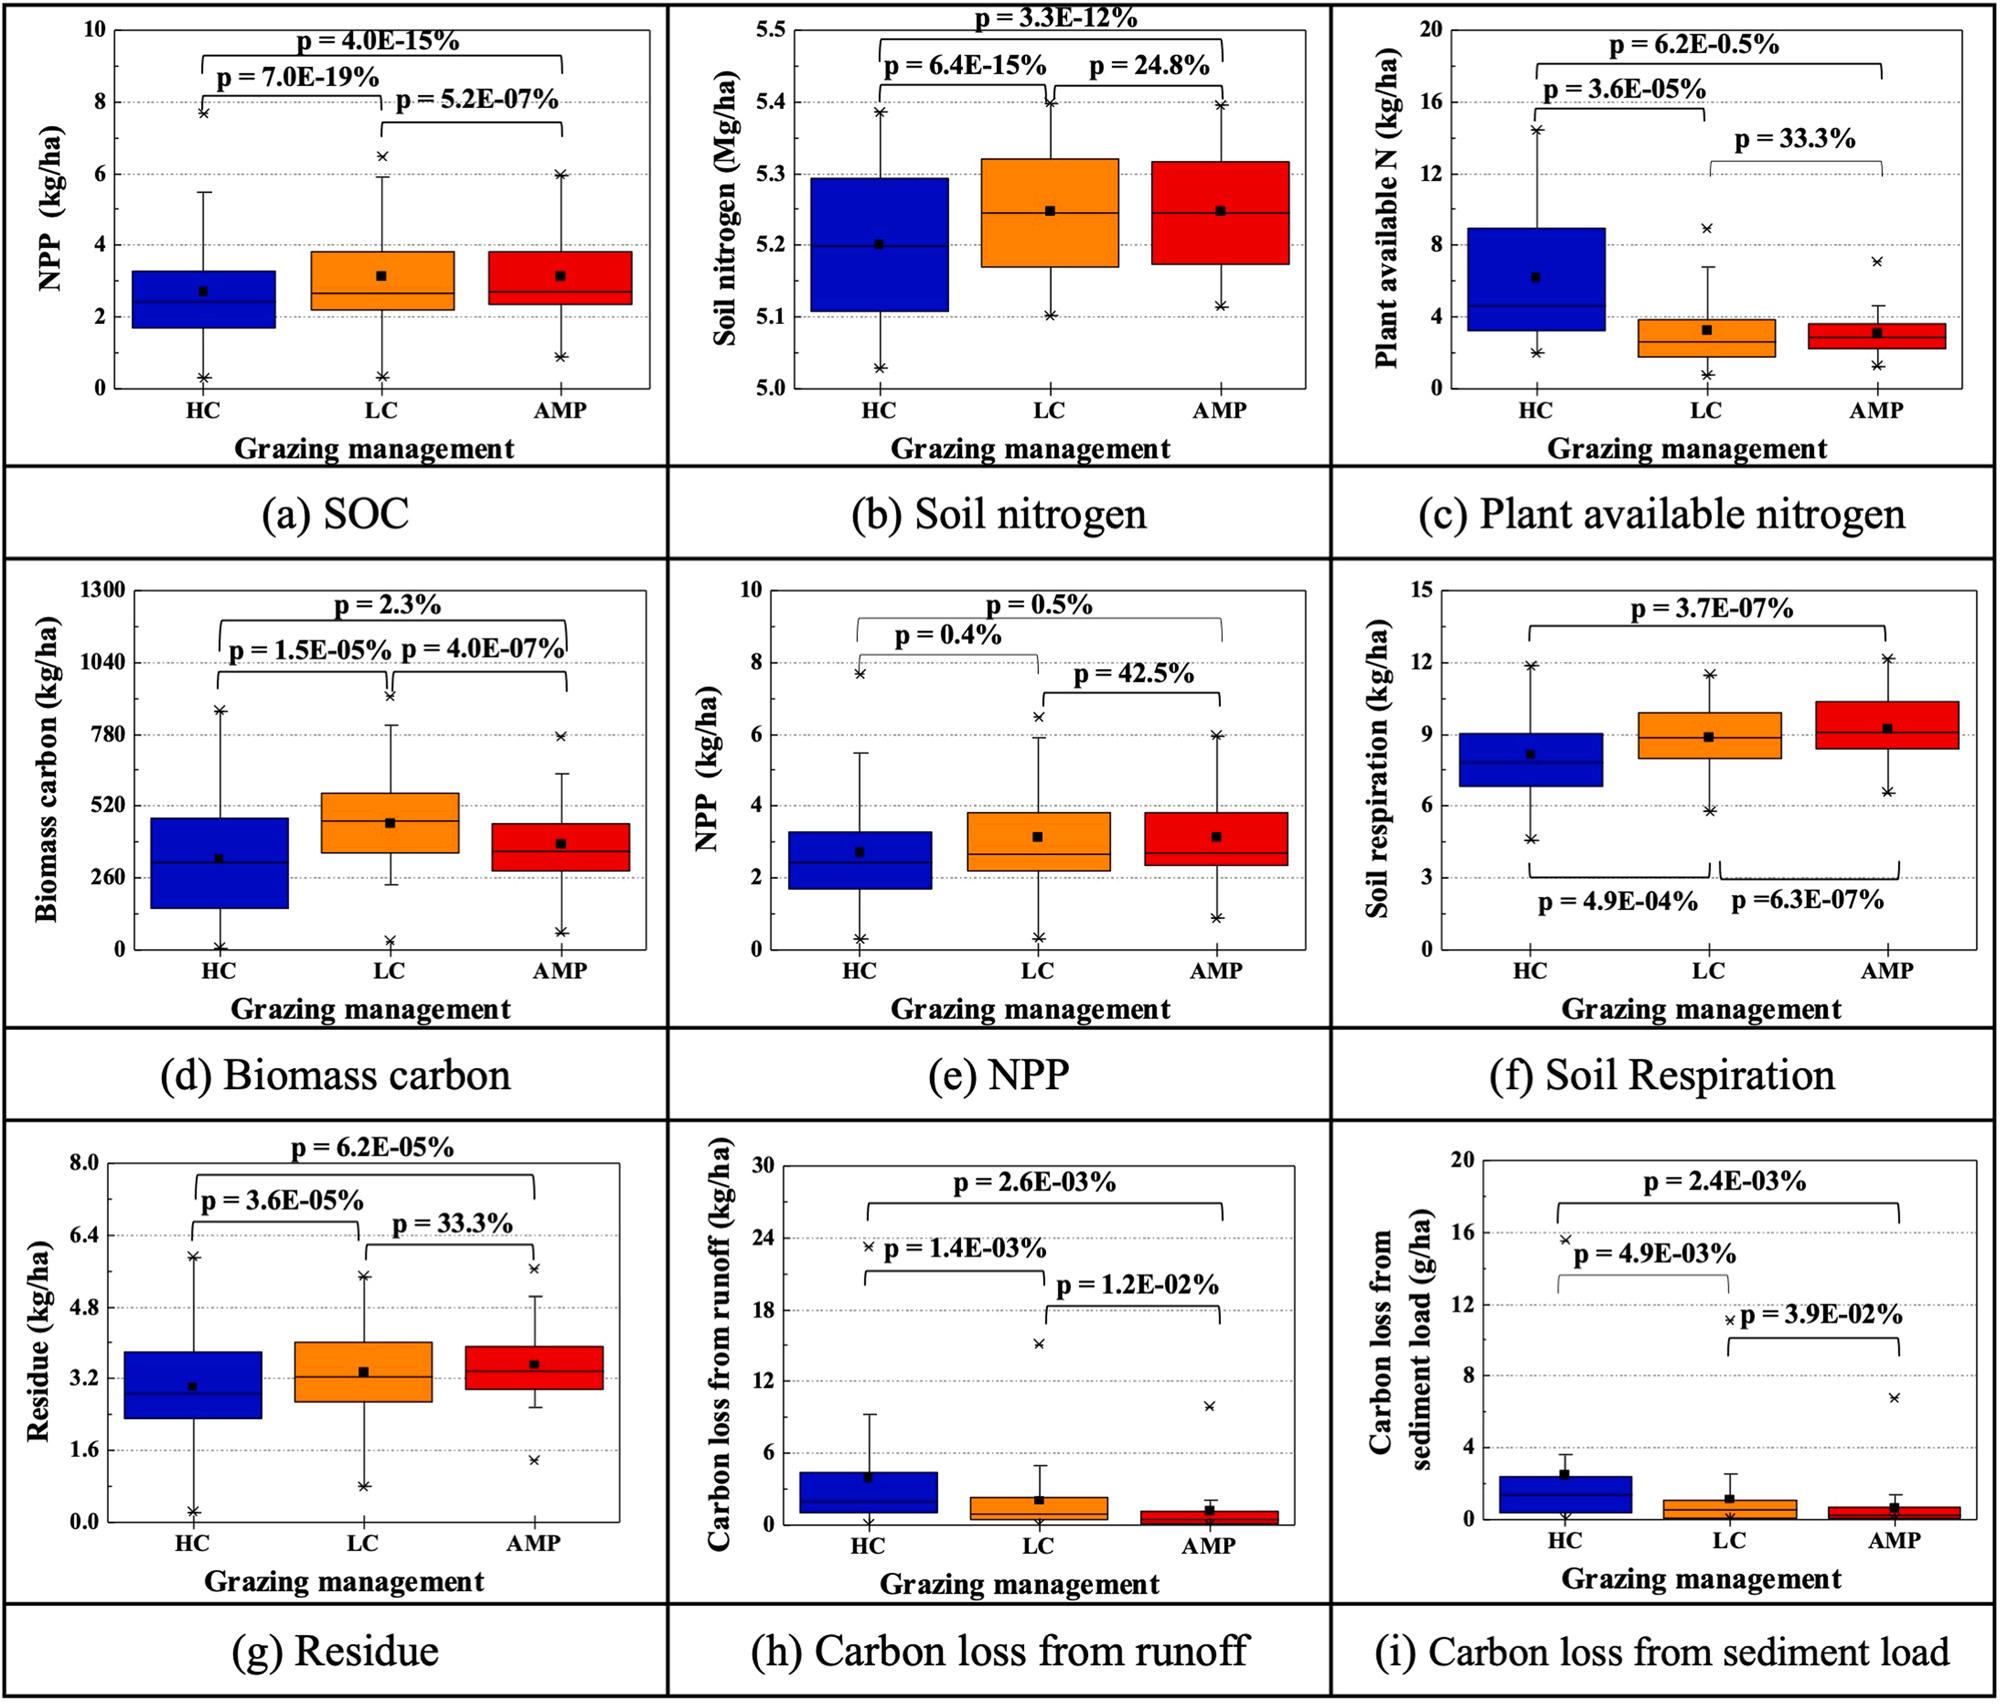
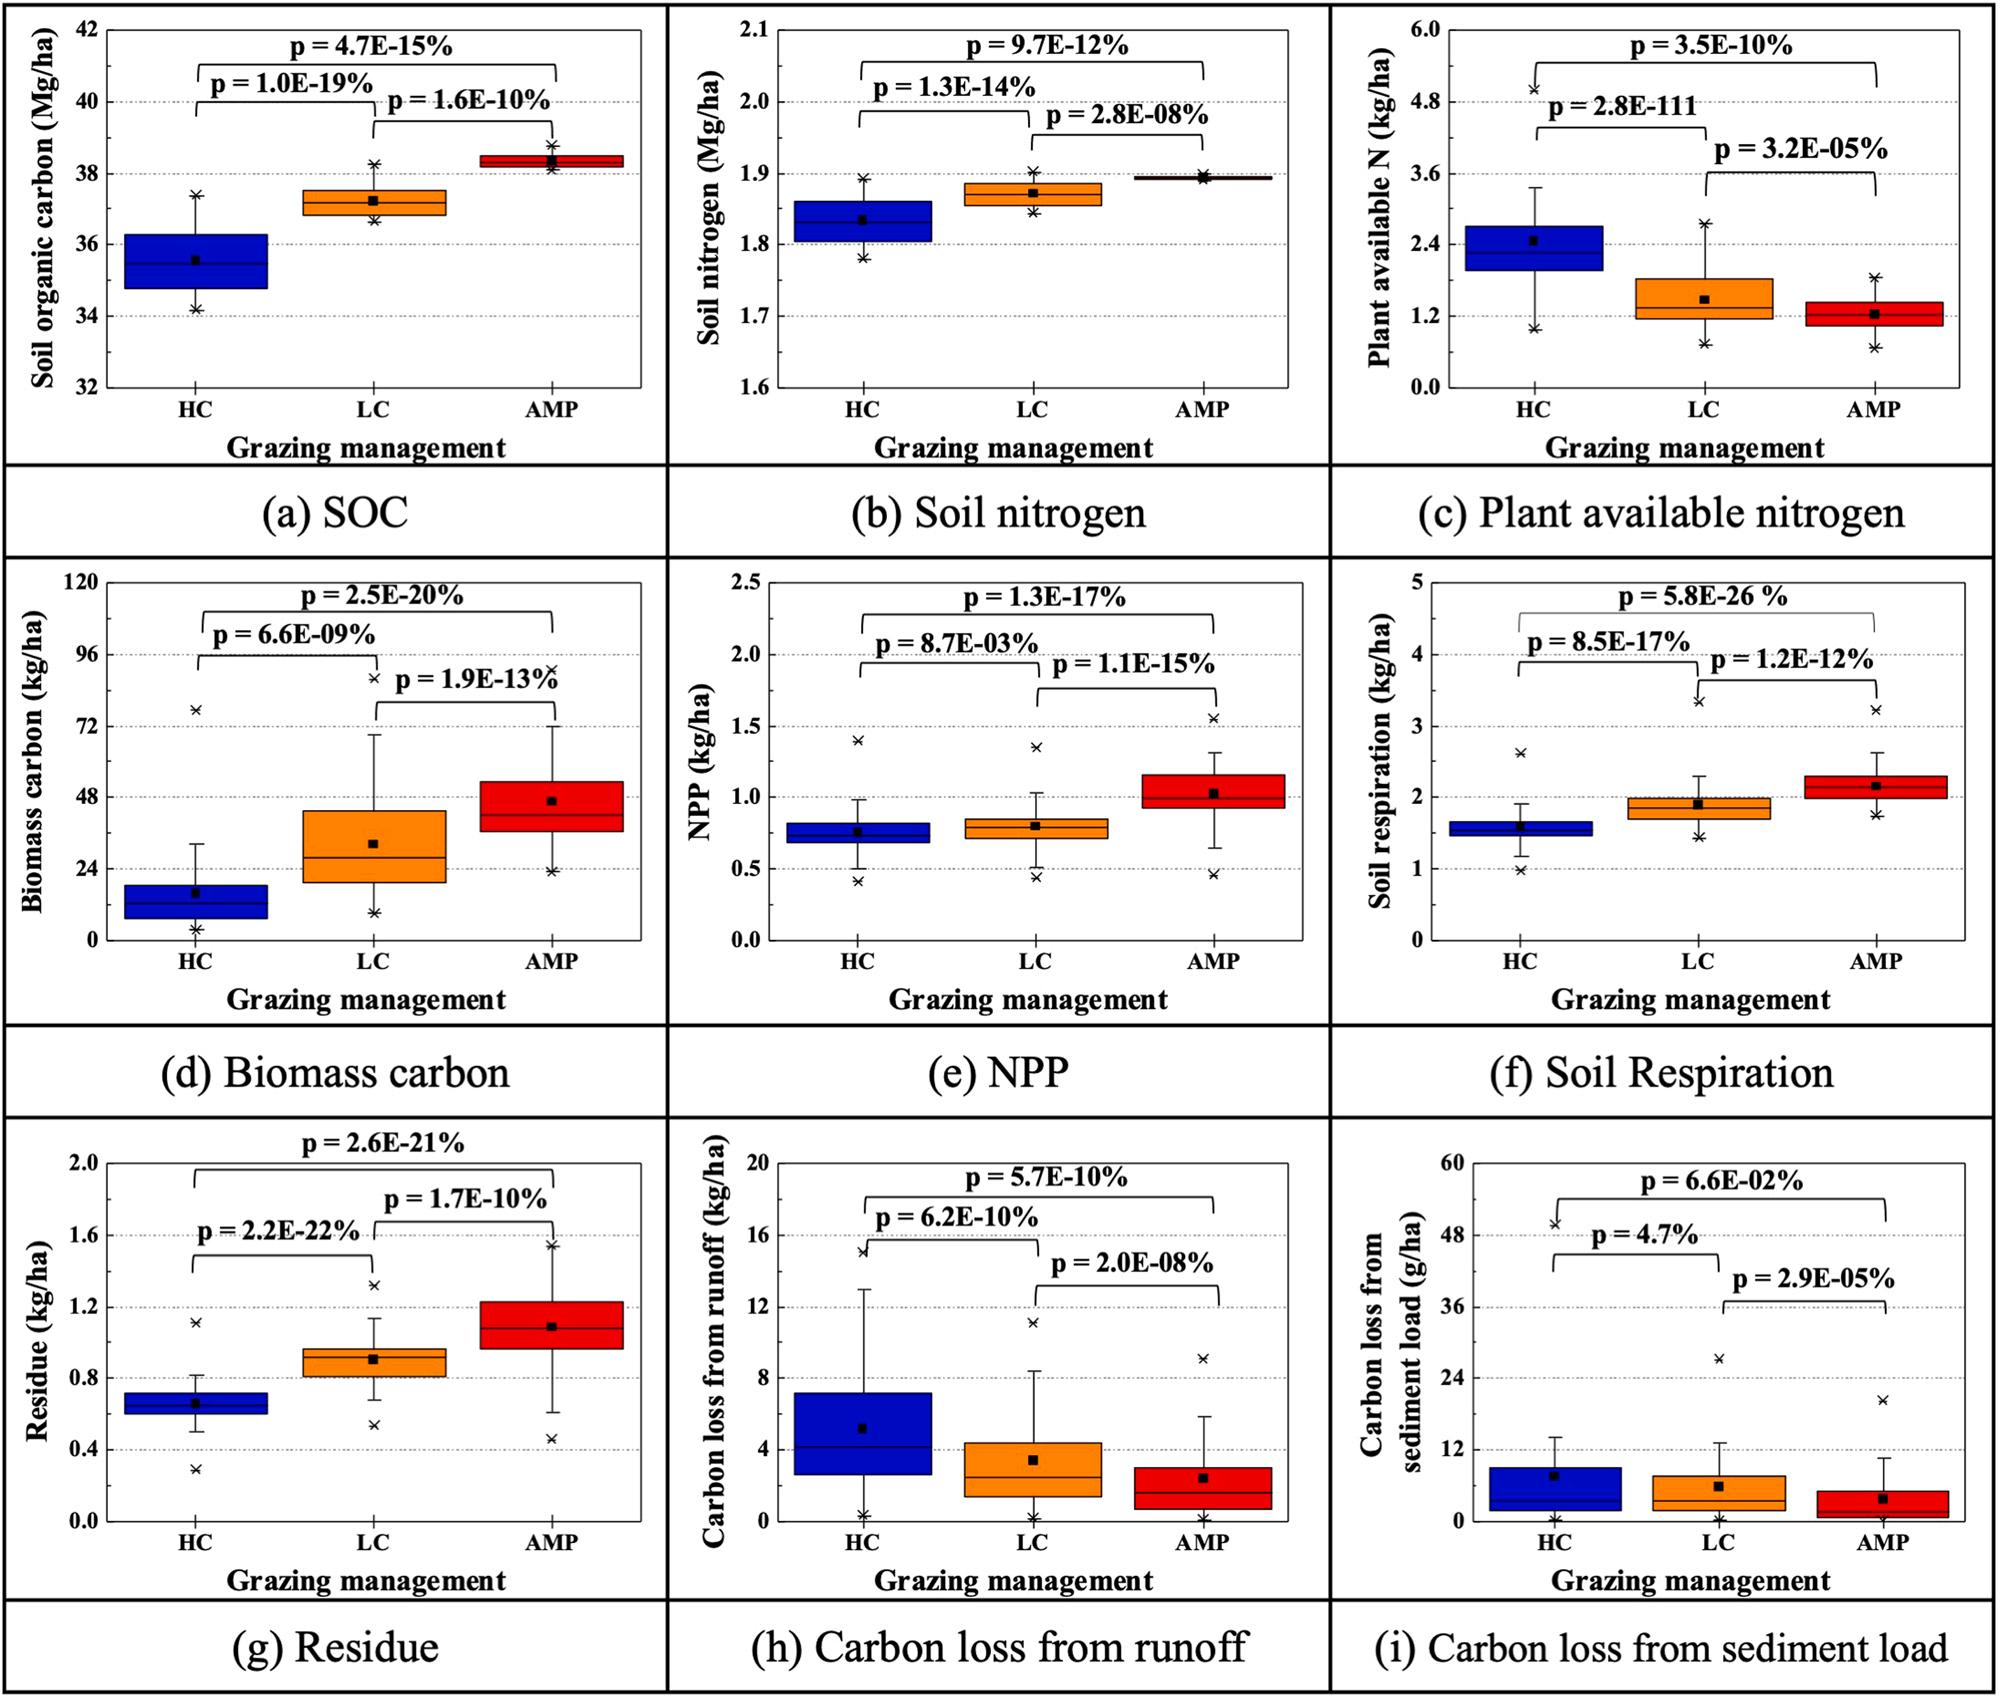
Soil quality indicators considered for assessing the effects of HC, LC, and AMP grazing at the study ranch included soil N, plant available N, biomass C, NPP and soil respiration, plant residue, and C loss from surface runoff and sediment load (Table 2). Relative to the current AMP practice, hypothetical HC grazing simulations indicated decreases of 14.4% for biomass C, 12.9% for NPP, 12.0% for soil respiration, 14.3% for residue and 1.9% for Soil N (Table 2, Fig. 6). While the percentage variations in these soil quality indicators were generally similar when moving from AMP to either HC or LC grazing, the increase in biomass C under LC grazing was almost twice that under HC grazing due to the much lower stocking rate in case of LC grazing which reduced
defoliation substantially when compared to AMP and HC grazing. In addition, the study ranch had enough plant productivity to endure the high grazing intensity due to the lower reduction of biomass C when the AMP grazing was replaced with HC grazing. Plant available N at the study ranch increased by 3.2% under the LC and 100.0% under HC grazing scenarios relative to AMP grazing. The LC and HC grazing practices degraded hydrological conditions much worse compared to soil conditions at the study ranch. Relative to AMP, HC grazing led to 254.5% and 100. 0% increase in C losses from runoff and sediment load, while LC grazing resulted in the increase of C losses from runoff and sediment load by 81.8% and 25.0%, respectively at the study ranch.
Simulated soil organic carbon and soil parameter responses after 40 years under Heavy Continuous (HC), Light Continuous (LC), and Adaptive Multi-Paddock (AMP) grazing at the ranch scale.
3.4. Watershed scale grazing effects on soil quality and hydrological indicators
Simulated annual soil quality indicators were also used to evaluate the impacts of HC, LC, and AMP grazing practices at watershed scale (Table 3). The simulated average soil quality indicator values for AMP grazing at the watershed scale (averaged over the grazing land HRUs only) indicated similar increases relative to HC and LC grazing as at the ranch scale (Table 3, Fig. 7). Relative to HC grazing, soil N increased by 3.3% under AMP grazing because it stimulated microbial species due to the improved nutrient cycling. However, plant available N decreased by 37.5% and 50.0% under LC and AMP grazing, respectively. Additionally, compared to HC grazing, biomass C was 107.8% greater under the LC grazing and 201.3% under the AMP grazing. Furthermore, LC grazing resulted in 6.7% more NPP and 18.8% more soil respiration while AMP grazing resulted in 33.3% more NPP and 37.5% soil respiration compared to HC grazing, due to the much higher aboveground biomass, leaf area, and light interception under AMP and LC grazing. These differences in NPP were also associated with higher plant residue at the surface. Simulated long-term average C losses from runoff and sediments were 53.8% and 50.7%, respectively, lower under AMP than HC grazing at the watershed scale. Relative to LC grazing, soil N, biomass C, NPP, soil respiration, and residue increased by 1.1%, 45.0%, 25.0%, 15,8%,
and 22.0%, respectively under AMP grazing, while plant available N decreased by 20.0%. Simulated long-term average C losses from runoff and sediments under AMP grazing were 29.4% and 35.1% lower than those under LC grazing. These positive response with AMP despite it being stocked much more heavily than LC.
4. Discussion
In this study, we have modified the Soil and Water Assessment ToolCarbon (SWAT-C) model and used it to test the notion that C stocks in grazing lands, which represent a potential major global C sink, and other soil quality and hydrological parameters can be substantially affected by livestock grazing management. Specifically, we compared the impacts of HC, LC, and AMP grazing at the ranch and watershed scales in the study watershed in Northwest Texas. The results of our study corroborated claims that AMP grazing has significant potential to restore soil health and ecological functionality of grazing land ecosystems (Teague et al., 2013; Mosier et al., 2021; Teague and Kreuter, 2021). Whereas high intensity selective grazing under HC can lead to overgrazed bare areas, AMP grazing aims to maintain good ground cover, which enhances surface water infiltration, buffers soil surface temperatures, decreases evaporation, and ensures good soil function and health (Teague et al., 2011; Hillenbrand et al., 2019; Teague et al., 2021). These
Table 3
Simulated soil organic carbon and soil parameter responses after 40 years under Heavy Continuous (HC), Light Continuous (LC), and Adaptive Multi-Paddock (AMP) grazing at the watershed scale (averaged over the grazing land HRUs [Hydrologic Response Units] only).
enhancements stimulate soil microbial activity, which promotes soil respiration and soil aggregate stability, sustains nutrient availability, improves plant growing conditions, and incorporates more SOM (Johnson et al., 2022; Teague and Dowhower, 2022).
SOC is important for soil health because it can enhance rainfall infiltration, soil water-holding capacity and soil structural stability, and it is a primary indicator of plant productivity, water catchment health, and C sink potential of a landscape to mitigate climate change effects (Charman and Murphy, 2000; Bardgett, 2005; Lal, 2008). Our finding that AMP results in a steady increase in SOC whereas HC grazing leads to a steady decline in SOC both at the ranch and watershed level is
consistent with numerous studies that reported that AMP grazing has higher SOC than HC or LC grazing managements (Teague et al., 2011; Abdalla et al., 2018; Johnson et al., 2020; Mosier et al., 2021). These differences may be ascribed to the improved surface cover and associated impacts on runoff, erosion and infiltration under AMP versus the persistent severe defoliation of preferred areas under HC without any planned post grazing recovery periods, which leads to localized overgrazing, greater C release to the atmosphere, less plant residue, and less organic matter incorporation into the soil (Lal, 2004; Mchunu and Chaplot, 2012; Podwojewski et al., 2011). By contrast, AMP grazing tends to promote SOC because the movement of livestock facilitates
adequate post-herbivory forage recovery by dispersing grazing pressure across the landscape, which in turn increases ground cover by live plants and plant residue that elevate SOM (Ma et al., 2021; Mosier et al., 2021; Johnson et al., 2020; Hillenbrand et al., 2019). Furthermore, the spatial distribution of simulated SOC in our study suggests that the more highly degraded soils have a greater potential for improvement when the appropriate grazing management is implemented. This was also reflected in the ranch- and watershed-scale results. Since the average annual SOC under default AMP grazing management at the study ranch was much higher (84 Mg/ha) as compared to average annual SOC of grazing lands in the entire watershed under baseline HC grazing management (35.6 Mg/ha), the percentage increase in SOC with change in grazing management from HC to AMP at the study ranch was smaller (2.7%) as compared to that for the entire watershed (7.6%).
Livestock grazing also affects soil N, biomass C, and NPP (Carswell et al., 2019; Teague at Kreuter, 2020). Our simulations indicated that HC grazing resulted in N losses, likely from urine runoff from bare areas and from unincorporated dung, whereas greater ground cover and plant residue in LC and AMP grazing reduced N losses through the promotion of greater root mass (Teague at al, 2013). The negative correlation between simulated soil N and plant available N indicates greater N uptake by plants as soil N increases. Higher biomass C under LC grazing is
associated with lower grazing intensity due to lower stock rates. Under AMP grazing, variable short grazing periods followed by extended post-defoliation plant recovery periods, especially for preferred forage species, results in lower grazing pressure at both the ranch and watershed scales.
Grazing effects on ground cover also have hydrological implications (Teague and Kreuter, 2020). Ground cover is negatively correlated with C losses from runoff and sediment loads that affect regional C cycles in terrestrial and aquatic ecosystems. Higher C loads in soil entering the streams under HC grazing suggest that increased bare ground and soil compaction under the high grazing intensity reduced water infiltration and increased surface runoff and soil erosion. Previous research has indicated that AMP grazing leads to less bare ground and decreased C losses from soil erosion than continuous grazing at the same stocking rate (Teague et al., 2011, 2016). Our simulations similarly imply that the adoption of improved grazing management practices, such as AMP grazing, would reduce C losses from runoff and sediment load by improving soil conditions at the ranch and watershed scales.
Overall, our results indicate that by maintaining moderate growing season defoliation with adequate plant recovery time, AMP grazing can minimize the negative effects of area selective overgrazing under HC, and can enhance SOC, soil health, and hydrological parameters. These
findings counter assertions that rotational grazing, specifically AMP-like grazing methods, provide no advantage over continuous grazing with respect to forage and livestock production (Briske et al., 2008; Augustine et al., 2020). Critics of rotational grazing generally state that the only meaningful management variable for sustaining grazing land and livestock productivity is maintenance of low to moderate stocking rates while letting livestock freely select their diet across the total grazing area (Briske et al., 2008). However, there are two flaws in this argument from sustainability and productivity perspectives: (1) Grazing animals exhibit area selective grazing under continuous grazing regardless of stocking rate, thereby overgrazing preferred areas even at low stocking rates; and (2) while, as has been widely reported, free selection of diets by grazing animals enhances individual animal performance, lower stocking rates lead to less total animal production at the ranch scale (Heitschmidt and Taylor, 1991; Teague et al., 2013).
The modeling methodology used in our study to evaluate the ranch and watershed scale impacts of grazing management practices can be applied to other watersheds with similar or different climate conditions. A limitation of our study is that it used 2016 CDL as the land cover data for the entire simulation period (1979–2018) and hence it did not account for changes in land cover during that period. However, land cover changes in this grazing land-dominated rural study watershed are expected to be minimal. Future research should incorporate changes in
land cover to more effectively simulate the effects of grazing management on hydrological and soil health outcomes at the watershed scale. Additional studies should be conducted to evaluate the impact on SOC variations due to the adoption of the AMP grazing under different climate, soil, and hydrologic condition on grazing lands in other watersheds.
5. Conclusions
Well-managed grazing lands can contribute to the improvement of plant growth, forage recovery, and soil fertility by reducing mature plant tissue and stimulating photosynthetic rates of the remining leaf material while also accelerating C and nutrient cycling. By contrast, continuous heavy defoliation of grasses can lead to soil and hydrological degradation in grazing lands. We modified the SWAT-C model and used it to simulate the impacts of three grazing management practices (HC, LC, and AMP grazing) on SOC, soil health indicators and hydrological paraments at the ranch and watershed scales in the grazing land-dominated study watershed. Our results indicated that, compared to HC and LC grazing, the average annual SOC (1981
2018) was highest under AMP grazing at both the ranch and watershed scales. Specifically, average annual SOC was 2.7% and 7.6% greater at the ranch and watershed scale, respectively, when grazing management was changed from HC to
AMP, and percentage increase in SOC was inversely related to initial SOC under the HC grazing. Additionally, relative to HC, LC and especially AMP grazing had a significant positive effect on other soil and hydrological factors at the ranch and watershed scales, including NPP, biomass C, soil respiration, and decreased C losses from runoff and sediment load.
Collectively, our results support the claims that AMP grazing has high potential for restoring degraded grazing lands. They counter the assertions by some researchers that the only necessary management variable for sustaining grazing land health and productivity is the maintenance of low to moderate stocking rates while allowing grazing animals to roam freely to maximize diet quality. Accordingly, our results have important implications for ranchers and policymakers who seek to improve the ecological health of soils at the ranch and watershed scales through the improvement of livestock grazing management.
Declaration of Competing Interest
The authors declare that they have no known competing financial interests or personal relationships that could have appeared to influence the work reported in this paper.
Data availability
Data will be made available on request.
Acknowledgments
This material is based upon work that is supported by the National Institute of Food and Agriculture, U.S. Department of Agriculture, under award number NIFA-2017–67024-26279. Any opinions, findings, conclusions, or recommendations expressed in this publication are those of the author(s) and do not necessarily reflect the view of the U.S. Department of Agriculture.
Appendix A. Supporting information
Supplementary data associated with this article can be found in the online version at doi:10.1016/j.agee.2022.108234
References
Abdalla, M., Hastings, A., Chadwick, D., Jones, D.L., Evans, C., Jones, M.B., Rees, R., Smith, P., 2018. Critical review of the impacts of grazing intensity on soil organic carbon storage and other soil quality indicators in extensively managed grasslands. Agric., Ecosyst. Environ. 253, 62–81. https://doi.org/10.1016/j.agee.2017.10.023
Ajtay, G., 1979. Terrestrial primary production and phytomass. The global carbon cycle. SCOPE 13, 129–181
Arnold, J., Srinivasan, R., Muttiah, R., Williams, J., 1998. Large area hydrologic modeling and assessment, part 1: model development. J. Am. Water Resour. Assoc. 34 (1), 73–89. https://doi.org/10.1111/j.1752-1688.1998.tb05961.x
Arnold, J.G., Moriasi, D.N., Gassman, P.W., Abbaspour, K.C., White, M.J., Srinivasan, R., Santhi, C., Harmel, R., Van Griensven, A., Van Liew, M.W., 2012. SWAT: Model use, calibration, and validation. Trans. ASABE 55, 1491–1508. https://doi.org/ 10.13031/2013.42256
ASABE standards, 2005, Manure Production and Characteristics. D384.2. ASABE, St. Joseph, Michigan.
Augustine, D.J., Derner, J.D., Fernandez-Gimenez, M.E., Porensky, L.M., Wlimer, H., Briske, D.D., CARM Stakeholder Group, 2020. Adaptive, multipaddock rotational grazing management: A ranch-scale assessment of effects on vegetation and livestock performance in semiarid rangeland. Rangel. Ecol. Manag. 73, 796–810. https://doi. org/10.1016/j.rama.2020.07.005
Bai, Y., Cotrufo, M.F., 2022. Grassland soil carbon sequestration: Current understanding, challenges, and solutions. Science 377 (6606), 603–608. https://doi.org/10.1126/ science.abo2380
Bardgett, R.D., Leemans, D.K., Cook, R., Hobbs, P.J., 1997. Seasonality of the soil biota of grazed and ungrazed hill grasslands. Soil Biol. Biochem. 29, 1285–1294. https://doi. org/10.1016/S0038-0717(97)00019-9
Berg, W.A., 1988. Soil nitrogen accumulation in fertilized pastures of the Southern Plains. J. Range Manag. 41 (1), 22
25. https://doi.org/10.2307/3898784
Briske, D., Derner, J., Brown, J., Fuhlendorf, S., Teague, R., Gillen, B., Ash, A., Havstad, K., Willms, W., 2008. Benefits of Rotational Grazing on Rangelands: An Evaluation of the Experimental Evidence. Rangel. Ecol. Manag. 61, 3–17
Carswell, A.M., Gongadze, K., Misselbrook, T.H., Wu, L., 2019. Impact of transition from permanent pasture to new swards on the nitrogen use efficiency, nitrogen and carbon budgets of beef and sheep production. Agric., Ecosyst. Environ. 283, 106572 https://doi.org/10.1016/j.agee.2019.106572
Chen, T., Bao, A., Jiapaer, G., Guo, H., Zheng, G., Jiang, L., Chang, C., Tuerhanjiang, L., 2019. Disentangling the relative impacts of climate change and human activities on arid and semiarid grasslands in Central Asia during 1982–2015. Sci. Total Environ. 653, 1311–1325. https://doi.org/10.1016/j.scitotenv.2018.11.058
Chertov, O., Komarov, A., 1997. SOMM: A model of soil organic matter dynamics. Ecol. Model. 94, 177–189. https://doi.org/10.1016/S0304-3800(96)00017-8
Coleman, K., Jenkinson, D., 1996. RothC-26.3-A Model for the turnover of carbon in soil. In: Powlson, D.S., Smith, P., Smith, J.U. (Eds.), Evaluation of Soil Organic Matter Models. NATO ASI Series, vol 38. Springer, Berlin, Heidelberg. https://doi.org/ 10.1007/978-3-642-61094-3_17.
Conant, R., Paustian, K., 2002. Spatial variability of soil organic carbon in grasslands: implications for detecting change at different scales. Environ. Pollut. 116, S127–S135. https://doi.org/10.1016/S0269-7491(01)00265-2
Conant, R.T., Six, J., Paustian, K., 2003. Land use effects on soil carbon fractions in the southeastern United States. I. Management-intensive versus extensive grazing. Biol. Fertil. Soils 38, 386–392. https://doi.org/10.1007/s00374-003-0652-z
Daily, G.C., 1997. Introduction: what are ecosystem services. In: Daily, G.C. (Ed.), Nature’s Services: Societal Dependence on Natural Ecosystems. Island Press, Washington DC, pp. 1–10
Frank, D.A., Evans, R.D., 1997. Effects of native grazers on grassland N cycling in Yellowstone National Park. Ecology 78, 2238–2248. https://doi.org/10.1890/00129658(1997)078[2238:EONGOG]2.0.CO;2
Franko, U., Oelschlagel, B., Schenk, S., 1995. Simulation of temperature-, water-and nitrogen dynamics using the model CANDY. Ecol. Model. 81, 213–222. https://doi. org/10.1016/0304-3800(94)00172-E
Gijsman, A.J., Hoogenboom, G., Parton, W.J., Kerridge, P.C., 2002. Modifying DSSAT crop models for low-input agricultural systems using a soil organic matter-residue module from CENTURY. Agron. J. 94, 462–474. https://doi.org/10.2134/ agronj2002.4620
Hansen, S., Jensen, H., Nielsen, N., Svendsen, H., 1991. Simulation of nitrogen dynamics and biomass production in winter wheat using the Danish simulation model DAISY. Fertil. Res. 27, 245–259. https://doi.org/10.1007/BF01051131
Heitschmidt, R.K., Taylor, C.A., 1991. Livestock production. In: Heitschmidt, R.K., Stuth, J.W. (Eds.), Grazing Management: An Ecological Perspective. Timber Press, Portland, Oregon, pp. 161–177.
Hillenbrand, M., Thompson, R., Wang, F., Apfelbaum, S., Teague, R., 2019. Impacts of holistic planned grazing with bison compared to continuous grazing with cattle in South Dakota shortgrass prairie. Agric., Ecosyst. Environ. 279, 156–168. https://doi. org/10.1016/j.agee.2019.02.005
International Livestock Research Institute (ILRI), IUCN, FAO, WWF, UNEP, ILC, 2021. Rangelands Atlas. ILRI,, Nairobi Kenya
Izaurralde, R., Williams, J.R., McGill, W.B., Rosenberg, N.J., Jakas, M.Q., 2006. Simulating soil C dynamics with EPIC: Model description and testing against longterm data. Ecol. Model. 192, 362–384. https://doi.org/10.1016/j. ecolmodel.2005.07.010
Izaurralde, R., Williams, J.R., Post, W.M., Thomson, A.M., McGill, W.B., Owens, L., Lal, R., 2007. Long-term modeling of soil C erosion and sequestration at the small watershed scale. Clim. Change 80, 73–90. https://doi.org/10.1007/s10584-0069167-6
Johnson, D.C., Teague, R., Apfelbaum, S., Thompson, R., Byck, P., 2022. Adaptive multipaddock grazing management’s influence on soil food web community structure for: increasing pasture forage production, soil organic carbon, and reducing soil respiration rates in southeastern USA ranches. PeerJ 10, e13750. https://doi.org/ 10.7717/peerj.13750
Jones, J., Hoogenboom, G., Porter, C., Boote, K., Batchelor, W., Hunt, L., Ritchie, J., 2003. The DSSAT cropping system model. Eur. J. Agron. 18 (3–4), 235–265. https:// doi.org/10.1016/S1161-0301(02)00107-7
Kim, J., Ryu, J.H., 2016. A heuristic gap filling method for daily precipitation series. Water Resour. Manag. 30, 2275–2294. https://doi.org/10.1007/s11269-016-1284z
Kim, J., Ale, S., Teague, W.R., Wang, T., 2022. Evaluating Hydrological Components and Streamflow Characteristics under Conventional and Adaptive Multi-paddock Grazing Management. River Research. River Res. Appl. 38 (4), 776–786. https://doi.org/ 10.1002/rra.3948
Kravchenko, A., Robertson, G., 2011. Whole-profile soil carbon stocks: The danger of assuming too much from analyses of too little. Soil Sci. Soc. Am. J. 75, 235–240. https://doi.org/10.2136/sssaj2010.0076
Lal, R., 2004. Soil carbon sequestration impacts on global climate change and food security (https://www.science.org/doi/). Science 304, 1623–1627. https://doi.org/ 10.1126/science.1097396
Letaw, M., Bandel, V., McIntosh, M., 1984. Influence of soil sample depth on soil test results in continuous no-till fields. Commun. Soil Sci. Plant Anal. 15, 1–14. https:// doi.org/10.1080/00103628409367449
Li, C., Frolking, S., Harriss, R., 1994. Modeling carbon biogeochemistry in agricultural soils. Glob. Biogeochem. Cycles 8, 237–254. https://doi.org/10.1029/94GB00767
Ma, Z., Shrestha, B.M., Bork, E.W., Chang, S.X., Carlyle, C.N., Dobert, T.F., Sobrinho, L. S., Boyce, M., 2021. Soil greenhouse gas emissions and grazing management in northern temperate grasslands. Sci. Total Environ. 796, 148975 https://doi.org/ 10.1016/j.scitotenv.2021.148975
Mathieu, J.A., Hatt´ e, C., Balesdent, J., Parent, E., 2015. Deep soil carbon dynamics are driven more by soil type than by climate: A worldwide meta-analysis of radiocarbon profiles. Glob. Change Biol. 21, 4278–4292. https://doi.org/10.1111/gcb.13012.
Mchunu, C., Chaplot, V., 2012. Land degradation impact on soil carbon losses through water erosion and CO2 emissions. Geoderma 177, 72
79. https://doi.org/10.1016/j. geoderma.2012.01.038
Milchunas, D.G., Lauenroth, W.K., 1993. Quantitative effects of grazing on vegetation and soils over a global range of environments: Ecological Archives M063-001. Ecol. Monogr. 63, 327–366. https://doi.org/10.2307/2937150
Minasny, B., McBratney, A.B., 2018. Limited effect of organic matter on soil available water capacity. Eur. J. Soil Sci. 69 (1), 39–47. https://doi.org/10.1111/ejss.12475
Mitchell, J.E., 2000, Rangeland resource trends in the United States. USDA Forest Service General Technical Report. RMRS-GTR-68. Fort Collins, Colorado: Rocky Mountain Research Station.
Moriasi, D.N., Arnold, J.G., Van Liew, M.W., Bingner, R.L., Harmel, R.D., Veith, T.L., 2007. Model evaluation guidelines for systematic quantification of accuracy in watershed simulations. Trans. ASABE 50, 885–900. 〈https://elibrary.asabe.org/abs tract.asp?aid 23153〉.
Mosier, S., Apfelbaum, S., Byck, P., Calderon, F., Teague, R., Thompson, R., Cotrufo, M. F., 2021. Adaptive multi-paddock grazing enhances soil carbon and nitrogen stocks and stabilization through mineral association in southeastern US grazing lands. J. Environ. Manag. 288, 112409 https://doi.org/10.1016/j.jenvman.2021.112409
Neitsch, S.L., Arnold, J.G., Kiniry, J.R., Williams, J.R., 2011. Soil and Water Assessment Tool Theoretical Documentation Version, 2009. Texas Water Resources Institute, Park, J., Ale, S., Teague, W., Dowhower, S., 2017a. Simulating hydrologic responses to alternate grazing management practices at the ranch and watershed scales. J. Soil Water Conserv. 72, 102–121. https://doi.org/10.2489/jswc.72.2.102
Park, J.Y., Ale, S., Teague, W.R., 2017b. Simulated water quality effects of alternate grazing management practices at the ranch and watershed scales. Ecol. Model. 360, 1–13. https://doi.org/10.1016/j.ecolmodel.2017.06.019
Park, J.Y., Ale, S., Teague, W.R., Jeong, J., 2017c. Evaluating the ranch and watershed scale impacts of using traditional and adaptive multi-paddock grazing on runoff, sediment, and nutrient losses in North Texas. Agric., Ecosyst. Environ. 240, 32–44. https://doi.org/10.1016/j.agee.2017.02.004
Parton, W.J., Ojima, D.S., Cole, C.V., Schimel, D.S., 1994. A general model for soil organic matter dynamics: sensitivity to litter chemistry, texture and management. Quant. Model. Soil Form. Process. 39, 147–167. https://doi.org/10.2136/ sssaspecpub39.c9
Penman, J., Gytarsky, M., Hiraishi, T., Krug, T., Kruger, D., Pipatti, R., Buendia, L., Miwa, K., Ngara, T., Tanabe, K., 2003, Good practice guidance for land use, land-use change and forestry. Good practice guidance for land use, land-use change and forestry.
Podwojewski, P., Janeau, J.-L., Grellier, S., Valentin, C., Lorentz, S., Chaplot, V., 2011. Influence of grass soil cover on water runoff and soil detachment under rainfall simulation in a sub-humid South African degraded rangeland. Earth Surf. Process. Landf. 36, 911–922. https://doi.org/10.1002/esp.2121
Reeder, J.D., Schuman, G.E., 2002. Influence of livestock grazing on C sequestration in semi-arid mixed-grass and short-grass rangelands. Environ. Pollut. 116, 457–463. https://doi.org/10.1016/S0269-7491(01)00223-8
Reid, W.V., Mooney, H.A., Cropper, A., Capistrano, D., Carpenter, S.R., Chopra, K., Dasgupta, P., Dietz, T., Duraiappah, A.K., Hassan, R., 2005. Ecosystems and human well-being-Synthesis: A report of the Millennium Ecosystem Assessment. Island Press, Rumpel, C., Kogel-Knabner, I., 2011. Deep soil organic m–tter - a key but poorly understood component of terrestrial C cycle. Plant Soil 338, 143–158. https://doi. org/10.1007/s11104-010-0391-5
Salom´ e, C., Nunan, N., Pouteau, V., Lerch, T.Z., Chenu, C., 2010. Carbon dynamics in topsoil and in subsoil may be controlled by different regulatory mechanisms. Glob. Change Biol. 16, 416–426. https://doi.org/10.1111/j.1365-2486.2009.01884.x
Sharpley, A.N., Williams, J.R., 1990, EPIC-Erosion/Productivity impact calculator. I: Model documentation. II: User manual. Technical Bulletin-United States Department of Agriculture.
Smith, P., Martino, D., Cai, Z., Gwary, D., Janzen, H., Kumar, P., McCarl, B., Ogle, S., O’Mara, F., Rice, C., 2008. Greenhouse gas mitigation in agriculture. Philos. Trans. R. Soc. B: Biol. Sci. 363, 789–813. https://doi.org/10.1098/rstb.2007.2184
Taelman, S.E., Schaubroeck, T., Meester, S., Boone, L., Dewulf, J., 2016. Accounting for land use in life cycle assessment: the value of NPP as a proxy indicator to assess land use impacts on ecosystems. Sci. Total Environ. v. 550, 143–156. https://doi.org/ 10.1016/j.scitotenv.2016.01.055
Teague, R., Barnes, M., 2017. Grazing management that regenerates ecosystem function and grazingland livelihoods. Afr. J. Range Forage Sci. 34, 77–86. https://doi.org/ 10.2989/10220119.2017.1334706
Teague, W., Dowhower, S., Baker, S., Haile, N., DeLaune, P., Conover, D., 2011. Grazing management impacts on vegetation, soil biota and soil chemical, physical and hydrological properties in tall grass prairie. Agric., Ecosyst. Environ. 141, 310–322. https://doi.org/10.1016/j.agee.2011.03.009
Teague, W.R., Dowhower, S., 2022. Links of microbial and vegetation communities with soil physical and chemical factors for a broad range of management of tallgrass prairie. Ecol. Indic. 142, 109280 https://doi.org/10.1016/j.ecolind.2022.109280
Teague, W.R., Kreuter, U.P., 2020. Managing grazing to restore soil health, ecosystem function and ecosystem services. Front. Sustain. Food Syst. 4, 534187 https://doi. org/10.3389/fsufs.2020.534187
Teague, W.R., Provenza, F.D., Kreuter, U.P., Steffens, T., Barnes, M.K., 2013. Multipaddock grazing on rangelands: Why the perceptual dichotomy between research results and rancher experience? J. Environ. Manag. 128, 699–717. https://doi.org/ 10.1016/j.jenvman.2013.05.064
Teague, W.R., Apfelbaum, S., Lal, R., Kreuter, U.P., Rowntree, J., Davies, C.A., Conser, R., DeLonge, M., Rasmussen, M., Hatfield, J., Wang, T., Wang, F., Byck, P., 2016. The Role of Ruminants in Reducing Agriculture’s Carbon Footprint. J. Soil Water Conserv. 71 (2), 156–164. https://doi.org/10.2489/jswc.71.2.156
Tiessen, H., Cuevas, E., Chacon, P., 1994. The role of soil organic matter in sustaining soil fertility. Nature 371, 783–785. https://doi.org/10.1038/371783a0
Whitehead, D.C., 1995. Grassland Nitrogen. CAB International, Wallingford, UK Williams, J.R., 1990. The erosion-productivity impact calculator (EPIC) model: A case history. Philos. Trans. R. Soc. Lond. Ser. B: Biol. Sci. 329, 421–428. https://doi.org/ 10.1098/rstb.1990.0184
Wu, H., Guo, Z., Peng, C., 2003. Land use induced changes of organic carbon storage in soils of China. Glob. Change Biol. 9, 305–315. https://doi.org/10.1046/j.13652486.2003.00590.x
Yang, Q., Zhang, X., 2016. Improving SWAT for simulating water and carbon fluxes of forest ecosystems. Sci. Total Environ. 569, 1478–1488. https://doi.org/10.1016/j. scitotenv.2016.06.238
Zhang, X., 2018. Simulating eroded soil organic carbon with the SWAT-C model. Environ. Model. Softw. 102, 39–48. https://doi.org/10.1016/j.envsoft.2018.01.005
Zhang, X., Izaurralde, R.C., Arnold, J.G., Williams, J.R., Srinivasan, R., 2013. Modifying the soil and water assessment tool to simulate cropland carbon flux: model development and initial evaluation. Sci. Total Environ. 463, 810–822. https://doi. org/10.1016/j.scitotenv.2013.06.056
Zhou, W., Yang, H., Huang, L., Chen, C., Lin, X., Hu, Z., Li, J., 2017. Grassland degradation remote sensing monitoring and driving factors quantitative assessment in China from 1982 to 2010. Ecol. Indic. 83, 303–313. https://doi.org/10.1016/j. ecolind.2017.08.019