REGENERATIVE SPORT URBANISM
MLA DESIGN PROJECT
DELANEY HOPEN
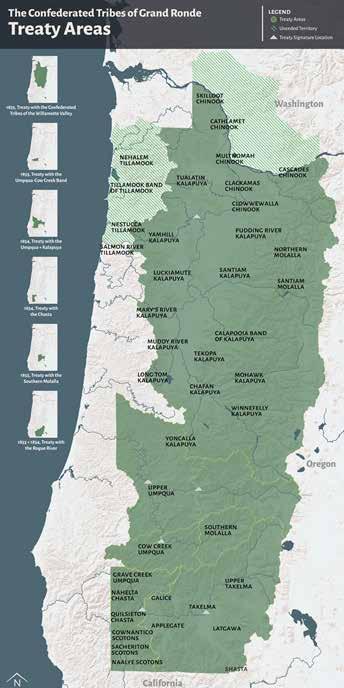
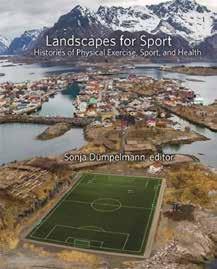
"We acknowledge that we are here on Kalapuya Ilihi – the traditional Indigenous homeland of Kalapuya peoples, who were dispossessed of their Indigenous homeland by the U.S. Government and White settlers over several years, but most notably in Treaties between 1851 and 1855. Kalapuya people were forcibly removed to what are now the Grand Ronde and Siletz reservations, and are now members of Confederated Tribes of the Grand Ronde Community of Oregon and the Confederated Tribes of Siletz Indians, and continue to make important contributions in their communities, at UO, and across the land we now refer to as Oregon. We share this information out of humility and respect for this Indigenous homeland, and for the Indigenous peoples who continue to live and thrive in what is now called the State of Oregon."
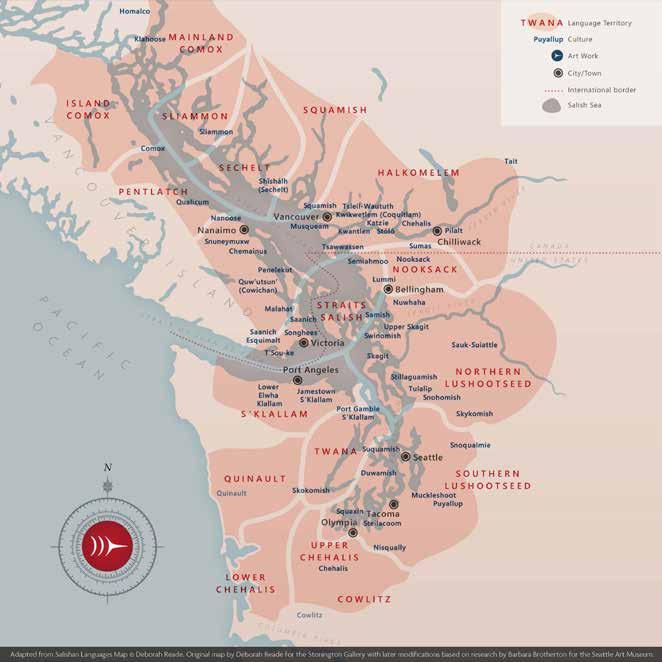
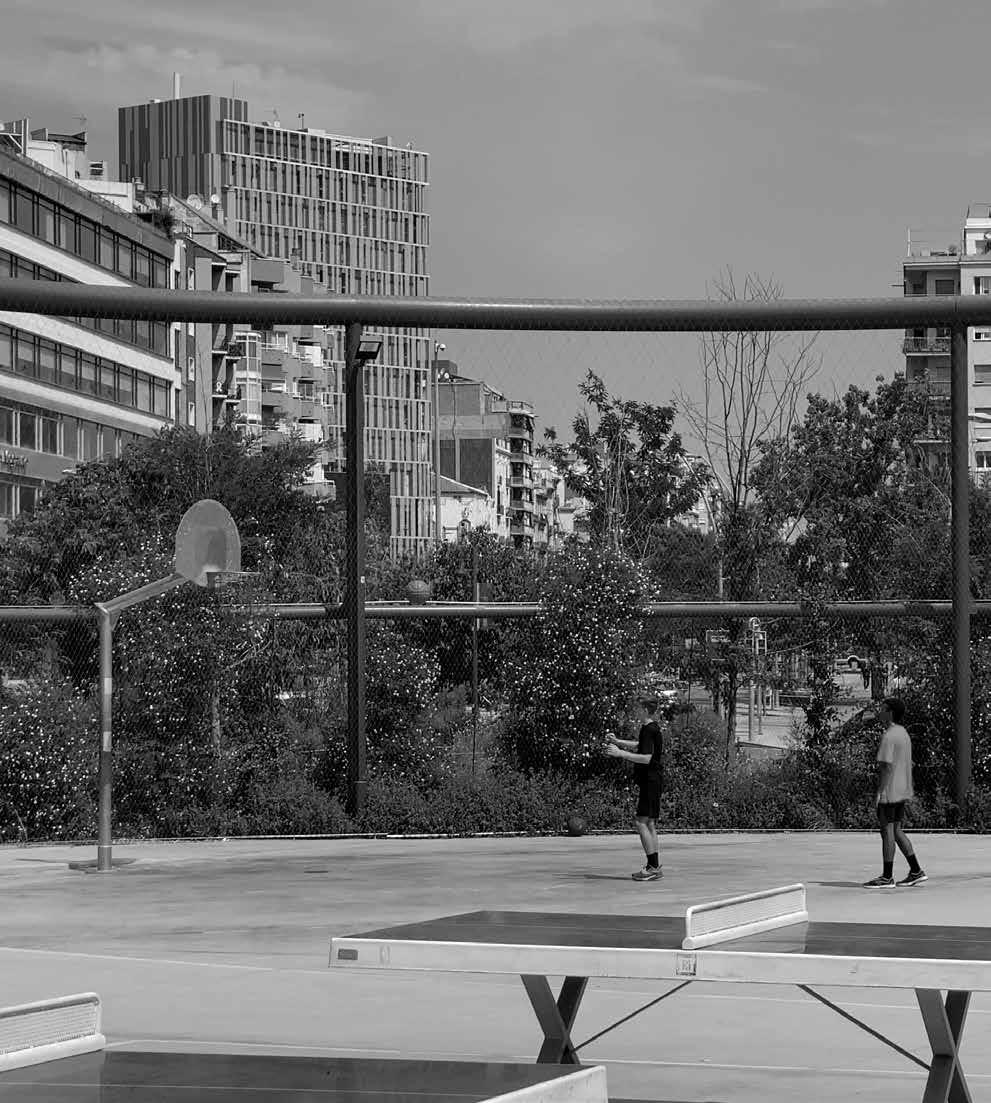
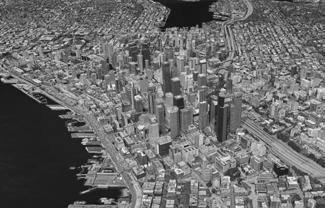
I would like to acknowledge that my site selection is located on the traditional land of the first people of Seattle, the Duwamish people past and present and honor with gratitude the land itself and the Duwamish Tribe. It is on the shared waters of the Coast Salish People of Western Washington, most specifically the Duwamish and Suquamish. I first wanted to start off with a land acknowledgment identifying that we were visitors on the stolen land of the Kalapuya people, Grace’s presentation was amazing and I hope everybody got the chance to see it. I also wanted to take a moment to acknowledge that the site that I’m choosing to work on is located on the traditional land of the people the Duwamish and Suquamish people. This land is connected by shared waters of the coast Salish people. I also wanted to share a program the tribe is running called Real rent Duwamish where you can choose to dedicate $54 a month symbolizing the 54,000 acres of homeland that the Duwamish Tribe signed over to settlers in 1855.

PROJECT STATEMENT
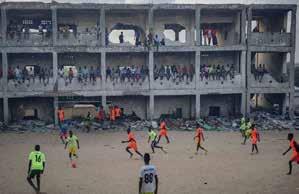
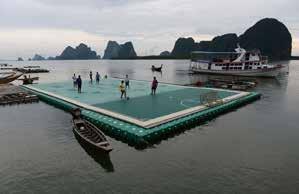
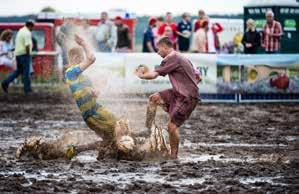
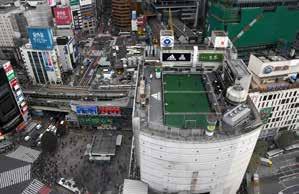
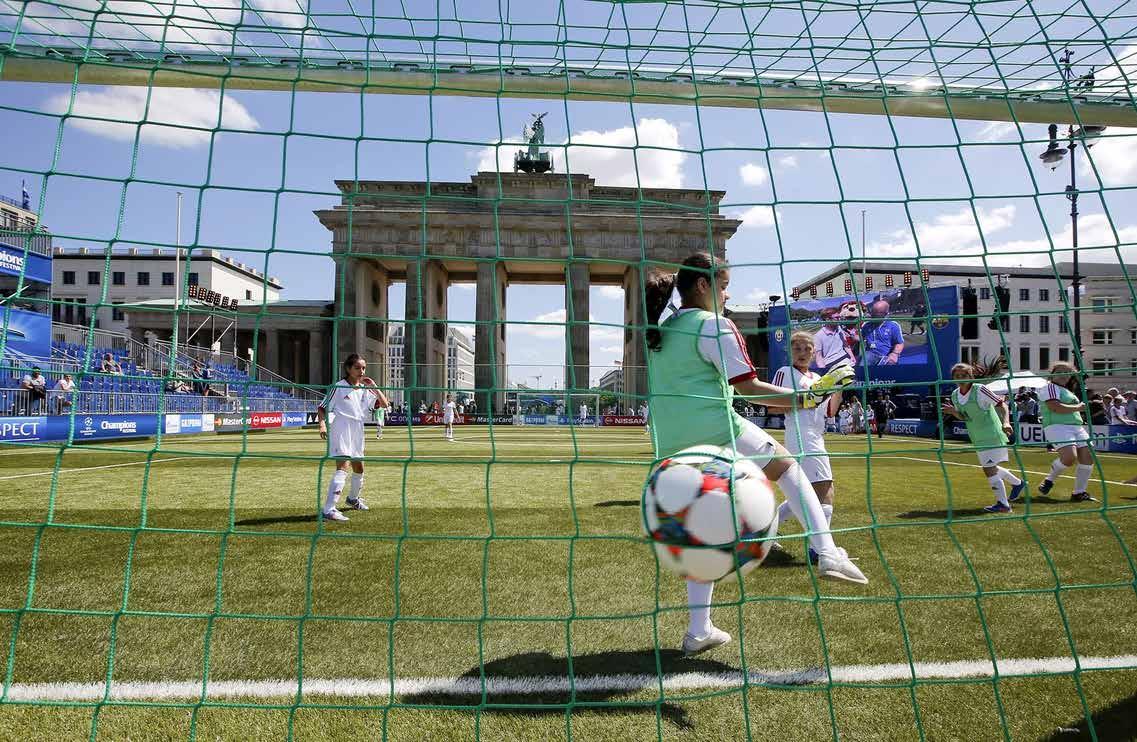
LANDSCAPE ARCHITECTURE HAS PLAYED A ROLE IN HOW WE DESIGN FOR DENSE URBAN ENVIRONMENTS FOR THOUSANDS OF YEARS. CREATING PUBLIC SPACE FOR SOCIAL COHESION, AND OPEN SPACE FOR PUBLIC EXPRESSION IS A VITAL COMPONENT OF THE URBAN FABRIC THAT IS THREATENED DUE TO ENVIRONMENTAL AND SOCIAL CHANGES PROVOKED BY MODERN LIFESTYLES. SPORTS HAVE BEEN A TRADITIONAL INVESTMENT BY GOVERNMENT LEADERSHIP FOR THEIR ABILITY TO PROMOTE COMMUNITY CONNECTIVITY, AND BETTER THE HEALTH OF THE POPULATION.
REGENERATIVE SPORT URBANISM, TAKES INSPIRATION FROM EUROPEAN MODELS OF URBAN REGENERATION USING THE ATHLETE TO DRIVE ECONOMIC DEVELOPMENT. NOW MORE THAN EVER, PROTECTING OPEN SPACE, AND FORCING SPORTS IN THE FACE OF THE URBAN USER MUST BE A HIGHLIGHTED OPPORTUNITY OF URBAN DESIGN, TO ENSURE QUALITY OF LIFE WHILE FIGHTING THE CLIMATE CRISIS AND IMPROVE AMERICAN HEALTH.
5
I N T R O I N T R O
INTRODUCTION
To understand how this project developed, it’s important to highlight the collision of a few main factors regarding Urban Design and Sports history before I define my project. Sports are a product of leisure time, and although they have been a training activity or folk ritual, sport itself has been an exercised right for those that can afford to play in America. The rise of sport is linear to the rise in urbanism in the U.S. due to consistent working hours, and assembled church/employer teams to help build comradery in new way of life in the city. Businessmen in the 1970’s-80’s saw the energy sport brings to people and communities, and the development of sports medicine displayed a huge opportunity for commodification. Participatory joy is overshadowed by privilege and spectatorship today, and money did that. Urban designers now hold a greater responsibility during the climate crisis to build resiliency in our public infrastructure and place making that can help.
My cohort was prompted in our 2nd year of our master’s by instructor Rob Ribe to begin collecting research topics we liked. I chose three main pieces and one case study: an article about the psychological benefits of viewing blooming poppies that elderly folks experienced in China, the long-game that sports arenas and stadiums play in brown field remediation, World Health Organization data on obesity and heart disease, and the CopenHill Ski Slope and 24-hour Waste Incinerator by Bjarke Ingles. To me these topics were all so logically connected.
I wanted to use Landscape Architecture’s ability to promote green social space to better city health, help clean-up some of our human mess, and make people move together because it’s good for them.
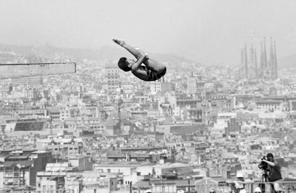
That summer of 2022 I studied Urban Design in Barcelona with my project advisor Ignacio López Busón, and Architect Philip Speranza, and learned about the power of urban design and planning. Barcelona has a long history
6 REGENERATIVE SPORT URBANISM I N T R O I N T R O
INTRODUCTION
of systems thinking, with the design of the grid by Ildefons Cerdà in the 19th century, and proposed Superblock model by Salvador Rueda in 1987. Barcelona Superblocks are a design goal that revolves around taking back the street from the privately owned vehicle and making the street public space. The city has struggled with overcrowding and environmental degradation with severe heat waves and air pollution thanks to climate change and tourism in the area.
This model of cutting off streets grew businesses because of pedestrian travel, decreased noise pollution in some areas by 4 decibels, has decreased private vehicle use by 92%, and continues to provide more habitat for local species through ecologically diversifying street planters and trees. Superblocks make public space when there is no room for it, a unique compaction and density issue of Barcelona, but if we were to apply this to the United States what would this look like?
This city’s vibrant community is something that
cannot be translated directly to the U.S. for so many obvious reasons, but there were similarities that I felt with my volleyball community. I went on a run during my last week in the city, and finally found some stairs to do some sprinting. An older woman stopped me and was speaking in Catalan about how horrible my posture was, I blame the studio hours on a stool and computer. She was so kind and warm, and told me she had been a runner for 30 years. Sport community is everywhere and knows no language. This interaction only reiterated why I wanted to start thinking about this project.
After this I started to break down design goals and understanding my process as the athlete; stairs to cross terrain and topography were a sporting instrument we would use in college that required no money for training. One of the most important sparks for design occurred while walking along the diagonal. If you hang out long enough, you will find local runners running towards the transit in their path. Why? We design these transit areas with grass
7 DELANEY HOPEN - MLA
INTRODUCTION
lawn underneath, a tactic to help indicate a vehicular line (ironically, so we stay out of the way of the tracks), to help potentially collect runoff and feed it back into the aquifer as it runs off adjacent hardscapes, and then plant large canopy trees on the edges so waiting for transit can be more pleasant, and while keeping that understory lawn alive. This is what an urban planner sees.
The athlete sees: I can run in the shade so I won’t overheat or get sunburnt, the air will be a little cooler from the trees underneath, and now my knees won’t hurt because I can run on shallow flat lawn, I’ll just hop out the way once I see the train coming.
Not genius just logical, athletes are efficient.
Living in Barcelona for 3-months prompted conceptual thinking about how the ground user in a city brings energy as a pedestrian. Throughout my life as a collegiate athlete and growing up so intertwined in sport,
I’ve been able to witness all the positive biproducts that long term sport participation has had on my family for generations, the communities and resilience it provides throughout all cultures and people, and the longevity of health for the individual.
In the same way I grew up watching my dad go to pick up basketball games after work at our local gym and watching my grandparents golf with their best friends from high school every weekend for 30 years, I began to consider just how tight athletic bonds are and they began with place.
I owe so much of my own experience to my family, and the culture they provided that valued sport. I played because my family did, and it was always in my face, so what if sport was in the urban user’s face for participation, not for spectatorship? It’s a very different conceptual model than the American Sport industry with the media that exists on our devices, we must let streets be our stadiums arenas courts and fields.
8 REGENERATIVE SPORT URBANISM I N T R O I N T R O
INTRODUCTION
Sport and exercise help in relieving anxiety, depression, lowering risk of heart disease and obesity, improves problem solving skills, makes you work as a team, embraces competition, improves focus abilities for individuals with ADHD, assists in building individual selfconfidence, strength building, practices communication skills between teammates, builds leadership... shall I go on?
While spending the summer alone on foot walking around Barcelona, Dubrovnik, London, and Oslo, I explored different literature including Richard Louv’s Last Child in the Woods, and a portion of Li Qing’s Forest Bathing: How Trees
Can Help You Find Health and Happiness in the collection
Nature is a Human Right edited by Ellen Miles, and ironically felt anxiety begin to renter my body as a pedestrian by the time I was walking to Big Ben from my hostel, after every walk previously felt like a hike in Dubrovnik outside the old city. Safe to say, Barcelona taught me a big lesson about dense urban design that London could benefit from, Dubrovnik’s rocky terrain is just a different model, and Oslo
felt like home in Seattle.
Richard Louv touched on the impacts of our lack of freedom to explore the outdoors is having on our American kids. Focusing struggles begin at the age of 3, with medications for ADHD being prescribed as early as pre-school. Li Qing touched just how much of our animal is still left in us, and that when all our senses are only experiencing greys and hardscapes of the urban environment our instincts that crave color fruit on a tree, or flowers, psychologically is no wonder we are struggling. We are at cross-roads where our urban environment must be more than the urban environment, but a park, an urban forest, and a playground, and I think a sport facility. Reading about these topics helped me gain awareness as I moved throughout these cities. When I got back to the U.S., where I drive my Ford Truck everywhere and we work more than we live, I began assembling my project Regenerative Sport Urbanism.
9 DELANEY HOPEN - MLA
INTRODUCTION
Regenerative Sport Urbanism is the runner on the train lines, Hoopfest in Spokane that brings in 42 billion dollars every June, my brothers making a game of foursquare out of the square slabs of driveway pavers at our family home that eventually recruited more friends, the set of stairs I’ve ran by the beach since I was 15, the gym where I met my mentor Amoreena Miller a proud and successful woman in Architecture in Seattle. I don’t view this project as a 22-month temporary exploration, or a box to check for a master’s degree but rather a long-term work that revolves around the positive influence urban design and planning could impose on human health in cities if we as designers saw the potential that everyone at this University sees for Sports Marketing and that flashy Swoosh symbol. This is Draft 1.0
10 REGENERATIVE SPORT URBANISM I N T R O I N T R O
INTRODUCTION
11 DELANEY HOPEN - MLA
RESEARCH
This phase is composed of urban design research at the global scale. This section seeks to understand the differences between the way European cities have approached design public space, and sports to promote public health. In turn, this impacts cultural opinions and familiarity with specific sports relating to climate and geographic location (i.e. distance from water bodies, mountains, fields, etc.). This research paints an overall picture of how cities have controlled public relationship with urban exercise facilities.
FRAMEWORK
Phase two zooms in to city scale, applies the research and understanding of various major cities by selecting outliers through statistical analysis. Successful European cities that have created sports culture, have a tradition of valuing certain sports, or excel in urban design can are identified and used as baseline measurements. These baselines are then compared to one major city in each of the lower 50 states in America.
Statistical analysis then feeds into spatial analysis. Geographic Information Systems (GIS) are then used to understand how the physical organization of the city plays into or against this statistical analysis. This creates a dual-supported narrative of how each city is scored and ranked in comparison to one another aimed directly towards public health and exercise.
DESIGN
The last phase is now provided with specific problems, locations of pressure points within the city system, as well as areas of opportunity. Design application considers the uniqueness of the city, and builds into existing culture and infrastructure, while it's main driver is accessible sports, exercise, and community cohesion in the landscape.
12 01 02 03
METHODOLOGY

13
01 02 03
METHODOLOGY
WHO DESIGNS FOR SPORT?
WHO PLANS FOR SPORT?
14
15
HISTORY
16
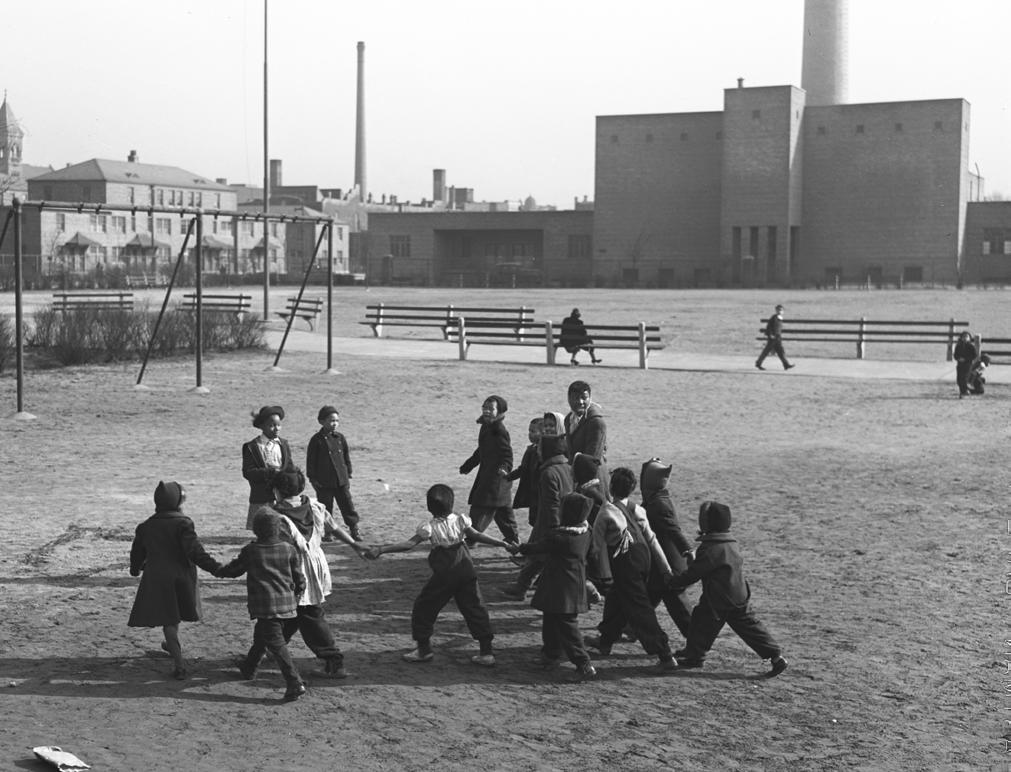
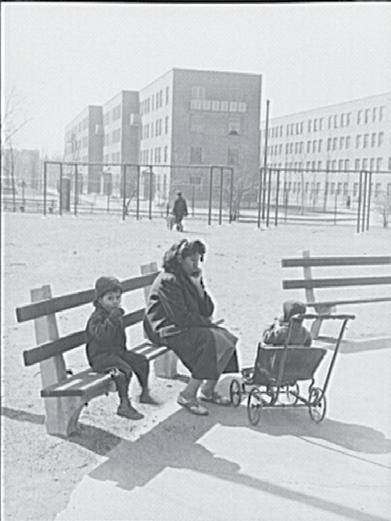
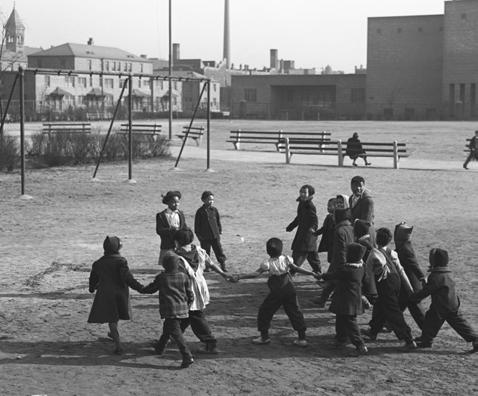
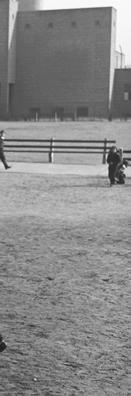
MADDEN PARK CHICAGO IL, 1906
WHO DESIGNS FOR SPORT?
To understand the history of sport it helps to understand how we got here to the US and our $39 billion industry that it currently is.
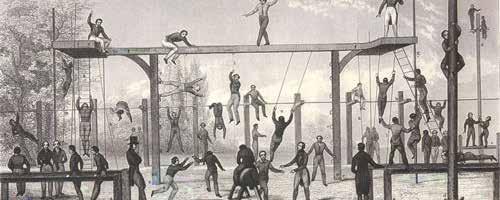
Sport as a folk activity, traditional ritual, and/or strength and endurance training as some sort of game has been embedded into every culture, but the industry really started to grow into our modern day beast with the rise of urbanism.
This linear trend of people moving to cities to have consistent working hours allowed for more flexibility and leisure time more time for self-care more time to have fun after studying the history of sport for the public user the city of Chicago is an incredibly prominent example of what I would view as the weaponization of sport.
During World War One there was an influx of people moving out of the South and into the cities North like Chicago. It became rapidly overcrowded and there wasn’t enough quality public space or quality living space for people who weren’t white or wealthy. One of the best part of sport is the flexibility that openness carries for the athlete and now a pick up game can begin with the bare minimum.
18
IDA B WELL HOUSING PROJECT PLAYGROUND HTTP://WWW.LOC.GOV/
MADDEN PARK CHICAGO IL, 1906
HISTORY
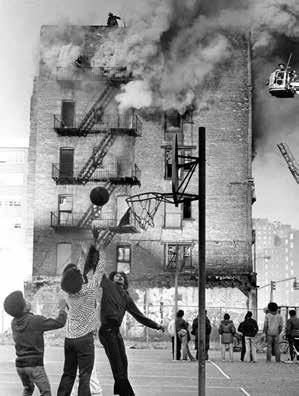
"These sporting landscapes of hope could be a conduit for racial advancement and interracial cooperation, but they could just as easily become stark reminders of the various ways the North perpetuated and even exacerbated the racial inequalities that migrants had hoped to escape, hindering their full integration into and enjoyment of modern urban environments."
-Brian McCammack, Landscapes for Sport
Sports in Chicago played a major role in finding identity in the landscape for the black community during a time of extreme separation and redlining let’s seasonally it would get a little golden Chicago so now the environment played a role in providing a space for identity and the unequal access per conditions in existing field houses only permitted to use by white wealthy residents stressed and the lack of equity in a system that was strategically starving people of their right to gather. The tie people have to place was not only in poor condition, but would also be strategically stripped away by the impacts of seasonality. This systemic racism and access issue in planning our American cities is just as present today as it was in the 20th century.
America decided to sport in the 1970s only stressed in a rationale that the people that can’t afford to play sport together deserve to and that if you can’t you better be better than everybody else physically and performing as such. That’s the only way you’ll get quality access to a space.
"The
physical environment (i.e. nature and it's built forms) has been key to sport activities, which have been motivated by politics, recreation, amusement, and pleasure, camaraderie, and concerns for physical and mental health. Landscapes have been shaped and environments have been used for physical exercise and sport in all parts of the world at all times."
-Sonja Dümpelmann, Landscapes for Sport
IDA B WELL HOUSING PROJECT PLAYGROUND HTTP://WWW.LOC.GOV/
HTTPS://WWW.FLICKR.COM/PHOTOS/VAVEL/8193687088
1906
1992 2022

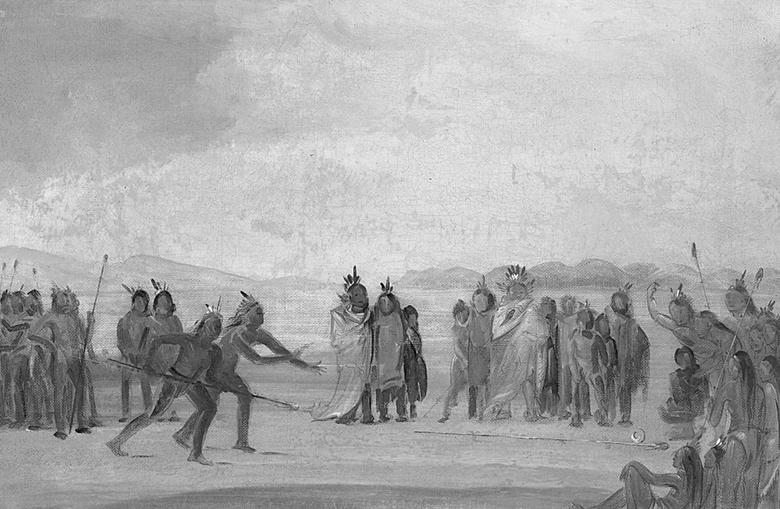
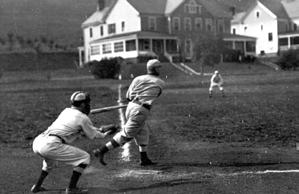
1885 HTTPS://WWW.NPS.GOV/PLACES/000/WHY-DID-ARMY-LIFE-IMPROVE-IN-THE-LATE-1800S.HTM HTTPS://WWW.FORBES.COM/SITES/MIKEDOJC/2020/07/13/USGA-GOLF-MUSEUM-ACQUIRES-TREASURETROVE-OF-VINTAGE-GOLF-PHOTOGRAPHY/?SH=6983AF4636D7 HTTPS://EN.WIKIPEDIA.ORG/WIKI/CHUNKEY#/MEDIA/FILE:CATLIN_TCHUNG-KEE,_A_MANDAN_GAME_ PLAYED_WITH_A_RING_AND_POLE_01.JPG 600 CE HTTPS://WWW.FLICKR.COM/PHOTOS/VAVEL/8193687088 1975 1850 1700
"70% of kids stop playing sports by the age of 13."
-National Alliance of Youth Sports, 2021
70% of American kids stop playing sports in Middle school. This is a huge number that is really heart breaking to me, but I can honestly say I can see the impacts of this in my work coaching in the community. I think in a lot of ways we’ve made it this way and it’s only getting worse because life is getting expensive the literature only scratches the surface of the reality of the situation that’s really messy and complicated financially.
+
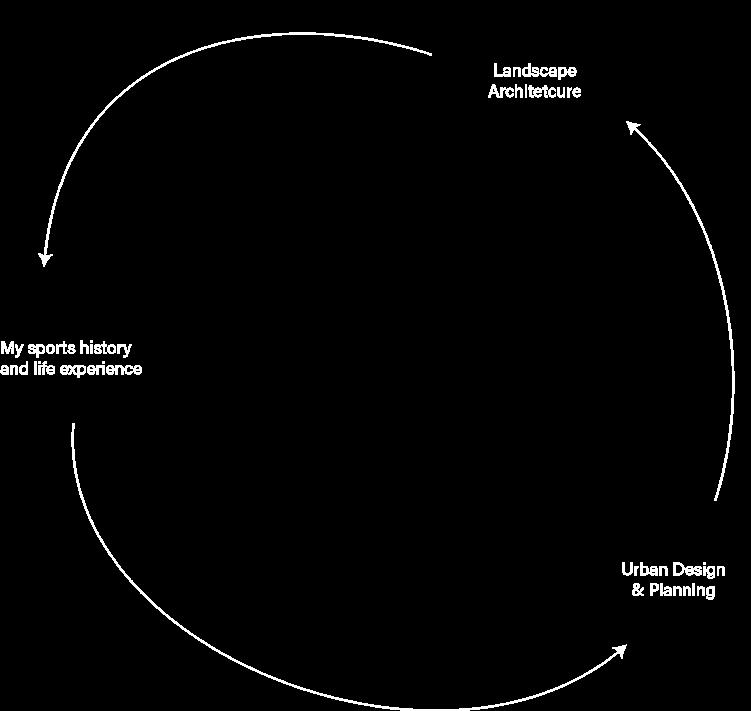
So from this my project regenerative support urbanism was born from the intersection of landscape architecture and the designers impact on placemaking the urban planners responsibility to create equitable opportunity and shared environments and my own lifelong love of sport and the impact I’ve watched it have on the lives of the individual.
REGENERATIVE SPORT URBANISM
HOW CAN A METHODOLOGY BE APPLIED WHEN DESIGNING FOR URBAN SPORT OPPORTUNITIES?
26 REGENERATIVE SPORT URBANISM
GOALS
• FIND LOCATION POTENTIALS IN A SPECIFIC SYSTEM
• BRING PEOPLE TO THE STREETS TO HELP LOCAL BUSINESS
• PROMOTE PERSONAL MOVEMENT
• ENCOURAGE AND PROVIDE SPACE FOR GROUP ACTIVITY
27 DELANEY HOPEN - MLA
Temporary Urbanism
Everyday Urbanism
Highlights the importance of vacancy and underutilized urban space for various activities, events, and installations allowing for experimentation and adaptation.
Ordinary, daily activities of urban residents, which focuses on the needs of those activities in design.
Tactical Urbanism
Messy Urbanism
Bottom-Up Placemaking
Focused on grassroots and community-led initiatives that aim to improve urban spaces through low-cost, temporary interventions.
Challenges the idea of neatness of orderly planning by embracing complexity.
Inviting local communities into shaping urban environments, highlighting the importance of inclusive participation, collaboration, empowerment of residents in determining character and identity of their neighborhoods and public spaces.
URBANISM THEORY
28 REGENERATIVE SPORT URBANISM
REGENERATIVE SPORT URBANISM
Planning and designing with the thought of using public space for play, and considers how the system can support communal sport-placemaking and encourage outdoor exercise.
29 DELANEY HOPEN - MLA
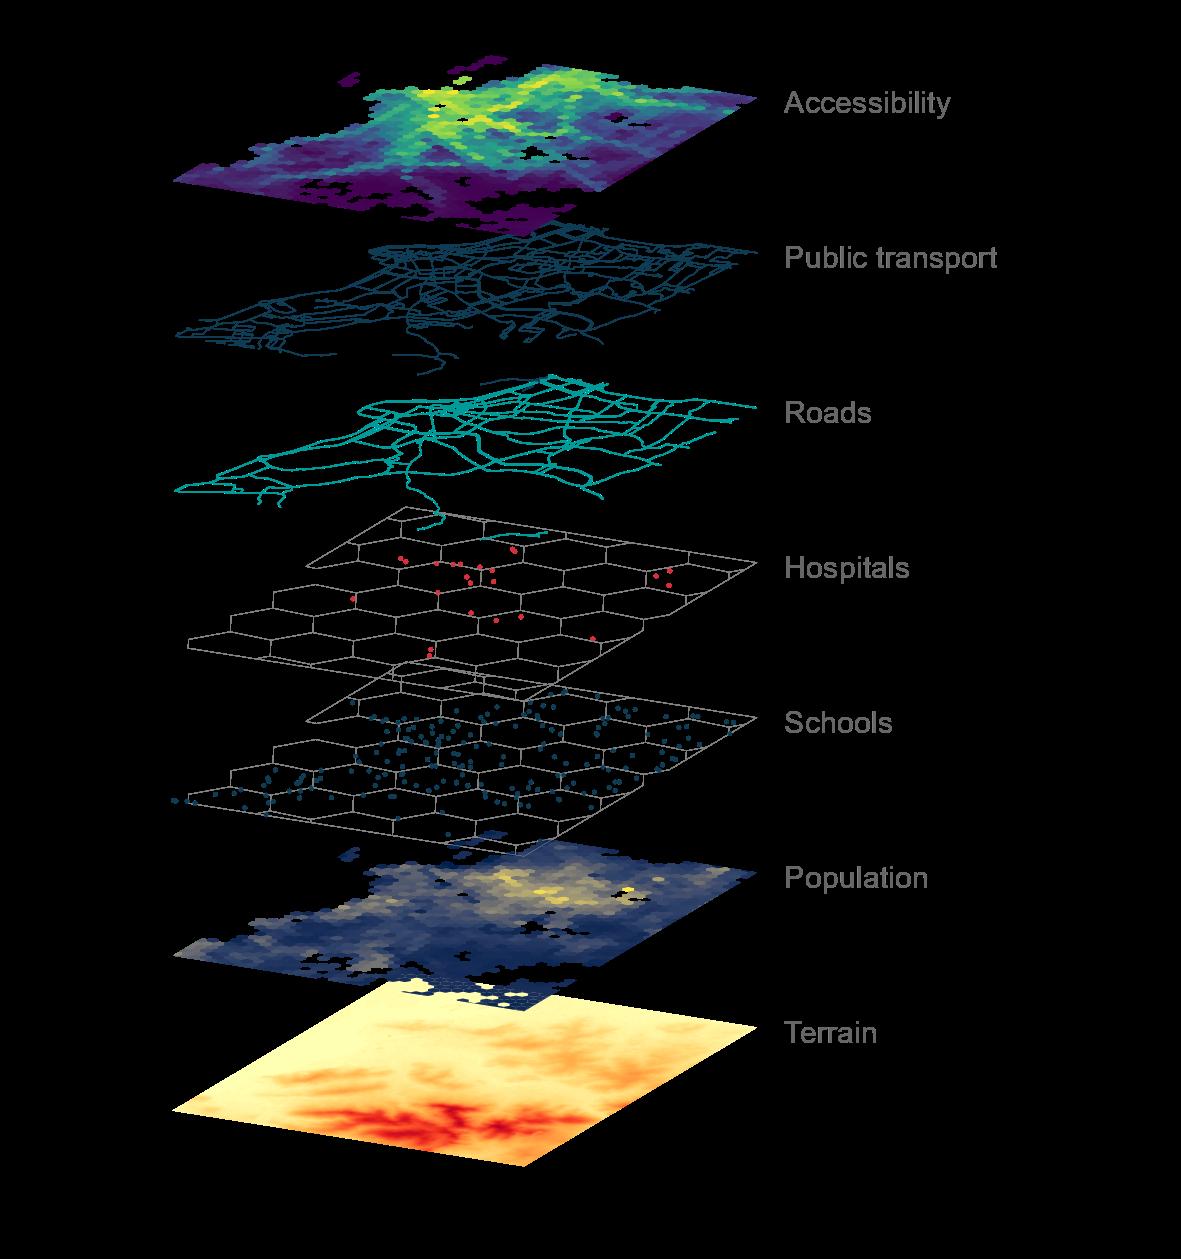
30 REGENERATIVE SPORT URBANISM HTTPS://WWW.URBANDEMOGRAPHICS.ORG/POST/FIGURES-MAP-LAYERS-R/
GIS: Geographic Information Systems
The isolation of information and data tied directly to a location which can then be overlayed to understand the greater picture of the system. Commonly used via ArcGIS, and QGIS softwares. GIS analysis helps expose patterns in the landscape, sometimes but not always, as visible to human perspective-view.
WHY GIS?
31 DELANEY HOPEN - MLA
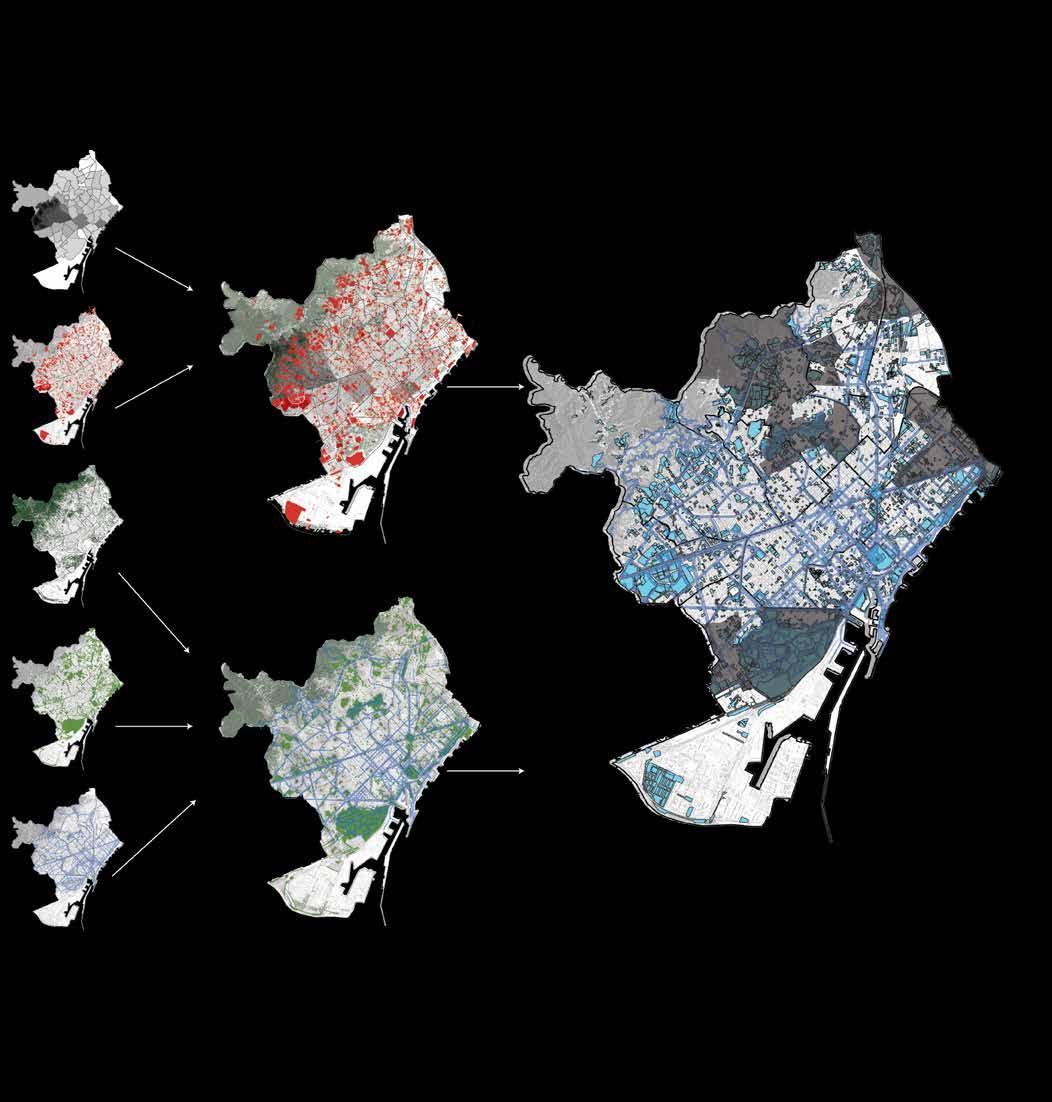
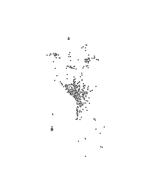
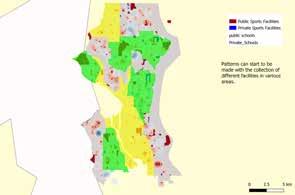
BARCELONA GIS LAYERS
Through GIS analysis, we were able to filter different areas of life in the city of Barcelona. Income, Sports facilities including schools, NDVI Vegetation, Parks and green open space, and popular running paths tracked by runners using the app Strava. This data can help filter areas that have a lot of sports activities currently, and those that don't pertaining to socioeconomic issues, space availability, and the impacts of low green space in an urban setting.

32
Parks NDVI Vegetation Sports Facilities Income Strava Running
BCN FRAMEWORK
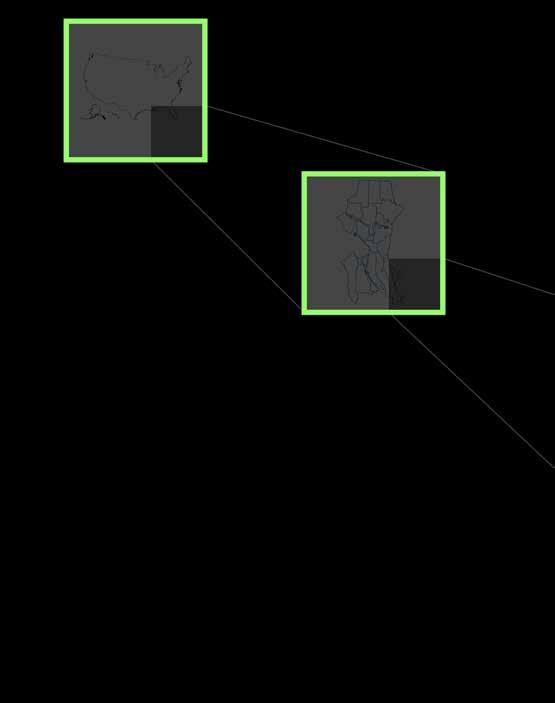
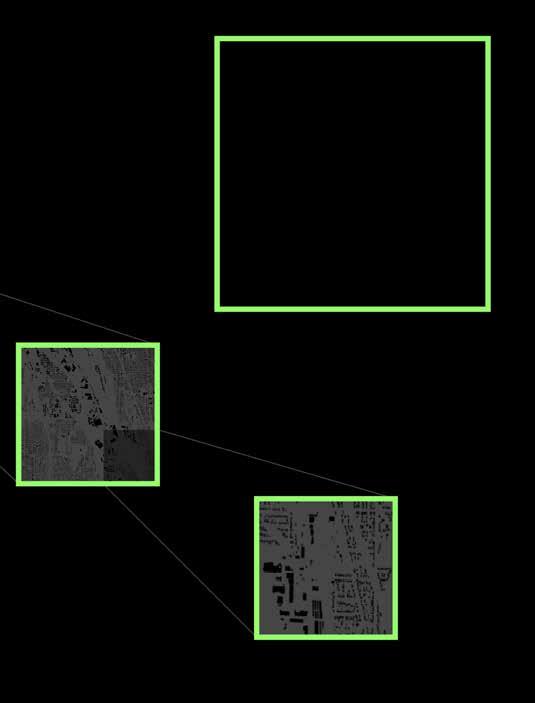
FRAMEWORK
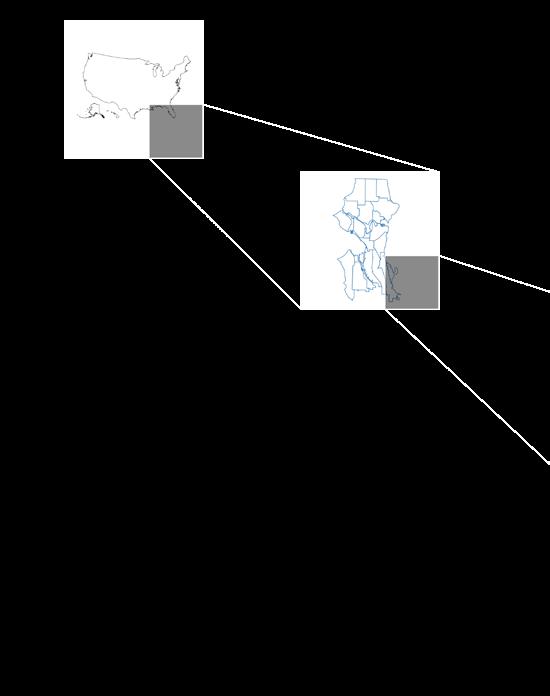
A METHODOLOGY NATIONAL SCALE 1. SET SCALE 2. SET BOUNDARY 3. SIFT YOUR DATA 4. SUMMARIZE 5. ZOOM CITY SCALE 1. SET SCALE 2. SET BOUNDARY 3. SIFT YOUR DATA 4. SUMMARIZE 5. ZOOM DISTRICT SCALE 1. SET SCALE 2. SET BOUNDARY 3. SIFT YOUR DATA 4. SUMMARIZE 5. ZOOM NEIGHBORHOOD 1. SET SCALE 2. SET BOUNDARY 3. SIFT YOUR 4. SUMMARIZE 5. DESIGN 01 02
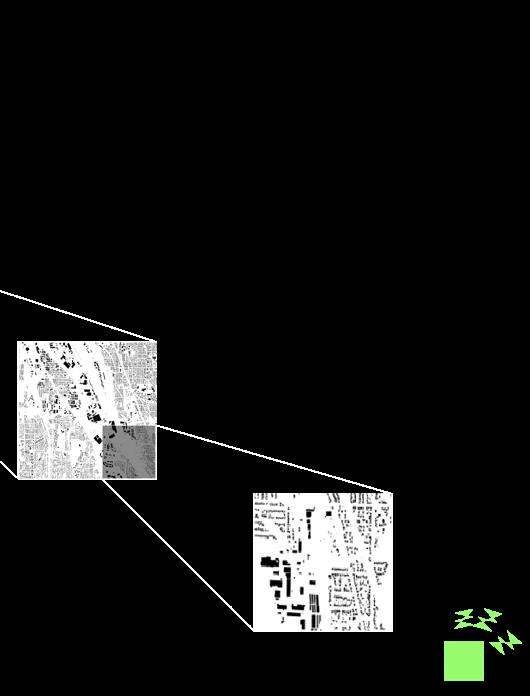
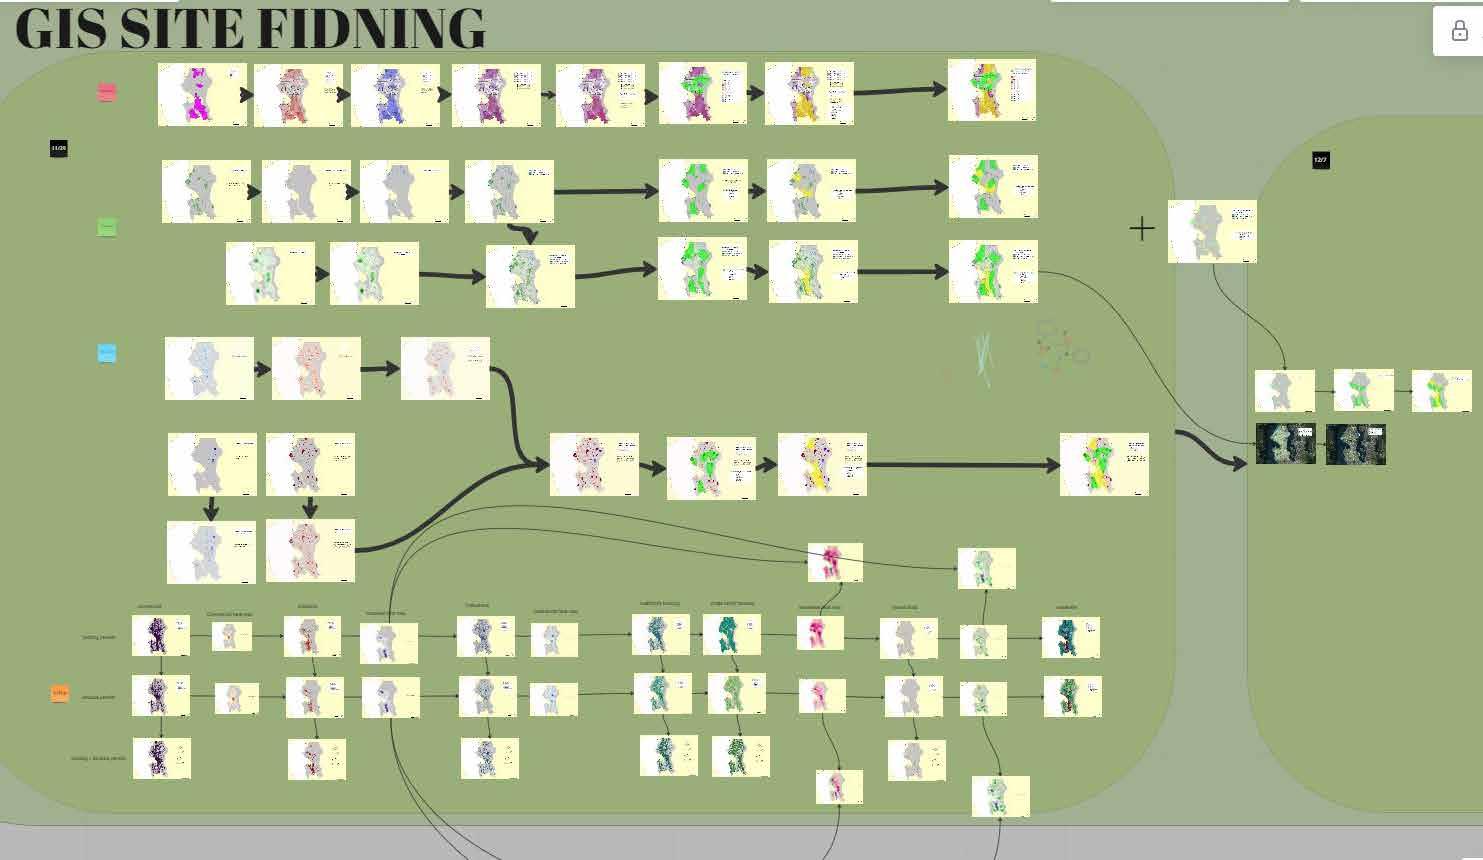
So what you’re seeing is a rough project map that follows the same repetitive process of four rounds of filtered data analysis at every single scale.
35
NEIGHBORHOOD SCALE SCALE BOUNDARY YOUR DATA SUMMARIZE DESIGN
METHODOLOGY
03 04
36 01 02 A METHODOLOGY
The simplicity that was actually not that simple at all was that the same cycle of information was sought out at every single scale and it just looks a little different at each scale the environment, the economics, the demographics, the local health, and the infrastructure all contribute to access to quality sport and exercise space in an urban environment.
1. ENVIRONMENT 2. ECONOMICS 3. DEMOGRAPHICS 4. HEALTH 5. INFRASTRUCTURE DATA TO LOOK FOR 03 METHODOLOGY 04
PHASE 00: SPORTS AND URBANISM
38 REGENERATIVE SPORT URBANISM
RESEARCH
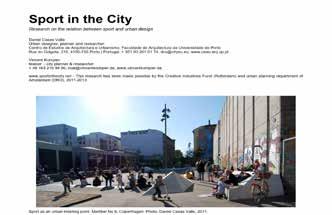
So to kick off the so-called simple and logical task I needed to get to know the beast I was working with I began researching a vast amount of topics pertaining to sports design urbanism landscape architecture and economics in January of 2022. These were some of the literature and data samples that were the most influential of my readings that I used in this process if you’re interested in the intersection of sport and landscape I could not recommend more Sonja Dumplemann’s landscape for sport book she edited it’s so fun and it’s so informative about just how much place for exercise connects to our society as it progresses. this topic is a rabbit hole so I could go on and on about it, but the most direction I received as far as design goals and guidelines I received from Daniel Casas Valle an urban design researcher and planner from Portugal that actually provided some public sport space design details that I will get into later, and stressed that sport space is always implemented as an architectural left over.
39 DELANEY HOPEN - MLA
RESEARCH
RESEARCH


RESEARCH

CASE STUDY
HOOPFEST, SPOKANE WA
Part of my research included looking at if this process of using public sporting to generate community energy and local business revenue is happening and this is just one example I looked at a lot of different precedents and it kind of made me glaze over the fact that this one is in our backyard and I’ve been to it.
Highly recommend even just walking through visiting it’s very fun there’s a lot of little mini events and pop ups. But, in 1990 a group of 5 went around to local businesses making up three blocks of downtown Spokane to get them to sign off on a petition to host a three day basketball tournament they agreed with the hope of getting more business and shut down the traffic of the streets in June.
"HOOPFEST WEEKEND BRINGS IN ABOUT A 47-MILLION-DOLLAR IMPACT TO THE INLAND NORTHWEST EVERY SINGLE JUNE SINCE 1990."
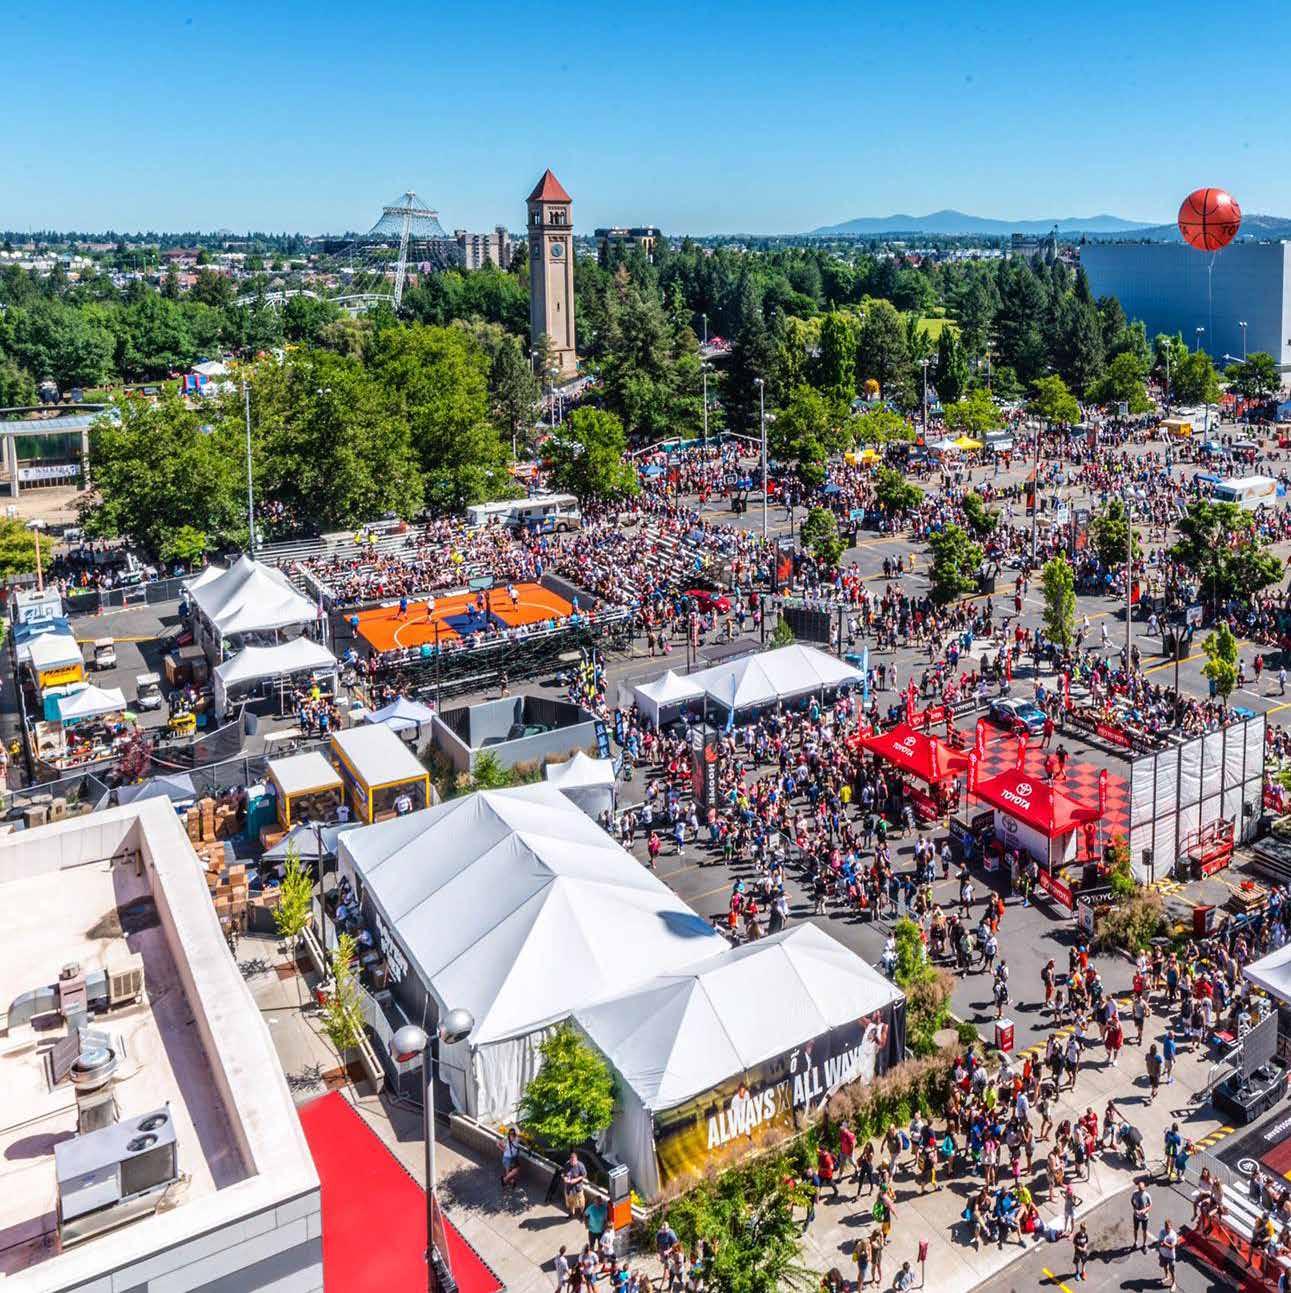
-Spokanehoopfest.net
HTTPS://WWW.FACEBOOK.COM/MYKCRAWFORDPHOTOGRAPHY
6,000 TEAMS
3,000 VOLUNTEERS
225,000 FANS
425 COURTS
45 CITY BLOCKS
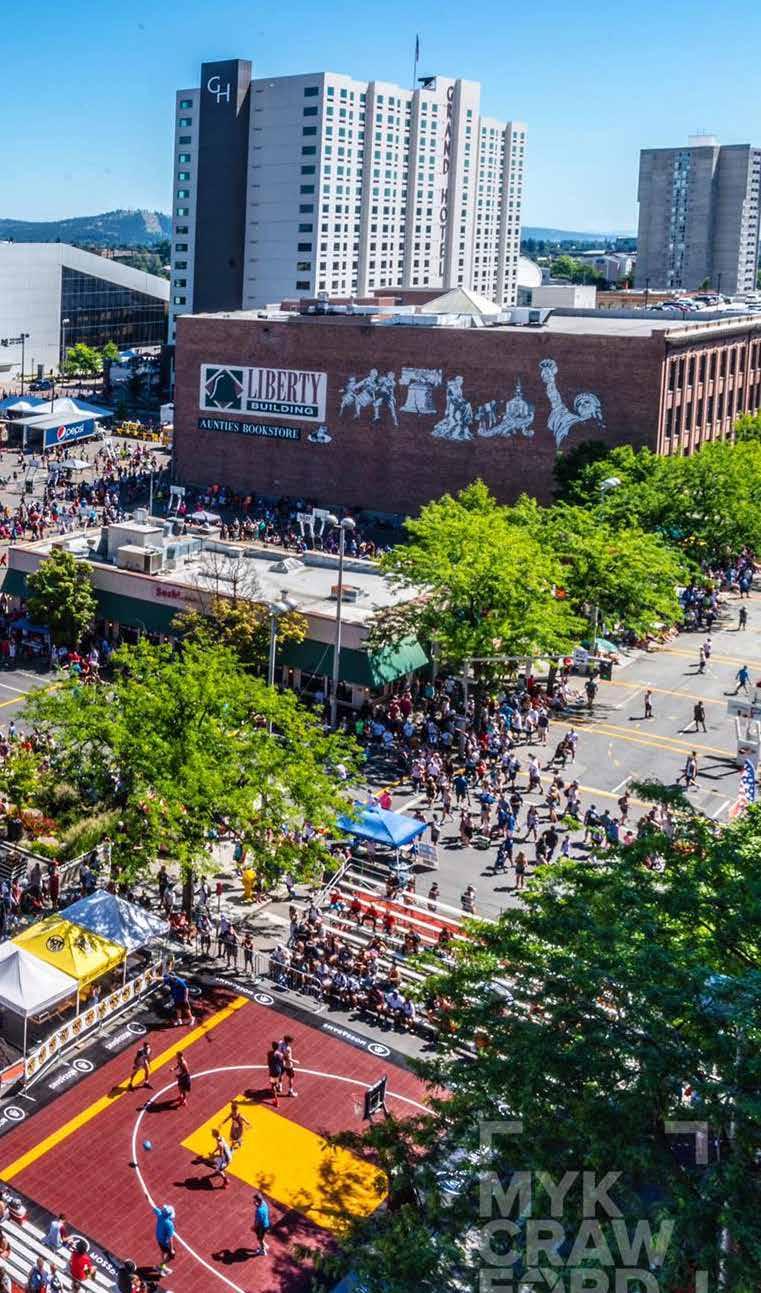
Today who hoopfest generates about 47 million to the entire inland northwest not just Spokane and has expanded to 45 city blocks this seasonal influx and reputation paired with Gonzaga’s basketball success has helped shape the riverfront development in Spokane and create a new reputation for the city.
46
REGENERATIVE SPORT URBANISM SCALE 01
ANALYSIS SCALE 01: THE NATIONAL SCALE
Now that I feel grounded in possibility I needed to start analyzing how it could apply all of this research on an American sport context into a digestible methodology
47 ANALYSIS
SPORTS
ECONOMICS ENVIRONMENT DEMOGRAPHICS
$ TOWARDS SCHOOLS
$ GPU
AIR POLLUTION PPM
WALKSCORE/BIKESCORE
DAYS OF SUN
POPULATION
DENSITY
48
DEMOGRAPHICS INFRASTRUCTURE HEALTH
FACILITIES
PARKSCORE OBESITY HEART DISEASE
49
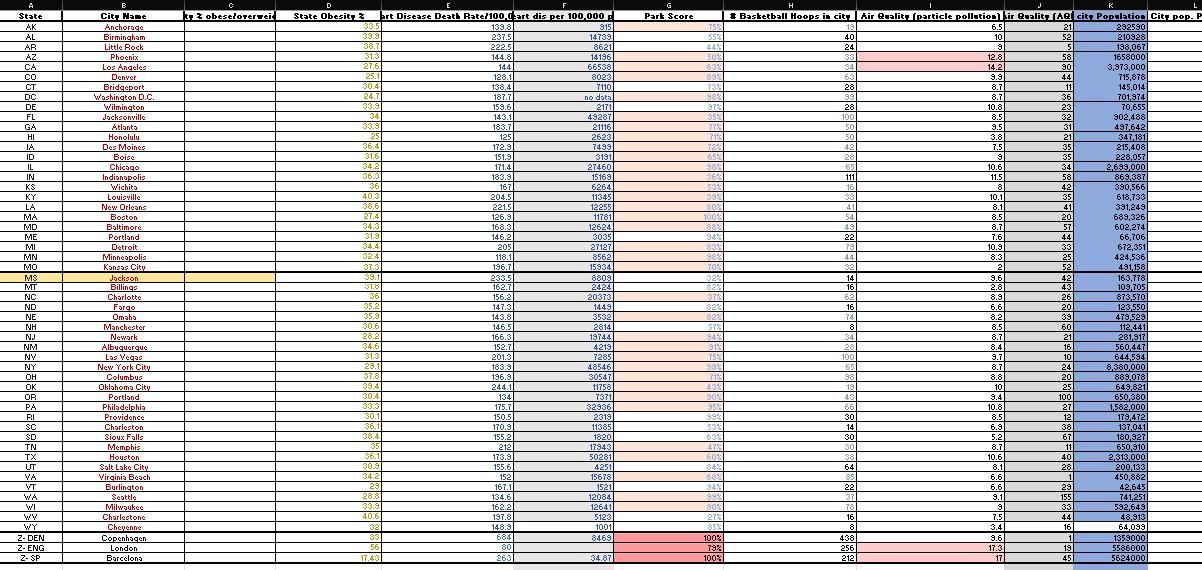
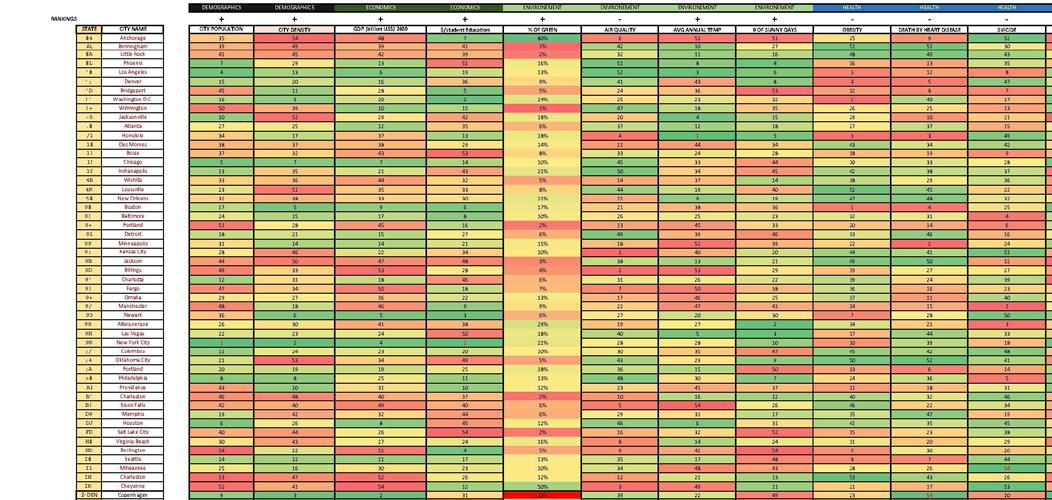
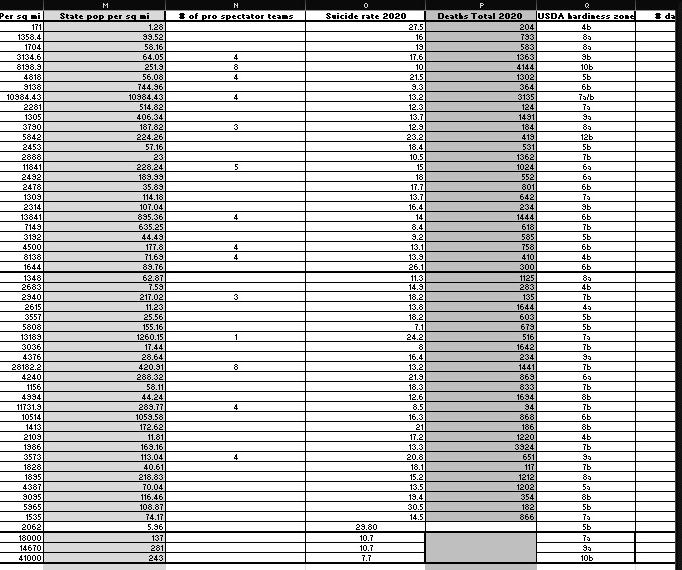
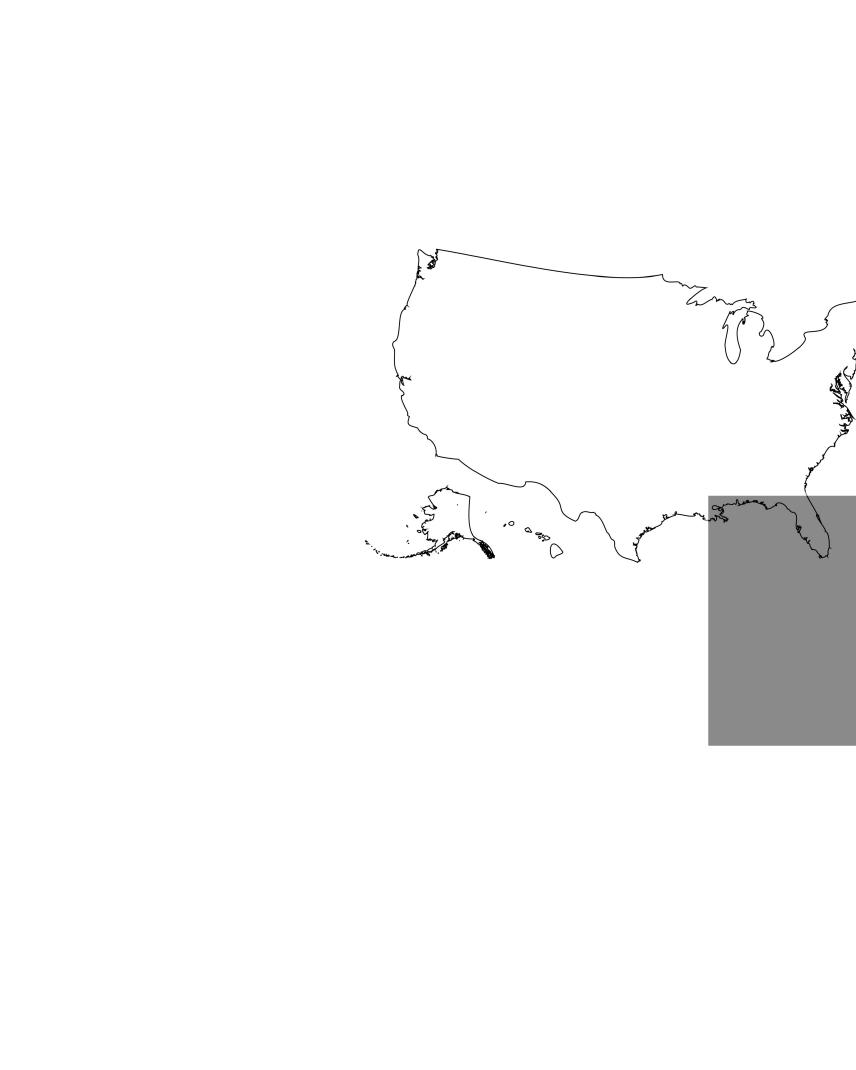
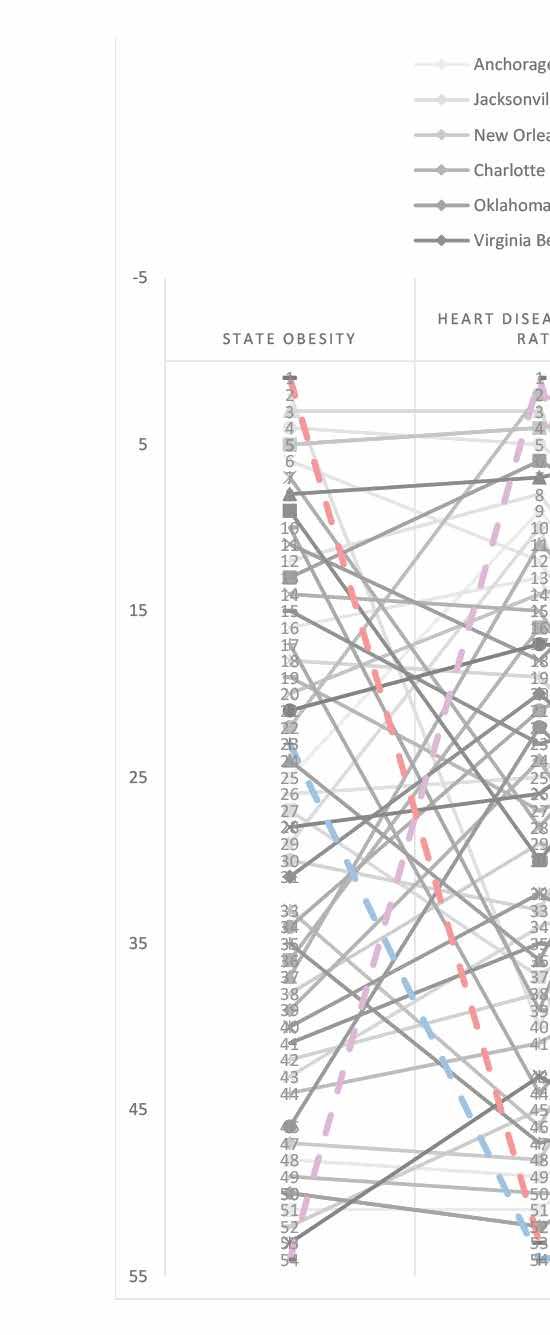
I have been advised by multiple people to let you know up front that I don’t expect you to understand any of this because that was kind of my job but my process began for example by trying to look at every major city across the United States and how some factors included census data like obesity how many people die from heart disease every year air pollution walkability park score, etc.
This data sifting took a few months and a lot of conceptual thinking as well visualization attempts in tableau and excel I wanted the data to be relevant so
I what I did, in the shortest summary ever of a couple months of my life was evenly rank them compared to one another to start seeing how those categories that are adding up compare Los Angeles to West Virginia for example.
Some factors included census data, NOAA and EPA.

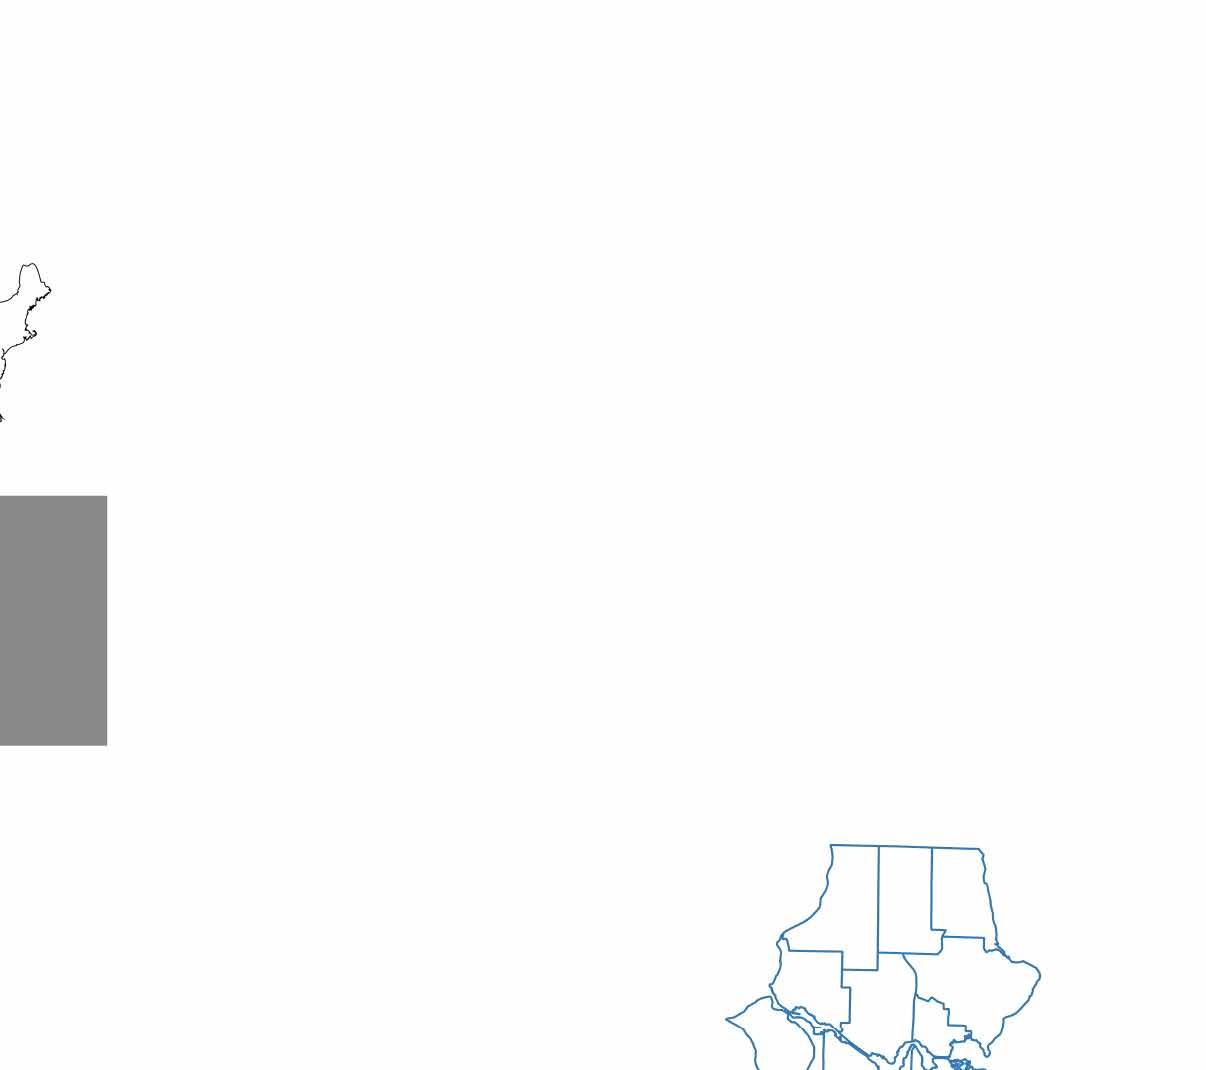
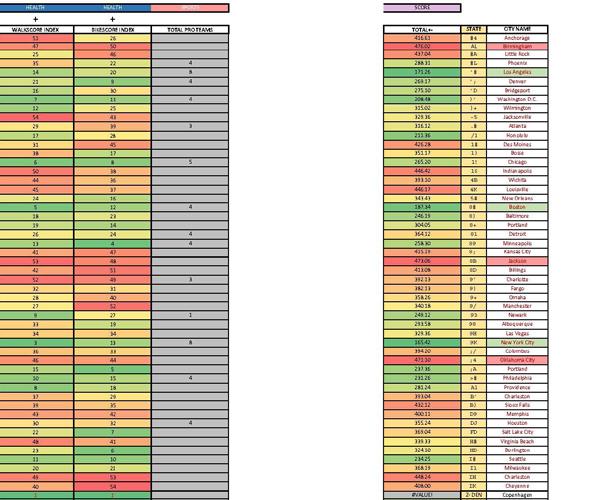
LOW HIGH 1. NEW YORK, NY 2. BOSTON, MA 3. LOS ANGELES, CA 4. HONOLULU, HI 5. WASHINGTON D.C. 46. CHARLESTON, WV 47. LOUISVILLE, KY 48. OKLAHOMA CITY, OK
BIRMINGHAM, AL
JACKSON, MS
49.
50.
FINDINGS
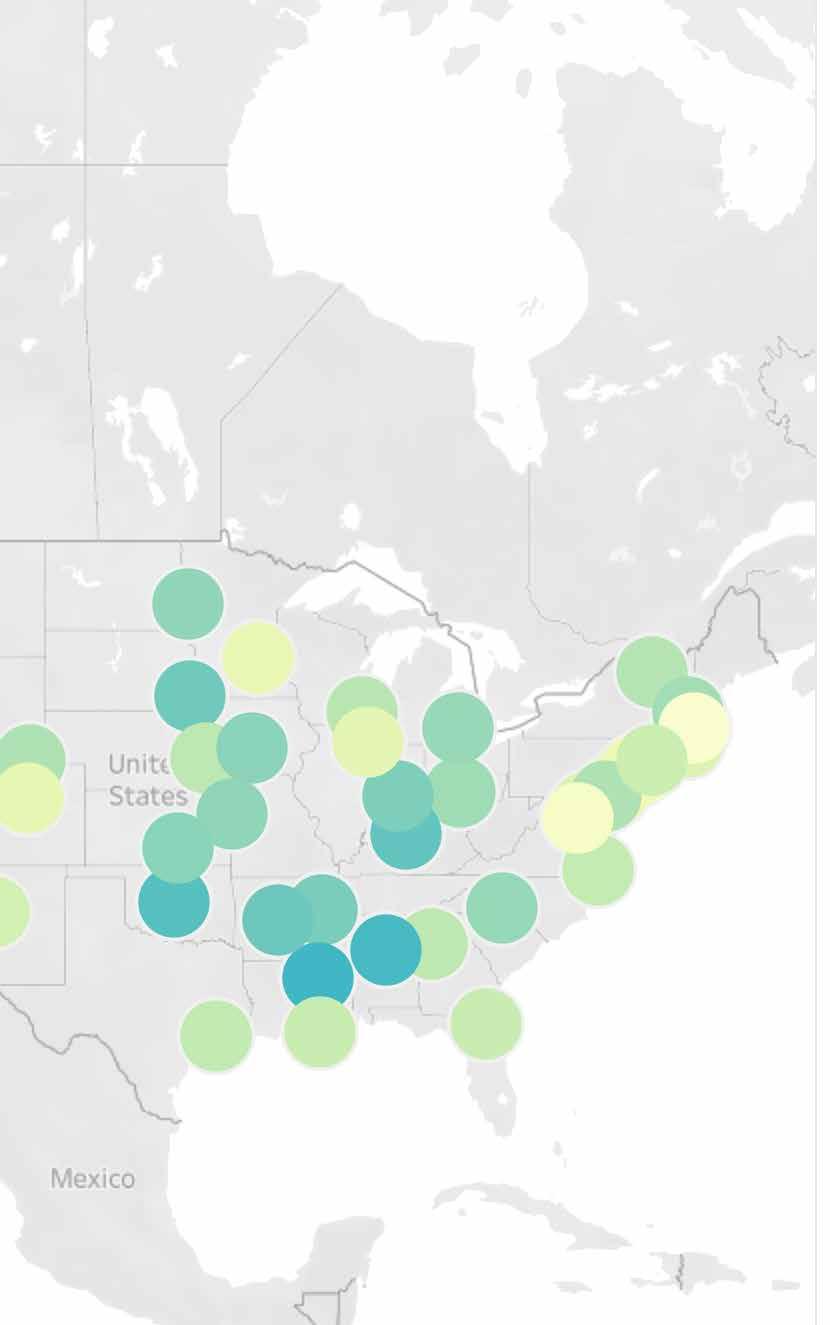
As mentioned previously in my project the analysis uses these categories to begin organizing what areas could impact healthy living at the national level, so heres what I found:
The south deeply struggles with issue of health pertaining to all of these categories, not saying they don’t hold impactful sport culture or communities, but there is significant work to be done in many of their sectors, most notably obesity and heart disease. Some of the best scores are so great, if you can afford to live there!!
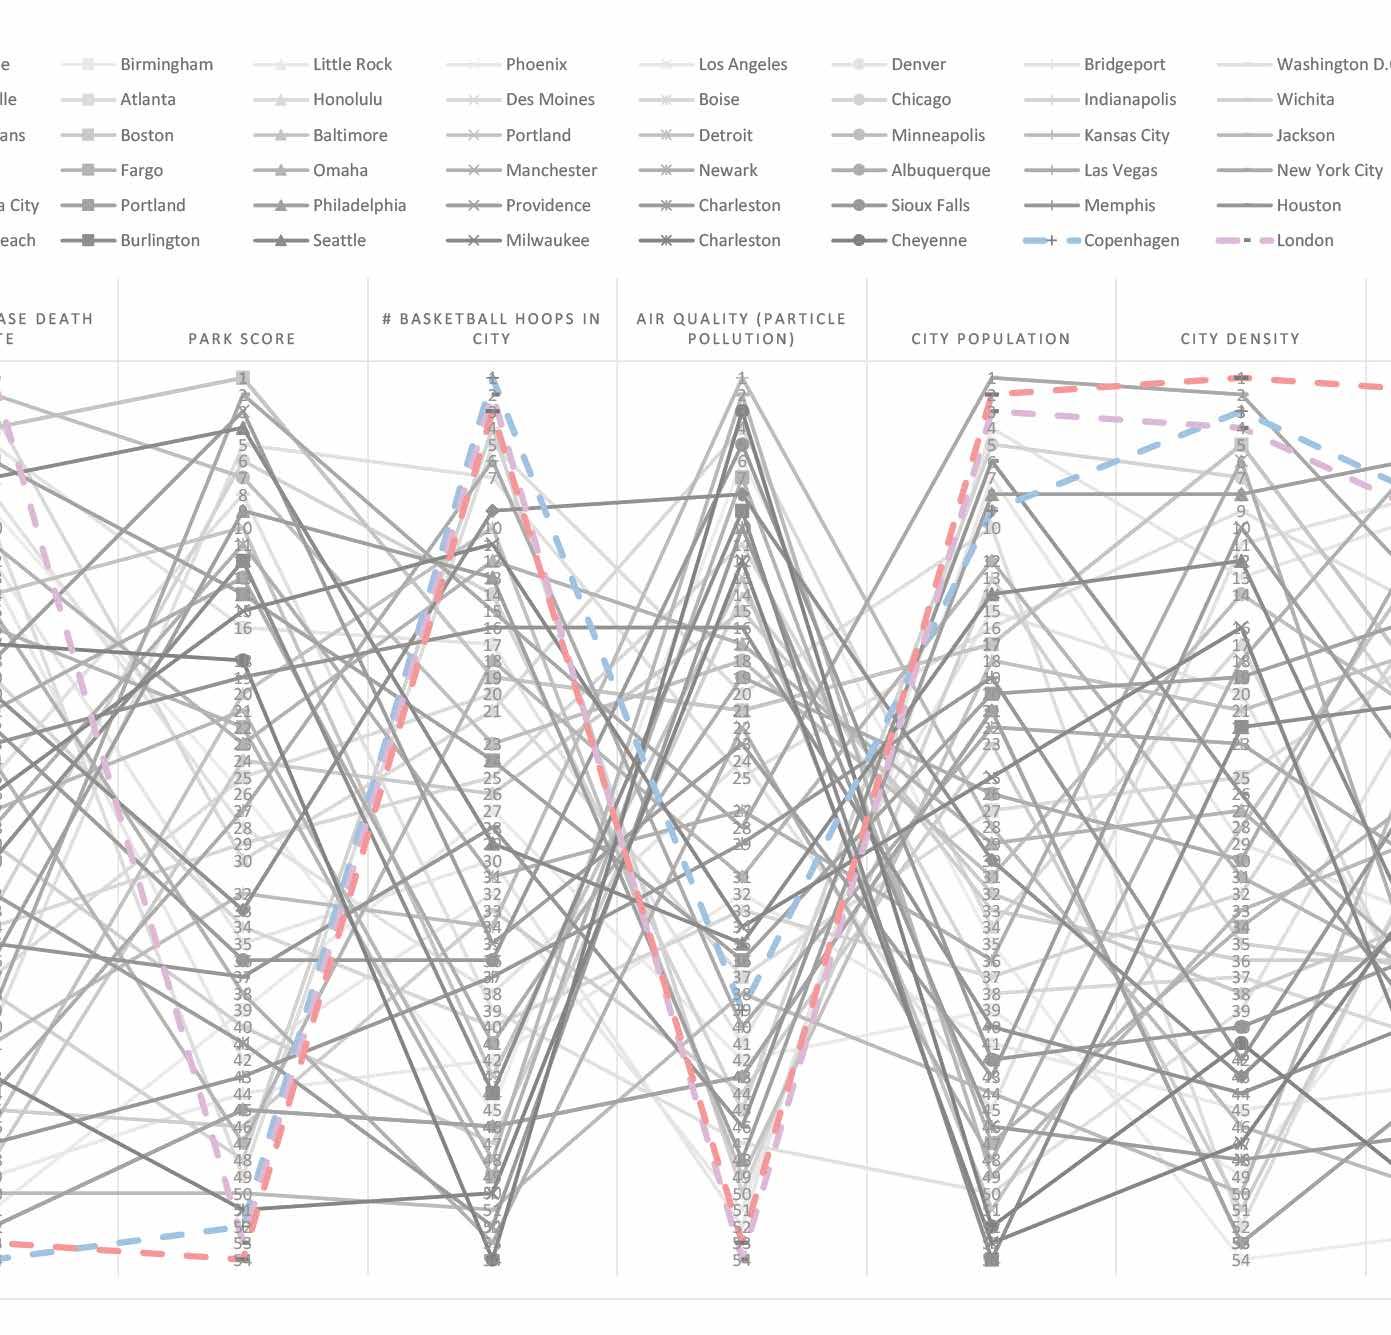
LOW HIGH
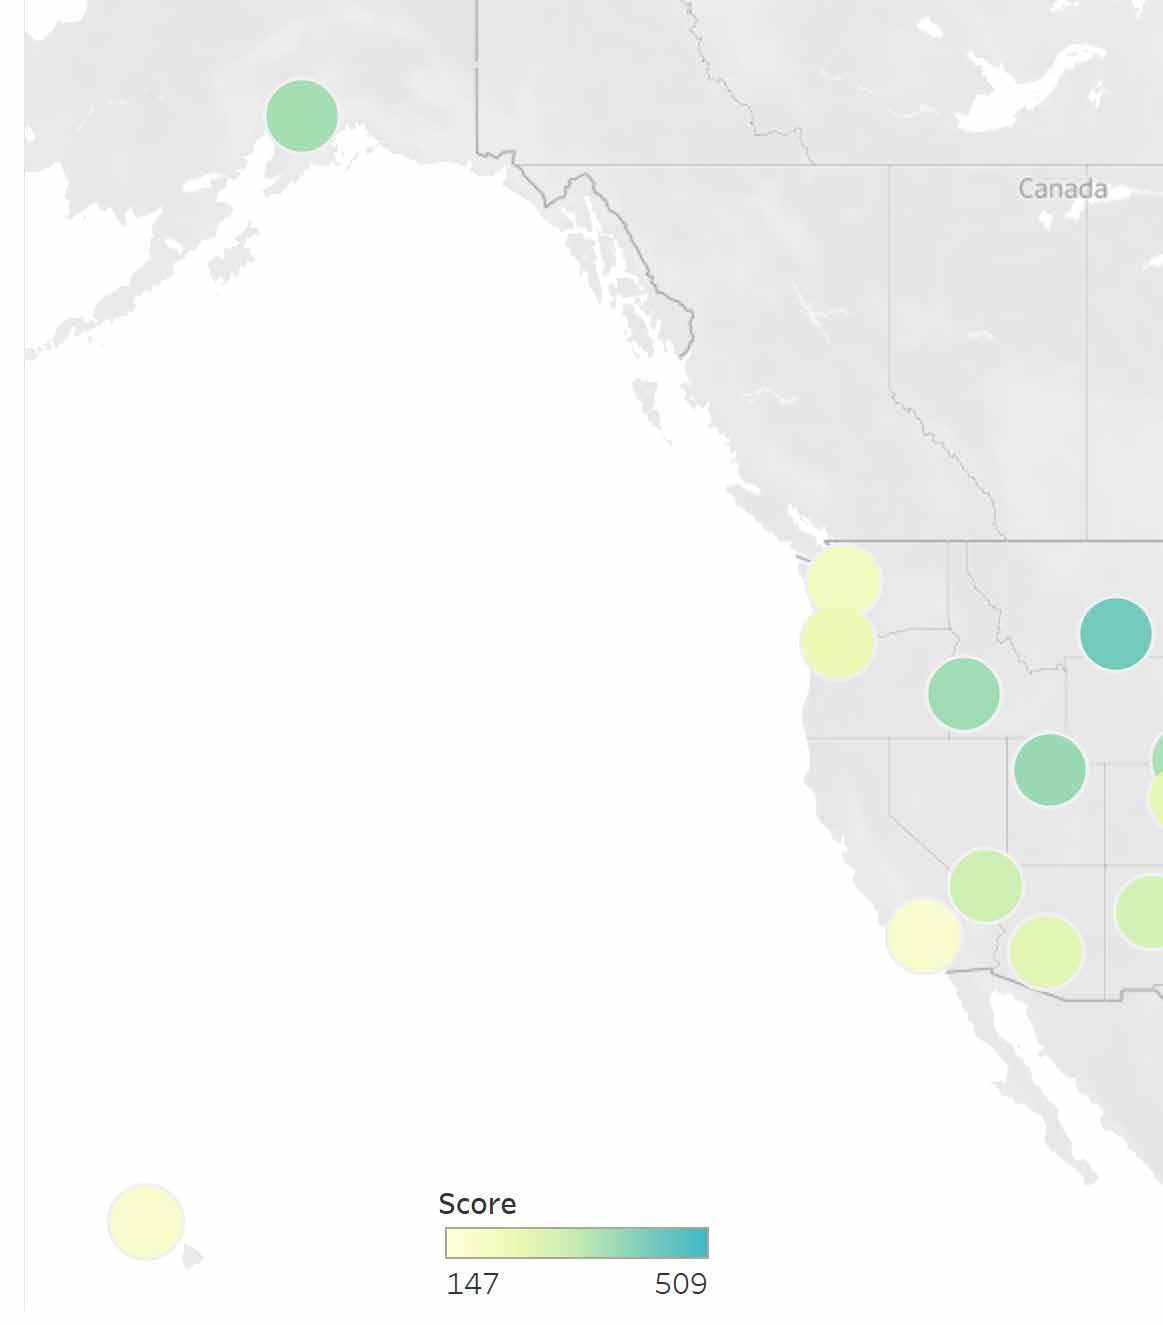
SEATTLE, WA
PORTLAND, OR
BOISE, ID
PNW FINDINGS 6.
7.
36.
So what does this mean? How does this matter? Well, if I’m building a methodology that can be applied anywhere, I have to take my data and start applying it to my skills. This degree has provided me with important environmental analysis and design skills in our climate, so I want to look into the best of the Pacific Northwest to make this process a little easier since I am driving this train. Seattle and Portland ranked one after the other, but for a lot of reasons including density, population, and the newer surge of people moving to Boise it fell a bit shorter.
TAKEAWAYS
• Majority of 'successful' cities in the ranking were observed on the coastlines of the U.S.
• American city density could really improve
• Our city models are challenged an incomparable to a lot of European counter parts due to population sizes
• I hate excel but love Tableau
Softwares used: Excel, Tableau, QGIS
Summary Steps:
1. Research and understand how geography pertains to infrastructure and health in the U.S.
2. Determine what data and factors contribute to health and sport activity
3. Rank the data points correlating to each city (with the largest population) in each state relative to one another, and see what kind of economic culture that city carries
4. Consider how this data could influence larger investment of public infrastructure and resources
56
SCALE 02: THE CITY SCALE ANALYSIS

59 ANALYSIS
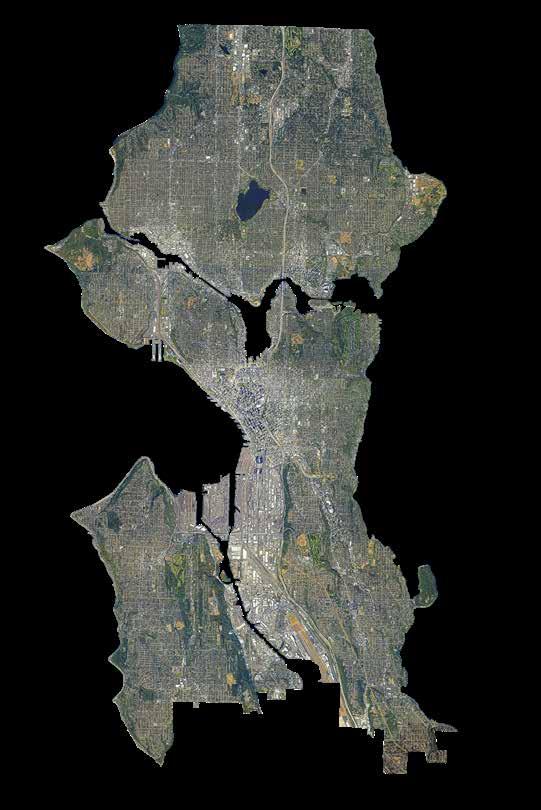
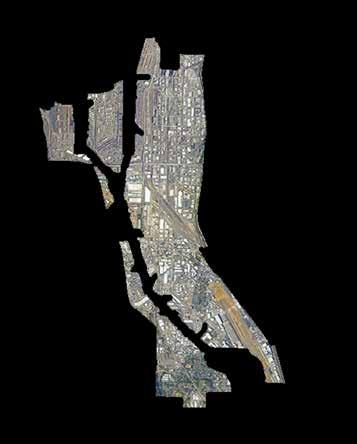
SEATTLE ANALYSIS
ECONOMICS ENVIRONMENT DEMOGRAPHICS
MEDIAN HOME COST
PRIVATE SPORTS PARKS WETLANDS
RIPARIAN ZONES HAZARDS
INDUSTRIAL AREAS
VEGETATION
POPULATION
DENSITY RACE EDUCATION LEVEL
PRIMARY LANGUAGE AGE
60
SPORTS
FACILITIES
PUBLIC SCHOOLS
PRIVATE SCHOOLS
STREETS TRAILS ZONING
OBESITY
HEART DISEASE
61
SPORTS DEMOGRAPHICS INFRASTRUCTURE HEALTH LEVEL LANGUAGE
ANALYSIS
SEATTLE ANALYSIS
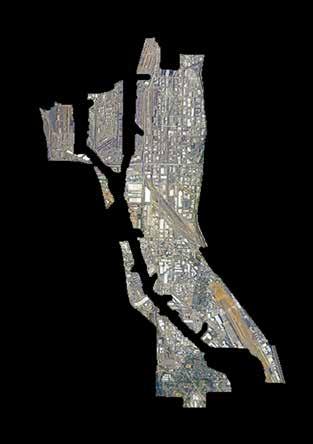
62 REGENERATIVE SPORT URBANISM
NORTHWEST
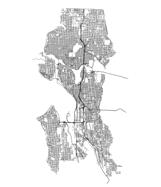
BALLARD
MAGNOLIA
NORTHGATE
LAKE CITY INTERBAY
NORTHEAST
GREEN LAKE (FREMONT)
UNIVERSITY DISTRICT
QUEEN ANNE
DOWNTOWN
CAPITOL HILL CENTRAL AREA CASCADE (SLU)
WEST SEATTLE
DELRIDGE
GREATER DUWAMISH
BEACON HILL
SEWARD PARK
RAINIER VALLEY
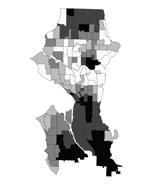
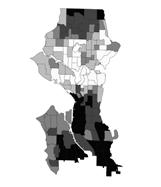
I set up my analysis the same way following my project structure, this data was now going to be a little more dissectible and was a bit more familiar to me due to the Barcelona program. These 22 indicators within my categories were some of my target data sets I sought out.
Overall this added up to about 70 shapefiles, Seattle’s opendata is luckily pretty good.
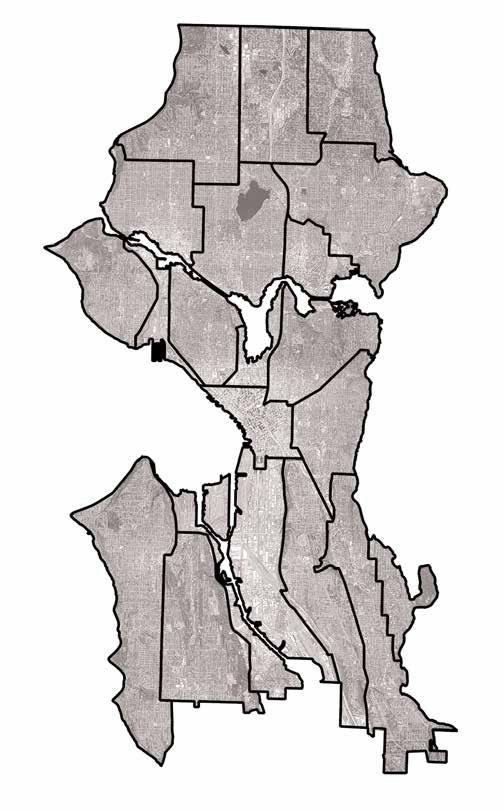
So if you haven’t done any sort of process like this or used GIS you kind of need to find a basket. If I am looking at 70 shapefiles, and each shapefiles has hundreds of thousands of data, like apples and oranges, I needed to find a way to put those apples and those oranges into specific baskets. Massive organizer is I apparently. Districts are helpful, within a city they carry different culture and landscape types in this larger urban system. Seattle has 20 identified districts, which some names are a bit different to locals.
63 DELANEY HOPEN - MLA
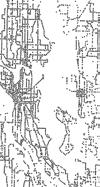
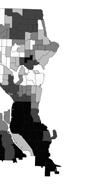
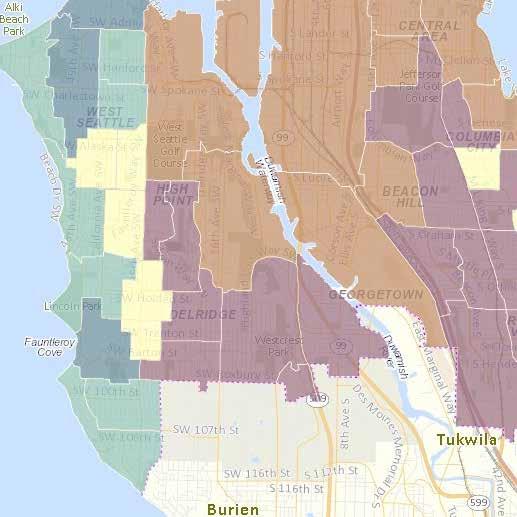
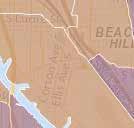
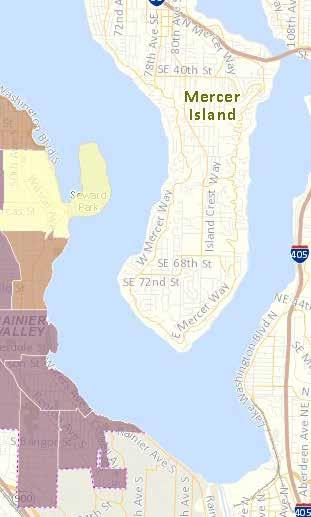
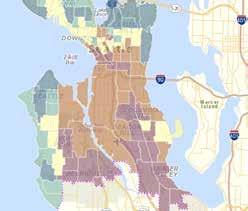
SEATTLE ANALYSIS
Environmental Infrastructure Demographics


Hazards & Zoning

64 REGENERATIVE SPORT URBANISM
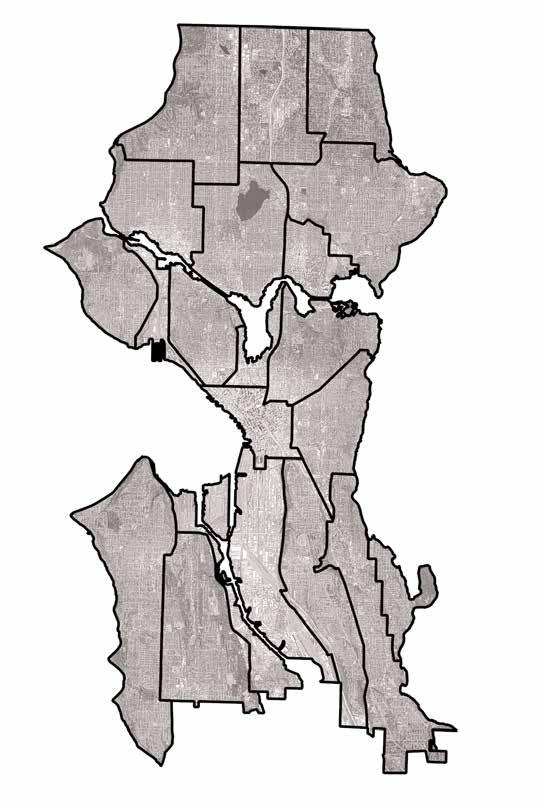
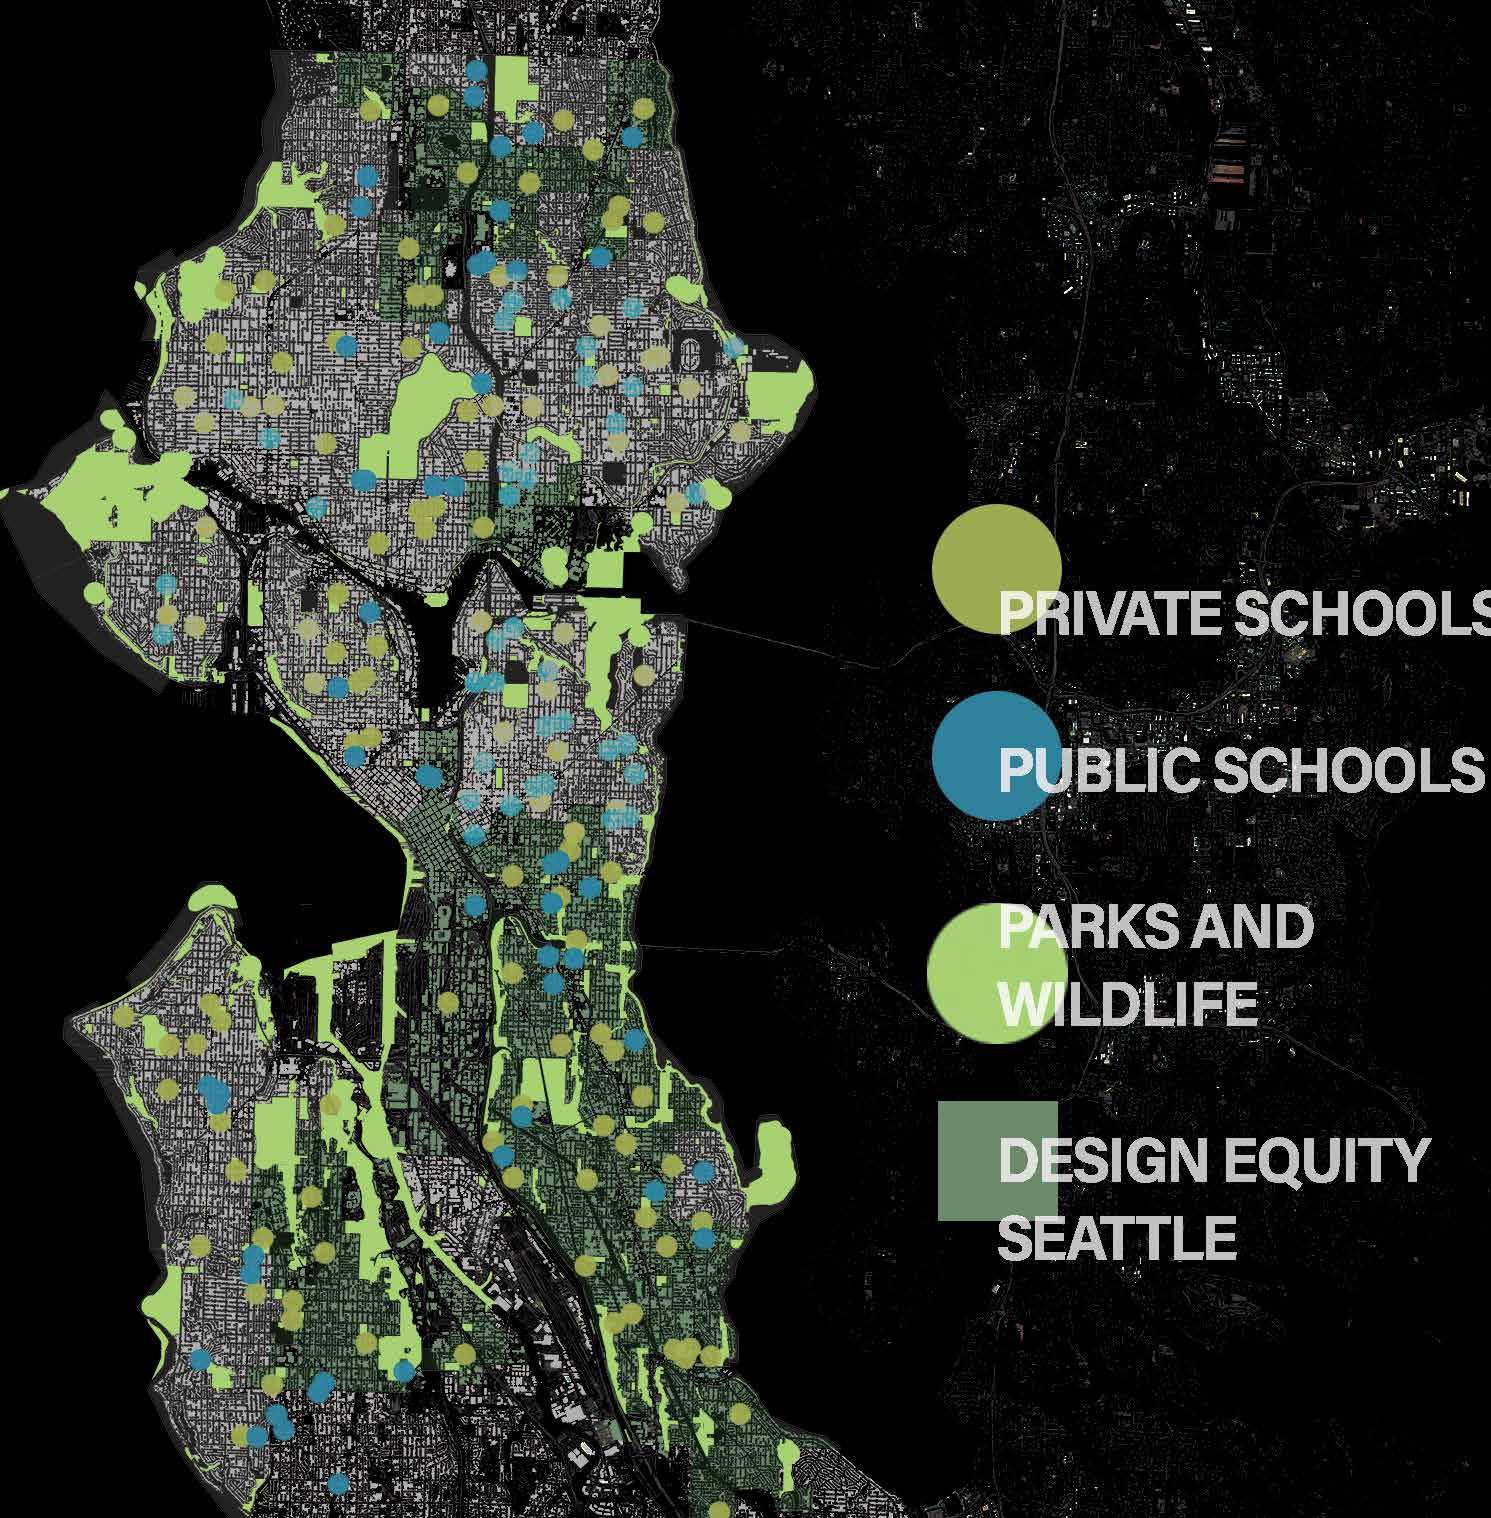
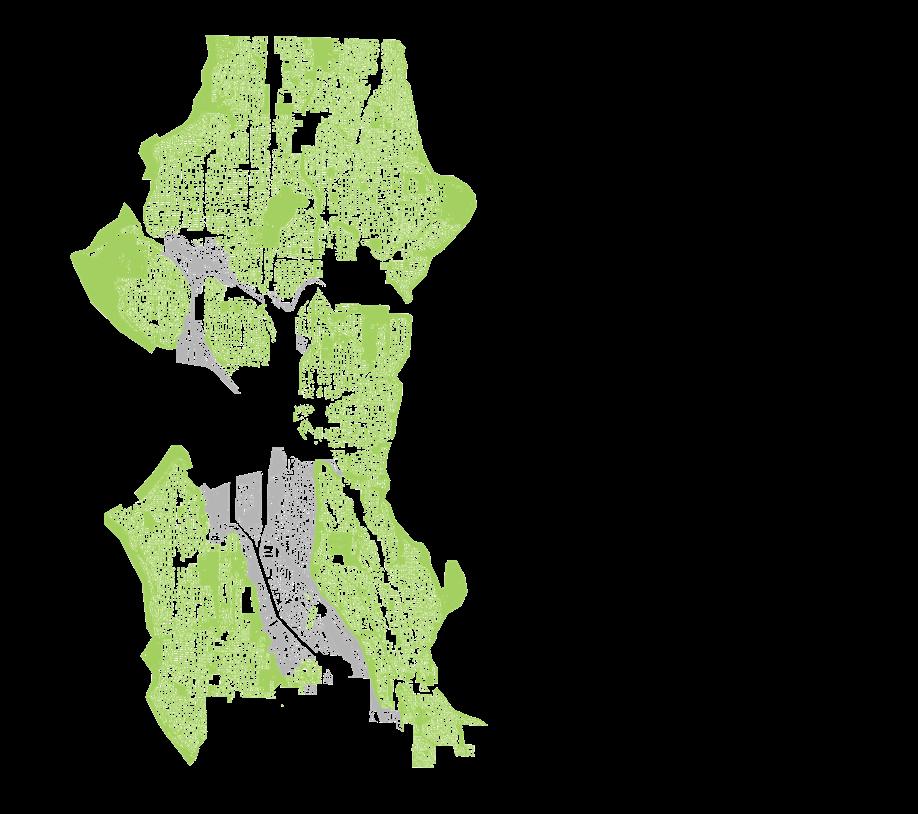
Parks Transit Race Residential
65 DELANEY HOPEN - MLA
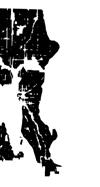
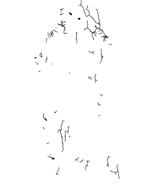
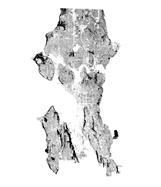
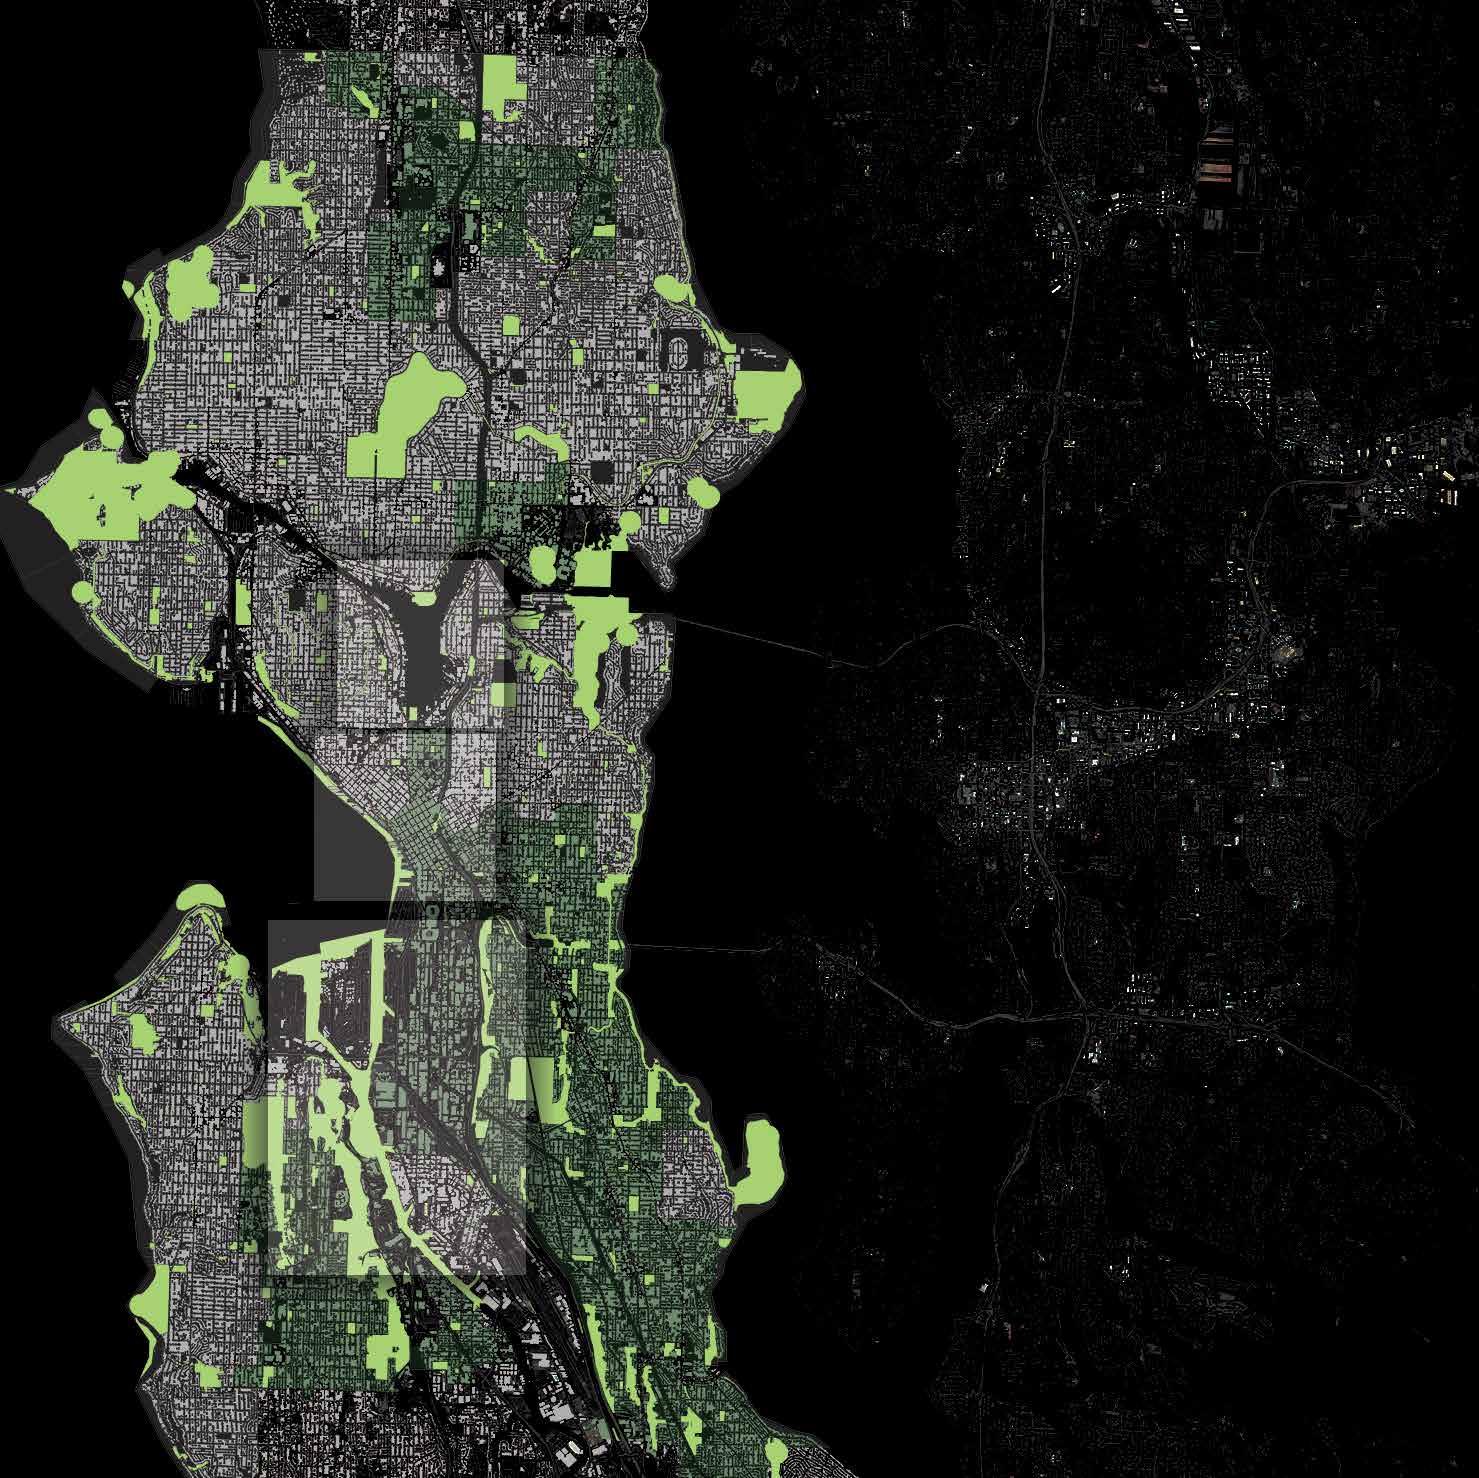
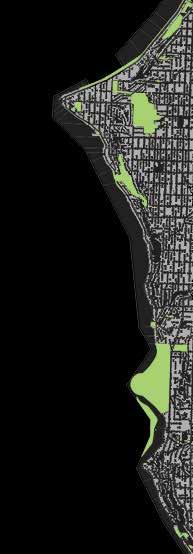
Parks
Riparian Wildlife Vegetative Cover
Transit Stops Public Parking
Bike Lanes Streets
Race
Economic Standing Health Equity
Design Equity
Residential Industrial
Flood Risk
Earthquake Risk
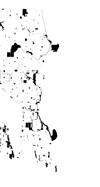
PROCESS WORK
66 REGENERATIVE SPORT URBANISM
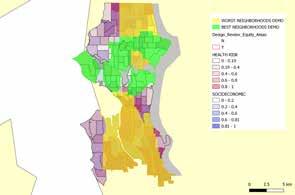
This is another example of some layers I don’t expect you do understand, but to display my process.
So, by hand I determined what some of my most influential data is to the user, and being able to sport. Facilities and there American tie to recreation play a huge role, the parks we are given to do so, and how much leisure time we have to take care of ourselves aka socioeconomic standing.
At this level I wanted to apply a touch of personal knowledge just from life and growing up playing in facilities; you can’t trust a local school to want to support your sport play if it isn’t tied to their school, renting space is super high, and they cater a lot of kids so my filtering and as a landscape designer I really wanted to select heavily on parks and open space and how they can be protected and saved for communities that don’t have them. One last consideration was: I want sport to be an escape for people, and for a lot of kids, that 70% that quit playing, school may not be the escape for them.
67 DELANEY HOPEN - MLA
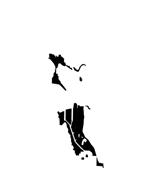
+1 QUEEN ANNE +1 CAP HILL +1 NORTH CENTRAL +1 MAGNOLIA +1 NORTHEAST
GREATER DUWAMISH
DELRIDGE
RAINIER VALLEY -1 BEACON HILL -1 NORTHGATE -1 U DISTRICT -1 LAKE CITY -1 DOWNTOWN 0 NORTHWEST 0 BALLARD 0 CASCADE 0 INTERBAY 0 CENTRAL AREA 0 WEST SEATTLE 0 SEWARD PARK 0 WEST SEATTLE 0 SEWARD PARK 0 BEACON HILL 0 DELRIDGE +2 NORTHEAST +1 QUEEN ANNE +1 CAP HILL +1 NORTH CENTRAL +1 MAGNOLIA +1 NORTHWEST +1 BALLARD +1 CENTRAL AREA -1 RAINIER VALLEY -1 NORTHGATE -1 U DISTRICT -1 LAKE CITY -1 CASCADE -1 INTERBAY -2 GREATER DUWAMISH -2 DOWNTOWN 0 BALLARD 0 WEST SEATTLE 0 SEWARD PARK +2 NORTHEAST +2 QUEEN ANNE +2 CAP HILL +2 MAGNOLIA +1 NORTH CENTRAL +1 NORTHWEST +1 CENTRAL AREA +1 BEACON HILL +1 DELRIDGE -1 RAINIER VALLEY -1 NORTHGATE -1 LAKE CITY -1 INTERBAY -2 U DISTRICT -2 CASCADE -3 GREATER DUWAMISH -3 DOWNTOWN 0 CENTRAL AREA 0 WEST SEATTLE 0 SEWARD PARK 0 LAKE CITY +3 MAGNOLIA +2 NORTHEAST +2 QUEEN ANNE +2 CAP HILL +2 NORTHWEST +2 DELRIDGE +1 NORTH CENTRAL +1 BEACON HILL -1 BALLARD -1 RAINIER VALLEY -1 NORTHGATE -2 INTERBAY -2 U DISTRICT -3 CASCADE -3 GREATER DUWAMISH -4 DOWNTOWN +4 MAGNOLIA +3 CAP HILL +3 NORTHEAST +2 QUEEN ANNE +2 DELRIDGE +2 NORTH CENTRAL +1 NORTHWEST +1 BEACON HILL +1 CENTRAL AREA -1 BALLARD -1 RAINIER VALLEY -1 NORTHGATE -2 U DISTRICT -3 INTERBAY -4 CASCADE -4 GREATER DUWAMISH -5 DOWNTOWN 0 WEST SEATTLE 0 SEWARD PARK 0 LAKE CITY 1.
3. 4. 5. Demographics Environment Parks Habitat Facilities
-1
-1
-1
2.
PROCESS WORK
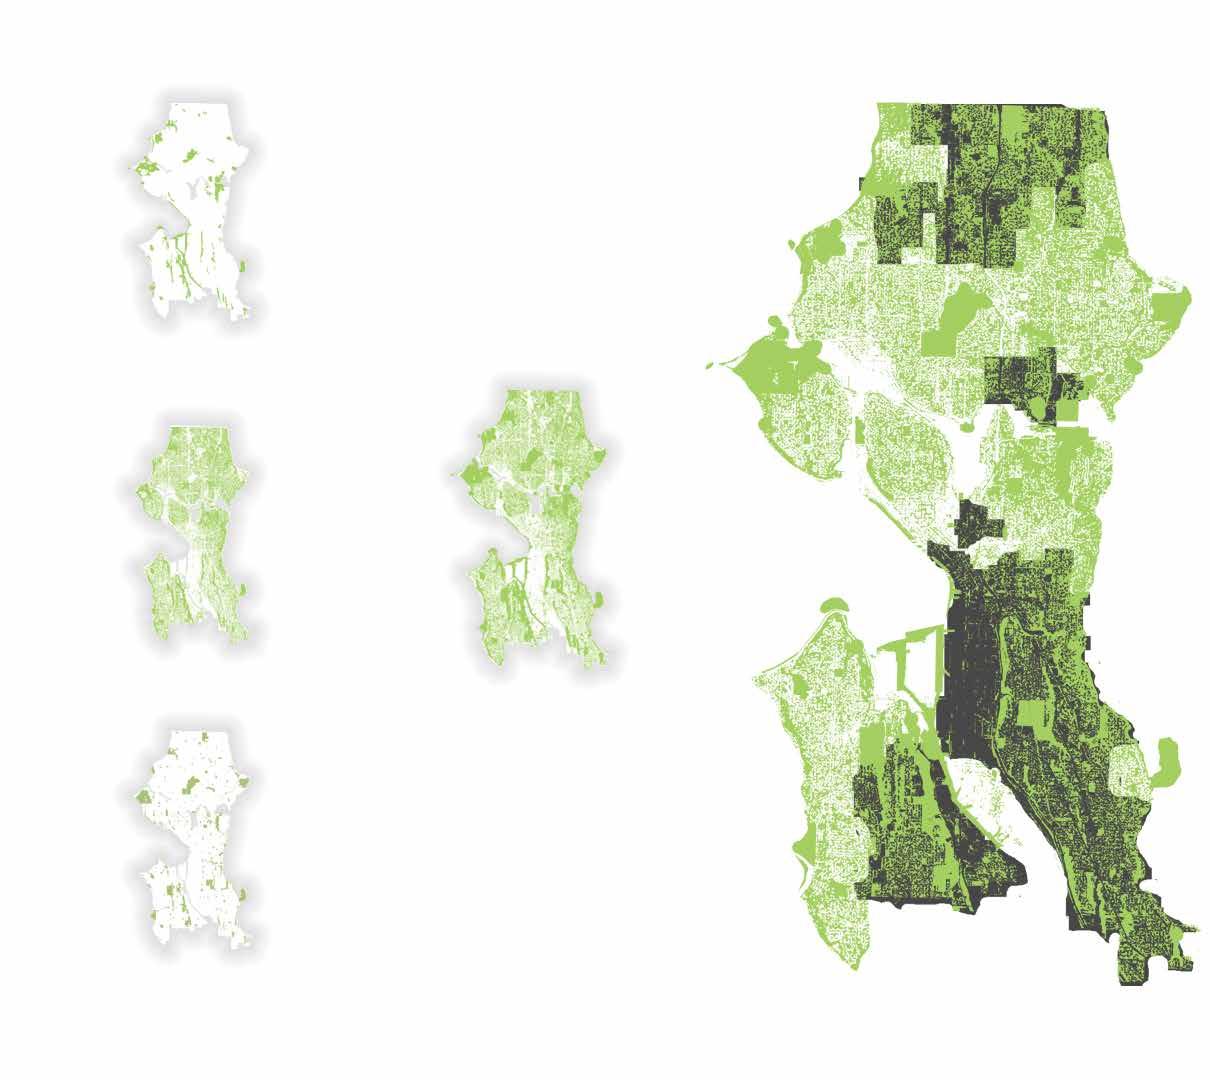
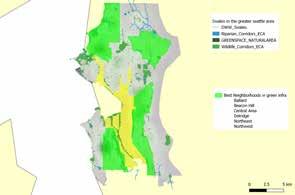
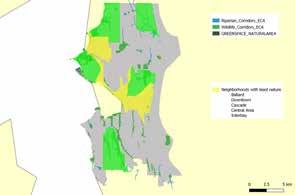
Wildlife Corridors
Vegetative NDVI
Green Space Overlay
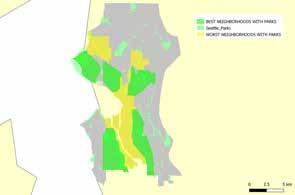
Parks
REGENERATIVE SPORT URBANISM
Social Equity
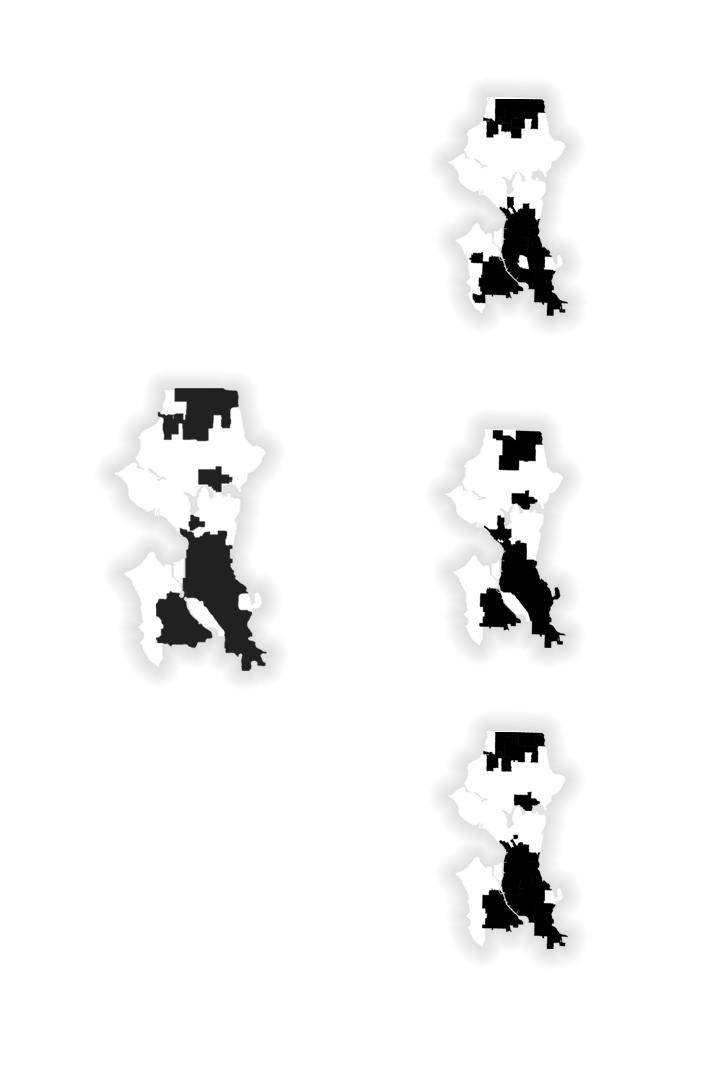
Health Equity
City of Seattle
Design Equity
index focus areas
Economic Equity
69 DELANEY HOPEN - MLA
OVERLAY PROCESS

City of Seattle Design Equity
Data by the Department of Neighborhoods

70
QUICK FACTS:
Shape area: ~ 3.6 mi2
Avg Home Selling Price: 1,180,000 USD (+7.8%)
Schools: 3 public, 2 private
MAGNOLIA NORTHEAST
Known Parks: Discovery Park, formerly U.S. Army's Fort Lawton, Kiwanis Memorial Park, Magnolia Tidelands Park, etc.
CAPITOL HILL
QUICK FACTS:
Shape area: ~ 3.8 mi2
Avg Home Selling Price: 762,500 USD (+3.7%)
Known Parks: Washington Park and Arboretum, Volunteer Park, Madison Park, Cal Anderson Park, etc.
Schools: 5 public, 8 private
QUICK FACTS:
Shape area: ~ 6.8 mi2
Avg Home Selling Price: 1,030,000 USD (+8.4%)
Known Parks: Magnuson Park, Burke Gilman Trail, etc.
Schools: 9 public, 7 private

72
+4 +3 +3
Kiwanis
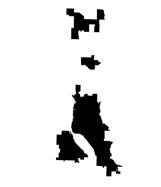
HIGHEST SCORING DISTRICTS
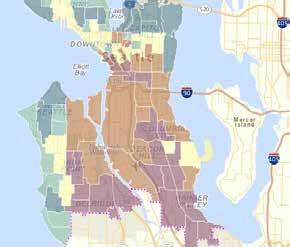
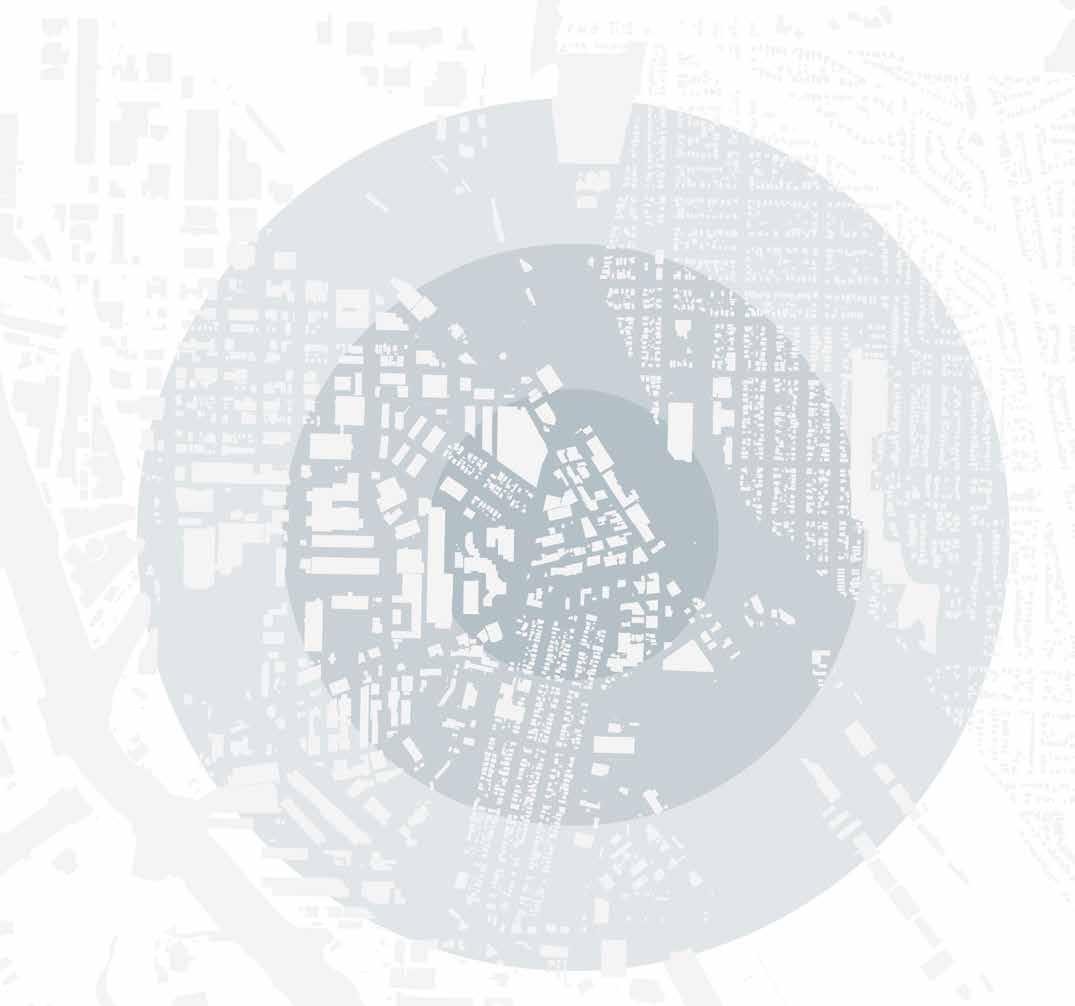
These neighborhoods were filtered and chosen for their quantity and distribution of parks, schools, public/private exercise facilities, environmental character for wildlife habitat/green corridors, protected riparian areas, and wetlands. An existing study of areas of interest for the city of Seattle analyzing socioeconomic status and health risk, brought on by the COVID-19 pandemic was also applied based on inputs including but not limited to average income and home price, level of education, and primary language in the home. This study designated particular areas of neighborhoods that could improve their shared public space or infrastructure in the future.
Madison
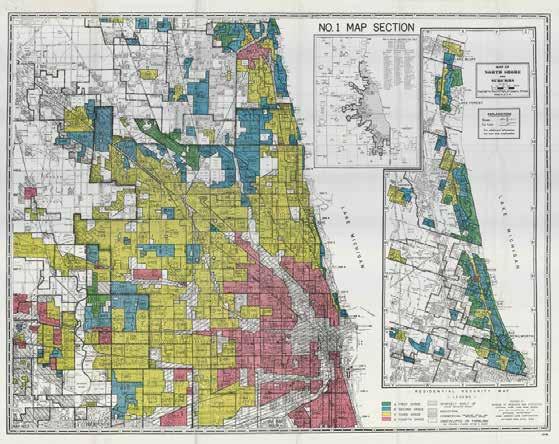
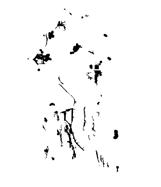
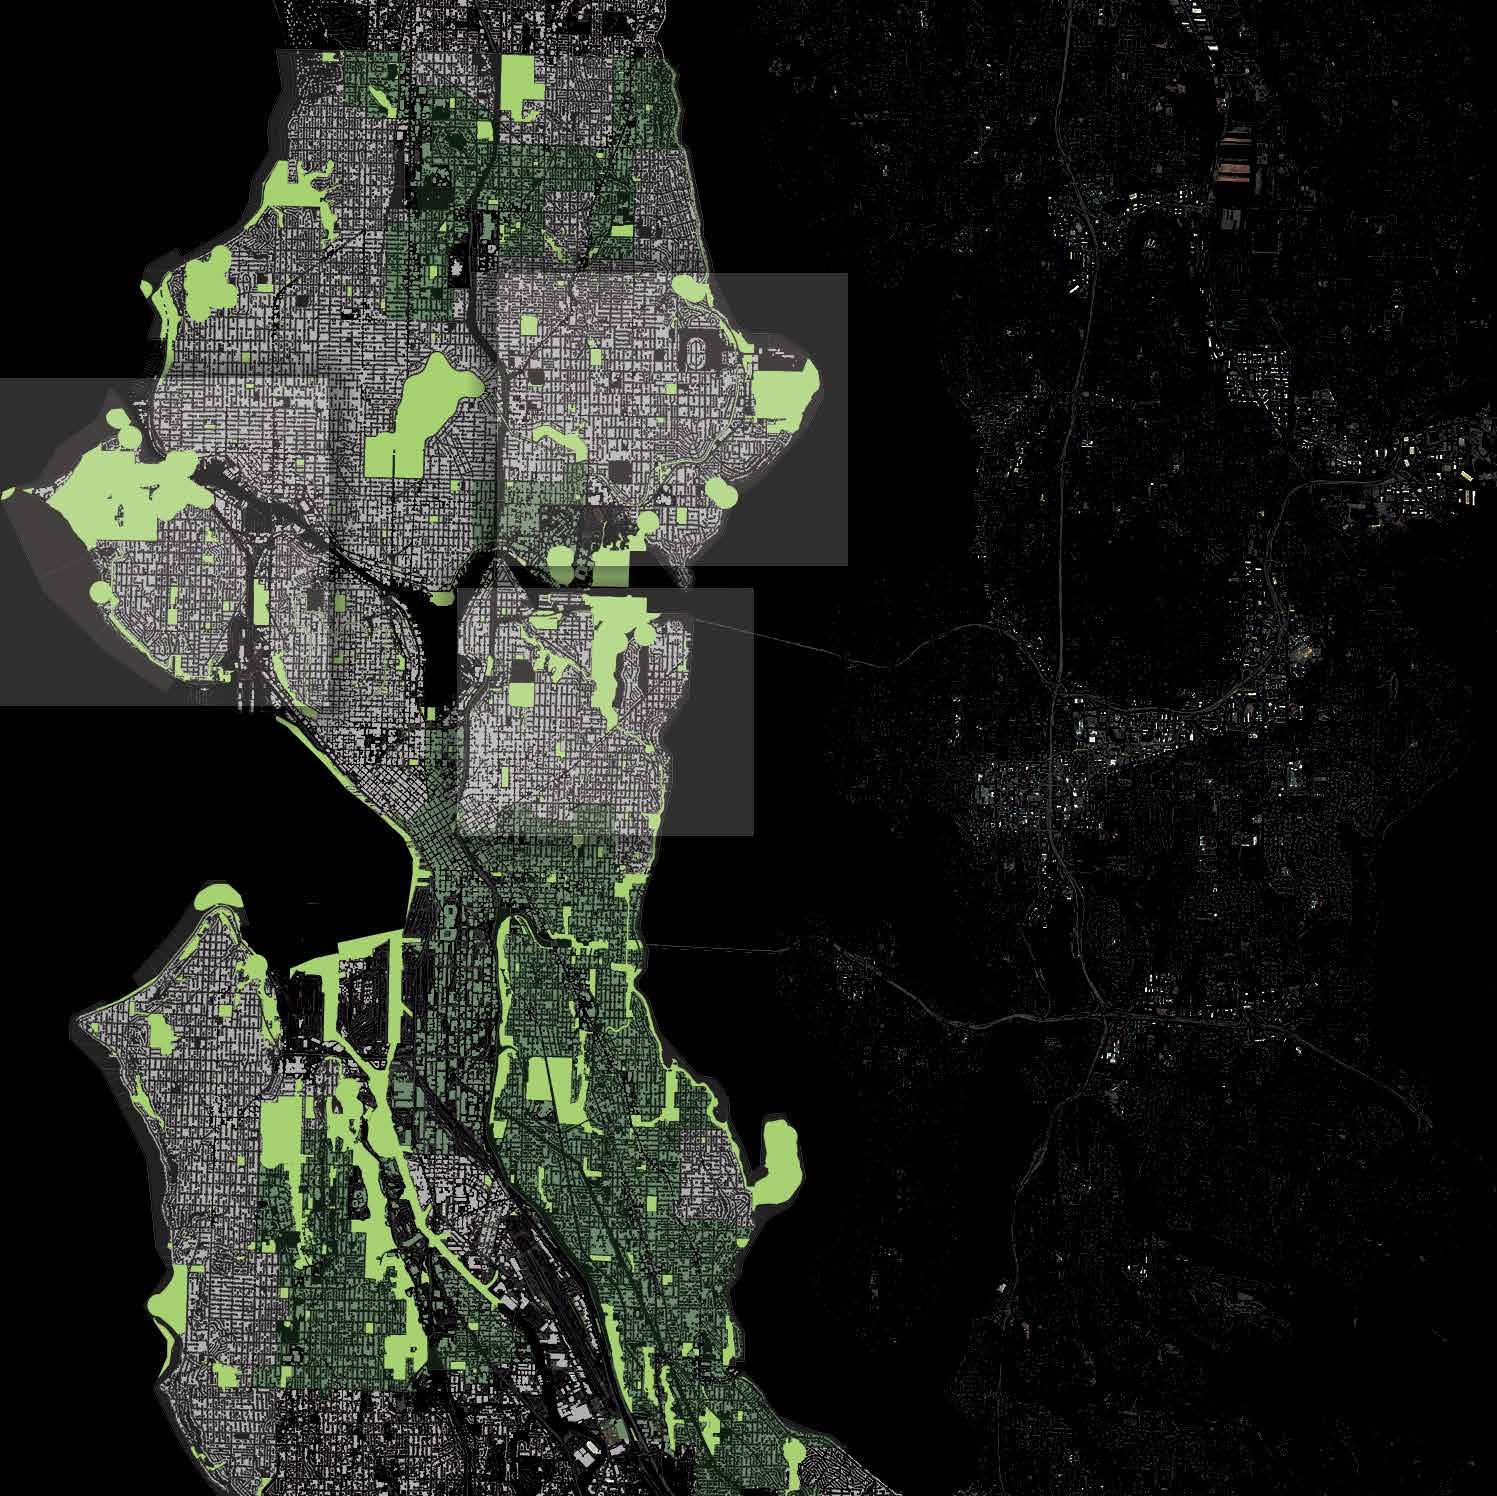
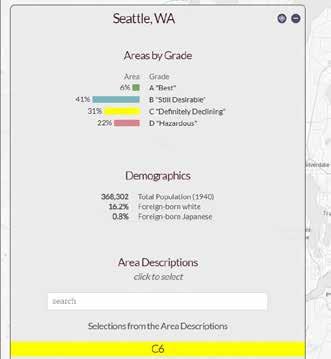
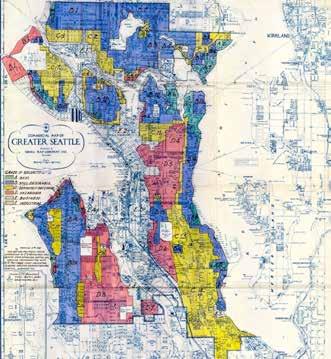
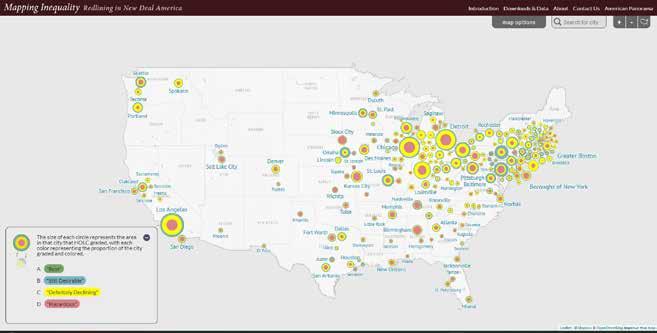
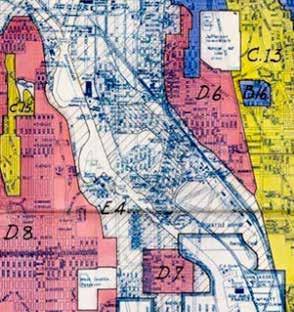
MAPPING INEQUALITY

74
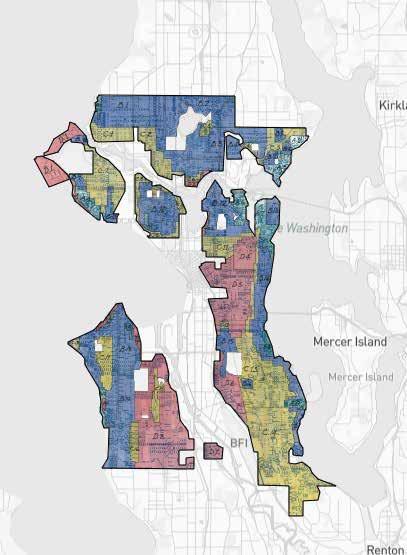
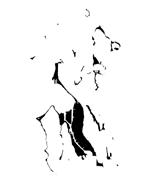
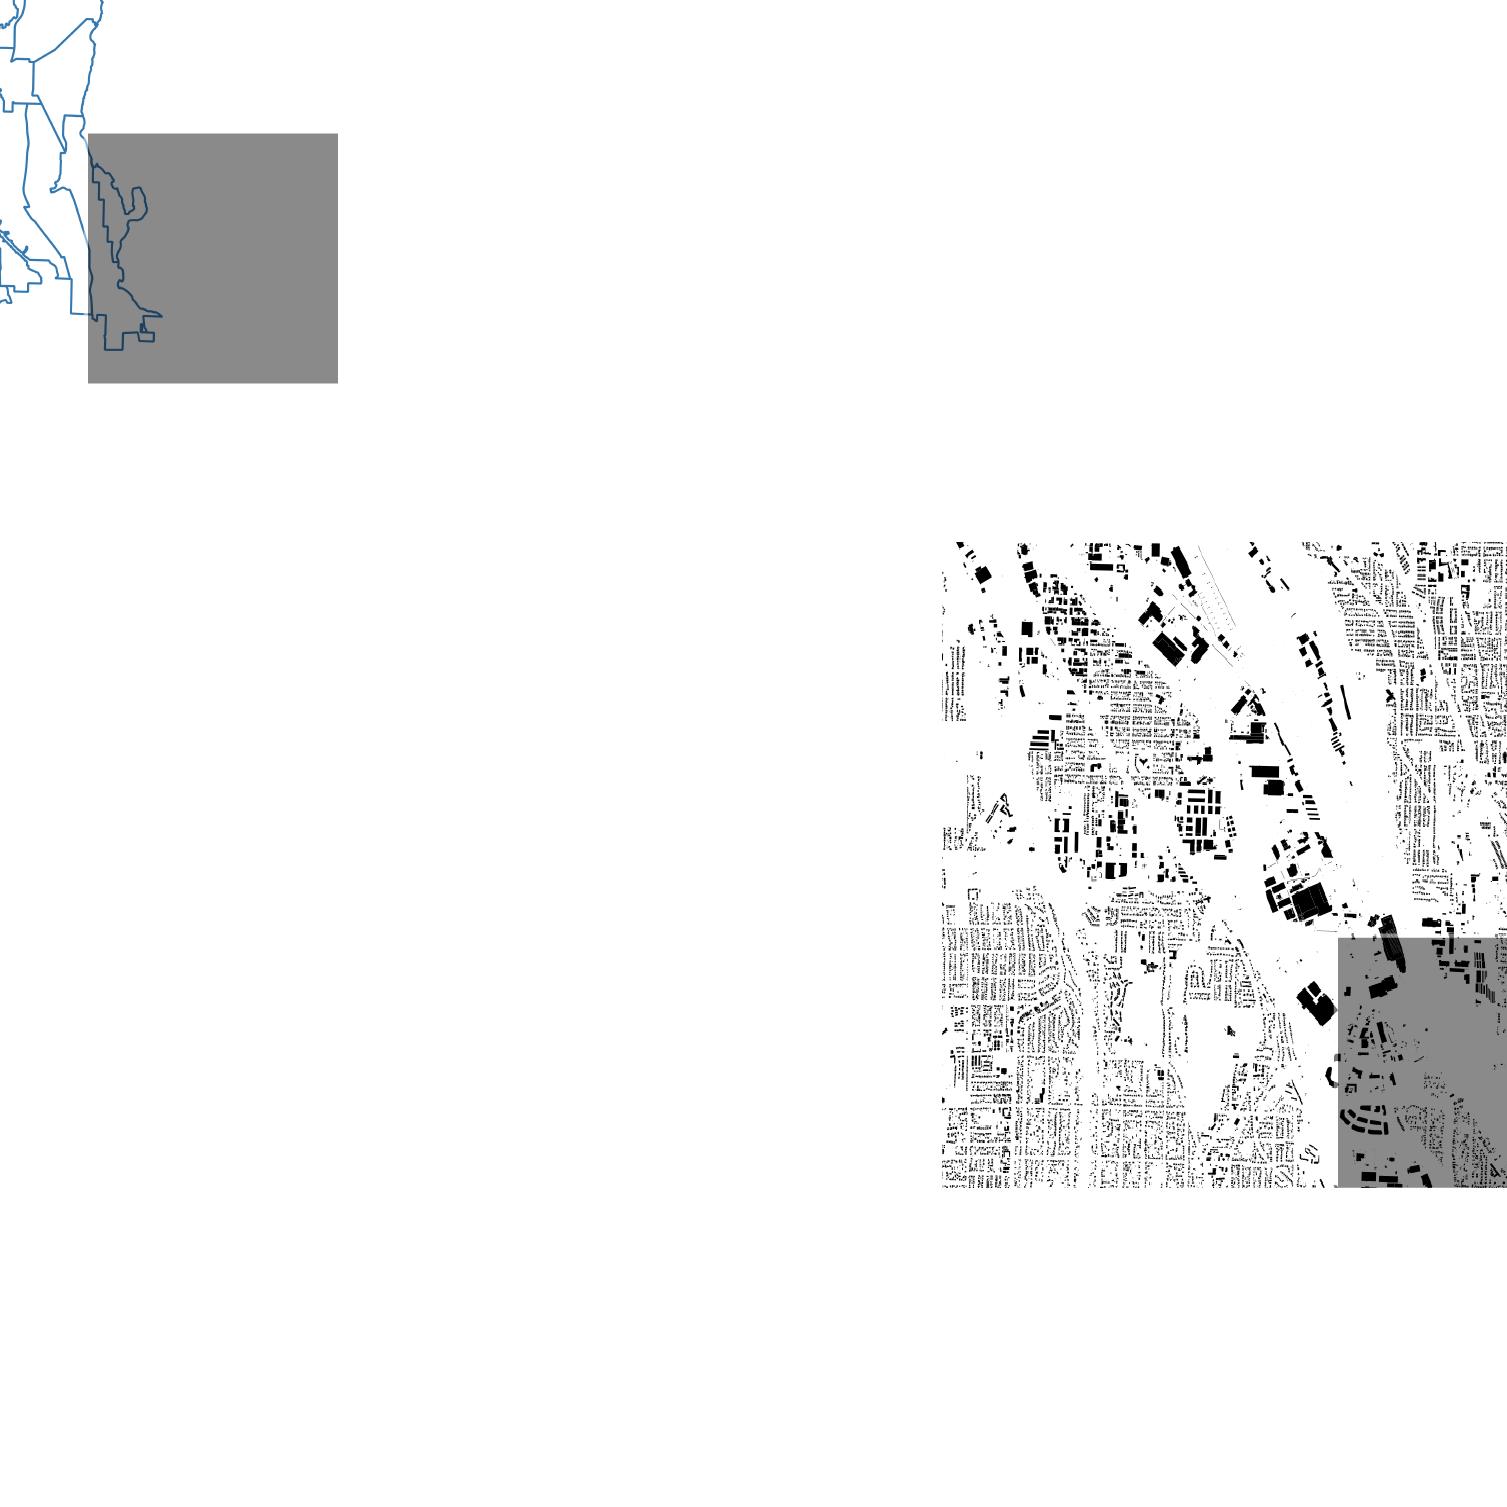
From my knowledge living there, and just how much I have learned about the impacts of redlining I wanted to see how much of these laws are still visible, GIS lets us do that. Mapping inequality is a wonderful resource by the university of Richmond highly recommend, and from what I noticed these areas pertain a lot to the historical delineation of best or still desirable areas, Magnolia is a special little case but I don’t have time to talk about it.
My impact areas although are pretty shared with the space of historical industry.
Something I noticed pretty quickly was the historically redzones weren’t all popping up in my overlay today, but the areas of industry as a whole were. So now to keep moving forward I had to make a decision one which area to implement regenerative sport urbanism.
75
QUICK FACTS:
Shape area: ~ 2.0 mi2
Avg Home Selling Price: 529,500 USD (-20.4%)
Schools: 0 public, 5 private
DOWNTOWN CASCADE
Known Parks: Jim Ellis Freeway Park, Pier 62 and 63, Olympic Sculpture Park, Westlake Park etc.
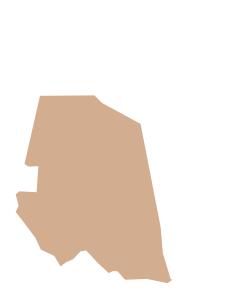
GREATER DUWAMISH
QUICK FACTS:
Shape area: ~ 7.6 mi2
Avg Home Selling Price: 585,000 USD (+14.7%)
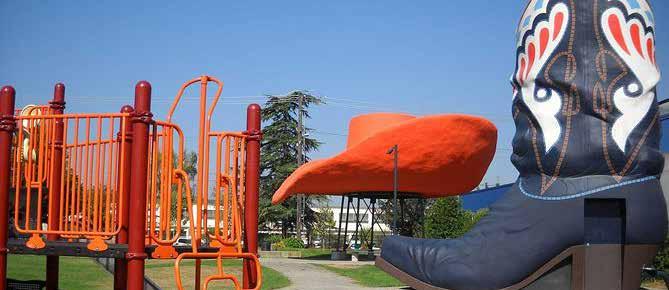
Known Parks: Oxbow Park, Georgetown Playfield
Schools: 0 public, 1 private, 7 trade
QUICK FACTS:
Shape area: ~ 1.0 mi2
Avg Home Selling Price: 720,000 USD (-17.2%)
Known Parks: Lake Union Park, Denny Park, Cascade Playground, Pettus Park, Fairview Park etc.
Schools: 9 public, 7 private

76 -5
-4
-4
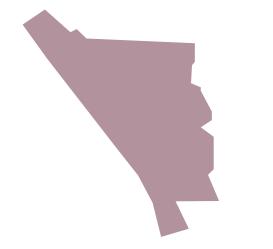
DUWAMISH LOWEST SCORING DISTRICTS
These neighborhoods were filtered and chosen for their quantity and distribution of parks, schools, public/private exercise facilities, environmental character for wildlife habitat/green corridors, protected riparian areas, and wetlands. An existing study of areas of interest for the city of Seattle analyzing socioeconomic status and health risk, brought on by the COVID-19 pandemic was also applied based on inputs including but not limited to average income and home price, level of education, and primary language in the home. This study designated particular areas of neighborhoods that could improve their shared public space or infrastructure in the future.
Sculpture
Terry
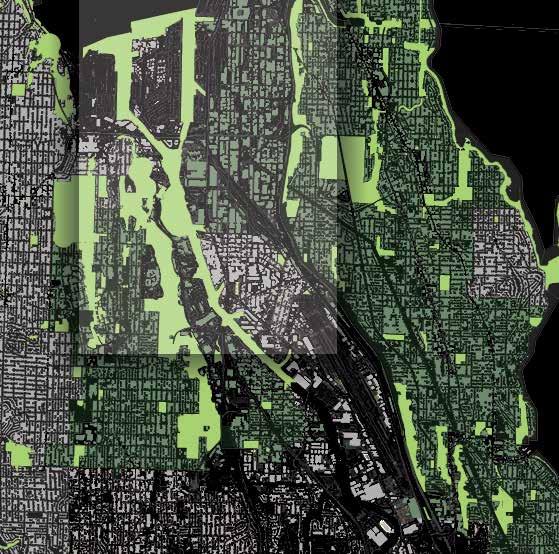
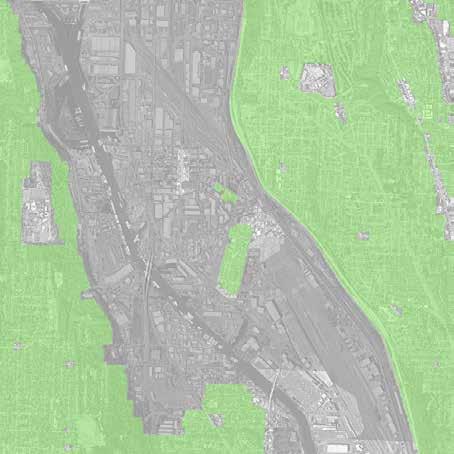
GREATER DUWAMISH OPPORTUNITY
In June 2020, King 5 news reported that downtown Seattle had lost 2,685 businesses, for a lot of reasons. The city is working on assisting the public that exists downtown, and It’s a mix of a larger challenge that was outside of my scope.
Cascade aka “SLU of Southlake Union”, is a newly revitalized zone with incredibly expensive and luxury hotels, a Google Office, some Amazon offices, and nice new park and lots of stormwater infrastructure, it looks great. This urban regeneration is expensive residential, hospitality, and big corps focused which is not what I am looking to do with my project.
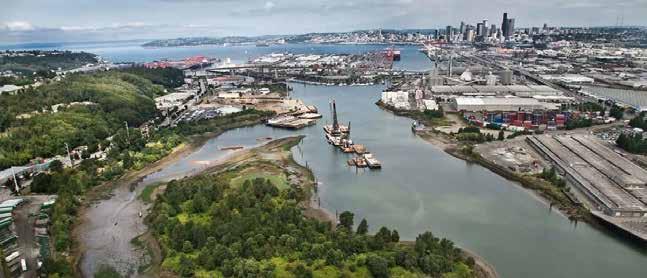
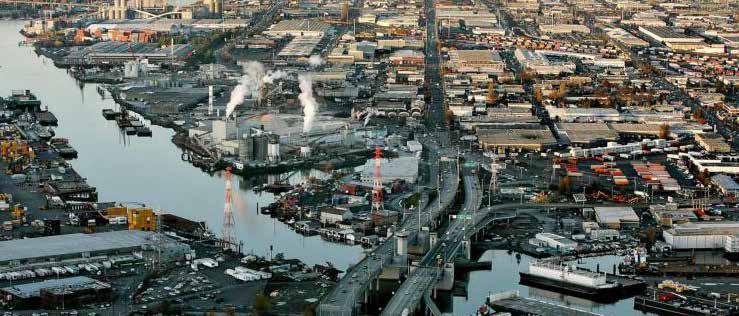
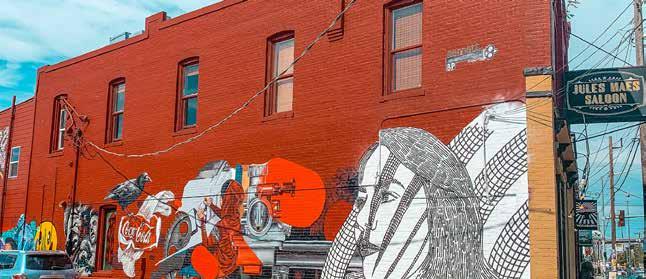
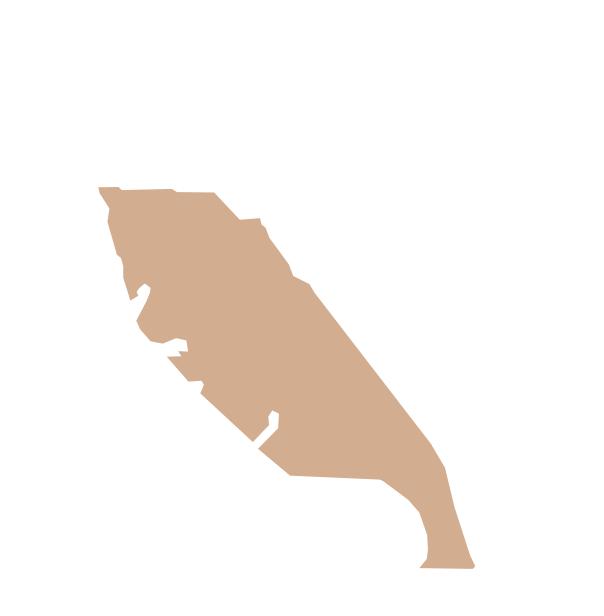
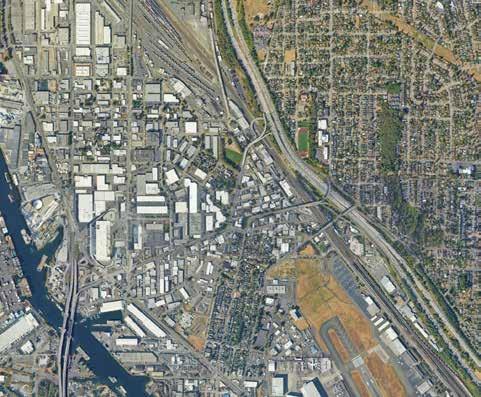
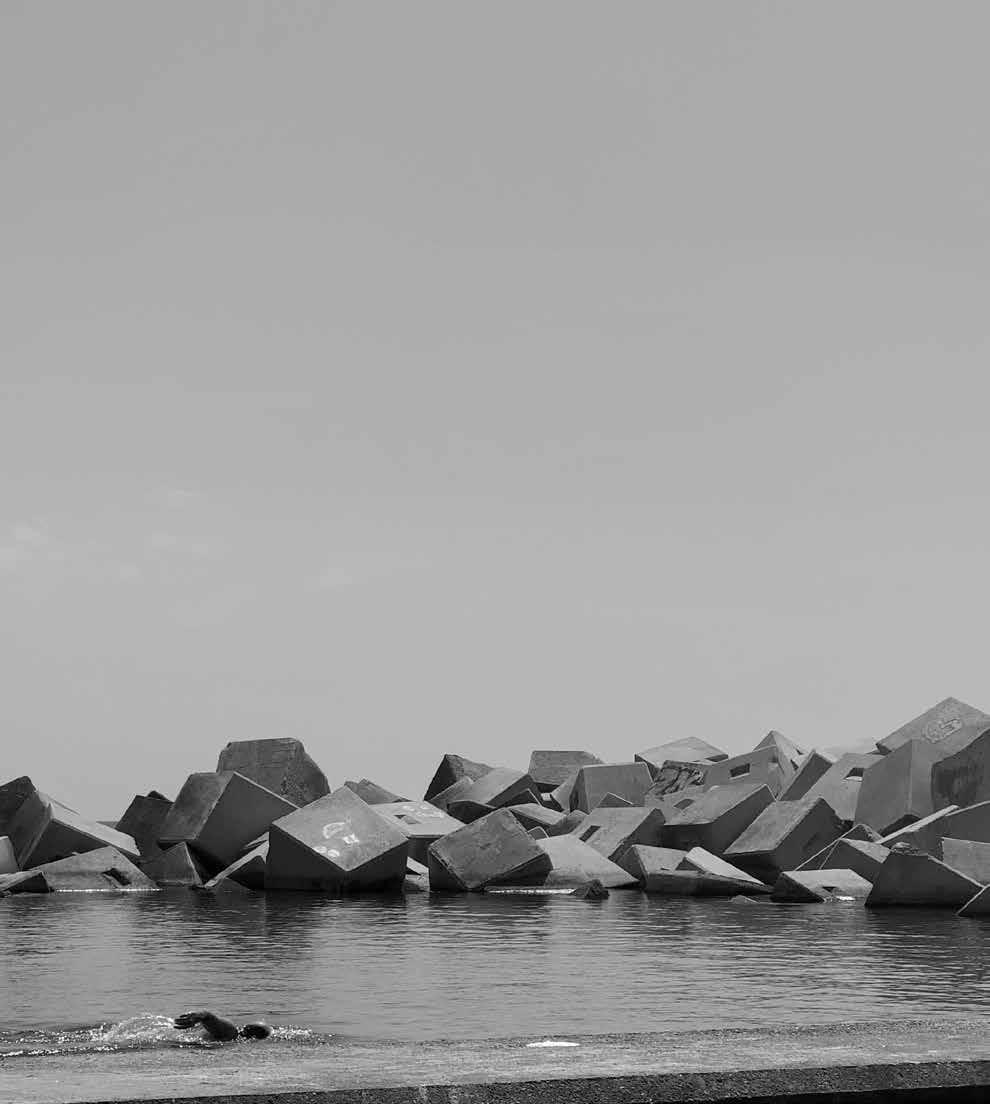
The Greater Duwamish has had my heart for a few years, which I didn’t really realize until I continued to explore this project, it was a tiny neighborhood you could barely see from the freeway that had the only indoor beach volleyball facility in Western Washington. A warehouse filled with sand, that couldn’t stay alive during COVID, a small example of a big issue in participatory sports today.
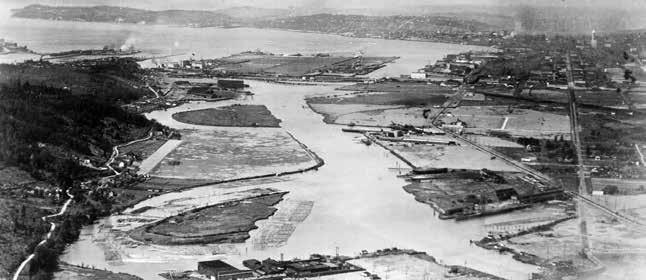
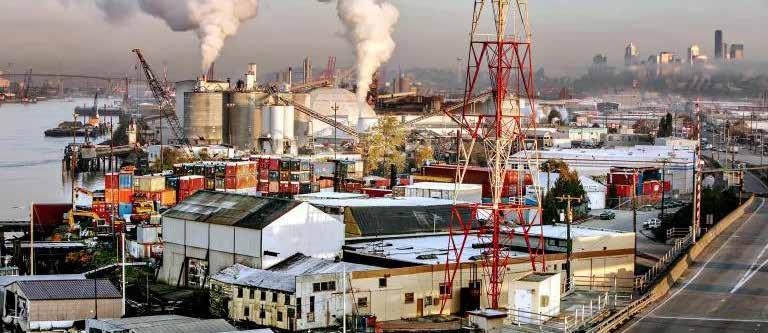
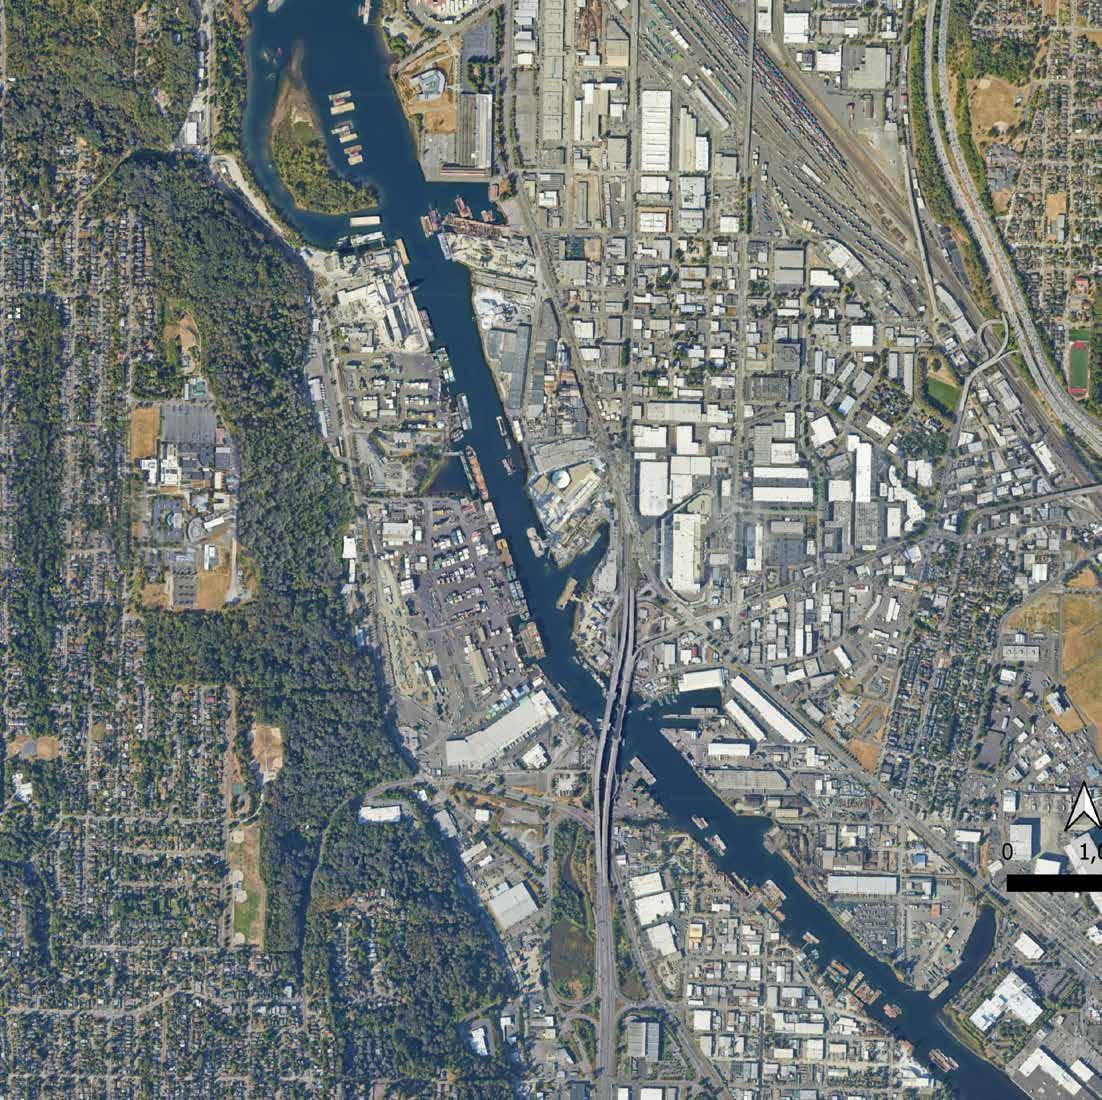
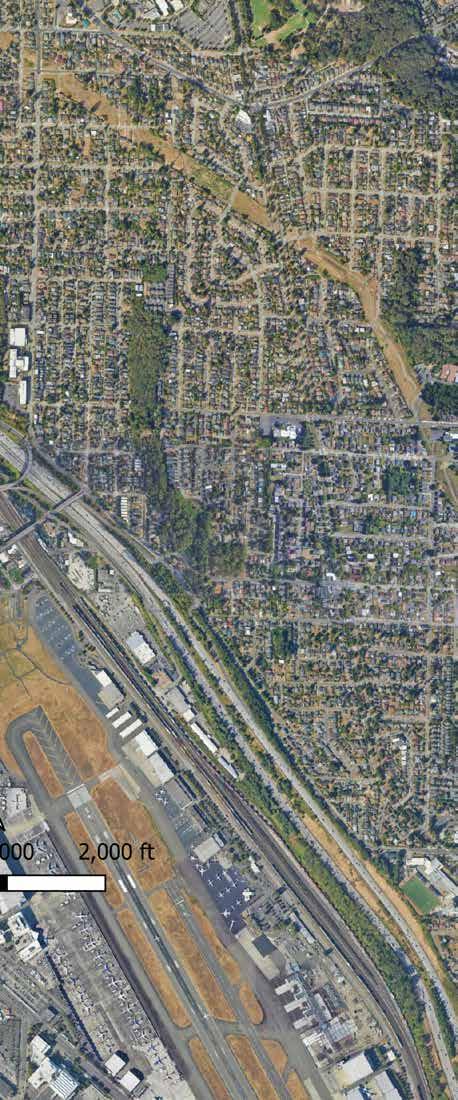
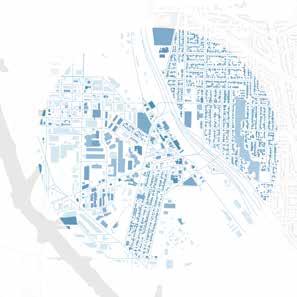
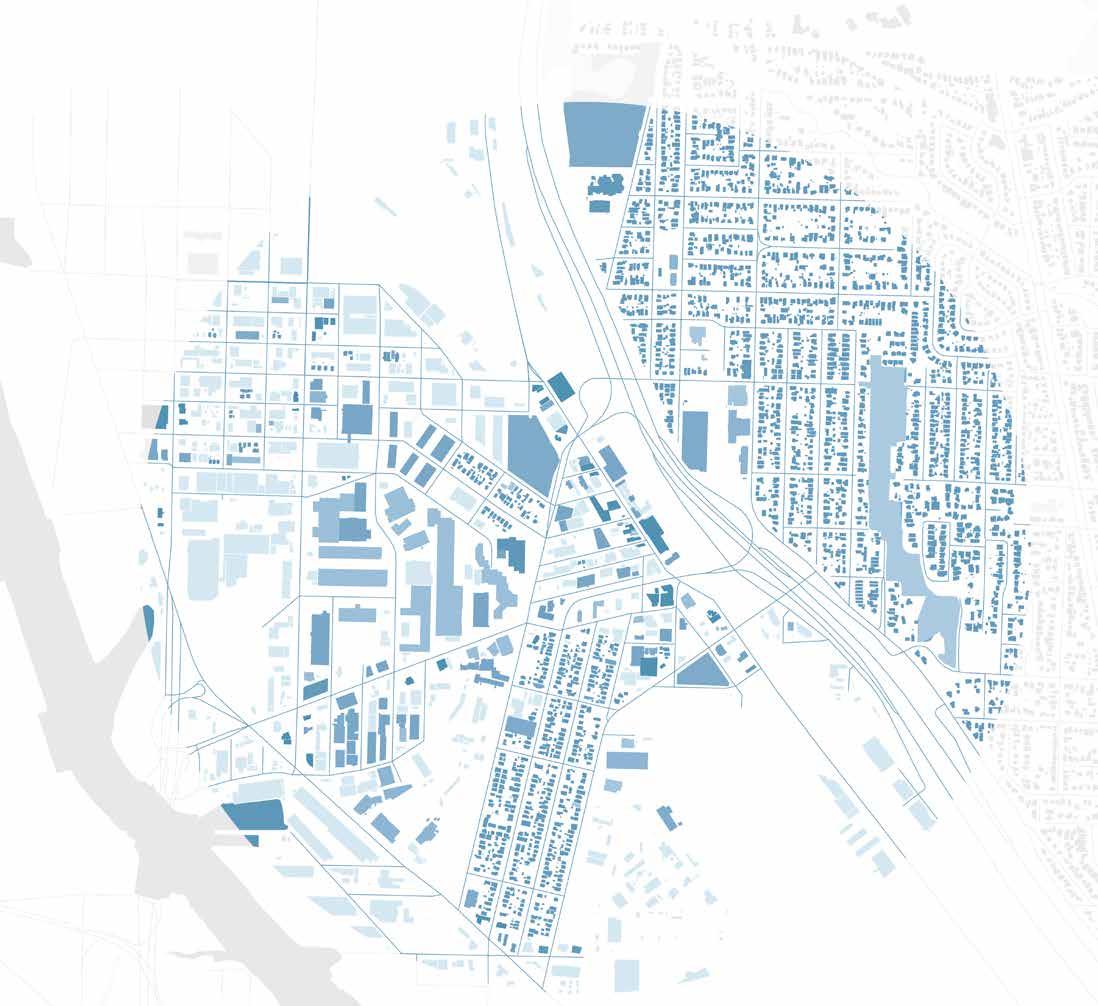
The topography is a valley, of a historical wetland with one residential area. This district has: freight storage and warehouses for manufacturing, Beer and Art walks, the Duwamish longhouse, event hosting, a P-Patch garden, and a superfund site, Boeing air field. The complexity is so exciting and fun.
Maps lie too.
78
5,062 GROSS ACREAGE
1 SUPERFUND SITE
1,376 POPULATION
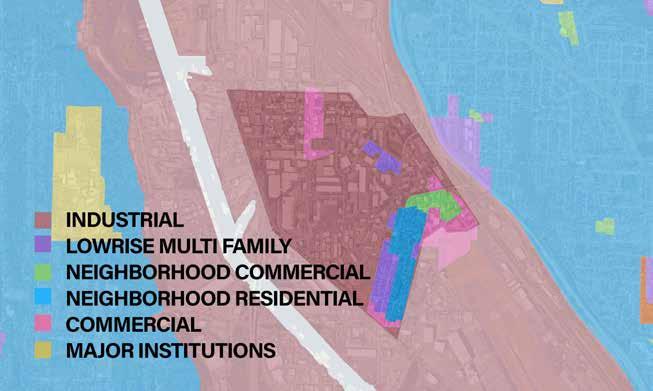
85% INDUSTRIAL
4% COMMERCIAL
2% PARKING
7% VACANT
<1% RESIDENTIAL
59% SIDEWALK ACCESS
81
SITE POPULATION RESIDENTIAL ACCESS
ACREAGE
5,062 GROSS ACREAGE
1 SUPERFUND SITE
1,376 POPULATION
85% INDUSTRIAL
4% COMMERCIAL
2% PARKING
7% VACANT <1% RESIDENTIAL
59% SIDEWALK ACCESS
82
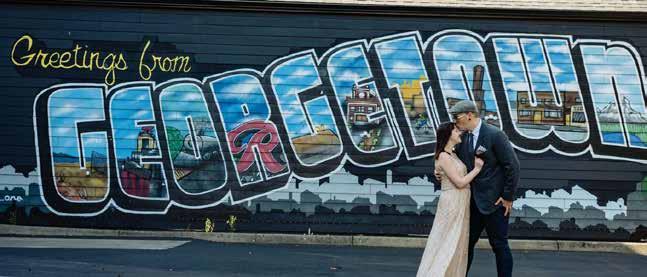
The greater Duwamish is just an industrial district to a lot of people, but to born and raised Seattlites it holds another purpose for the creatives. Manufacturing on the river with a deep hurtful history, and an adjacent historical salooning town called Georgetown. Spatially the Duwamish is the largest district of seattle, and 2% of that whole area is parking, this is like a landscape designer dream. That is about 101 acres of space.
83
TAKEAWAYS
• Housing discrimination in 1940 can still be seen at the city scale in 2023
• Seattle ranking 6th in the U.S. major city data filtering process (National Scale) there are still incredibly uneven distributions to sport space
• We could be so much better at planning for sport space if actual GIS datasets existed for them
• This process becomes more and more complicated as complexity increases with scale
Softwares used:
Google Earth, Google MyMaps, Mapping InEquality by Richmond U and MapBox , QGIS, ArcGIS Web Browser
Summary Steps:
1. Take your city and organize it by district
2. Start rganizing each districts data based on demographics, health statistics, and economics
3. Map/locate current facilities for sport (i.e. schools, golf courses, recreation centers, etc.)
4. Layer open space and natural area data
5. Look for areas where there are systemic scars putting residents more at risk of quality-of-life leisure activities

84

85
SCALE 03: THE DISTRICT SCALE ANALYSIS
87 ANALYSIS
GEORGETOWN
ECONOMICS ENVIRONMENT DEMOGRAPHICS
INCOME PARKS WILDLIFE STREET TREES VEGETATION
RACE EDUCATION
PRIMARY LANGUAGE AGE HEALTH
88
SPORTS
GEORGETOWN ANALYSIS SPORTS
DEMOGRAPHICS INFRASTRUCTURE
CULTURE
SPORTS FACILITIES
PUBLIC SCHOOLS PRIVATE SCHOOLS
TRADE SCHOOLS STREETS TRAILS ZONING
SIDEWALKS
89
EDUCATION LEVEL LANGUAGE
DEMOGRAPHICS
This info is updated every three years and is subject to change.

I-5Highway
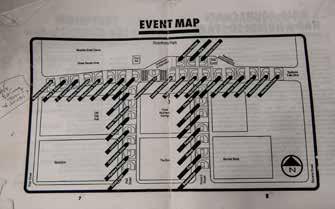
Context Map

Prepare to zoom and dissect

What I tried to do with this map was dissect this demographic data, on this incredibly notable i5 highway border. For total transparency I first began looking at this data in 2022, and it’s recently been updated so yay but no yay, the Greater Duwamish valley portion actually was moved to a brown, I have theories about mostly impacts of COVID.
This is where a lot of my research and exploration on sport design and parks started to tap in. There was a study done in the U.S. where a city proposed two solutions, one to dropping a sport center facility into a community that was underprivileged, to remain walking distance to locals yet drivable to kids and or parents who had cars. It was great, but im not doing that, I’m making parks not buildings and the threats of gentrification on our project interventions is always lingering.
Little need of outreach Could use support Seattle's Design Equity Scoring Key
DEMOGRAPHICS
Georgetown Brown
25.2% people of color
26% below poverty line
2.4% foreign born avg age 39.3
625 households
Context Map

 I-5Highway
Tourism centroid
I-5Highway
Tourism centroid
Beacon Hill Brown
Beacon Hill Purple


What you see is this border of really unique community groups as well as economic standing. Previously when this area was yellow, I wanted to flip what that research showed, and put the park systems in walking distance from the people who may need it yet not disrupt their potential cost of living, in a way i5 kind of came in handy. There is a lot more to potentially jacking up home prices in an area but hopefully I can touch on it.
75.6% people of color 9% below poverty line 2.2% foreign born avg age 40.3 1,591 households 91.3% people of color 53.6% below poverty line 52.1% foreign born avg age 32.6 1,296 households
Little need of outreach Could use support
Seattle's Design Equity Scoring Key
RESIDENT CONTEXT MAP
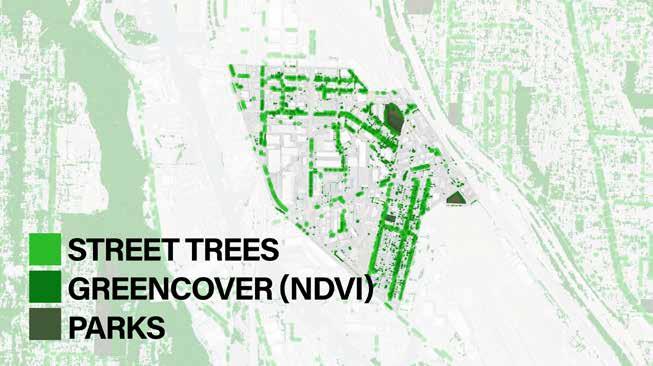
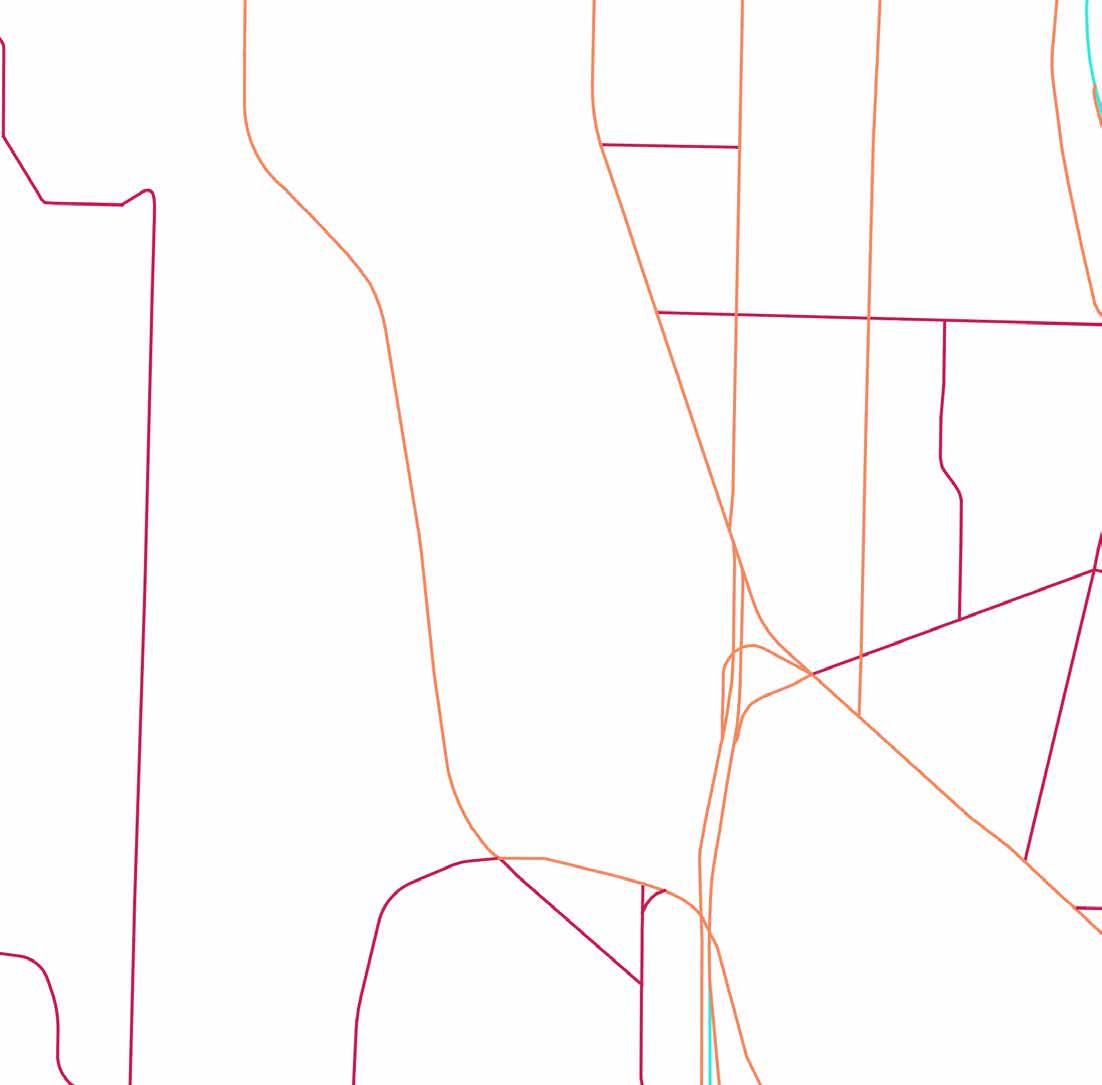
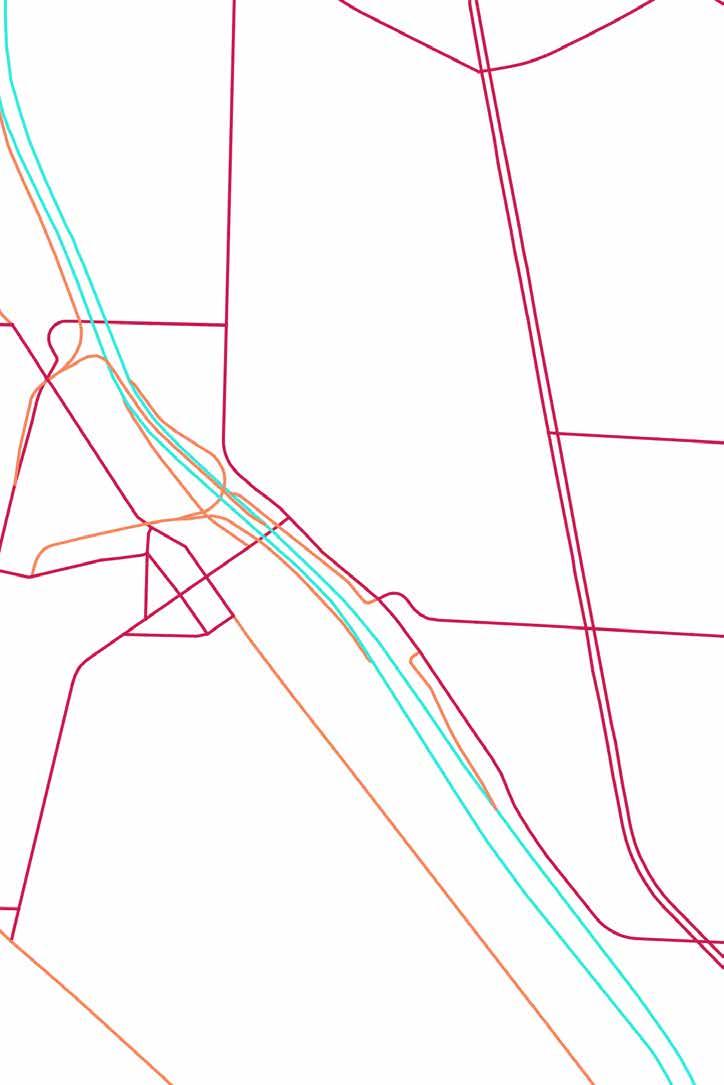
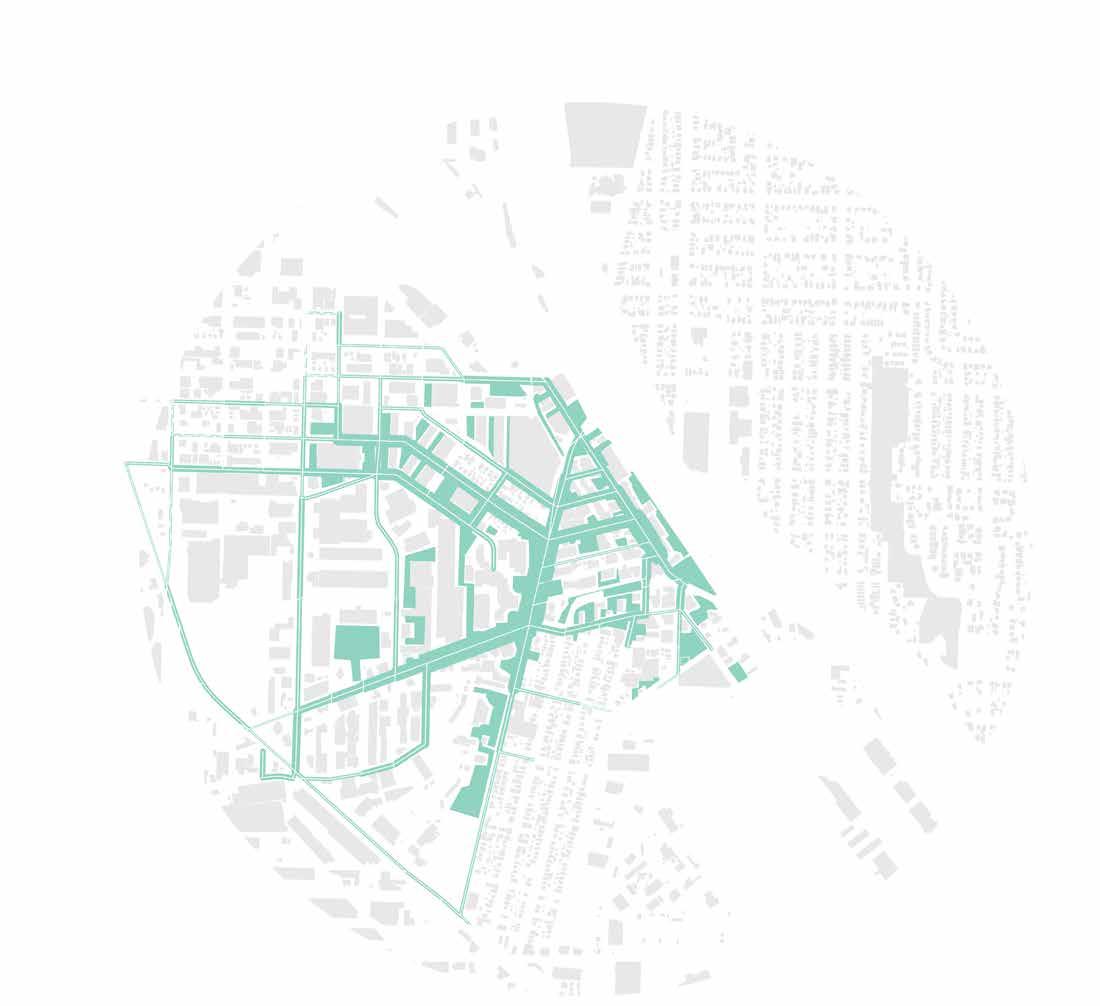
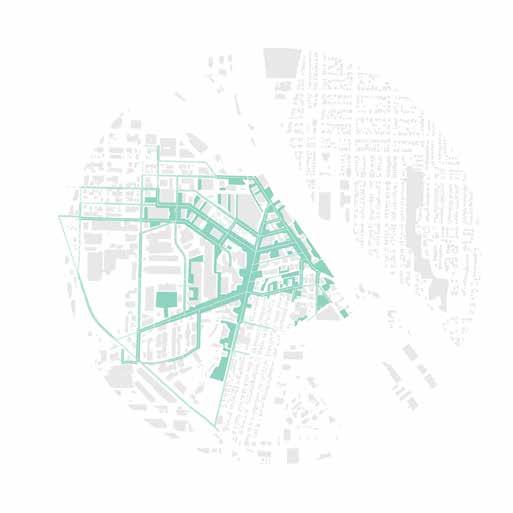
Once again the methodology is reiterating the same process you know the drill, the environmental data really highlighted the 3 parks for the 1300 people that lived there, and the low amount of canopy and street trees
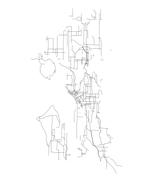
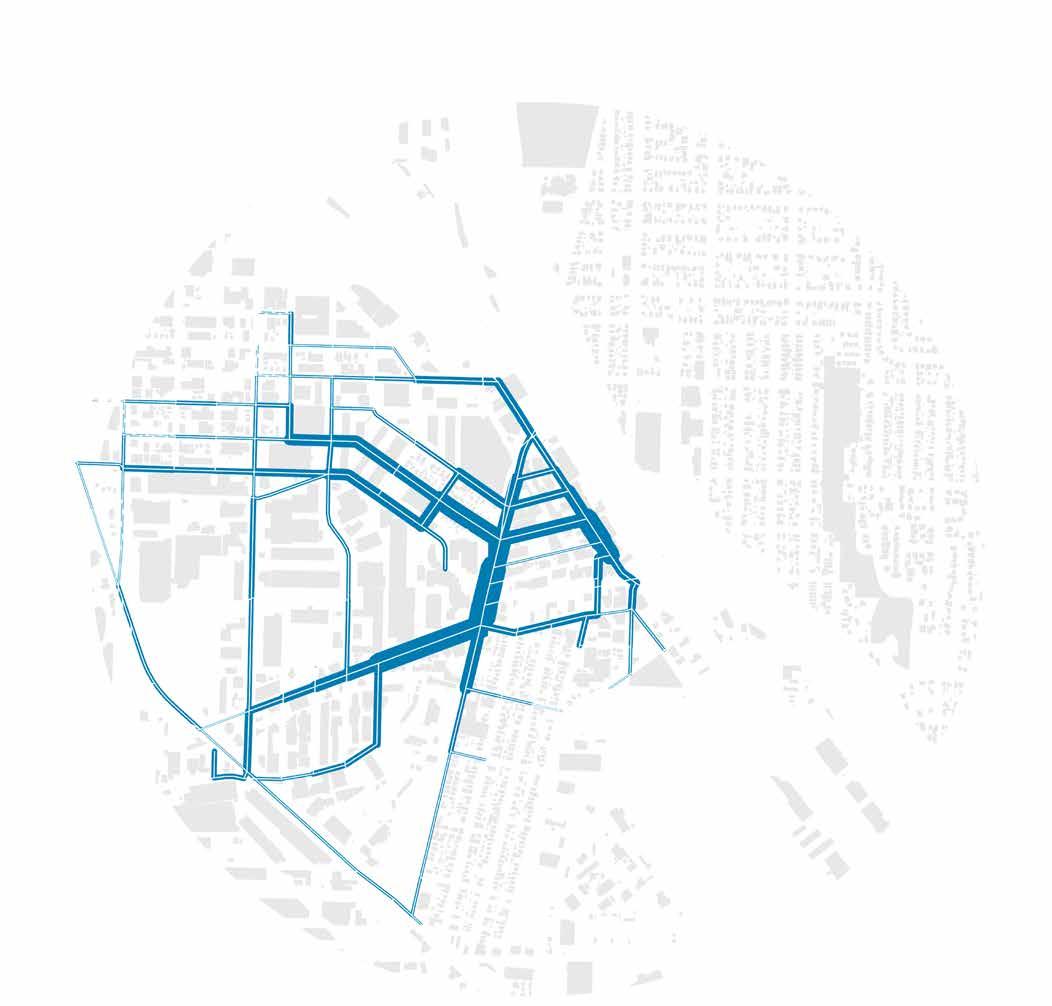
This is a city of seattle zoning map that kind of helps communicate how the people that live in this valley are swimming industry around large warehouse buildings that cut off the horizon.
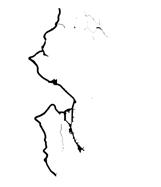
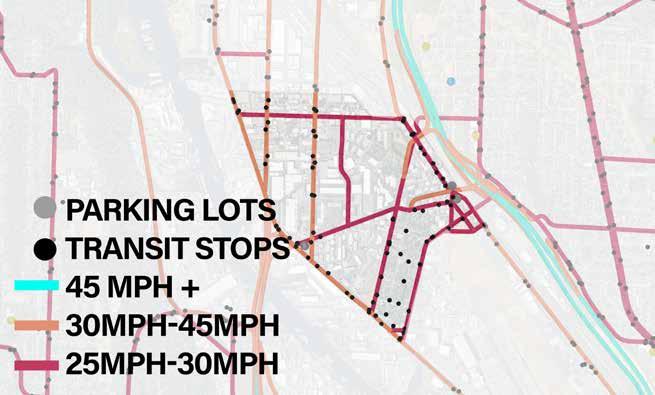
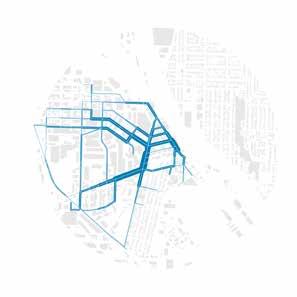
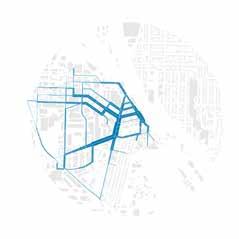
Transit and movement on site involved a lot of me going into google maps and picking a random site like burger king on marginal way and trying to see how google would tell me to walk, ride a bus, or drive myself through the space up to a cake shop by Cleveland High school in Beacon Hill. But overall the main arteries of the space move in an X that rise about the site as on ramps off ramps and passages to beacon hill over the pacific railway and under I5.
Identifying the main arteries was great because a lot of people don’t want to go for a jog down a busy road or idle traffic exhaust, and that meant this space can now be our public space, our little baby side roads and alleys with industrial history.
centroid
Tourism
ENVIRONMENT Tourism centroid
Tourism centroid
INFRASTRUCTURE
Tourism centroid
TRAFFIC AND TRANSIT
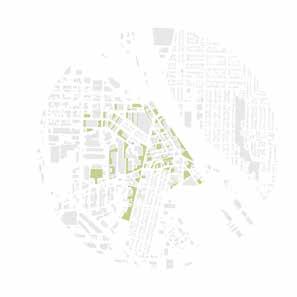
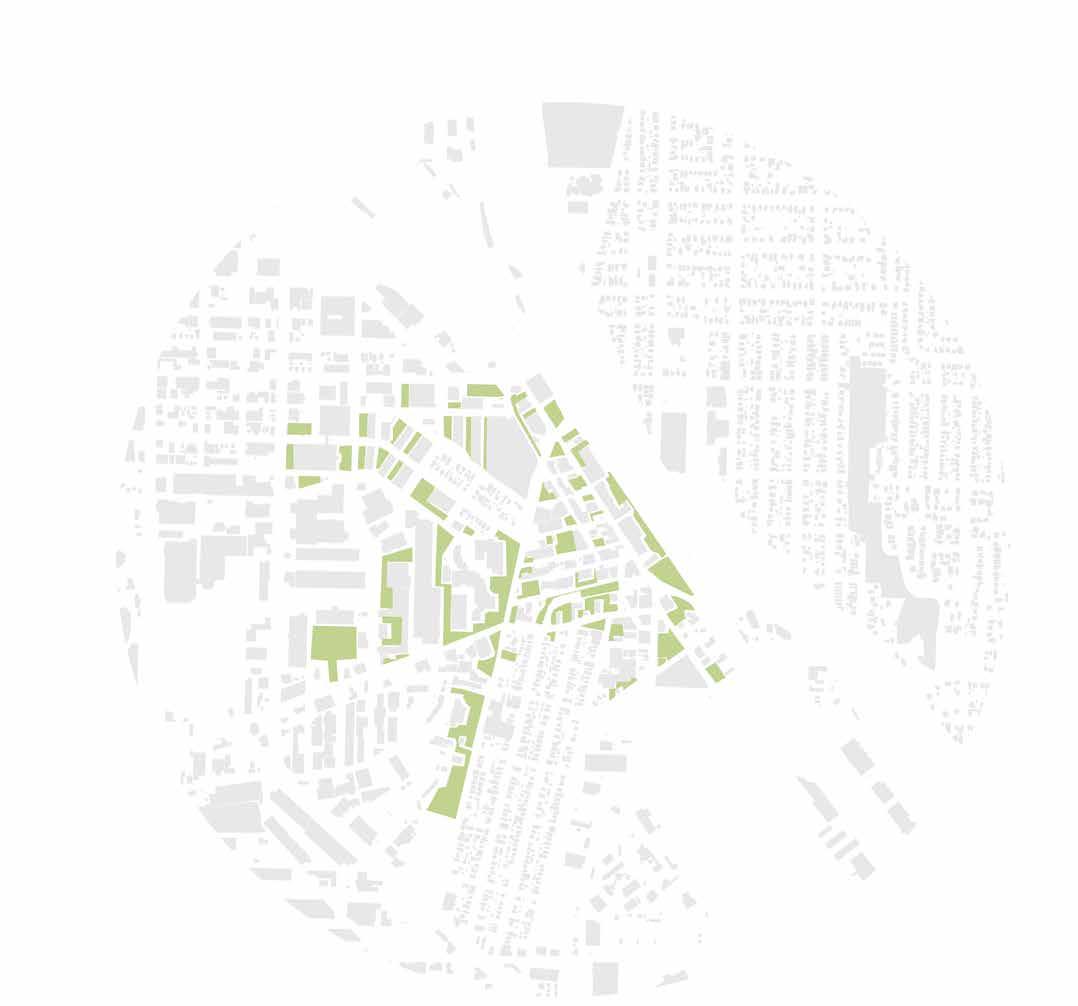
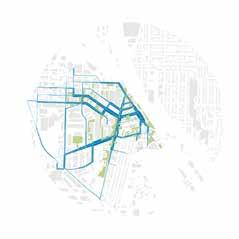
OPEN SPACE OPPORTUNITY
OPPORTUNITY
When we start to view the streets as our public space, we can isolate our areas of opportunity.
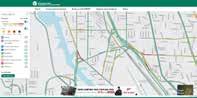
ADDITONAL DATA CREATION
98
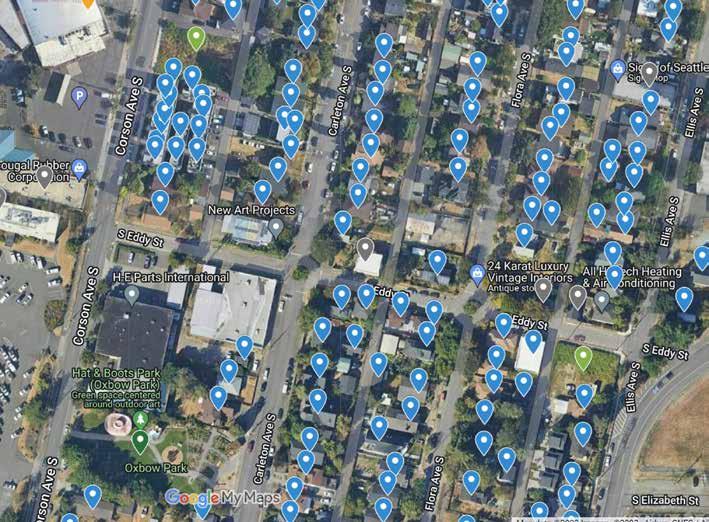
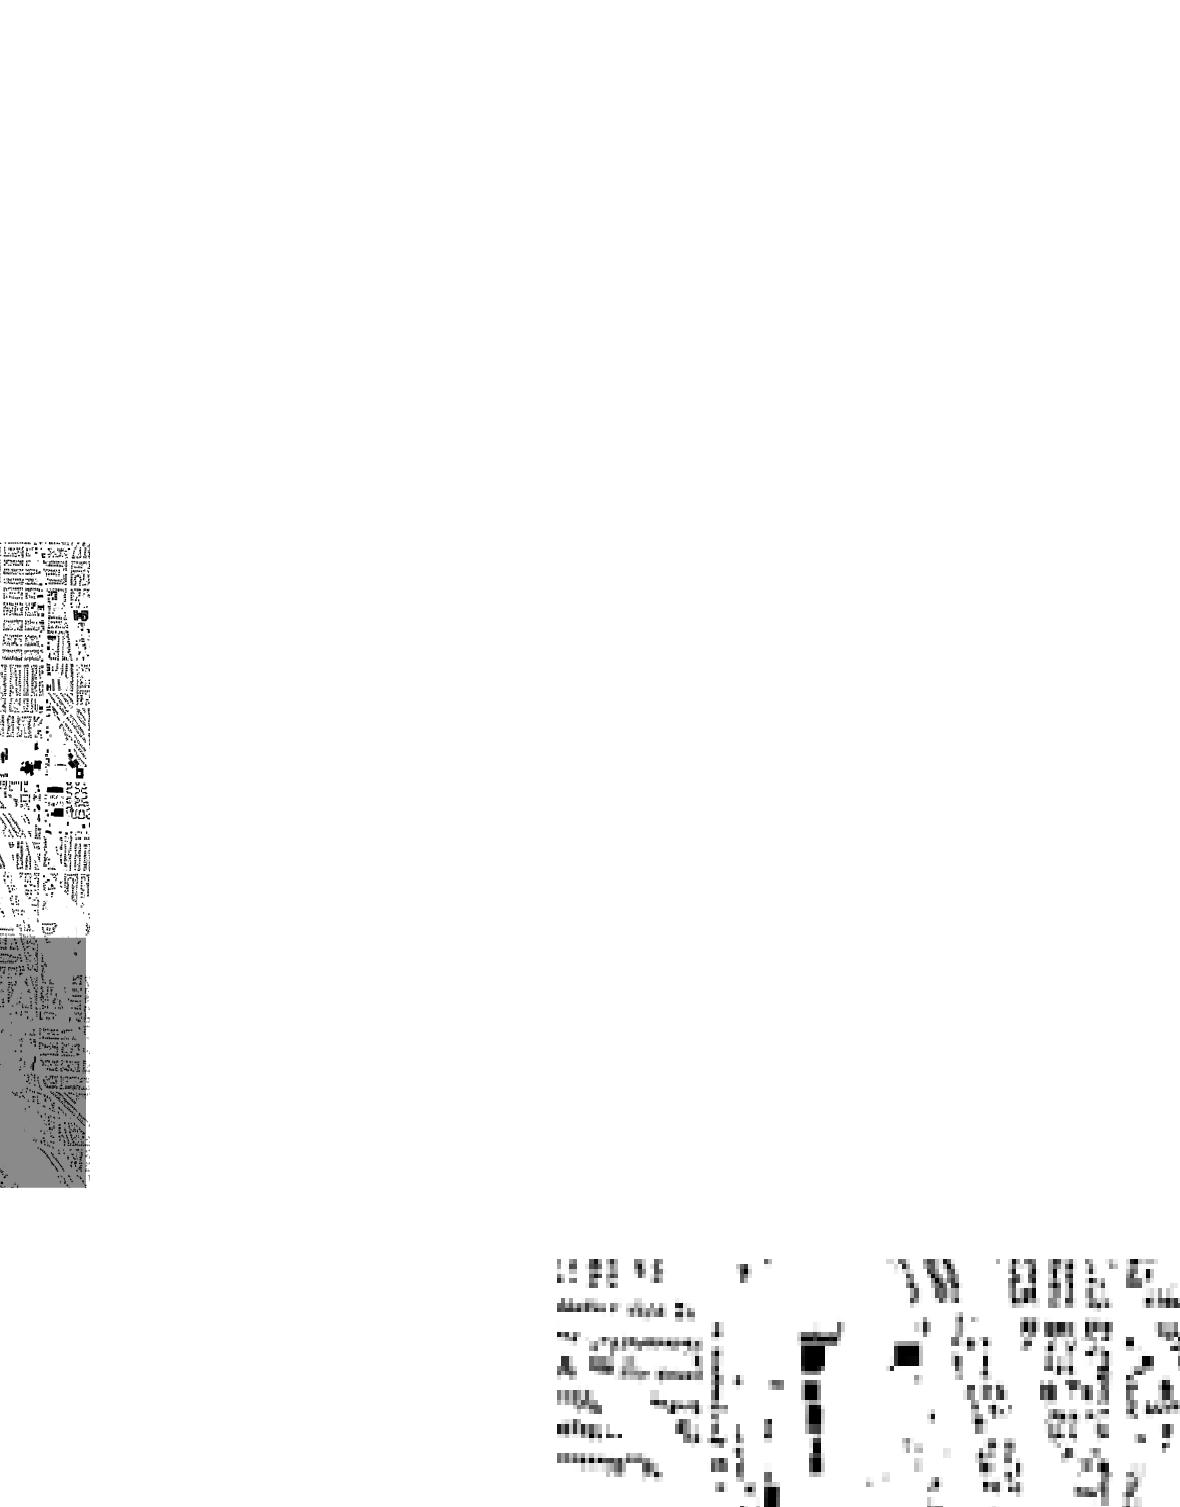
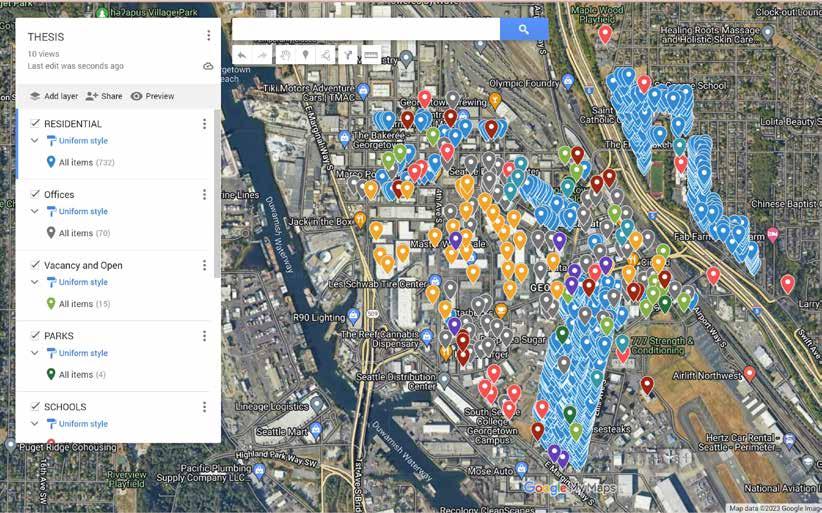
I quickly realized so much of what I was seeing in GIS wasn’t displaying how much I could see on Google Earth, so I started implementing Google MyMaps to actually annotate the site accordingly. To make it tell the story of what is happening here.
This process involved 2 monitors, with GIS, Google MyMaps, and Google street view all trying to get an accurate depiction of is that a house, is it an art studio, is it a restaurant for a 300 acre area.
99
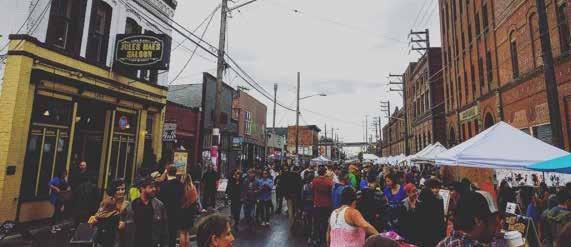
The most vibrant data I could find was of the people that made this space their place. Art walks, beer tours, wine tasting, summer street markets, p-patch produce selling, the people were here and they are so cool. This is the data that can’t be quantified.
TAKEAWAYS
• The current mobility of the site moves in an X, and allows for potetnial pockets of movement beneath existing ramps over and under I-5
• The zoning and infrastructure in GIS doesn't even compare to the reality of the space and the value it holds for it's local residents and visitors
• Common events in the area have already taken to the streets and adjusted traffic for markets, art walks, and other local gardening events. Sports and reinforcement of sport presence could fit in nicely.
• Street trees are lacking in a hot parking lot filled area
• GIS, Google Earth Google MyMaps, and Seattle Parcel viewer will never be able to communicate whats actually happening with the people in a place
Summary Steps:
1. Take your district and begin to understand how the people use it
2. Understand where people may collect in regards to the greenspace
3. Consider how zoning can influence community collection
4. Analyze the impact of cars to the pedestrian, because this could lead to potential road change proposals
5. Don't forget to investigate the culture of the residents, the site begins and ends with people always. Begin considering what type of areas or demographics could support different sport types
• Walking mobility and pedestrianism is so vital already to the health of this community's tourism and placemaking
• We could be a lot better about our data creation, and sharing in the U.S.
• The city of Barcelona's sport and exercise dataset would be an influential piece of knowledge in order to plan American cities for sport in the future
Softwares used: Google Earth, Google MyMaps, Seattle Design Equity Report , QGIS, ArcGIS Web Browser
104 REGENERATIVE SPORT URBANISM
ANALYSIS
SCALE 04: THE NEIGHBORHOOD SCALE
The most vibrant data I could find was of the people that made this space their place. Art walks, beer tours, wine tasting, summer street markets, p-patch produce selling, the people were here and they are so cool. This is the data that can’t be quantified.
105 DELANEY HOPEN - MLA
6 STEPS TOWARD DESIGN
Informed design steps attached to the methodology to aid designing the sport opportunities of neighborhoods discovered in analysis. These steps are incredibly crucial for designing the site and connecting sport to place.
106 REGENERATIVE SPORT URBANISM
SOCIAL SHED PRESENT PROGRAM SHORTEST WALK DESIGN
107 DELANEY HOPEN - MLA
COMMUNITY ENGAGEMENT OPEN-SPACE POTENTIAL SYSTEM-SPORT DESIGNATION
1 2 3 4 5 6
108 10 MINUTE WALK 15 MINUTE WALK 5 MINUTE WALK
SOCIAL SHED 1
I chose to determine my neighborhood center based on the collision of the two residential neighborhoods with the local tourism center. This area is then expanded touching the historic Van Asselt residential cluster, the historic Georgetown residential cluster, and the boundary between Beacon Hill. This area will become my focus area ranging predominately in the 10 minute walkable area.
109 DELANEY HOPEN - MLA
110
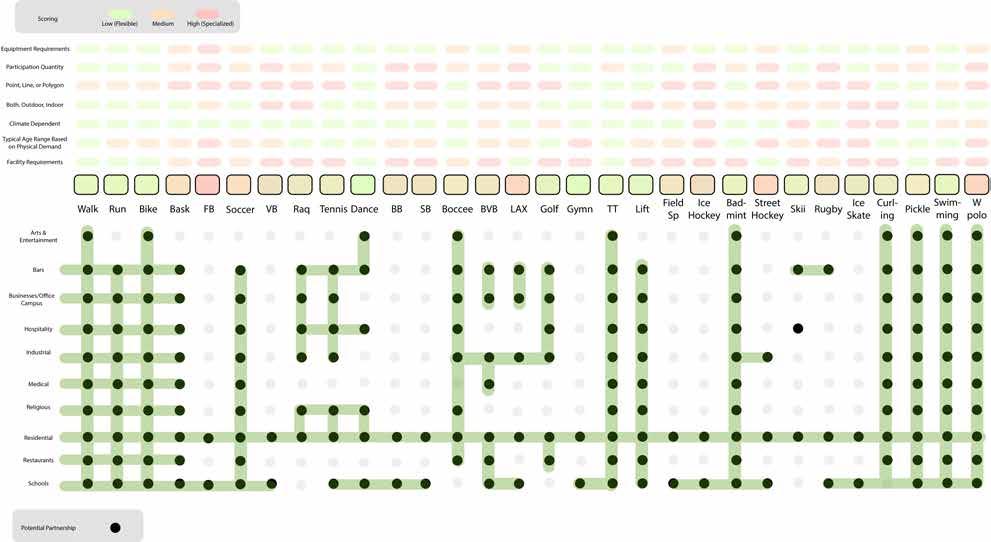
2 PRESENT PROGRAM
The second step then analyzes what kind of uses are existing within this system and 15 minute radius from residential neighborhoods. This allows for an understanding of how the existing system could attract designed areas catered to existing use. Embracing complexity is the goal, to use it as a guiding designer.
111 DELANEY HOPEN - MLA
112
2 PRESENT PROGRAM
113 DELANEY HOPEN - MLA
40% Industrial 20% Residents 10% Parks, Arts, Trade Schools 20% Businesses 10% Hospitality/Restaurants
Shortest walk from offices to art studios and galleries to parks
114
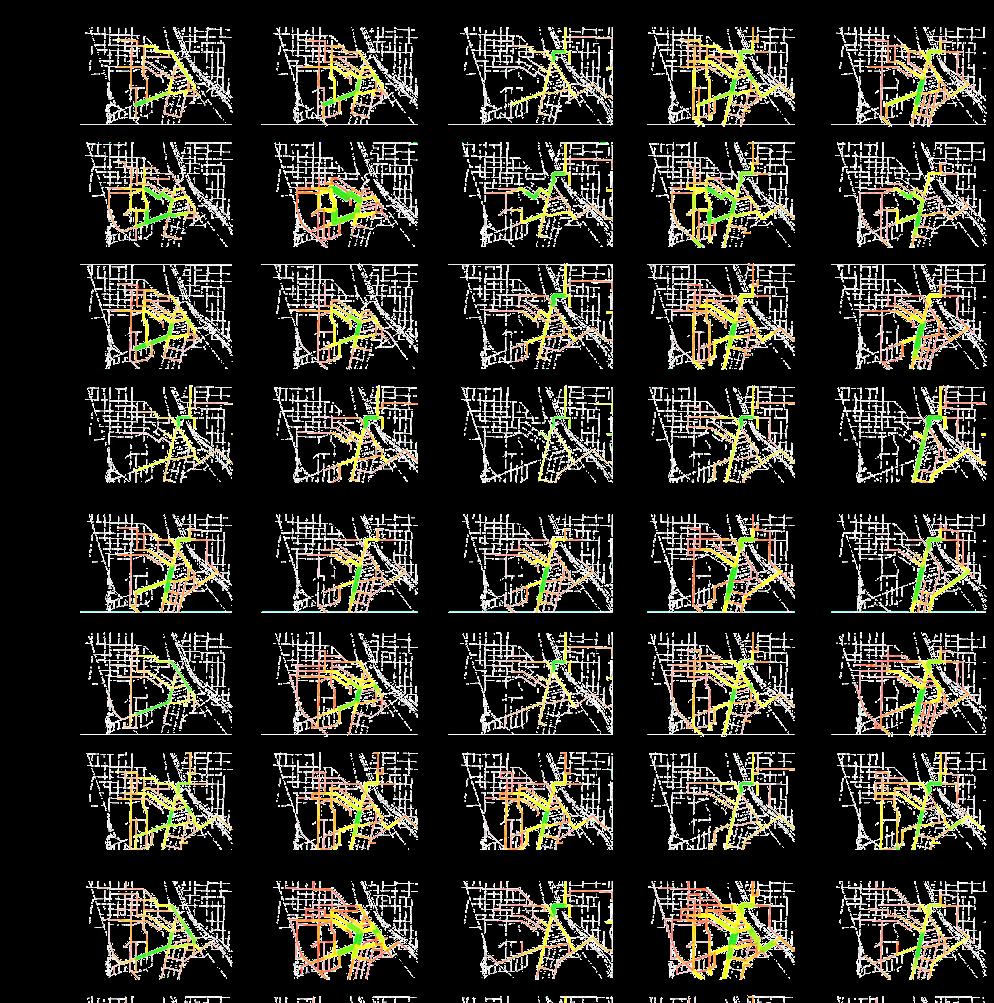
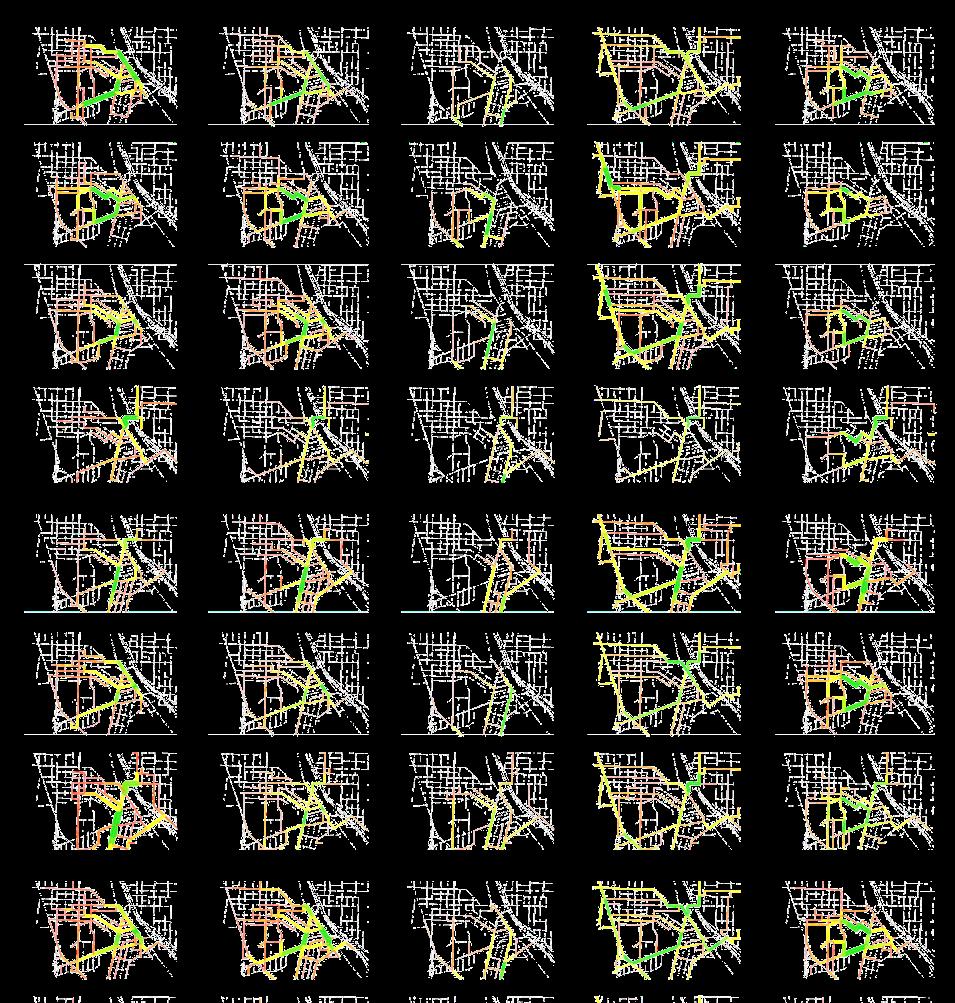
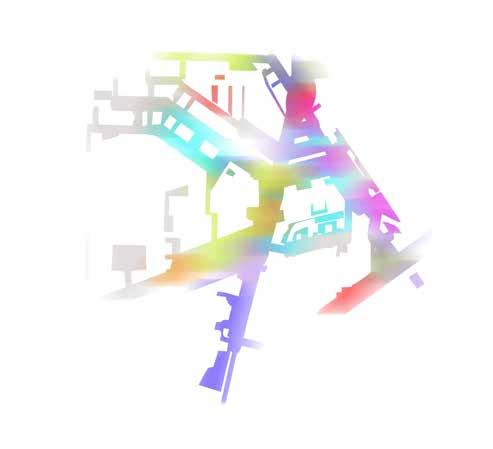
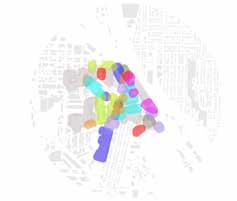
SHORTEST WALK
Engineered pathways using Rhino+Grasshopper allows for software based potentials between different points on site where people may move by foot in the most efficient way possible. This allows for hypothesizing of where street design implementation of sports to encourage and support foot traffic in the area.
Strava Running Data
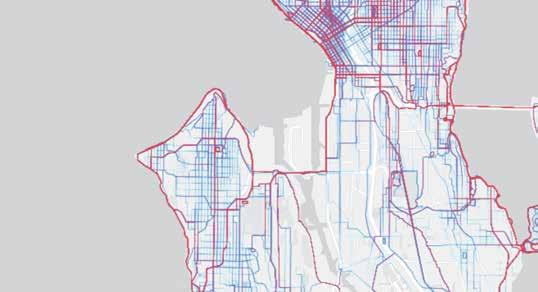
115 DELANEY HOPEN - MLA
3
+
116
117
118
119
SHORTEST WALK
121
122
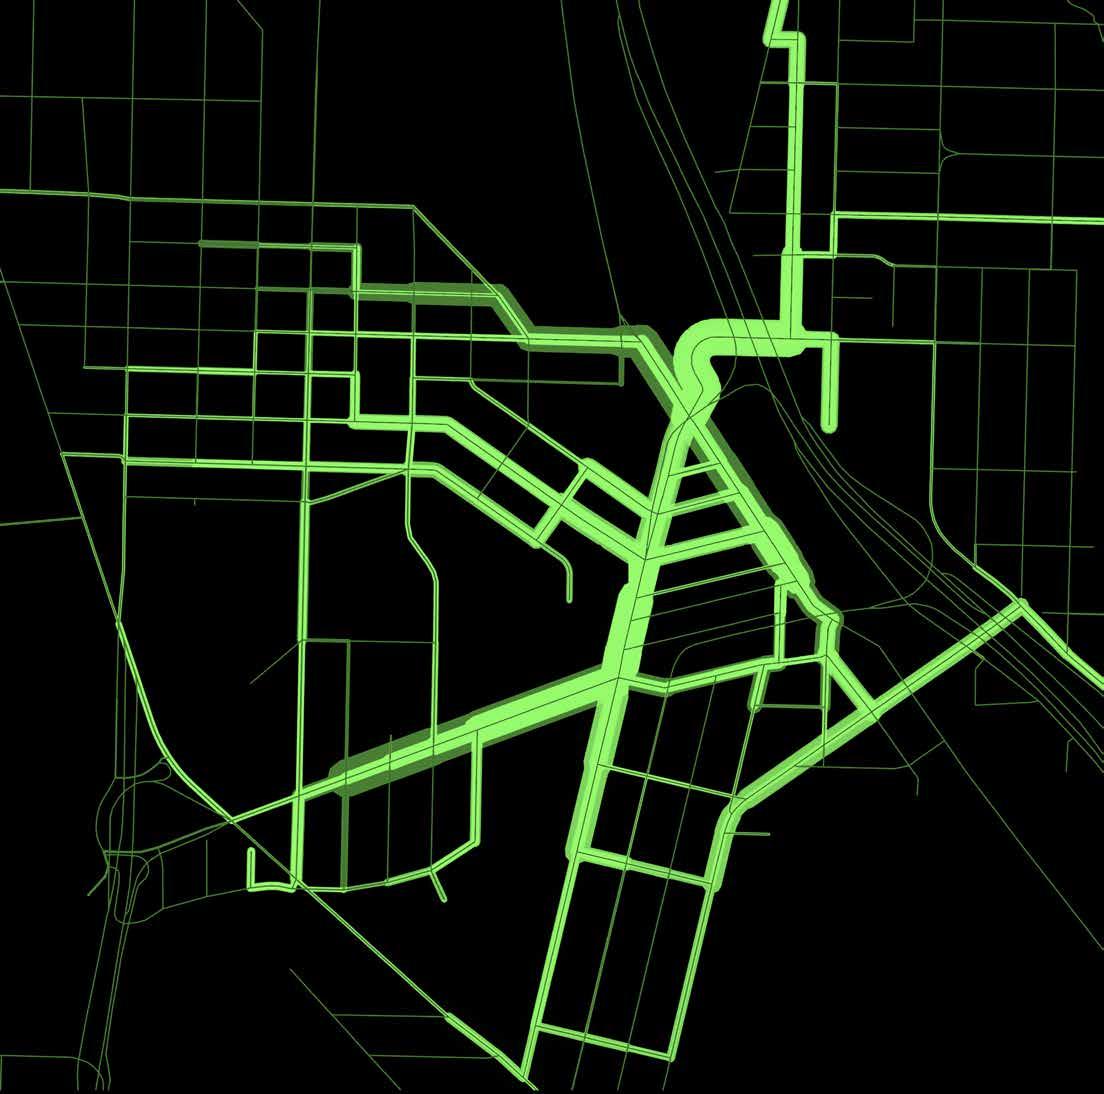
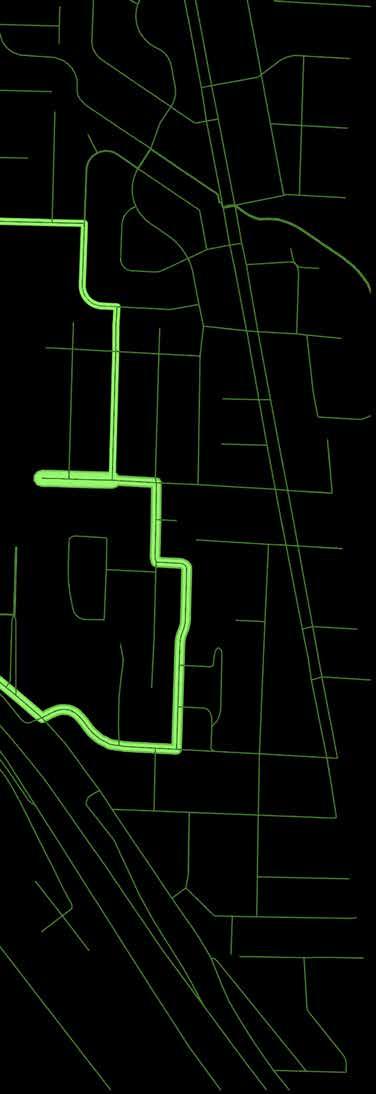
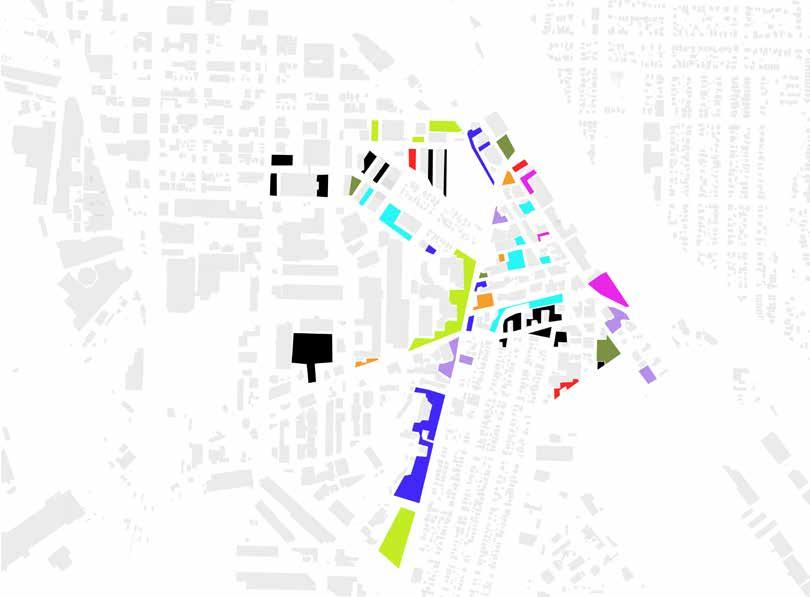
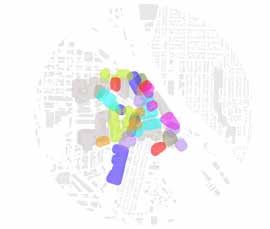
4 OPEN-SPACE POTENTIAL
Determining existing open space is important for understanding where a city can expand and think creatively about public space in the area. In this area, underutilized vacancy through Google Earth, Google MyMaps, and Seattle Parcel Viewer
123 DELANEY HOPEN - MLA
124
4 OPEN-SPACE POTENTIAL
Determining existing open space is important for understanding where a city can expand and think creatively about public space in the area. In this area, underutilized vacancy through Google Earth, Google MyMaps, and Seattle Parcel Viewer, then combining with shortest walk to find opportunity.
125 DELANEY HOPEN - MLA
126
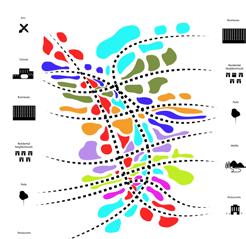
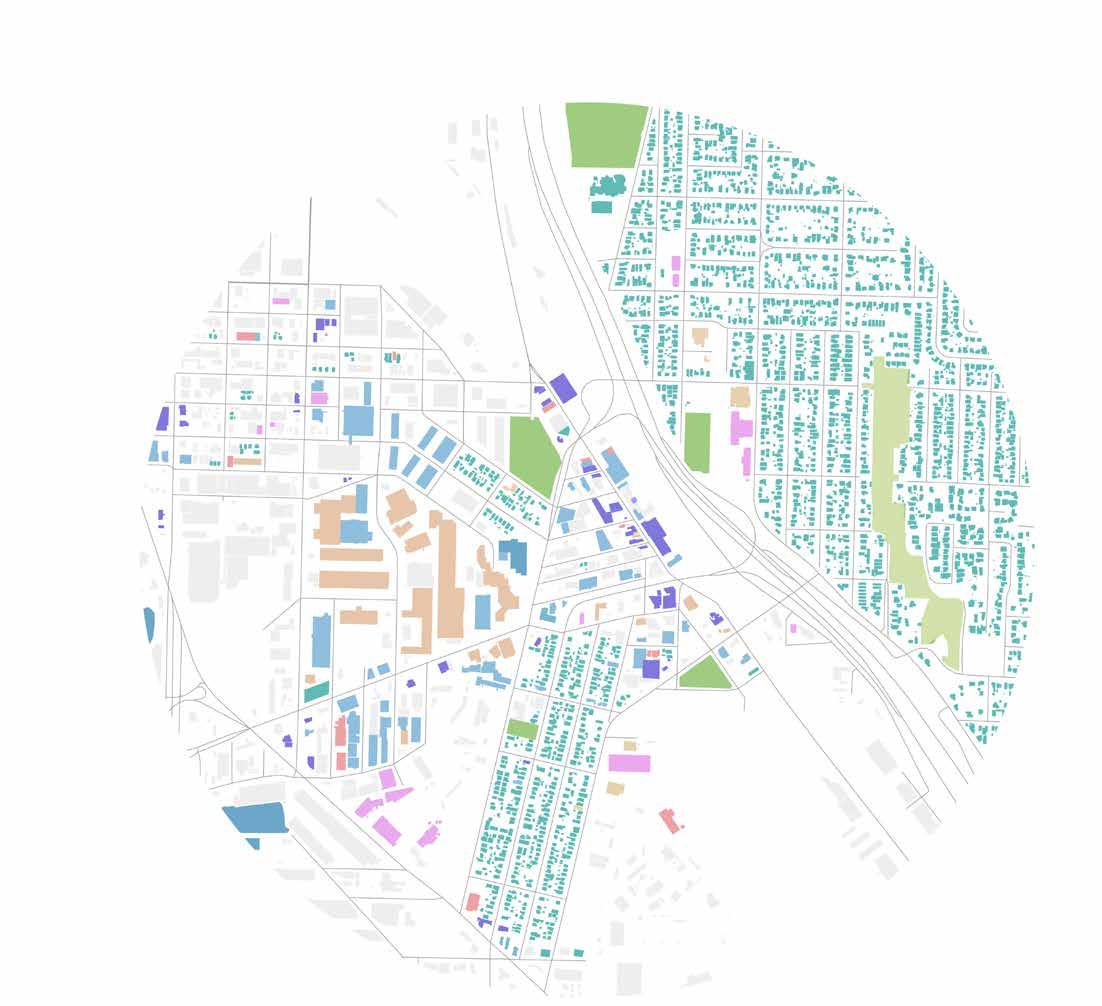
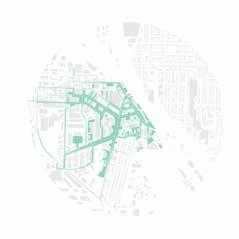
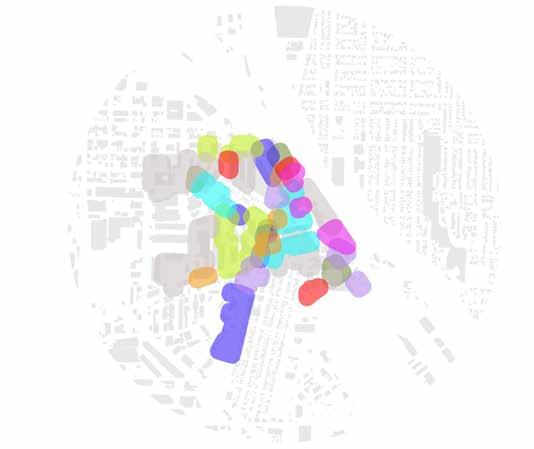
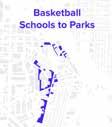
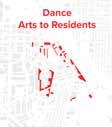
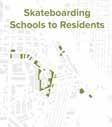
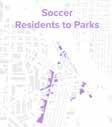
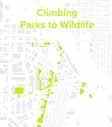
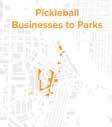
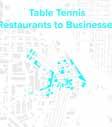
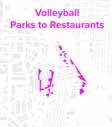
SYSTEM-SPORT DESIGNATION
Selecting particular sports that could be enjoy based on their chosen paths and demographics in a space.
127 DELANEY HOPEN - MLA 5
REGENERATIVE SPORT URBANISM
SYSTEM-SPORT DESIGNATION
Selecting particular sports that could be enjoy based on their chosen paths and demographics in a space. Create a map and lcoate where all of these possibilities for sport can occur.
129 DELANEY HOPEN - MLA 5
DESIGN
NON-PROFIT COMMUNITY GROUP OPPORTUNITIES FOR POSTINDUSTRIAL RETHINKING FOR COMMUNITY EXERCISE


COMMUNITY ENGAGEMENT 6
10% INDIVIDUAL
20% OPEN SPACE
20% COMMUNITY SPECIFIED
Now that you have followed steps 1-5 you can have this maximized outcome where you and the community can say of this potential what sports would be fun for you and how will we get there? Do you have non-profits interested in buying this vacant space, are you interested in some? Overall step 6 is be a good listener, and maybe just make all those flexible green space where a kid can do some cardio training.
50% TEAM
TAKEAWAYS
• Being able to read what the landscape is telling you holds just as much value as to what the people are telling you
• Look for ways the community is already placemaking and tie exercise into it. Beer and wine tours promote walking, Georgetown P-Patch gardens promote a healthy relationship with nature, they should blend together.
• There is so much opportunity spatially to implement a larger system of sport integration through street design, as well as vibrant community activity
• The location negatives can be looked at as positives for seasonal intervention, like underline sport spaces as infrastrucal canopies out of the rain.
• GIS sport data needs so much love. Let me help please.
Summary Steps:
1. Identify how much enviornmental canopy and green space is needed for the district youre focused on
2. Consider what space can now be freed up for public use instead of vehicular
3. Begin understanding how transportation by vehicle helps your system function
4. Identify potential partners in ways that can promote physical health, and build new bridges between adjacent communities, mixing is good
5. Do whatever you can to make your data accurate, investigate, and build your network through all softwares and resources
6. Dont be afraid to break the current system, especially if it means removing power from the SOV
Softwares/Materials used:
Google Earth, Google MyMaps, Rhino, Grasshopper, GIS Adobe, Seattle Parcel Viewer, NHANES Sports based on Ethnicity Race and Income for Obesity Data, Reddit, Facebook, Instagram, Twitter
134
DESIGN + IMPLEMENTATION SCALE 05: LETS PLAY
What Casas Valle gives us is this understanding of how sport is stressed by space, and games often have measurement restrictions on them so they see a lot of pressure. They are an after thought, or they are moved outside city limits which stressed inequity of who can afford to get there and use them.
135
"By continuous urban development and densification of the existing city many sports facilities get under pressure spatially (Van der Ploeg 2010, Bosch 2009 pp. 44-53).
This results in translocations of sport fields toward city edges, because of building construction opportunities. Parallel, the spatial quality of many sports facilities is often bad and ugly (Van der Linden 2009): no proper spatial planning, mono functional, unattractive and anonymous architecture, badly embedded in the neighbourhood, hidden behind closed green areas, little or no relationship to public space; sport (parks) are often isolated from its urban surroundings.”
-Daniel Casas Valle, Sport in the City
136
DANIEL CASAS VALLE

137
Urban Designer and Researcher Urbandynamics, Portugal


1 2 3 4 5 6 7
PROCESS
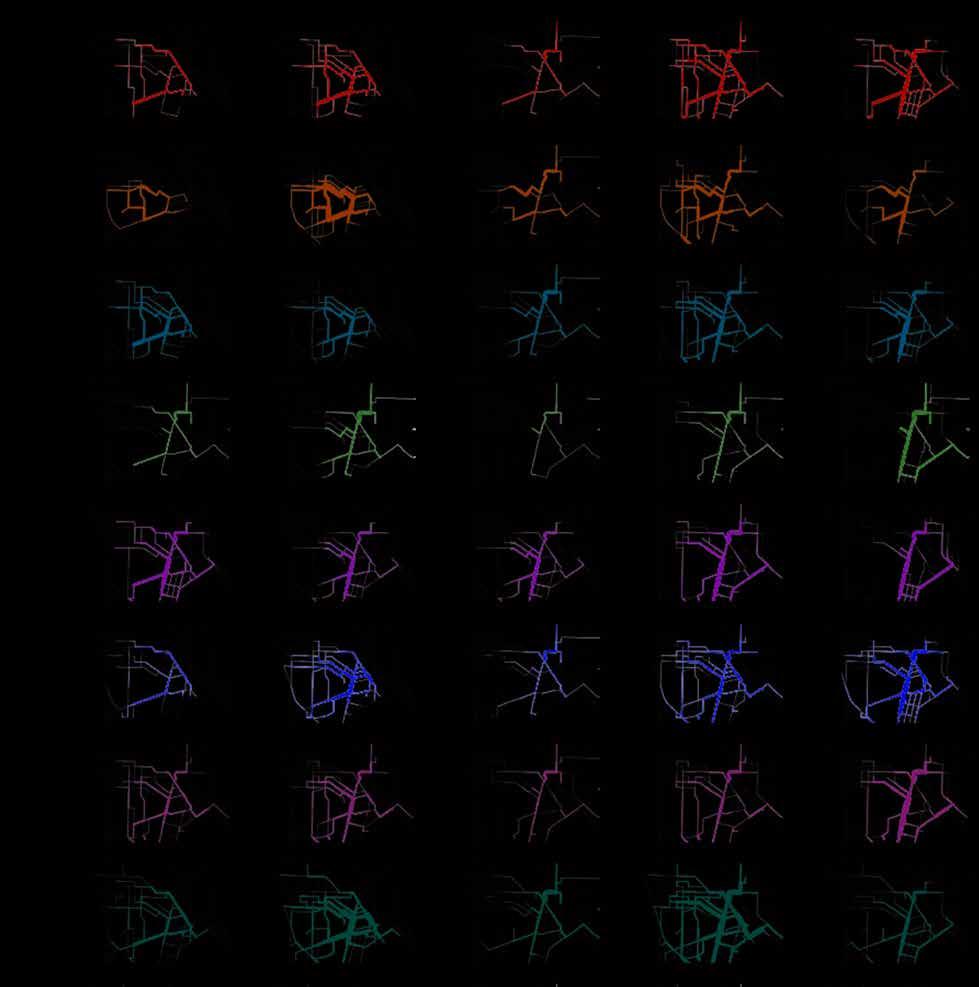
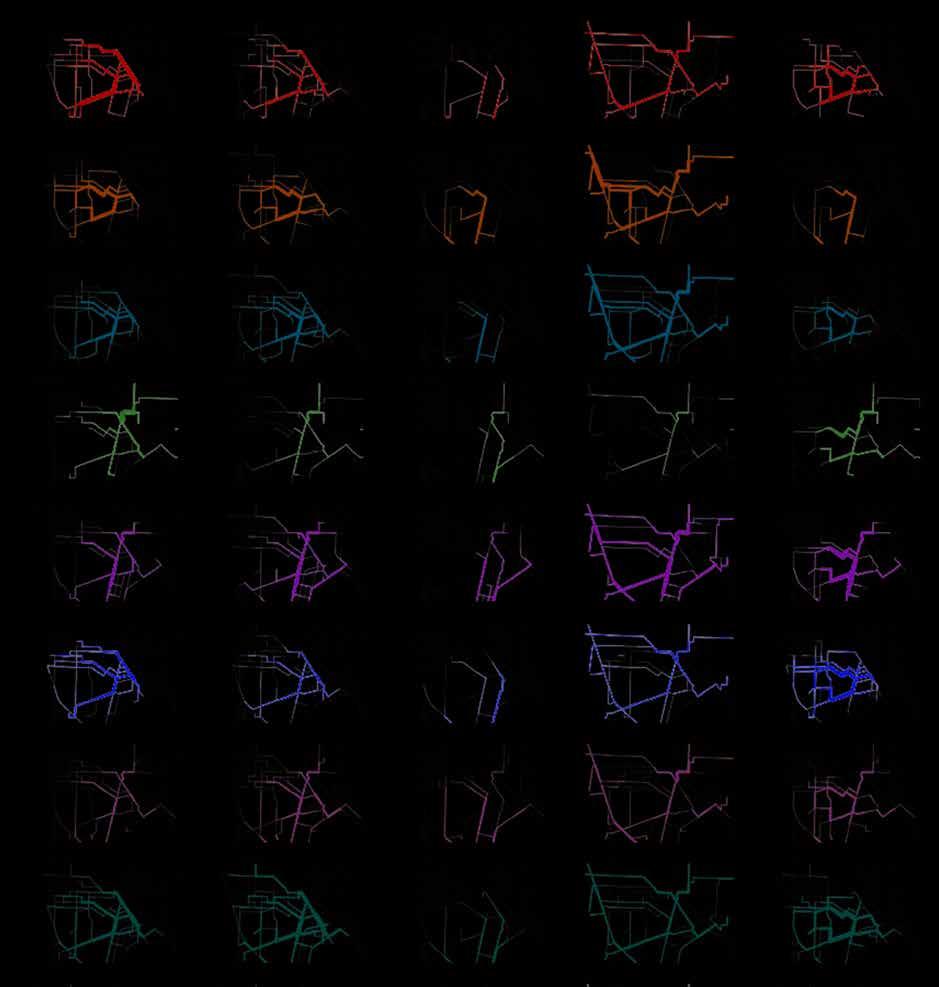
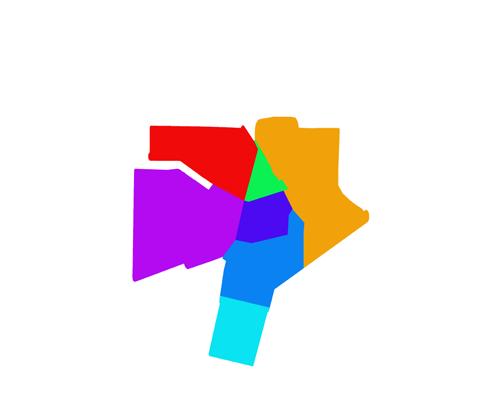
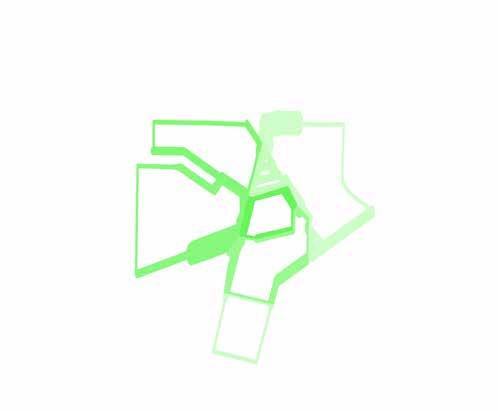
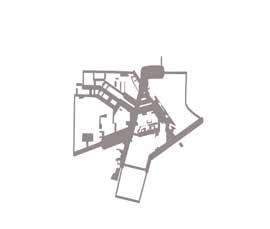
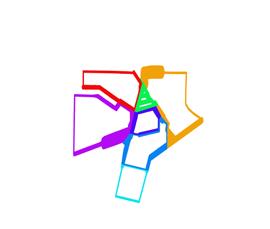
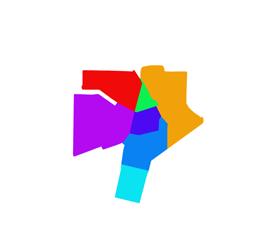
After understanding what is now a masterplan area I needed to make this site and it's organization a bit more digestible. Moving from open space, to suggested sport implementation areas, to how it could directly be applied spatially I chose to break this area down into 7 areas.
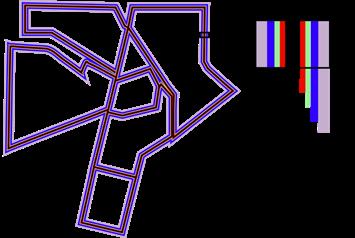
PHASING, RUNNERS LOOPS, AND CIRCULATION
Phasing adds control over a 300 acre area. This will assist in Masterplanning.
Our shortest walk also offers the ability to analyze runners loops. This is beneficial for the athlete and street design.
in order to move throughout this space to consider sport use is running. Running, biking, and transportsport would accommodate the current issue of lack of canopy in the space, while proposing a speed hierarchy onto these area boundaries. By minimizing space and assigning the predominant space to the pedestrian this requires site analysis.
"1. Customization – sport as an urban meeting place
a. When a sport place combines different aspects of the toolbox, it can have a role as an urban meeting point, for people of the street, neighbourhood, city or region. For the topic ́sport as a social meeting place ́, it is important to open-up the sport planning.
2. Increase sport inclusive thinking
a. In the perspective of the active or healthy city model, sport plays a significant part. Therefore, it should be logic to promote ́sport inclusive thinking in planning. Not as a ́separated functionality ́, but as one of the important activities that improves the living quality in general. It should be logic to think about sport potential and possibilities in every urban spatial and urban plan, as it is for individual motorized mobility.
b. There is a culture clash between spatial planning and sport planning. Differences as: specific interests, planning periods, investment flows, political departments, development logics, technical requirements, laws and regulations and professionals should be discusses.”
-Daniel Casas Valle, Sport in the City
140
DANIEL CASAS VALLE
141
Urban Designer and Researcher Urbandynamics, Portugal
"1. Sport Size/typology
2. Position in the City:
a. Combine large complexes and stadia with things like restaurants, shops, hotels, and music venues for a larger economic value to small businesses.
b. Think about the diversification of uses by creating an urban hub, while diversifying the crowd who can use it (aka different sport types, accessibility, shade/ comfort etc.)
c. To attract visitors sport should be visible
3. Relation with public space
a. The connection and relationship between the sport entrance and city context is essential
b. Space manipulation can turn a “purely-functional place… into a versatile, well-used urban place”
4. Visibility
a. “The visibility-aspect of today's sport creates the need for a stage. Watching, showing and chatting, making sport a social place where people can meet. Striking design enhances the image of sport.”
5. Distance and Proximity
i. Connect the sport to the city life, enlarge the visibility of sport, create an attractive and safe public space that connects to the environment
ii. Stimulate multifunctional use
6. Accessibility
a. Create a slow traffic route with an attractive public space to encourage physical movement
b. Take note of cycle and vehicular parking to plan how people could move
7. Public Access and Lockability
a. Visibility does not have to suffer from closing off during particular hours, but consider how designs can function without daylight hour use (materials, etc.)
8. Flexibility
a. Designated flat, paved or lawn, open space paired with raised courts or surfaces can act as community gathering aside from solely sport play. Bi-product spaces for access like parking lots and walkways also serve as such.
Programmatic Goals
1. Sport Chains
a. Create as much cohesive interaction between different athletes as possible, combining organized and non-organized, individual and group, allows for more exchange
2. Create smart combinations
a. In Denmark hospitality and sport are deeply intertwined with the history of Kulturhusets
b. In America Sports bars and drinking culture of competitive nature are deeply intertwined lol
3. Program Mix
Organizational Aspects
1. Policy and Target Group
a. Mixing consists of different sports, library, playground, restaurant / canteen, hotel (for athletes), centre for sports, municipal sports department and a conference centre. This centre attracts different people and has an area of increasing function.
2. Use
a. On one hand, is multiple use is financially more efficient, on the other hand, the synergy between the users sometimes is overestimated. Clarity about the principles and goals of multiple use is important in the planning phase.
3. Maintenance
a. Requirement to use a sports facility efficiently is a good match of use by various users and associations. Money for professional maintenance and management is often lacking. Allowing new sports groups on existing sports facilities therefore is difficult.
4. Developing Sport Space and Facilities
a. If sport in an urban environment is considered important, it is essential to take sport fully in the development phase. Integration after construction of a neighbourhood is often financially and spatially impossible.
b. Intensive collaboration between the designers and the public space of the city department is necessary.
c. At the same time there is stagnation in the implementation of the construction. The smart combination with allotments next to the gym makes combined use possible; children are sporting while parents harvest vegetables.”
-Daniel Casas Valle, Sport in the City
DANIEL CASAS VALLE
Design Guidelines:
Takeaways:
1. Understand sport is representation, and inclusivity in the landscape.
2. Parking lots are your friend when your planning and designing for sport.
3. When there is no public park space, make public park space. The streets are your friend too.
4. Proper attention to detail is important. specifically lighting and accessibility can make a space feel safe for one and not another if brushed over.
5. Consider time of day, month, and year, and how your design can support grandma on a walk, a kiddo skating home from school, and event hosting for sporting events and street-shut down.
6. Support the athlete as a designer, and respect their void, even if that means you do a little less.
7. Daniel is right, mix as much as possible. Communities, uses, etc. you have a special opportunity as a Landscape Architect to bring people together.
8. Plan for heavy use, which means flexibility, long term wear-and-tear, and the impacts of climate change
FINALLY, THE GREATEST CHALLENGE LIES IN BRINGING TOGETHER THE WORLDS OF SPORT AND SPACE, AS PART OF THE MULTIFUNCTIONAL CITY. IF THIS IS DONE BY MUTUAL RESPECT AND A HEALTHY PORTION OF CHALLENGE, IT CAN GIVE A POSITIVE BOOST FOR BOTH THE SPORT AND FOR THE CITY
-Daniel Casas Valle, Sport in the City
" "
Special thanks to Hannah Chapin, Celia Hensey, Skylar Holloway, Ignacio Lopez Buson, Amoreena Miller, Rob Ribe, Philip Speranza, Kory Russel, Mary Polites, Cameron
McCarthy LAP, my Webfoot family, my BCN Urban design group, and our MLA-BLA
entire cohort and staff at UO for being such a supportive body these past 3 years.
and my Mom, Dad, Grandparents, Mackey, Zane and Alexa for always asking if I'm sleeping even when they know the answer.
1. Friedman, Michael T., and Jacob Bustad, ‘Sport and Urbanization’, in Robert Edelman, and Wayne Wilson (eds), The Oxford Handbook of Sports History, Oxford Handbooks (2017; online edn, Oxford Academic, 10 May 2017), https://doi.org/10.1093/ oxfordhb/9780199858910.013.3, accessed 16 June 2023.
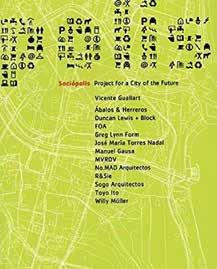
2. Santiago, J., & Sola, M. (2019). Superilla Sant Antoni. ESCOFET. https://www.escofet.com/en/projects/streetscape/superilla-santantoni
3. Dumpelmann, S. (2022). Landscapes for sport: Histories of physical exercise, sport, and health. Dumbarton Oaks Research Library and Collection.
4. Louv, R. (2008). Last child in the Woods. Algonquin Books.
5. Vamplew, W. (2022). Sports economics for non-economists. Routledge Taylor & Francis Group.
6. Miles, E. (2022). Nature is a human right: Why we’re fighting for green in a Grey World. Penguin Random House.
7. Person, Luis, J., & Paramio-Salcines. (2013, July 24). Sport and urban regeneration: 26: Routledge Handbook of Sport Policy. Taylor & Francis. https://www.taylorfrancis.com/chapters/edit/10.4324/9780203807217-26/sport-urban-regeneration-juan-luis-paramiosalcines
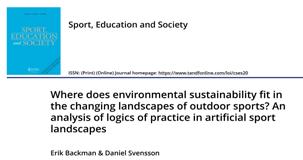
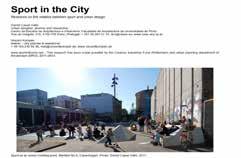
8. Kompier, V., & Valle, D. C. (2015, March 19). Sport in the city - A new design and planning tool for sport facilities and outdoor space in urban environments - Amsterdam, Berlin, Copenhagen, Porto, Valencia. Academia.edu. https://www.academia.edu/10338266/ Sport_in_the_City_a_new_design_and_planning_tool_for_sport_facilities_and_outdoor_space_in_urban_environments_Amsterdam_ Berlin_Copenhagen_Porto_Valencia
9. Dickson, G., & Zhang, J. J. (2020, December 7). Sports and urban development: An introduction. International Journal of Sports Marketing and Sponsorship. https://www.emerald.com/insight/content/doi/10.1108/IJSMS-11-2020-0194/full/html
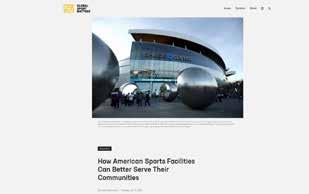
10. Kleen, B. (2022, June 14). How U.S. sports facilities can better serve cities. Global Sport Matters. https://globalsportmatters.com/ research/2022/06/14/how-american-sports-facilities-can-better-serve-communities/
11. Kleen, B. (2022, June 14). How U.S. sports facilities can better serve cities. Global Sport Matters. https://globalsportmatters.com/ research/2022/06/14/how-american-sports-facilities-can-better-serve-communities/
12. Council, B. C. (2022, October 17). The new urban mobility plan puts pedestrians at the centre. The new urban mobility plan puts pedestrians at the centre | Info Barcelona | Barcelona City Council. https://www.barcelona.cat/infobarcelona/en/tema/mobility-andtransport/the-new-urban-mobility-plan-takes-on-board-84-of-demands-and-suggestions-put-forward-2_1218221.html
RESOURCES
RESOURCES

Masters In Landscape Architecture, UO 2023
Bachelors in Geological Sciences, Minor in Landscape Architecture, UI 2020
Delaney Hopen
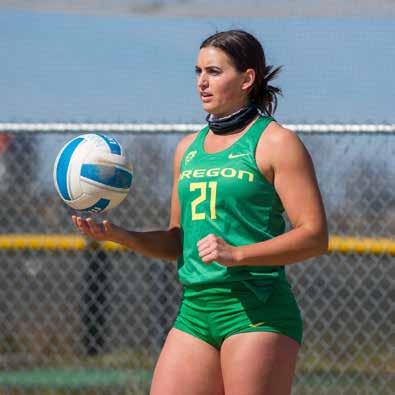
Beach Volleyball (little), UO 2020-2021
Outside Hitter/Defensive Specialist/Libero, UI 2016-2020
Coach 2013-Present
Delaney Hopen
REGENERATIVE SPORT URBANISM
