
9 minute read
Crude Oil Boiling Point Characterisation for Process Simulation of an Atmospheric Crude Distillation Tower
Written and Prepared by:
Advertisement
The simulation of refinery processes offers a technical and learning challenge to engineers. While many engineers focus their attention on modelling facility equipment, distillation columns, heat exchangers or rotating equipment, the most critical exercise in building a refinery simulation model is the characterisation of the feedstocks ANAD products.
This article provides a brief overview of how to characterise crude oil using Unisim, a process simulation software from Honeywell. Once the crude is characterised, it can then be used as a basis for simulating various refinery operations, the atmospheric crude distillation tower, preheat train and product stabilisers. This is the most basic characterisation strategy which allows an engineer to generate the fundamental heat and material balances. The characterisation exercise formed the core module in the training programme to design a Crude Oil Refinery – previously organised under IEM’s Structured Training Programme.
Crude Oil Boiling Points & Laboratory Distillations
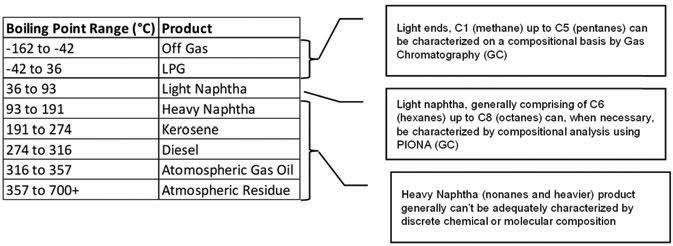
Crude oil can contain up to 30,000 different components, primarily hydrocarbons (normal and branched paraffins, olefins, aromatics, and naphthenes) with normal boiling points ranging from -162°C (methane) to over 1,000°C. Upon fractionation, crude oil yields the following typical products... C6+ product yields are typically defined by boiling point ranges. [Note: “C6+” herein denotes molecular product yields containing hexane (C6H14) and heavier components].
Boiling point curves for crude oil feedstock and atmospheric and vacuum unit products are obtained from laboratory distillations. The following laboratory analyses are employed to generate boiling point curves:
1. ASTM 2892 True Boiling Point (TBP). Packed Column (typically 15 theoretical stages with 3 or 4 to 1 reflux). This is generally used for crude feedstocks.
2. ASTM D86. Single stage non-refluxed distillation for naphtha and other middle distillates.
3. ASTM D1160. Single stage vacuum non refluxed distillation for atmospheric residues.
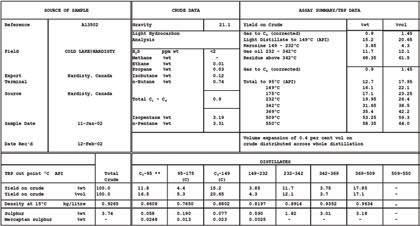
4. ASTM 2887. Simulated Distillation, high temperature gas chromatography. Laboratory distillation results and other analyses are consolidated in a crude assay report. The following is a partial extract from a typical crude assay report.
Nehemiah Prestress
1140945-A
A small portion of a crude assay is shown (Table 2). A crude assay contains a significant amount of information on the properties of the total crude as well as the properties for various boiling range “cuts” on the crude.
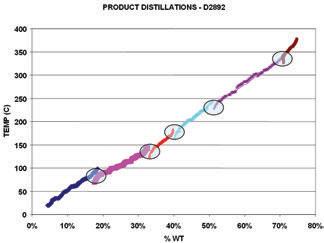
In some cases, a TBP distillation is also performed on crude oil products and a reconstituted TBP curve can be created by overlaying all the product cuts on a common axis. Note the appearance of boiling point gaps and overlaps between the product cuts.
In this article, we will focus on the boiling point characterisation of crude oil and its products. However, in addition to boiling point distributions, laboratory analyses may also be performed to obtain:
1. Thermophysical and transport property curves, density and viscosity.
2. Impurities, like sulphur and metals (important information as these components can poison catalysts).
- Post-tensioning solution provider
- Carpark Flat Slab
- Transfer Plate
- Beams, Box Girders
- Alternative design solutions
- Cable systems (stay cable main cable hanger)
- Bridge bearing and expansion joint
- Construction solutions (heavy lifting, ILM, etc)
- Monitoring, repairing and strengthening for structures
The Strand, Kota Damansara
47810 Petaling Jaya
Selangor Darul Ehsan
Tel : 603 6142 6638
Fax : 603 6142 6693
Email : enquiry-pt@nehemiah-grp.com
Group
Process Simulation
Table 1 and Figure 1 show that a very small amount (3%) of the crude oil in this example, may be represented by chemical or molecular representation. This is true for all crude oils, middle distillates and heavier products.
In a commercial flowsheet simulator like Unisim, various calculations on oil streams require a set of MESH (Material Balance, Equilibrium, Summation and Heat Balance) to be solved. For example, MESH calculations are performed at every stage in a distillation tower in Unisim to determine the compositions of the vapour and liquid leaving the trays as well as their flow rates. Various thermal and physical properties (for example heat capacity, vapour pressure, density, molecular weight, and heat of vapourisation) are required to solve the MESH equations. The light end components (methane up to pentanes, which may represent off gas and LPG) are well defined, their chemical structures known and their thermophysical properties are available in most commercial flowsheet simulator databases.
However, the C6+ components need to be represented using “hypothetical components” or hypos. The thermophysical properties of these components must be calculated and they are typically correlated from normal boiling point and density. The normal boiling point curve and bulk density of a crude are the minimum amount of data required by most commercial flowsheet simulators to characterise an oil. As mentioned, viscosity, sulphur and metal content are also used in crude simulations but are out of the scope of this article.
Therefore, the laboratory boiling point analysis is one of the most important data required for fluid characterisation in a simulator.
It should be noted that the closest approximation to a pure component’s normal boiling point is the true boiling point which, in this case, is obtained from the ASTM D2892 TBP analysis. Hence, if boiling point data using other distillation analyses are used, for example ASTM D86, it is necessary to convert that data to TBP data.
This interconversion methodology and correlations are documented in the API Technical Manuals as well as the Unisim user manual. Examples of interconversions are:
1. ASTM D86 interconversion methods API 1974, API 1987 and API 1995 and Edmister Okamoto (1959).
2. ASTM D2887 interconversion methods consist of API 1987, API 1994 Direct and API 1995 Indirect.
Setting Up Basic Crude Characterisation in Unisim
The minimum data for characterising an oil stream in a flow sheet simulator are as follows:
1. Light ends analysis.
2. Bulk property definition: Typically, API or specific gravity is used.
3. Boiling point curve input: For TBP, ASTM D86 and ASTM D1160, the typical input data is boiling point temperature as a function of cumulative liquid volume or liquid weight percentage.
In this example, the crude defined in Table 2 shall be characterised in the Unisim process simulator. A summary of the steps is as follows:
1. Set up the light end components and select the property package.
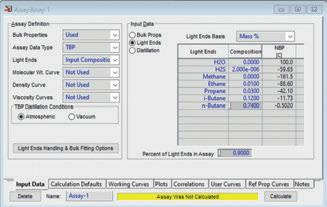
2. Input the light ends, bulk API gravity and boiling point curve.
3. Generate hypothetical components by “cutting” the crude.
4. Use the boiling point curve to estimate product yields.
5. Install the crude in the flowsheet.
Step 1. Set up the light end components and select the property package.
In this example the Peng-Robinson equation of state has been selected. Since most components in crude oil and its products are non-polar, equations of state are frequently used when modelling refinery separations.
Note the following:
1. Distillation only goes up to 58%. In most cases, the assay for crude feed may go up to 70% or 80%, requiring one to extrapolate to 100% for the final boiling point. This extrapolation may be done manually (input the 100% temperature to say 900°C) or one may leave it up to the various extrapolation algorithms in Unisim. Probability or LaGrange methods of extrapolation are typically employed. It should be noted that this final boiling point temperature may be used as a tuning parameter as it will affect the temperature profile of the distillation column.
2. The light end components need to be input, otherwise Unisim will perform an extrapolation and generate lower boiling point hypothetical components which may lead to erroneous results. Low boiling point hypothetical components need to be scrutinised when studying light ends fractionation performance.
Step 3. Generate the hypothetical components by “cutting” the crude.
Unisim uses a working boiling point and bulk specific gravity property to estimate the necessary thermophysical properties curve for each component generated by the cut and blend algorithm.

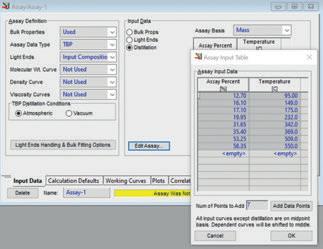
In this example the Auto Cut option is implemented. This creates hypothetical components (NBP_7, NBP 21 and so forth) based on the following boiling point widths:
It is important to ensure that these cut points provide sufficient resolution for the boiling point curve that was input, typically 50-10 cuts per product. In some cases, it may be necessary to manually specify the cut point temperatures.
After the hypothetical components have been generated, Unisim then creates a distillation curve based on these hypothetical components. This is illustrated in Figure 6.
Step 4. Estimating Product Yields.
Now that a distillation curve has been generated, it is possible to estimate the respective product yields. In this case, the crude oil feed to an atmospheric column has been input. Figure 7 shows some typical product yields for this crude oil. This is an extremely useful feature, as these yields can then be used as initial estimates when setting up the crude distillation column.
BH GIRDER
The BH Girder is an innovative and enhanced version of PSC Girder that utilizes the Bulb-T shape integrated with Half Slab which enables it to be applied over a span of longer than 60m. By adopting the latest cutting-edge technologies and innovati on, the BH Gir der has been designed to achieve the ultimate goals of “ Cost Effectiveness ”, “ Rapid Construction”, “Aesthetics” and “Safety”.
The following must be noted when using these product yields:
1. The user needs to define the end point temperatures for each of these product cuts.
2. The yields are based on a simple mathematical partitioning of boiling point components using the distillation curve. Product gap and overlaps are not represented.
Step 5. Installing the crude.
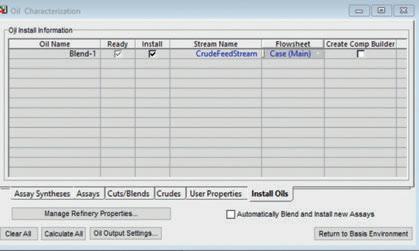
Once the hypothetical components of crude oil have been generated, it is necessary to install it in the flowsheet.
ADVANTAGES
● Maximization of prestressing efficiency
● Minimization of prestressing friction loss
● Reduction of substructure cost
● Reduction of slab cost by half slab girder
● Omission of deck slab form work and s hori ng work by half slab girder
● Shorter construction period
PROFESSIONAL SERVICES
(Free of charge)
●
BH Girders (60m long) launched on double decker portal piers at Setiawangsa Pantai Expressway
NEHEMIAH TOWOONG BRIDGETECH SDN BHD. No. 45-3, Jalan PJU 5/20, The Strand, Kota Damansara 47810 Petaling Jaya, Selangor Darul Ehsan.
Tel : 012 218 6693( Tan CC)
Tel : 603 6142 6638
Fax : 603 6142 6693
Email : tancc@nehemiah-grp.com
Email : enquiry@nehemiah-grp.com
A partnership of
Conclusion
This article covers a brief overview of the characterisation of a crude oil for use in a process simulator. The characterisation outlined provides the minimum required input (boiling point curve and bulk specific gravity only) to enable an engineer to generate a material and energy balance for a crude oil fractionation system. A model constructed using these basic definitions would be useful for:
1. Distillation column separation design and performance evaluation. Product yields based on boiling point ranges. Stabiliser performance. Column hydraulics, flooding estimation.
2. Heat exchanger heat transfer, preheat train/pump around coolers.
3. Utilities (heating/cooling) requirements.
4. Heat integration (pinch analysis).
5. Pressure relief studies.
6. Equipment sizing.
A model based on this input will not be suitable for:
1. Planning/LP vector generation. For this refinery product properties such as cetane index, pour point, sulphur content and metal content would be required.
2. Detailed reactor modeling. This would require PIONA or molecular/pseudo-molecular detail to be defined to allow for reactor kinetics to be represented. It should be noted that commercial simulation software tools such as Unisim, HYSYS, PetroSIM and Symmetry have fluid definition options and the necessary unit operations that would allow for planning and detailed reactor modelling. In this case, the fluid characterisation and definition would be more complex, and would require a significant amount of laboratory data.
References
[1] Foo, D.C.Y; Chemmangattuvalappil, N; Elyas, R; Ng, D.K.S; Chen, C; Elms, R.D; Lee, H; Chien, I; Chong, S; Chong, C, H (2017), Chemical Engineering Process Simulation (1st Edition). Massachusetts, USA: Elsevier.
[2] Kaes, G. A, (2008), Refinery Process Modeling. Georgia, USA: Athens Printing.
[3] Kaiser, M.K; Gary J. H; Handwerk, G. E (2007), Petroleum Refining: Technology and Economics (5th Edition). Florida, USA: CRC Press.
Upcoming Activities
Webinar Talk on “Circular Economy for a Sustainable Environment”
Date : 14 March 2023 (Tuesday)
Time : 3.00 p.m. – 5.00 p.m.
Venue : Digital Platform
Approved CPD : 2
Speaker : Puan Sarifah binti Yaakob
[Physical] and [Online] - Half-Day Seminar on “CIDB Act 520 Amendment 2021, Construction Industry Standard CIS22:2021 (Safe Use of Scaffolding in Construction) & CIS23:2021 (Safe Use of Falsework in Construction)’’ and “Falsework Design and Testing of Falsework Structures”
- Rescheduled from 29 November 2022
Date : 15 March 2023 (Wednesday)
Time : 9.00 a.m. – 1.30 p.m.
Venue : Wisma IEM and Digital Platform
Approved CPD : 4
Speakers : Seminar 1: Ir. Lee Kee Bau (Ir. KB Lee) : Seminar 2: Ir. Dr Lim Boon Tiong
Technical Talk on Design and Construction of Basement Wall & Pile foundation In Limestone Formation – Case Study
Date : 15 March 2023 (Wednesday)
Time : 5.00 p.m. – 7.00 p.m.
Venue : Wisma IEM
Approved CPD : 2
Speaker : Mr. Komma Srinivasulu (Vasu)
Webinar Talk on “The Evolution of Simulator Development: From Historical Milestones to Modern Technologies and Applications”
Date : 16 March 2023 (Thursday)
Time : 3.00 p.m. – 5.00 p.m.
Venue : Digital Platform
Approved CPD : 2
Speaker : Dr Ahmad Faisal Mohamad Ayob
Webinar Talk on “Sustainable Conscious Community and Property Management Cost: Smart City in the Making”
Date : 17 March 2023 (Friday)
Time : 10.30 a.m. – 12.30 p.m.
Venue : Digital Platform
Approved CPD : 2
Speaker : Ir. Prof. Dr Lam Wei Haur
Webinar Talk on Navigating Your Career as Engineering Professionals – How can you improve your chance of success?
Date : 18 March 2023 (Saturday)
Time : 9.00 a.m. – 11.00 a.m.
Venue : Digital Platform
Approved CPD : 2
Speaker : Ms. Nurzalina binti Jamaluddin


