
26 minute read
DISPATCHES
Where the world trades
DELSTUDIO | DREAMSTIME.COM
Advertisement
Trade agreements have been a foreign policy goal for Canada and many other nations worldwide. Laura Neilson Bonikowsky looks at the 10 largest in terms of dollar value and population.
It’s true that money — in the form of trade — makes the world go ’round. Trading between civilizations began about 5,000 years ago, increasing human interaction. Historians believe the first long-distance trade occurred between Mesopotamia and the Indus Valley in Pakistan around 3000 BC. Trade meant people didn’t have to produce everything they needed and could even acquire luxury items. Economies grew by feeding appetites for spices, textiles and precious metals — non-perishable items that withstood lengthy transport. Before long, trade networks linked cultures across the Eurasian continent.
Today, the World Trade Organization (WTO), successor to the General Agreement on Tariffs and Trade, provides oversight to the world’s vast network of trade agreements. The WTO lists 481 agreements of all types, including free trade agreements (FTAs) and regional trade agreements (RTAs), preferential agreements involving two or more partners. The UN’s Key Statistics and Trends in Trade Policy 2018 document indicates that, as of 2017, about half of world trade occurs under some form of preferential agreement. According to the WTO, world trade and GDP, which have grown in tandem for a decade, have increased by 26 per cent from 2008 to 2018, but slowed in 2018 due to increasing trade tensions, lower business confidence and fiscal prudence. The U.S. was the exception. The volume of world merchandise traded, based on the average of exports and imports, increased 3 per cent in 2018, down from 4.6 per cent in 2017. Global merchandise exports exceeded US$19 trillion in 2018, up from US$17 trillion in 2017, partly due to higher oil prices. The value of global trade in commercial services in 2018 was nearly US$6 trillion, up from US$5 trillion in 2017, with information and communication technology showing export growth of 15 per cent, the highest among service sectors. The 10 largest merchandise trading countries in the world in 2018 were China, the U.S., Germany, Japan, the Netherlands, France, Hong Kong, the U.K., the Republic of Korea and Italy. The 10 top traders in merchandise and commercial services accounted for 53 per cent of the world’s total trade in 2018. The world’s trade agreements are becoming more numerous and more complex; isolating the value of individual agreements is difficult, given overlapping membership in trade agreements and significant developments impacting the world’s economies. Typically, GDP per capita is reported when comparing economies, but given the disparity among the standards of living of some trade partners, it is not a useful comparison in this case. This list of 10 significant trade agreements, measured in dollar value and population size, was compiled using the resources of the World Trade Organization, the World Bank, tradingeconomics. com, government trade departments, Canada’s State of Trade 2019, the CIA World Fact Book and trade-agreement members. Increasing trade tensions, especially between the U.S. and China, and agreements
40 being negotiated or updated, including the Regional Comprehensive Economic Partnership, African Continental Free Trade Area agreement and the Southern Common Market, will change this list in the near future. All prices are in U.S. dollars.
1. North American Free Trade Agreement (NAFTA) NAFTA, acknowledged as the world’s largest free trade agreement, came into force in 1994 after more than a decade of negotiations. The agreement was to compete with the Treaty of Rome (1957), which gave rise to the European Union in 1993. NAFTA expands trade among the 450 million people of Canada, the U.S. and Mexico, making all three countries more competitive globally. Their combined GDP reached $21.1 trillion in 2016, representing
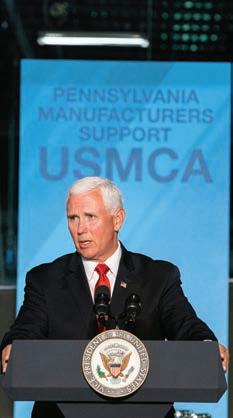
U.S. Vice-President Mike Pence speaks at a proNAFTA 2.0 event in Pennsylvania.
28 per cent of the world’s gross GDP with just 7 per cent of the world’s population. NAFTA recorded a total value of $2.22 trillion in exports in 2016 and $2.38 trillion in 2017. NAFTA eliminates tariffs among the three countries for the majority of goods originating in those countries. Goods and services traded under NAFTA include agricultural products and services, textiles and apparel, automobiles, energy and petrochemicals, machinery, wood, telecommunications and marketing. As well, people from a NAFTA country employed in certain professions and businesses are eligible to work temporarily in one of the other countries. Since NAFTA came into force, all three countries have seen economic growth, increased trade, higher wages and greater stability for investment through its guarantee of most-favoured nation status. However, some experts debate its impact, noting the difficulty of separating trade statistics. In 1994, when NAFTA came into effect, 14 per cent of Mexico’s GDP came from the export of goods and services; by 2017, that figure had risen to 37 per cent. In the U.S., 10 per cent of GDP was from the export of goods and services in 1994 compared to 12 per cent in 2017. In Canada, 33 per cent of GDP came from exports of goods and services in 1994, but in 2017, that figure was 31 per cent. The agreement places rule-of-origin conditions on goods from a non-NAFTA country traded under NAFTA. Automobiles and automotive parts became contentious because of that rule and ultimately impelled renegotiation. In 2018, leaders of the NAFTA countries signed a new agreement — the United StatesMexico-Canada Agreement (USMCA) in the U.S., the Canada-United States-Mexico Agreement (CUSMA) or l’Accord CanadaÉtats-Unis-Mexique (ACEUM) in Canada and the Tratado entre México, Estados Unidos y Canadá (T-MEC) in Mexico. The intent of the new agreement is to create a more level playing field for workers, particularly in the auto sector, and support a 21st-Century economy. Once the agreement is ratified, it is intended to go into effect in January 2020, although investment policy analysts in Washington warn that the impeachment inquiry into President Donald Trump could affect potential trade deals. NAFTA remains in effect in the meantime.
2. European Union (EU) With a population of 517 million, the EU is the economic and political union of 28 members: Austria, Belgium, Bulgaria, Croatia, Cyprus, Czech Republic, Denmark, Estonia, Finland, France, Germany, Greece, Hungary, Ireland, Italy, Latvia, Lithuania, Luxembourg, Malta, the Netherlands, Poland, Portugal, Romania,
Slovakia, Slovenia, Spain, Sweden and the U.K., which is set to leave the union at some point. The euro is the currency of 19 EU members, which constitute the Eurozone. (Non-euro countries are Bulgaria, Croatia, Czech Republic, Denmark, Hungary, Poland, Romania, Sweden and the U.K.) The Treaty of Rome (1957) created the European Economic Community (EEC), which established the Common Market in Europe to allow freer movement of goods, services, capital and people. The EEC gave rise to the EU under the Maastricht Treaty (1993), although the Treaty of Rome remains the legal basis for EU institutions. As a single market, the EU operates as more than a free trade area, but is similar in not having tariffs, quotas or taxes on trade. It differs by removing non-tariff barriers so all members follow the same rules and regulations on everything, including trade duties, product safety and packaging and even working hours. The EU’s GDP is $18.7 trillion. The EU does the most trade in manufactured goods and services in the world and is the largest export market for about 80 countries (the U.S. is the top trade partner for about 20 countries). The EU is the most open market for developing countries, importing more from them than the U.S., Canada, Japan and China together (excluding fuels). Germany leads the EU in exporting products, accounting for nearly 25 per cent of exports in 2018. Many of the EU’s bilateral negotiations on goods and services include liberalization of trade in goods and provisions for non-tariff barriers and trade in services. The EU has been negotiating improved access to goods and services with MERCOSUR — Argentina, Brazil, Paraguay, Uruguay and Bolivia (Venezuela has been suspended) — as well as with Ukraine, Moldova, Georgia, Armenia, Malaysia and Vietnam. The EU’s top 10 exports are machinery, including computers; vehicles; electrical machinery; pharmaceuticals; mineral fuels, including oil; plastics and plastic articles; optical, technical and medical apparatus; organic chemicals; iron and steel; and aircraft and spacecraft. The European Commission reported the value of the EU’s global export of goods in 2018 as $14.9 trillion and import of goods as $14.1 trillion (excluding intraEU trade). Global export of services totalled $4.04 trillion in 2018 and the import of services totalled $3.9 trillion. The EU’s largest export of goods and services was to China, valued at $2.6 trillion. It did the most import trade with the U.S., accounting for $2.8 trillion. Britons voted in a 2016 referendum to leave the EU. The “divorce” means the U.K. must negotiate a trade deal with the EU, raising the possibility of new or re
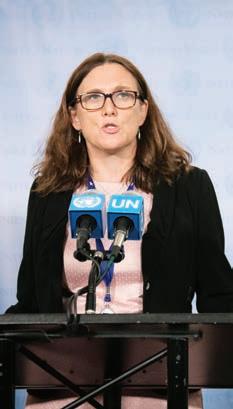
Cecilia Malmström is the European Union’s commissioner for trade. She is instrumental in all free trade agreements Europe signs.
stored tariffs. The status of Britons living outside the U.K. and nationals of other countries living in the U.K. will change. Papua New Guinea, Peru, the Philippines, Russia, Singapore, Taiwan, Thailand, the U.S. and Vietnam. The 21 members of APEC accounted in 2017 for 2.9 billion people — about 38 per cent of the world’s population — and had a GDP of $48 trillion, roughly 60 per cent of global GDP, and conducted 60 per cent of trade globally through APEC and the other agreements to which they belong. The combined GDP of the U.S. and China amounted to 66 per cent of the region’s GDP. The APEC region contributed 47 per cent of global trade in goods and services. APEC’s trade statistics of 2018 note exports and imports were worth $8.8 trillion in 2017, slightly higher than 2016’s recorded $8 trillion. Imports totalled $8.9 trillion. Intra-APEC trade made up almost 70 per cent of the region’s exports and imports. In 2017, the value of APEC trade in goods saw the fastest growth rates of the previous six years. The biggest export products from APEC economies to the world were electronics, motor vehicles, petroleum oils, automatic data-processing machines, auto parts, gold and electrical equipment. Top imports to APEC included electronic integrated circuits and microassemblies, crude petroleum oils, electronics, motor vehicles and pharmaceuticals. At its 1994 summit, APEC established the goal of creating free trade and investment among the region’s developed economies by 2010 and undeveloped economies by 2020. APEC operates through committees, policy groups, working groups and a business advisory council. As such, its effectiveness is limited by the requirement that decisions be achieved by consensus.
3. Asia-Pacific Economic Co-operation (APEC) APEC is a regional trade agreement (RTA) among 21 countries, called member economies, throughout the Asia-Pacific region. It is the world’s largest RTA and was established in 1989 as regional economies became more integrated and in view of the competition that would come with the introduction of large economic blocs such as NAFTA and the EU. APEC ensures cross-border movement of goods, services, investment and people through faster customs procedures, favourable business climates and aligned regulatory standards. The 21 member economies are Australia, Brunei Darussalam, Canada, Chile, China, Hong Kong, Indonesia, Japan, Korea, Malaysia, Mexico, New Zealand,
4. Association of South-East Asian Nations (ASEAN) ASEAN was created in 1967 by Indonesia, Malaysia, the Philippines, Singapore and Thailand. By 1999, it had 10 members with the addition of Brunei, Vietnam, Laos, Myanmar and Cambodia. Of these countries, Indonesia and Thailand have the largest economies. The area’s population was estimated at 647.4 million in 2018, nearly double the area’s 1980 population (355 million), partly due to establishing ASEAN+3, the original 10 countries plus China, Japan and Korea, and ASEAN+6, which includes Australia, New Zealand and India. In 2018, ASEAN was estimated to have a combined GDP of $2.9 trillion; in 2000, that figure was $615 billion.
ASEAN is becoming significantly more important as a trade bloc. Its goal is to form a common market, much like the EU, to allow the free movement of goods, services, capital, investment and labour among members. It is nearing its goal of creating universal standards for financial services, agriculture, intellectual property rights and consumer protection to support growth and foreign investment. Other products and services in ASEAN’s agreements are electronic commerce, cotton and wool, pharmaceuticals, agrochemicals, electrical appliances, marine products, natural gas, coal (including coke and briquettes), wood and wood products and non-ferrous metals. By 2018, the association had removed 99 per cent of intra-ASEAN tariffs, excepting rice because of its importance to local economies. It has also engaged in free trade agreements with several other Asian nations, changing its environment for sourcing and manufacturing goods. Its treaty with China has eliminated tariffs on about 90 per cent of imported goods in 8,000 product categories. International trade in goods and services and foreign direct investment, vital to the area’s economy, have increased significantly since 2010. In 2017, international trade in goods reached almost $2.6 trillion while trade in services amounted to $703

42 billion. Foreign investment was $135.6 billion. China has become ASEAN’s largest external trading partner, receiving 14.1 per cent of ASEAN’s exports in 2017. While this trade is significant, ASEAN members are cautiously aware of China’s ability to dominate the region. The EU is ASEAN’s second-largest trade partner, receiving 12 per cent of exports, followed by the U.S. with 10.8 per cent and Japan at 8 per cent. The largest markets for ASEAN imports during 2017 were China (20.3 per cent), Japan (9.1 per cent), the EU (8.3 per cent), South Korea (7.9 per cent) and the U.S. (7.3 per cent). The ASEAN-India Free Trade Agreement, which came into force in 2010, created a liberalized market and investment regime, with a combined GDP of $4.8 trillion, eliminating tariffs on more than 4,000 product lines and creating opportunities for more than 1.9 billion people. In 2019, India and ASEAN members agreed to revisit the agreement with a view to making it more amenable to business.
5. Comprehensive and Progressive Agreement for Trans-Pacific Partnership (CPTPP) The CPTPP is the modification of the Trans-Pacific Partnership (TPP), a free trade agreement comprising 12 countries bordering the Pacific Ocean: Australia, Brunei, Canada, Chile, Japan, Malaysia, Mexico, New Zealand, Peru, Singapore, the U.S. and Vietnam. These countries include 793 million people, produce 40 per cent of the world’s total GDP of $107.5 trillion and supply 26 per cent of global trade. As the agreement has been in effect only since Dec. 30, 2018, there is not enough data available to create a meaningful analysis of the CPTPP’s impact on global trade. U.S. president Barack Obama initiated the TPP when China sought trade with African nations, exchanging oil for investment in African infrastructure, and with Southeast Asian and Latin American countries. Among the TPP’s goals was balancing China’s increasing power in the region. The TPP was signed by all countries in 2016 and awaiting ratification when President Donald Trump pulled the U.S. out of the agreement in January 2017. It would have been the world’s largest FTA, projected to increase exports by $305 billion annually by 2025 and remove 18,000 tariffs on American exports. In March 2018, the other 11 countries of the TPP moved on without the U.S., with 20 minor provisions of the TPP suspended, renaming the agreement the CPTPP. The 11 members still constitute a market of 495 million people and have a combined GDP of $13.5 trillion. Additional nations, including China, have indicated interest in joining. In April 2018, Trump indicated that the U.S. might be willing to rejoin the agreement, but only if he could get “a better deal” than Obama had; several countries felt they had made enough concessions. The first to ratify the agreement were Canada, Australia, Japan, Mexico, New Zealand and Singapore, followed by Vietnam in January 2019. The CPTPP removes tariffs on goods and services and sets reciprocal trade quotas. It also removes non-tariff obstacles to trade and synchronizes regulations and statutes. In terms of increasing access to goods markets, Japan, Vietnam and Malaysia would benefit most. The CPTPP covers an array of goods and services, including machinery, automobiles, textiles and apparel, agricultural and marine products, forest products, chemicals and plastics, financial services and telecommunications. It affects foreign policy and even some laws within member countries. All countries agreed to reduce wildlife trafficking, which is most beneficial to elephants, rhinoceroses and marine species, and it prevents environmental abuses, such as unsustainable logging and fishing. Penalties are applied for non-compliance. One concern for CPTPP members is whether China would use the agreement to avoid the tariffs imposed by its trade war with the U.S. China could send raw materials to CPTPP members from which finished products could be sent to the U.S., avoiding the tariff.
6. Southern Common Market (MERCOSUR) The Southern Common Market is known as MERCOSUR — the Spanish abbreviation of El Mercado Común del Sur. It was founded in 1991 by Argentina, Brazil, Paraguay and Uruguay under the Treaty of Asuncion. Bolivia joined in 2015. Venezuela joined in 2012, but was suspended in 2017. MERCOSUR represents 295 million people with a combined GDP above $3 trillion, the fifth-largest economy outside the EU. Europe’s common market inspired the agreement — its main purpose being to generate business and investment opportunities by integrating national economies
tal groups and Argentina’s small- and medium-sized entrepreneurs dislike the deal. The four MERCOSUR and 28 EU governments, as well as the European Parliament, must ratify the deal before it enters into force. There is no timeline.
7. Comprehensive Economic and Trade Agreement (CETA) CETA is a trade deal between the EU and Canada, a landmark agreement for Canada, opening new markets for Canadian exports and promoting shared values. It was signed in 2016 and came into force in 2017. CETA lowers tariffs and other barriers to trade, respects democracy and
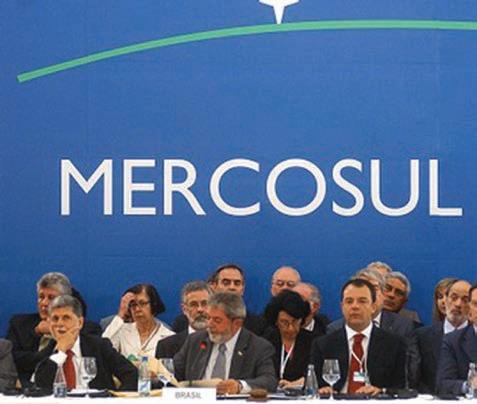
MERCOSUR (spelled MERCOSUL in Portuguese) is a trade pact that includes Argentina, Brazil, Paraguay, Uruguay and Bolivia. It was inpired by Europe‘s common market and signed in 1991.
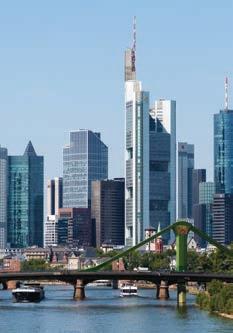
into an international market. It was also intended to strengthen democracy after the dictatorships of the 1980s. MERCOSUR allows free movement of goods and services among member countries. Preferential trade liberalization among member countries occurred from 1991 to 1994, and almost all intraMERCOSUR tariffs were eliminated by 1995. Trade among the members increased in the 1990s, but trade liberalization reversed from 1996 to 1999 due to external conditions, such as the Brazilian financial crisis. The introduction of non-tariff barriers caused trade among MERCOSUR countries to decline after 2000, but MERCOSUR is gradually eliminating most non-tariff barriers to trade. In 2000, the EU signed bilateral agreements with the four original MERCOSUR members to remove trade barriers and broaden EU export markets. The EU is MERCOSUR’s largest trade and investment partner; in 2018, EU goods worth $55 billion and services worth $28 billion were sent to MERCOSUR countries. Statistics for 2019 to date show that the export of goods has yielded $155.6 billion; imports total $120.5 billion. Exports of services amount to $54 billion; imports equal $96.8 billion. MERCOSUR’s exports of goods include soybeans and flour, petroleum and crude oils, iron ores, corn, chemical wood pulp, beef and chicken. Imports of goods include diesel and petroleum oils, natural gas, coal, submersible drilling equipment and potassium chloride. A trade deal between the EU and MERCOSUR would link more than 770 million people. After nearly two decades of talks, under discussion now are the elimination of 92 per cent of taxes on MERCOSUR imports, 91 per cent of duties, increased market access for MERCOSUR farmers and fewer restrictions on public procurement, allowing EU companies to bid on government contracts in MERCOSUR countries. However, concerns were raised on both sides. EU countries worried that lower MERCOSUR standards would give their exporters an advantage. France expressed concerns about South American beef and biofuel imports flooding the market. MERCOSUR countries, concerned about the competitive automotive sectors, resisted EU demands to allow European companies to bid for government contracts. As the talks ground on, French President Emmanuel Macron threatened additional delay if Brazilian President Jair Bolsonaro, a climate-change skeptic, pulled out of the 2015 Paris climate accord. European leaders and business, as well as MERCOSUR leaders and farmers, like the deal. European farmers, environmenThe EU, with its 28 member states (27 if Britain leaves), is the world's second-largest economy. Shown here is Frankfurt, a major hub in Europe.
upholds the EU’s standards in several areas as defined in the joint interpretive instrument, which was adopted when the agreement was signed. The instrument sets out the members’ mutual commitment to safeguard the right to regulate in the public interest in areas such as public health and education, social services, safety, the environment, workers’ rights, privacy and data protection and promoting cultural diversity. Canada’s population in 2019 is estimated at 37.4 million. The GDP in 2018 was $1.7 trillion. The EU is the world’s second-largest economy and Canada’s second-largest trading partner after the U.S., accounting for almost 10 per cent of its external trade in goods. Canada is the
EU’s 12th most important trading partner, accounting for almost 2 per cent of the EU’s total external trade in goods. Before CETA, Canada-EU trade in 2014 amounted to nearly $74 billion. The European Commission announced that the value of trade in goods between the EU and Canada in 2018 was $79 billion. In 2017, the EU exported slightly more than $15 billion more in goods and services to Canada than it imported. The top three categories of products traded between Canada and the EU are machinery, chemical and pharmaceutical products and transport equipment. The federal government indicated in 2017 that Canada’s trade balance with the EU will deteriorate slightly. The sectors most adversely affected — showing slower output growth — include some dairy and agricultural products, textiles and some machinery and manufacturing goods. Sectors that could expect increased growth include automobiles, non-ferrous metals and wheat. The diversion of trade to the EU will reduce Canadian exports to the U.S.
8. Central American-Dominican Republic Free Trade Agreement (CAFTA-DR) The CAFTA-DR, which was signed in 2004, is significant because it was the first free trade agreement between the U.S. and a group of developing countries. It aims to eliminate trade barriers, including tariffs and customs duties, on goods and services traded among Costa Rica, El Salvador, Guatemala, Honduras, Nicaragua, the Dominican Republic and the U.S. The intent of the FTA was to give the U.S. greater access to Central American markets and to promote economic growth in Central America and the Dominican Republic. The main provision of the CAFTA-DR was to remove some tariffs immediately and others over periods of up to 20 years. By 2015, all tariffs on U.S. consumer and industrial exports had been removed; tariffs on agricultural exports will be eliminated by 2020. All trade will be dutyfree by Jan. 1, 2025, when the agreement is fully implemented. American exports to CAFTA-DR countries include medical instruments, grains, machinery, paper, textiles, petroleum products and plastics. CAFTA-DR exports include coffee, sugar, fruits and vegetables, cigars and petroleum products. In 2018, two-way trade among CAFTADR members was $57.4 billion. Exports reached $32.2 billion and imports $25.2
44 billion. Trade in services has not been measured. Under the agreement, the economies of Nicaragua and the Dominican Republic have enjoyed significant gains. Nicaragua, one of the poorest countries included in the agreement, saw its economy grow 4.8 per cent in 2015, 4.7 per cent in 2016 and 4.9 per cent in 2017. The Dominican Republic, which exports about half its goods to the U.S., mainlysugar, coffee and tobacco, saw its economy grow 7 per cent in 2015, 6.6 per cent in 2016 and 4.6 per cent in 2017. Under the agreement, each member is required to apply fair and transparent procurement procedures and cannot discriminate against any goods, services or suppliers from other member countries. The agreement also requires reforms of domestic legal and business environments key to encouraging business development and investment. cies, eliminate monopolies and eradicate uncompetitive behaviour. But the AfCFTA has enormous potential for co-operation among countries and companies, with the caveat that liberalized trade could harm the poorest within its members. On the way to meeting those projections, members of the free trade area will be able to learn from the experiences of other members of FTAs around the world.
10. China’s Trade Agreements China is an economic behemoth, the world’s largest or second largest economy, depending on the measure, and a major player in trade agreements with much of the world, though no single agreement is
9. African Continental Free Trade Area (AfCFTA) In 2018, leaders from 44 African countries signed the AfCFTA agreement, a historic free trade agreement intended to liberalize the market for goods and services across the continent. An additional 10 countries have since signed on. The agreement came into force on May 30, 2019. The agreement follows the example of the EU, creating the world’s largest free trade area by population and the largest customs union in the world. However, only 16.6 per cent of African countries’ exports remained on the continent in 2017 (by comparison, Asian countries account for 59 per cent of Asian exports, and 68 per cent of Europe’s exports stay in Europe), so there is some work to be done. The agreement falls under the African Union’s (AU) Agenda 2063: The Africa We Want. The AU endorses multilateralism as integral to promoting development, prosperity and peace. If all 54 AU members ratify the AfCFTA, the agreement will encompass 1.2 billion people with a combined GDP of more than $3 trillion. Consumer spending is expected to reach $1.4 trillion with 128 million African households with discretionary income in 2020. By 2030, 50 per cent of Africans will be living in cities. There are expected to be 1.1 billion Africans of working age by 2040. Facilitating the movement of goods and people within and external to the free trade area will be a challenge as African economies are at various stages of development. The AU role will be to ensure shared prosperity, create supportive poliChina, whose President Xi Jinping is shown here, is one of the world’s largest economies. It has trade agreements with dozens of countries.
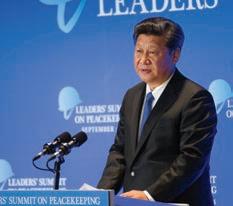
among the world’s largest. China’s tradeagreement partners include ASEAN, Australia, Chile, Costa Rica, Georgia, Hong Kong, India, Korea, Maldives, Pakistan, Peru, Qatar, Saudi Arabia and Switzerland. Some of these are being upgraded or are in their second phase. Agreements are in negotiation with Israel, Japan, Mauritius, Moldova, New Zealand, Norway, the Palestinian territories, Panama and Sri Lanka. Still more are under consideration with Bangladesh, Canada, Colombia, Fiji, Mongolia, Papua New Guinea and Nepal. China’s population is 1.38 billion people (est. July 2018) with a GDP of $25.3 trillion. Exports in 2017 amounted to $2.26 trillion and imports $1.74 trillion. In 2018, 18 per cent of China’s exports went to the U.S., contributing to a trade deficit of $419 billion. (U.S. imports from China equalled $540 billion while exports to China were valued at $120 billion.) Before 2013, China’s economic growth enjoyed double-digit rates, but its economy grew only 7.8 per cent in 2013 and 7.3 percent in 2014, and fell to 6.8 per cent
in 2017 and 6.6 per cent in 2018. China once fuelled its growth with government spending, reducing poverty and ultimately creating more consumers. China benefitted for decades from a “worker dividend” of young, cheap labour. However, that workforce is aging, accumulating a measure of wealth and demanding higher wages. China makes up for the loss of cheap labour with its emerging consumerism — a growing middle class expected to reach 600 million in 2020. ASEAN is China’s most important FTA. On its implementation in 2011, the average tariff rate on Chinese goods exported to ASEAN countries fell from 12.8 to 0.6 per cent, and on imports to China from 9.8 to 0.1 per cent. The agreement is reshaping how China and ASEAN manufacturing develops, as it allows companies to reposition manufacturing to other low-cost areas of Asia, but still meet the demands of the Chinese market through duty-free imports permitted under ASEAN. From January to June 2019, trade volumes between China and ASEAN reached $291 billion, a 4.2-per-cent increase from a year ago, although growth took a 6.2-per-cent hit from April to June. China and its six FTA partners have been working toward the Regional Comprehensive Economic Partnership (RCEP), a free trade agreement proposed in 2012 and intended to be established by the end of 2019. With all 16 members, the RCEP constitutes almost half of the global population and accounts for 30 per cent of the world’s GDP. China and India are the biggest players; the negotiations proved difficult as India was reluctant to move forward and the agreement was concluded without it in November. The agreement is to be signed in February 2020, giving India a chance to reconsider. The partnership would give members new markets and opportunities in the face of American tariffs and protectionist policies. In 2019, China reported trade difficulties, saying its escalating trade war with the U.S. is taking a toll on its economy. While China has announced it will expand imports and its measures to stabilize trade will have positive results, the Trump administration was considering applying financial pressure against Beijing, possibly including delisting Chinese companies from U.S. stock exchanges late last year. China’s commerce minister, Zhong Sha, has warned that tariffs and trade disputes could plunge the world into recession. CANADA’S TRADE PICTURE
Canada is the world’s 12th largest exporter. In the midst of global trade tensions and slowed growth in many economies, Canada’s exports and imports rose in 2018, with the value of
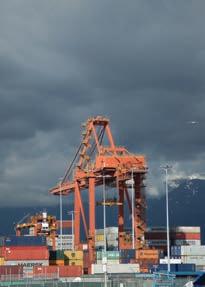
The Port of Vancouver is Canada’s largest.
trade in goods and services reaching $1.5 trillion, according to Canada’s State of Trade 2019 report. The majority of Canada’s free trade agreements have been negotiated or brought into force since 2000. Canada is involved in 99 agreements involving trade in goods and services as well as investment. These include 15 FTAs in force; five under exploratory discussions; nine under negotiation; one for which negotiations have concluded, but has not gone into force; and one that is signed, but not in force. Canada is also part of several WTO agreements that oversee various aspects of trade. As well, Canada has a number of Foreign Investment Promotion and Protection Agreements, which are distinct from FTAs, many with existing FTA partners. They are bilateral agreements to encourage foreign investment through a framework of obligations and rights. There are 38 in force, 14 in negotiation, 5 for which negotiations have concluded, but the agreement has not come into force, and 2 that are signed, but not yet in force. Government of Canada Figures (year of coming into force is indicated)
FTAs in Force CPTPP (2018) Canada-Chile (1997) Canada-Colombia (2011) Canada-Costa Rica (2002) Canada-EU Free Trade Association (2009) Canada-EU: Comprehensive Economic and Trade Agreement (2017) Canada-Honduras (2014) Canada-Israel (1997) Canada-Jordan (2012) NAFTA (1994) Canada-Panama (2013) Canada-Peru (2009) Canada-Ukraine (2017) Canada-U.S. (1989, superseded by NAFTA, remains in force) FTAs Under Exploratory Discussions Canada-ASEAN Canada-China Canada-Philippines Canada-Thailand Canada-Turkey FTAs Under Negotiation Canada-Caribbean Community Canada-Dominican Republic Canada-Guatemala, Nicaragua, and El Salvador Canada-India Comprehensive Economic Partnership Agreement Canada-Japan Economic Partnership Agreement Canada-MERCOSUR Canada-Morocco Canada-Pacific Alliance Canada-Singapore FTAs with Concluded Negotiations, Not Yet in Force Canada-U.S.-Mexico WTO Agreements Agreement on Trade-Related Aspects of Intellectual Property Rights (1995) Agreement on Trade-Related Investment Measures (1995) General Agreement on Tariffs and Trade (1995) General Agreement on Trade in Services (1995) World Trade Organization Agreement on Procurement (2014) World Trade Organization Information Technology Agreement (2016) World Trade Organization Agreement on Trade Facilitation (2017)


