11 minute read
Improving Asset Health


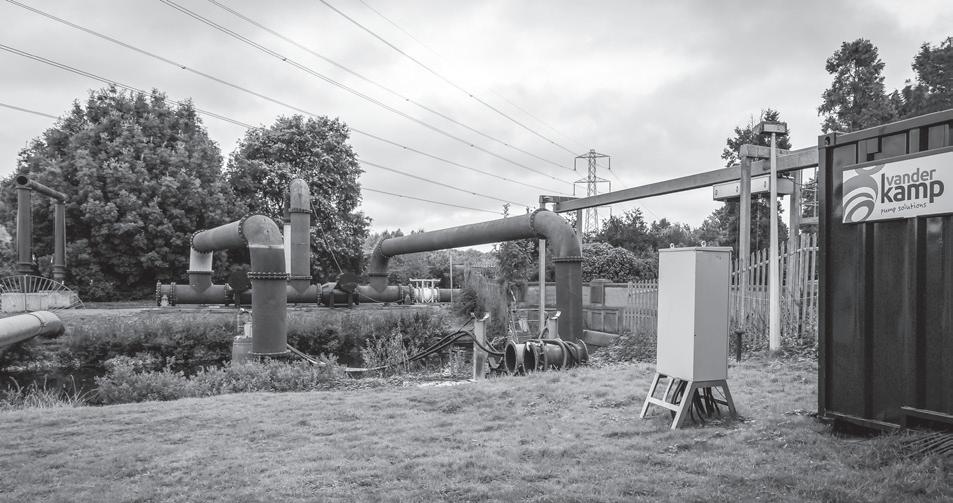
Water engineers Vanderkamp take temporary pump solutions to the next level
Vanderkamp Pumps are building a solid reputation in the UK – not only for their tailor-made pump and pipework supplies, but also for their quality cutting-edge engineering designs.
Advertisement
The company was established 30 years ago in the Netherlands and let’s face it… the Dutch are world leaders in flood and water management. In fact, CEO Rick van der Kamp’s experience working with water goes all the way back to the age of 10 when he first went on dredging jobs with his father. Rick explains: “We fully understand the pressures faced by water companies and tier 1 contractors in the UK today. We pride ourselves on the engineered design and delivery of the jobs we undertake and are mindful of the fact that we carry the reputation of the companies we work for.
“Vanderkamp works closely with clients to get a full understanding of the problems and obstacles upfront. In this way we can ensure the solution is right first time round. Preconditions are the most important part of any project, no matter what the size. “Our work isn’t just about providing pumps and pipework; we have a huge amount of engineering and mechanical know-how, and the latest smart technology, at our disposal. We are fully committed to building up longterm customer relationships and helping our customers achieve the best possible solution.”
This commitment is reflected in Vanderkamp’s decision to expand its UK operations by adding a second depot in Essex to complement the Brentwood head office. Both are fully operational, and store and maintain a range of diesel and electric pumps, pipework and specialist equipment. To date, projects have spanned as far afield as Scotland. Rick added: “We set up our UK operation in 2019, after completing some large and complex projects in the years before. It became clear to us that there is a growing demand in the UK for a company like Vanderkamp that can handle large and complex over pumping installations. Now that things have opened up again, we’re seeking to forge even more new connections.
“I would say that our engineering design capabilities are really quite unique, and set us apart from the rest of the market. Our solutions provide a level of confidence that is second to none. So if, say, we need to divert wastewater from A to B, our engineering insights will work out the best, most efficient way – everything from calculations to commissioning and installation. “Location isn’t a problem either as we can monitor installations and pump flow etc. remotely 24/7, and arrange emergency callouts if needed.” The company recently took on the world’s largest temporary pump installation at Ijmuiden Locks (pumping an incredible 72 m3/s), which Rick regards as a great honour. Vanderkamp also have two large standby pumps at the Queen Mary reservoir in London, while its sister QEII reservoir undergoes a major programme of inspection and maintenance.
Vanderkamp’s services include:
Engineered design solutions and construction of temporary works, including: • Construction design • Hydraulic design • Electrical design • Full 3D design • CAD and working installation drawings
Rental of complete temporary pump installations or single components, and mobile fine screen installations
Sales, including pump assembly and installation
Consultation
Servicing The company’s equipment is all fully compliant and designed to tackle increasingly complex wastewater and disaster operations. For example, Vanderkamp can take over the total functioning of a pumping station, including operation and surveillance. The company’s industrial water applications typically deal with process water, which usually involves great capacities and high pressures. Diesel pumps are dry self-suction pumps or make use of vacuum systems, and are available in the range of 100 to 8000 m3/hour per pump. Electric pumps are either wet or dry primed, ranging from 50 to 15,000 m3/hour per pump. They use Variable Frequency Drives (VFD) to reduce power consumption, and can be connected to the mains or generator, which is controlled by Vanderkamp’s Programmable Logic Controller (PLC). Vanderkamp also owns a range of fire-fighting container sets with varying capacities and pressures. Rick concludes: “We utilise a variety of suppliers and also develop our own range of pumps, ensuring we can always provide the most effective pump for any situation.” Full details about services and equipment is available at vdkamp.eu/en/
QEII reservoir project on course for completion in 2022
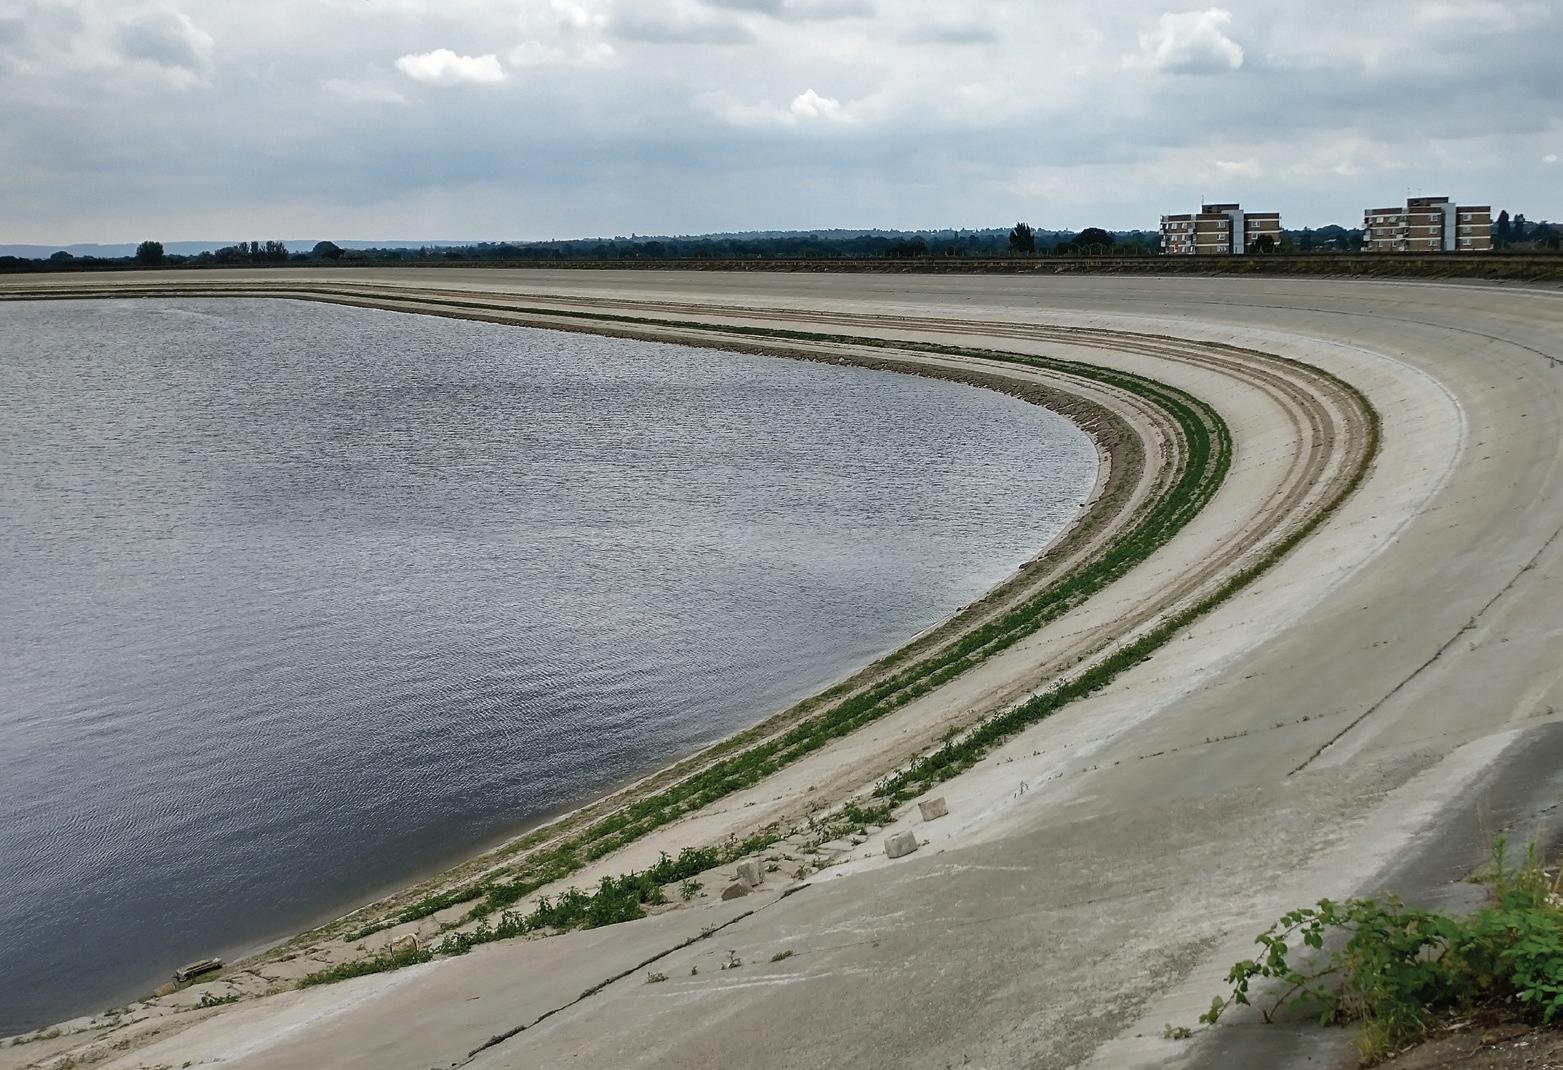
Draining one of London’s largest reservoirs for refurbishment – while maintaining water supply and protecting the ecological balance – has been a huge logistical challenge, spanning nearly 12 months. Thanks to meticulous planning, the QEII reservoir project is set to finish ahead of schedule in early spring 2022. Karen Southern follows progress to date.
Thames Water started draining the Queen Elizabeth II reservoir in Walton-on-Thames in April 2021. Over three months, nearly 20,000 million litres of water (equivalent to 8000 Olympic-sized swimming pools) were carefully drained and transferred to the supply network feeding London. This enabled statutory inspection and maintenance work to start on the 2km of inlet and outlet tunnels which lie 40m beneath a sprawling network of roads, homes and other reservoirs. Intermediate shafts were sunk to provide four points of access in the middle and at both ends of the works.
At nearly 60 years old, the tunnels – constructed from 2.5m diameter precast concrete un-bolted segmental rings – were then strengthened with a reinforced concrete lining to prevent future leakage. But first, several tonnes of silt and tonnes of invasive zebra mussels had to be dug out. As programme director Rob Keen explained with some understatement: “It is a big deal taking this reservoir out of service for 12 months. QEII is the fourth largest reservoir in west London and supplies 10 per cent of the city’s raw water supply. It’s part of the
Emptying the QEII reservoir
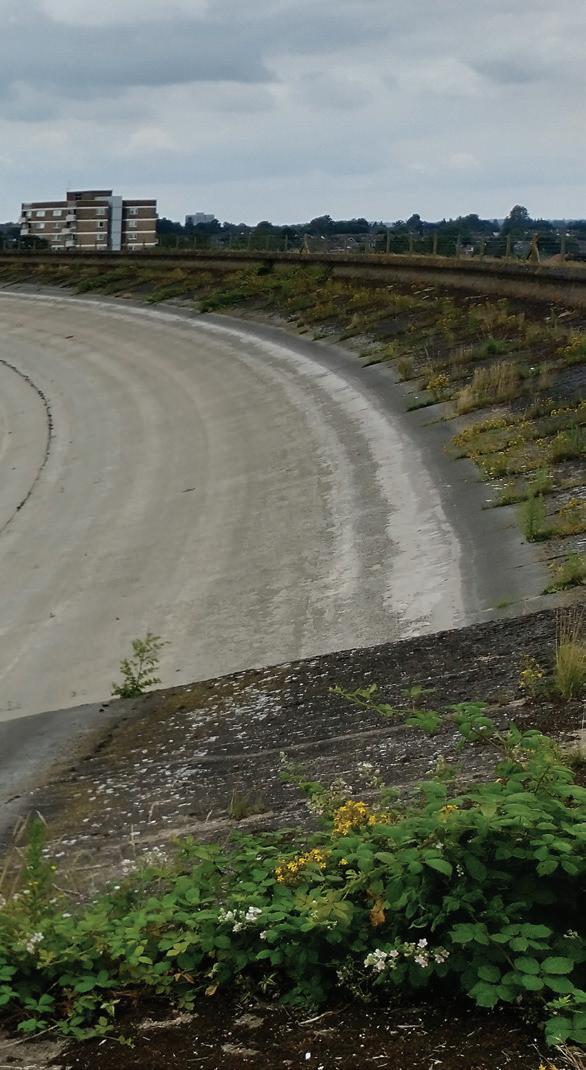
Hampton and Walton treatment work feeds which serves a third of London… at least two to three million people. “Having such a major strategic asset out of supply needed a lot of co-ordination, but the tunnel relining work was crucial to guarantee the resilience of our water infrastructure, and it means asset life is ensured for up to another 100 years.” Rob added: “The reservoir had to be emptied for safety reasons, so its water level was the same as surrounding ground level. This was to ensure that no flooding could occur in the highly unlikely event of a dam breach. As the inlet and outlet tunnels were isolated, they couldn’t drain the reservoir in an emergency. “Ironically, the civil engineering / maintenance part has almost been the easier aspect. The hard parts were the planning and all the enabling work involved in taking the reservoir out of supply without any impact on customer supplies – that’s been my primary programme management role in this project.” The revised operating strategy for London focused on establishing different ways to abstract, store, treat and circulate water around the city during the works. Extra treatment works and pumps were brought online, and abstractions from the River Thames were switched, taking less water from the point which normally feeds into QEII, and more from other points up and downstream. The Environment Agency, DWI, Defra, the GLA, Port of London Authority, Wildlife Trust and other stakeholders, including local residents, have all been regularly briefed throughout because, as Rob pointed out: “This project isn’t just serious about engineering, it’s about the local community and environment too.” As an important SSSI site lies just across the road, water levels were lowered and held to a depth of six metres to protect birds, fish and other wildlife, while the solar panels that float on top of the reservoir stayed operational throughout. Rob added: “The mudflats were also protected from nesting birds, so there should not be any delays in refilling.” Work is now complete on the inlet tunnel, and reservoir refilling started mid-November; this could take 8-12 weeks. Parallel maintenance is being done on the outlet tunnel with the aim of returning to normal service by April 2022. Fortunately, there’ve been no sleepless nights for the team. Rob explained: “The highest risk point was during the summer which traditionally has higher customer demand and lower river abstraction to fill the reservoirs. But in fact, the wetter weather meant very healthy levels of rainfall and river flow. Plus, customer water demand is still suppressed because of the pandemic, particularly in London. “It’s difficult to judge when and if water usage will rise to pre-pandemic levels. In the meantime, we’re are taking every opportunity to do more maintenance work while customer demand is low, so we are ready for when that return to ‘normal’ occurs.”
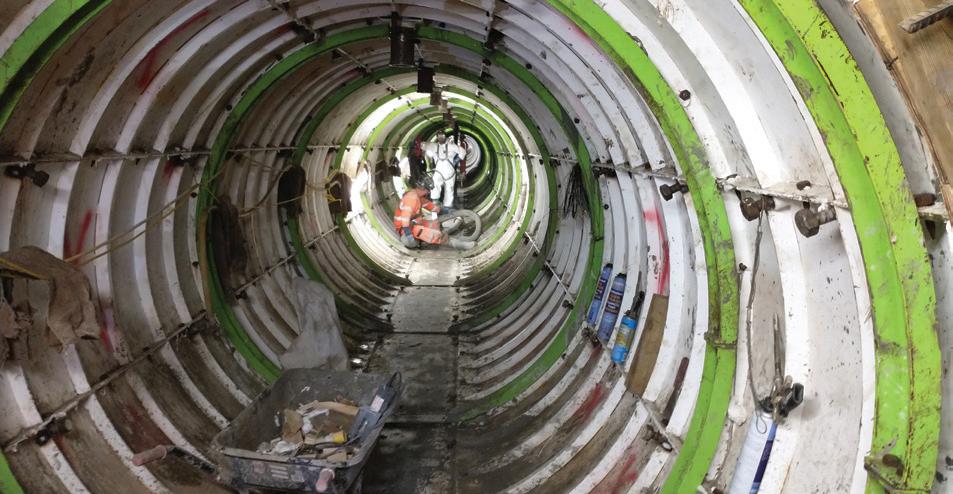
Essential maintenance work was carried out on the tunnels
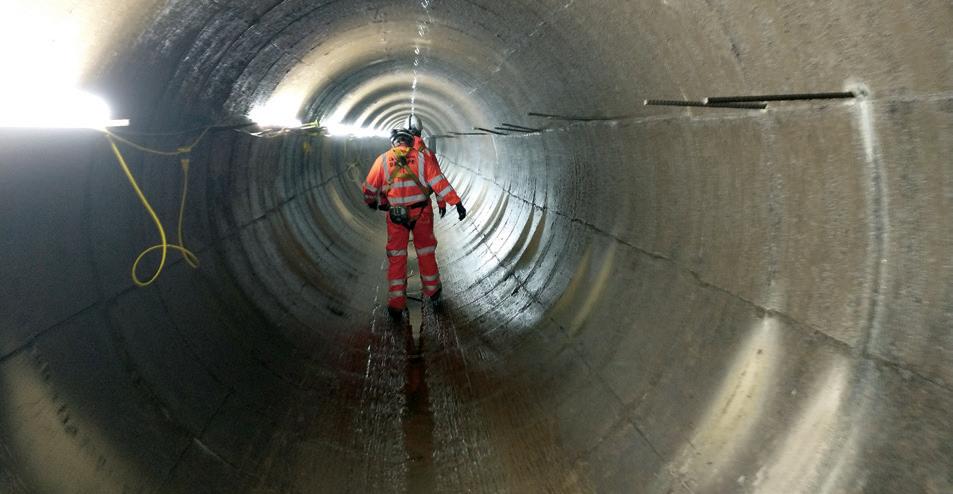
The 2km of inlet and outlet tunnels lie 40m underground
A new approach to modelling asset deterioration
Asset deterioration modelling is an important part of the toolkit for assessing asset health and improving asset performance. Currently used methods are based on quantifying asset health as a failure probability calculated from a failure distribution, for example Weibull, or as a measure of asset condition, for example wear of a critical component, and displayed in a P-F (potential failure – failure) curve. This article describes how PAM Analytics uses survival analysis, a method commonly used in epidemiology, to develop descriptive asset deterioration curves and predictive asset deterioration models to gain insight and understanding into asset performance and so improve asset management. It is useful to note that survival analysis is used to analyse and model Covid infection and mortality data. The analogy between human condition (survival/death) and treatment, and asset condition (working/failure) and maintenance is clear.
Descriptive Asset Deterioration – Kaplan Meier Analysis
PAM Analytics uses Kaplan Meier (KM) analysis to produce descriptive asset deterioration curves. The output is the cumulative hazard and survival probability of each asset at time t. The cumulative hazard at time t is the cumulative risk of failure at time t and is related directly to survival probability (the probability of surviving to time t). Failure probability is given by 1-survival_probability. KM analysis has two significant advantages over traditional failure distributions:
It is non-parametric, i.e. it does not make any assumptions about the data, for example that they follow a particular distribution.
It can quantify the effects of individual factors, for example asset specification and different types and levels of maintenance, on asset performance. Figure 1 shows deterioration curves produced using KM analysis. The effects of different levels of proactive maintenance on asset survival probability are clear.
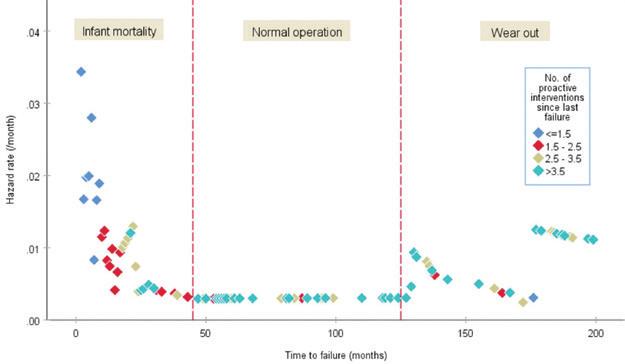
Hazard rate, also known as the conditional (instantaneous) failure rate function or hazard function, is another metric for assessing asset performance. It is the risk of failure at time t given that failure had not occurred by time t. Thus, the hazard rate at time t depends on the risk set at time t, i.e. the number of assets in use and therefore at risk of failure then.
Hazard rate is arguably a better measure of reliability than failure probability because it considers the risk set at each time. As the number of failures decreases, the failure probability approaches the hazard rate. Figure 2 shows a hazard rate curve (the ‘bathtub’ curve) calculated from the cumulative hazard, and therefore as with the cumulative hazard no assumptions about the data were made. To help understand hazard rate and cumulative hazard, Table 1 shows the analogy between hazard rate and cumulative hazard with speed and distance.
Figure 1: Kaplan Meier Deterioration Curves for Different Levels of Proactive Maintenance Table 1: Analogy of Hazard Rate and Cumulative Hazard with Speed and Distance

Measure (dimension) Definition Relationship Speed (length/time) Instantaneous rate of distance covered
Distance (length) Distance covered in time t speed x t Hazard rate (/time) Instantaneous failure rate Cumulative hazard (-) Risk of failure accumulated up to time t hazard_rate x t
Predictive Asset Deterioration – Cox Regression
KM analysis can be viewed as the exploratory data analysis stage of developing predictive Cox regression models. The models are at individual asset level and have a dynamic component and a static component. The dynamic component shows how the risk of failure increases as assets are used. The static component contains the predictors. Table 2 shows the predictors and coefficients of a Cox regression deterioration model for wet well submersible pumps.
Table 2: Example Cox Regression Predictive Asset Deterioration Model (static component)
Predictor
Most recent intervention:
proactive corrective
failure
No. of proactive interventions No. of corrective interventions
No. of previous failures Mean failure rate (per year) Total pump power at site (kW) Population per site per pump in each postcode district Monthly rainfall (mm) Site postcode town (exception) Coefficient
-2.083 -2.060
0
-0.733 -0.358
0.144
0.259 0.006
-0.331
0.008
-0.384
Figure 2: Hazard Rate Curve (calculated empirically) The main conclusions from Table 2 are that proactive maintenance has the greatest effect on reducing the risk of asset failure (Figure 1 has a similar conclusion about the extent of proactive maintenance) and that a history of repeated asset failure increases the risk of future failure. They confirm accepted practice but the model goes further by calculating the risk of failure of each asset as it is used, maintained, fails and then reinstated.
Dr Atai Winkler, PAM Analytics atai.winkler@pamanalytics.com


