
2 | AA SED | Msc + MArch | 2022-23
Authorship Declaration Form
Term 1 Project : London Building Studies
TITLE: Hilson Moran Office at Hay’s Galleria
NUMBER OF WORDS: 8545
STUDENT NAME(S): Divy Vora Sarab Jot Singh Stavan Gang Yanfei Wang DECLARATION:
“I certify that the contents of this document are entirely my own work and that any quotation or paraphrase from the published or unpublished work of others is duly acknowledged.”
Signature(s):
Divy Vora Sarab Jot Singh Stavan Gang Yanfai Wang
Date: 16th January 2023
| 3
Hilson Moran office at Hay’s galleria
4 | AA SED | Msc + MArch | 2022-23
This report is the outcome of building studies project of MSc & MArch students at the Sustainable Environmental Design program. The building studied in this report is the Hay’s Galleria situated opposite London Bridge Station at Tooley and Counter Street in the London Borough of Southwark. The site hosts mixed use programs integrated with the Queen’s Walk abutting the Thames River.
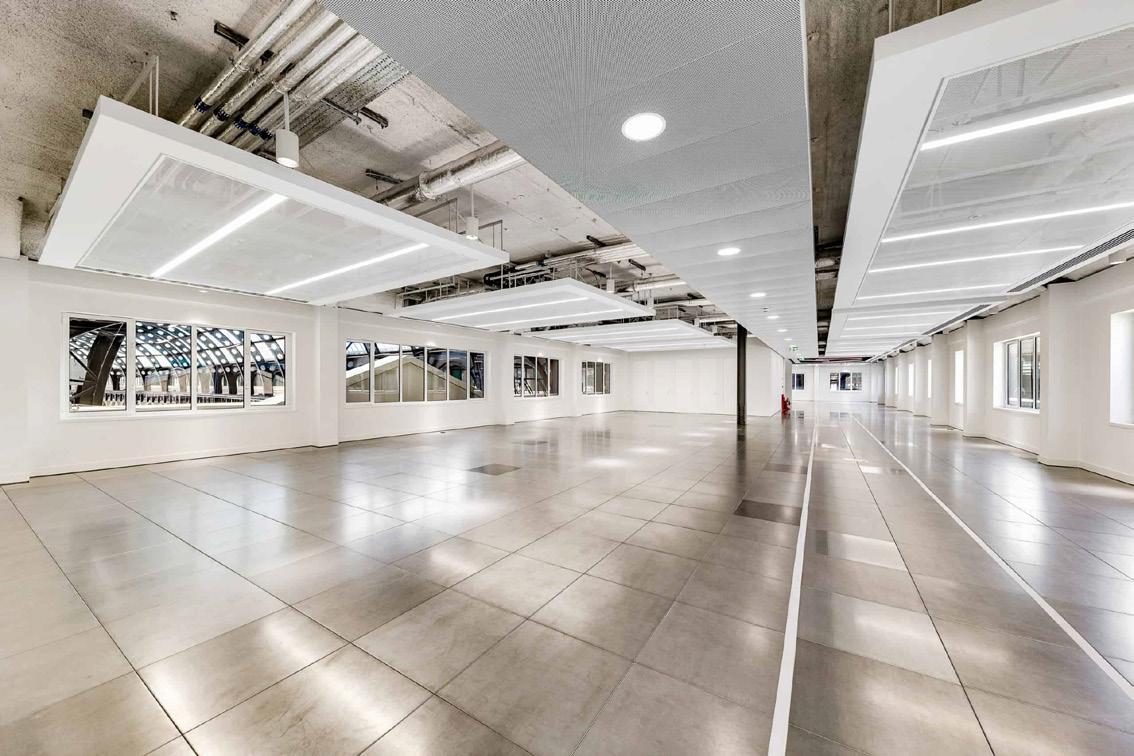
The primary area of focus is the Offices of Hilson Moran at the 3 rd floor of Shackleton House with the Secondary being the Galleria space inside the building complex.
The study consists of observations, surveys, measurements and analysis based on factors affecting the environmental performance and occupant comfort. Computational simulations were carried out to judge the current performance as well as to experiment predictive scenarios to improve performance.
| 5
Hilson
Moran
office at Hay’s galleria
ABSTRACT
ACKNOWLEDGMENT
The team would like to appreciate the time and effort of everyone involved with this project.
First of all, we would like to express our sincere gratitude toward everyone at the Hilson Moran Offices, especially Amadeo Scofone, for their cooperation and support.
Furthermore, the team would also like to thank the AA SED directors, Simos Yannas (Project Director) and Paula Cadima (co-Director) for their guidance during the term.
Additionally, we are extremely grateful towards the tutorials and support provided by all of the faculty and teaching staff at AA SED (Nick Baker, Gustavo Brunelli, Herman Calleja, Byron Mardas, Jorge Rodríguez Álvarez, Mariam Kapsali).
Lastly, Joana Gonçalves, thank you from the bottom of our hearts, without your guidance we wouldn’t have been able to do this project.
6 | AA SED | Msc + MArch | 2022-23

Hilson Moran office at Hay’s galleria | 7 17 27 1. INTRODUCTION 5. CONCLUSIONS 6. REFERENCES 7. APPENDIX 2. OVERVIEW 3. OUTDOOR STUDY 11 08 2.1 London Weather Data 12 13 14 15 2.2 Site Surrounding and History 2.3 Building Information 2.4 Material Profile 5.1 General Conclusions 5.2 Personal Learnings 4.1 Office Information 3.1 Research Precedence 3.2 Solar Analysis 3.3 Experience Matrix 3.4 Spot Measurements 3.5 Radiation Analysis 3.6 UTCI Study 3.7 Roof Iterations for Indoor Daylight 3.8 Outdoor Study Conclusions 18 19 20 21 22 23 24 25 28 29 30 31 32 34 35 37 38 39 44 45 46 48 50 51 40 42 43 4.2 Field Work: Occupant Interviews 4.3 Facade Study 4.4 Dataloggers Analysis 4.5 Volume Study Daylight Study 4.6 Useful Daylight Illuminance 4.7 Orientation Study 4.8 Ceiling Iterations 4.9 Glare Analysis 4.10 Conclusions Ventilation Study 4.11 Single-sided for Window B 4.12 Cross Ventilation 4.13 Conclusions Thermal Study 4.14 Base Case Parameters 4.15 Base Case Annual Performance 4.16 Typical Summer Week 4.17 Typical Winter Week 4.18 Proposed Case Annual Performance 4.19 Conclusions 4. INDOOR STUDY 17 27 1. INTRODUCTION 5. CONCLUSIONS 6. REFERENCES 7. APPENDIX 2. OVERVIEW 3. OUTDOOR STUDY 11 08 2.1 London Weather Data 12 13 14 15 2.2 Site Surrounding and History 2.3 Building Information 2.4 Material Profile 5.1 General Conclusions 5.2 Personal Learnings 4.1 Office Information 3.1 Research Precedence 3.2 Solar Analysis 3.3 Experience Matrix 3.4 Spot Measurements 3.5 Radiation Analysis 3.6 UTCI Study 3.7 Roof Iterations for Indoor Daylight 3.8 Outdoor Study Conclusions 18 19 20 21 22 23 24 25 28 29 30 31 32 34 35 37 38 39 44 45 46 48 50 51 40 42 43 4.2 Field Work: Occupant Interviews 4.3 Facade Study 4.4 Dataloggers Analysis 4.5 Volume Study Daylight Study 4.6 Useful Daylight Illuminance 4.7 Orientation Study 4.8 Ceiling Iterations 4.9 Glare Analysis 4.10 Conclusions Ventilation Study 4.11 Single-sided for Window B 4.12 Cross Ventilation 4.13 Conclusions Thermal Study 4.14 Base Case Parameters 4.15 Base Case Annual Performance 4.16 Typical Summer Week 4.17 Typical Winter Week 4.18 Proposed Case Annual Performance 4.19 Conclusions 4. INDOOR STUDY 17 27 1. INTRODUCTION 5. CONCLUSIONS 6. REFERENCES 7. APPENDIX 2. OVERVIEW 3. OUTDOOR STUDY 11 08 2.1 London Weather Data 12 13 14 15 2.2 Site Surrounding and History 2.3 Building Information 2.4 Material Profile 5.1 General Conclusions 5.2 Personal Learnings 4.1 Office Information 3.1 Research Precedence 3.2 Solar Analysis 3.3 Experience Matrix 3.4 Spot Measurements 3.5 Radiation Analysis 3.6 UTCI Study 3.7 Roof Iterations for Indoor Daylight 3.8 Outdoor Study Conclusions 18 19 20 21 22 23 24 25 28 29 30 31 32 34 35 37 38 39 44 45 46 48 50 51 40 42 43 4.2 Field Work: Occupant Interviews 4.3 Facade Study 4.4 Dataloggers Analysis 4.5 Volume Study Daylight Study 4.6 Useful Daylight Illuminance 4.7 Orientation Study 4.8 Ceiling Iterations 4.9 Glare Analysis 4.10 Conclusions Ventilation Study 4.11 Single-sided for Window B 4.12 Cross Ventilation 4.13 Conclusions Thermal Study 4.14 Base Case Parameters 4.15 Base Case Annual Performance 4.16 Typical Summer Week 4.17 Typical Winter Week 4.18 Proposed Case Annual Performance 4.19 Conclusions 4. INDOOR STUDY 17 27 7 1. INTRODUCTION 5. CONCLUSIONS 6. REFERENCES 7. APPENDIX 2. OVERVIEW 3. OUTDOOR STUDY 11 08 57 59 2.1 London Weather Data 12 13 14 15 2.2 Site Surrounding and History 2.3 Building Information 2.4 Material Profile 5.1 General Conclusions 54 55 5.2 Personal Learnings 4.1 Office Information 3.1 Research Precedence 3.2 Solar Analysis 3.3 Experience Matrix 3.4 Spot Measurements 3.5 Radiation Analysis 3.6 UTCI Study 3.7 Roof Iterations for Indoor Daylight 3.8 Outdoor Study Conclusions 18 19 20 21 22 23 24 25 28 29 30 31 32 34 35 37 38 39 44 45 46 48 50 51 40 42 43 4.2 Field Work: Occupant Interviews 4.3 Facade Study 4.4 Dataloggers Analysis 4.5 Volume Study Daylight Study 4.6 Useful Daylight Illuminance 4.7 Orientation Study 4.8 Ceiling Iterations 4.9 Glare Analysis 4.10 Conclusions Ventilation Study 4.11 Single-sided for Window B 4.12 Cross Ventilation 4.13 Conclusions Thermal Study 4.14 Base Case Parameters 4.15 Base Case Annual Performance 4.16 Typical Summer Week 4.17 Typical Winter Week 4.18 Proposed Case Annual Performance 4.19 Conclusions 4. INDOOR STUDY TABLE OF CONTENTS
INTRODUCTION
A comprehensive assessment in terms of environmental performance of a case study was required as part of the Term 1 course structure of Sustainable Environmental Design program at the School of Architecure at Architectural Association.
The case study chosen for this project is the Hay’s Galleria building including the offices of Hilson Moran at the third floor of Shackleton House. The intruiguing quotient of this space was the challenges it posed in terms of Environmental performance. The Galleria of the complex remains self shaded for a majority of the time.
Upon initial assessment, the office consisted of some apparent issues such as a lack of daylighting on the interior of the Galleria space. Furthermore, the atrium roof also self-shaded the site most of the time. In the interiors of the Hilson Moran office, the arrangement of workspaces meant no natural daylighting due to a deep plan. Also, the office consisted of mechanical and electric inefficiencies.
The mitigation of such problems were explored in this study through experimentation. There were several analytical approaches towards the study such as fieldwork analysis, computational analysis and drawing conclusions from each.
The report is structure in 4 major parts, the overview, Outdoor Studies, Indoor studies and Technical Studies. Each of the team members contributed towards the individual elements of each components.
Towards the conclusion of this study, the team gained a comprehensive understanding of the environmental behaviour of the space.
Introduction - Overview - Outdoor - Indoor - Conclusions - References
8 | AA SED | Msc + MArch | 2022-23
1.1 Brief
This report is divided into five main chapters. The first one includes the basic introduction of the project and site and the outline of the way in which the study has been conducted.
After this, an overview of the site, it’s location and history has been specified. This includes the climatic conditions of the geographical location of the site.
The major analysis of the report is in the third and fourth part consisting of the indoor and outdoor studies. The outdoor studies contains the analysis done in the Galleria area whereas for the indoors, the Hilson Moran Office was studied.
Outdoor Study was carried out mainly by on-site measurements, thermal comfort as well as the solar studies to analyse the effects roof iterations on the the space.
Thereafter, the fifth part of this study, technical analysis was carried out into 3 major field namely, Daylighting, Ventilation and Thermal Mass and Insulation. Daylighting was studied through the aspects of orientation by conducting Volume and Glare analysis. Similarly, Ventilation was looked at through the lens of Optimal Operable area as well as window optimisation to achieve Ventilation strategies. Lastly, Thermal mass and Insulation study was conducted through optimising the insulation and material values.
This was done to achieve an proposed design solution containing an optimised strategy in order to achieve a more comfortable space for the inhabitants of the New Office space.
| 9
Hilson Moran
office at Hay’s galleria
Hilson Moran
Outdoor Study Field Work Indoor Study Technical Study Galleria Roof Base case In future office will be shifted to 2nd floor Suggestions Conclusion Conclusion UTCI Study Daylight Radiation Ventilation Thermal Daylight
Figure 1.2.1 Methodology flow chart Introduction - Overview - Outdoor - Indoor - Conclusions - References
Hay’s Galleria
1.2 Methodology
02. OVERVIEW
2.1
The location of the site is in the heart of London with the nearest weather station being that of St.James Park . The data set used for the plotting of the graph contained measurements from 1973 to 2021.
As can be observed from the annual graph, the temperature remain equable for the majority period of time except for certain outlier periods wherein it spikes. Furthermore, the mean outdoor temperatures are typically below the comfort band for the majority of the time during the year.
During winters, the Dry-bulb temperatures reaches a minimum of -2 °C and a maximum of 14.2 °C. Furthermore, in the summers months the DBT temperatures fluctuate between 8 °C to 33 °C. The coldest months were observed to be December, January and February whereas the warmest were July and August.
There is ample amount of precipetation throughout the course of the year with the prevailing wind direction being from the SW. However, the wind direction switches to NE direction during portions of Autumn and Winter months.
40 Temperature ( o C) 4.0 5.0
35 Cold Cold Comfortable Comfortable Warm
30 2000 Energy Intensity (Wh/m ) Jan Feb Mar April May Jun July Aug Sept Oct Nov Dec
Wind Speed (m/s) 0.0 1.0 2.0 3.0
6.0
0 400 600 800 1000 7.0
8.0 9.0 10.0
London Weather Data Figure 2.1.1 Climate data chart. (Source: Ladybug) Table 2.1.1 Lower and upper limit of EN15251-2007 Comfort band for London. Introduction - Overview - Outdoor - Indoor - Conclusions - References
Direct Radiation Global Horizontal Radiation Diurnal Temperature Mean Daily Temperature Comfort Band EN15251-2007 Comfort Band Jan Feb Mar Apr May Jun Jul Aug Sep Oct Nov Dec Lower Limit 19.1 19.1
Upper Limit
19.1 19.4 20.1 21.0 21.9 22.1 21.3 20.2 19.2 19.1
25.1 25.1 25.1 25.4 26.1 27.0 27.9 28.1 27.3 26.2 25.2 25.1
12 | AA SED | Msc + MArch | 2022-23
The adaptive comfort band which is illustrated in the graph, is based on the (EN15251-2007) standard. In accordance with the annual outdoor dry-bulb temperature and the adaptive comfort band, it can be assumed that the annual average demand for heating is probably going to be higher, than the one for cooling. -5 -10
0
5 200
10 1200
15 1400
20 1600
25 1800
2.2 Site Surroundings & History
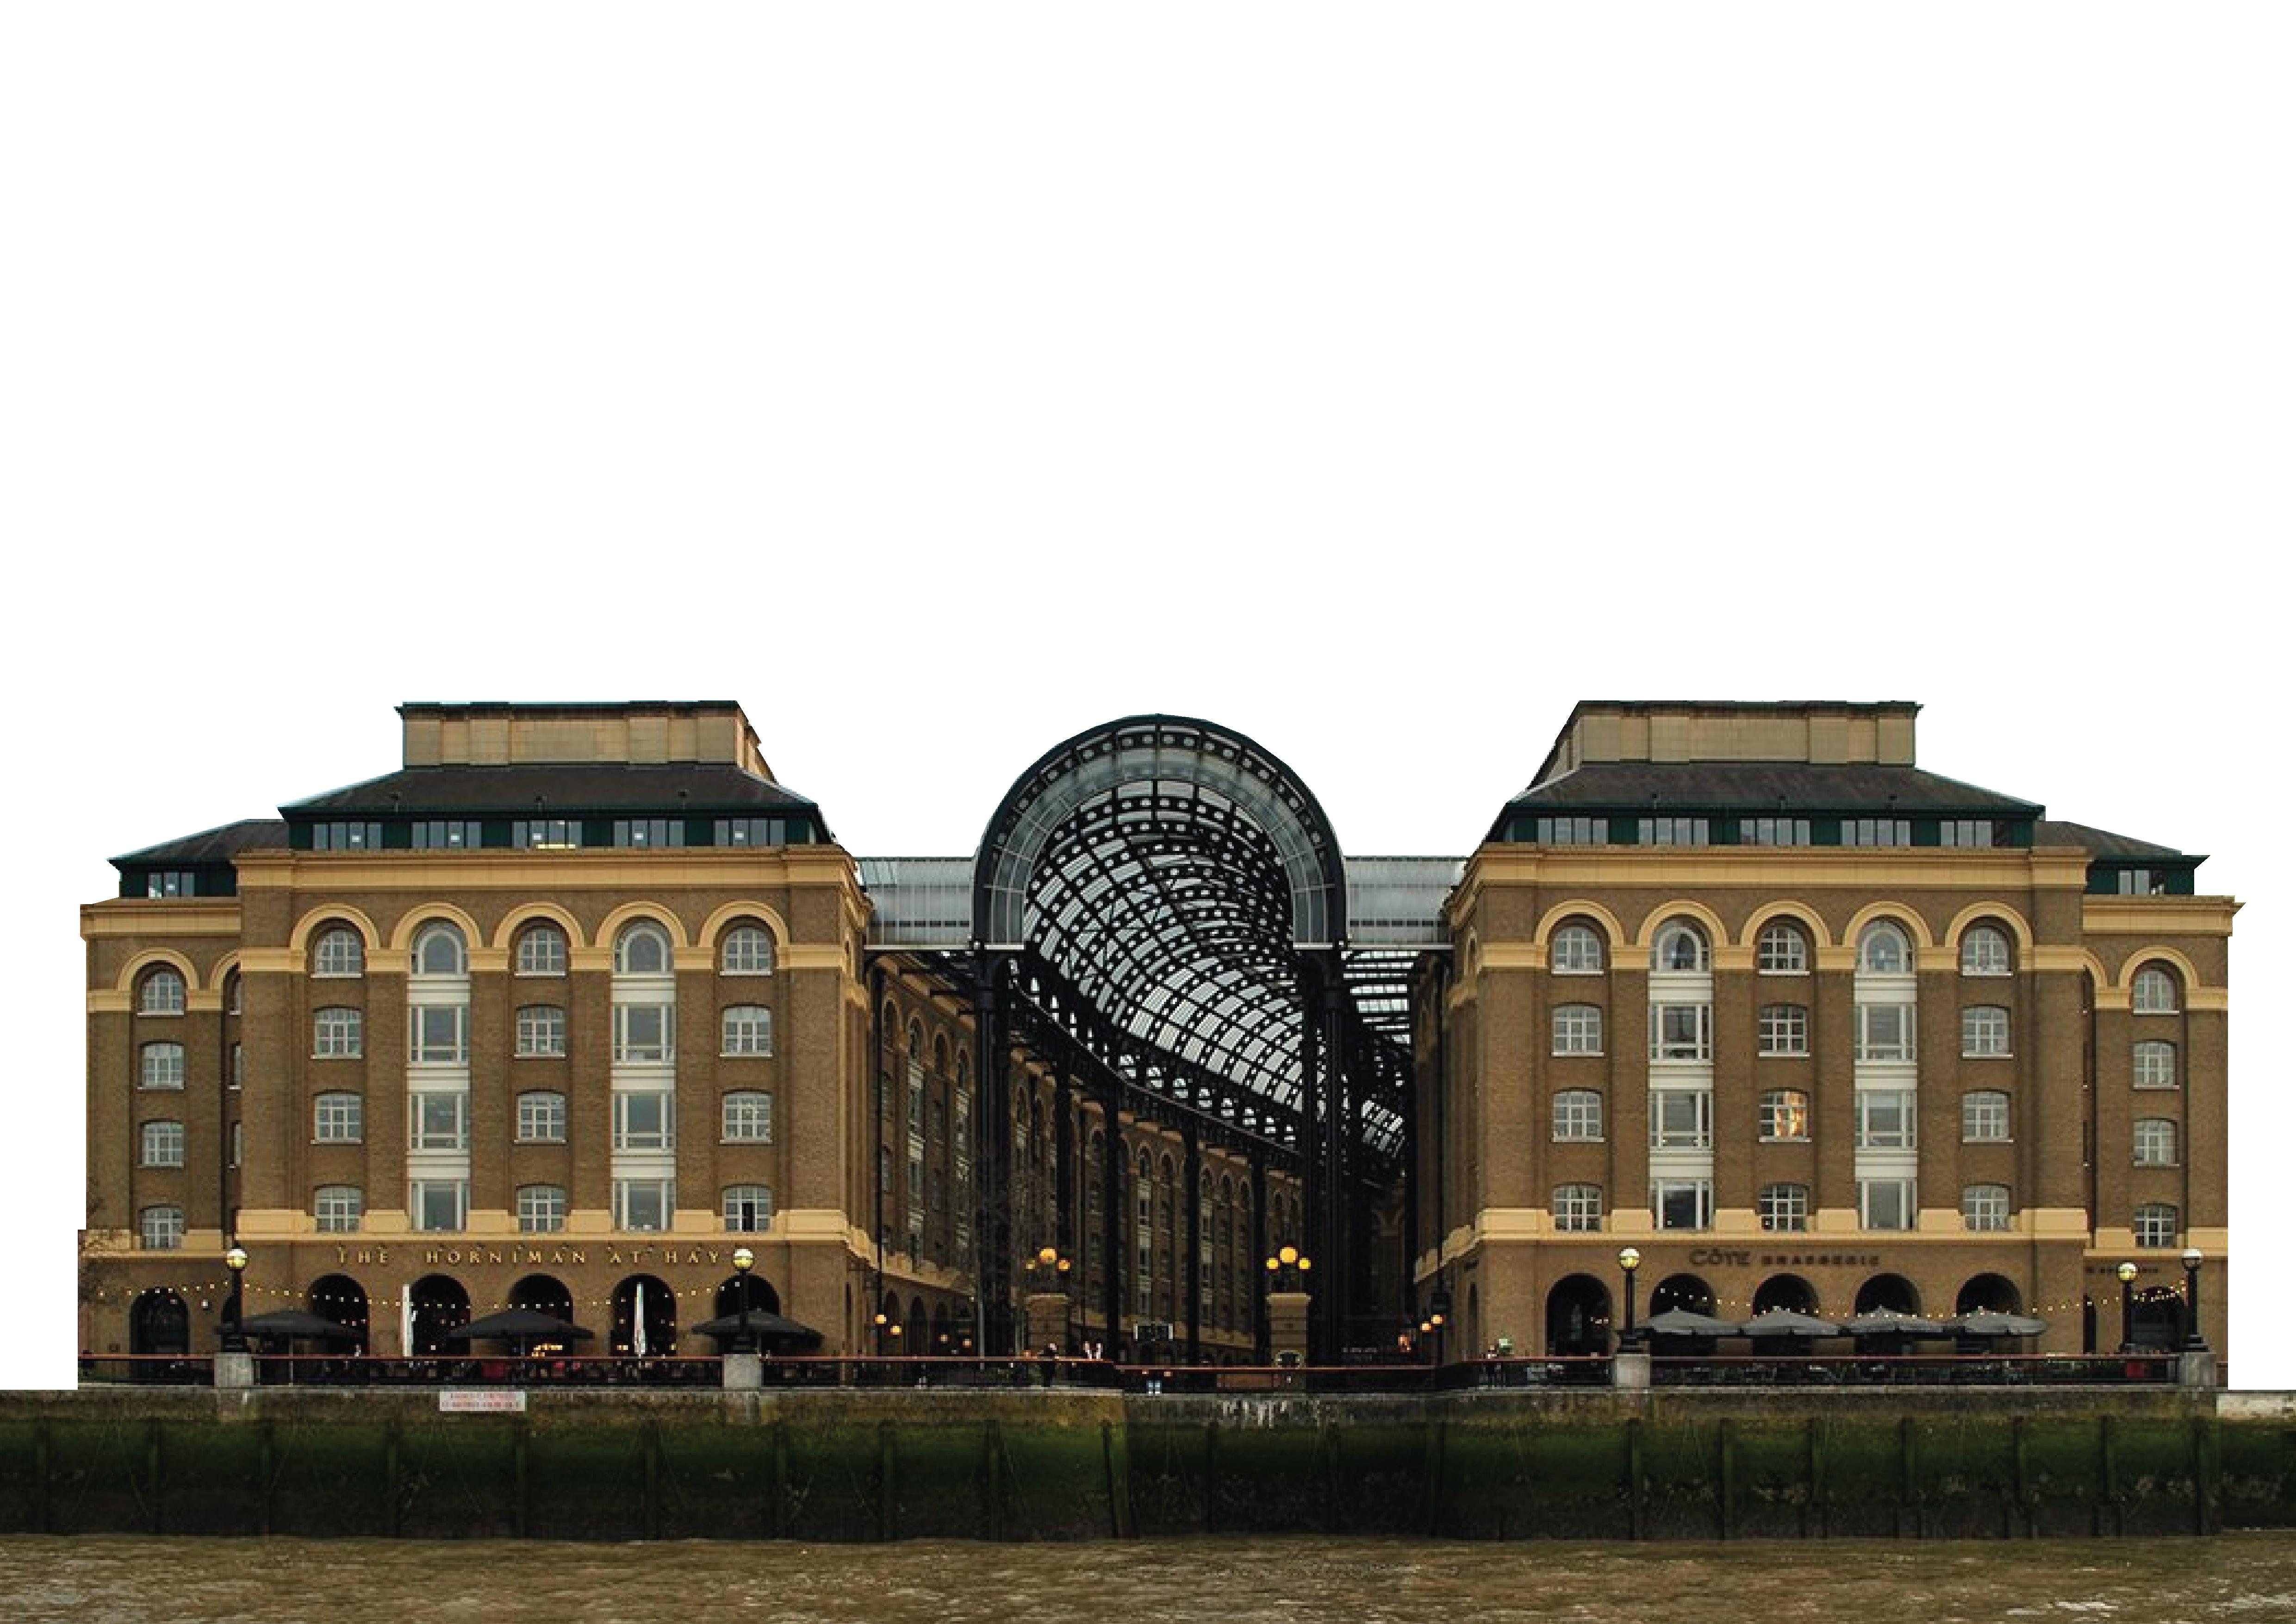
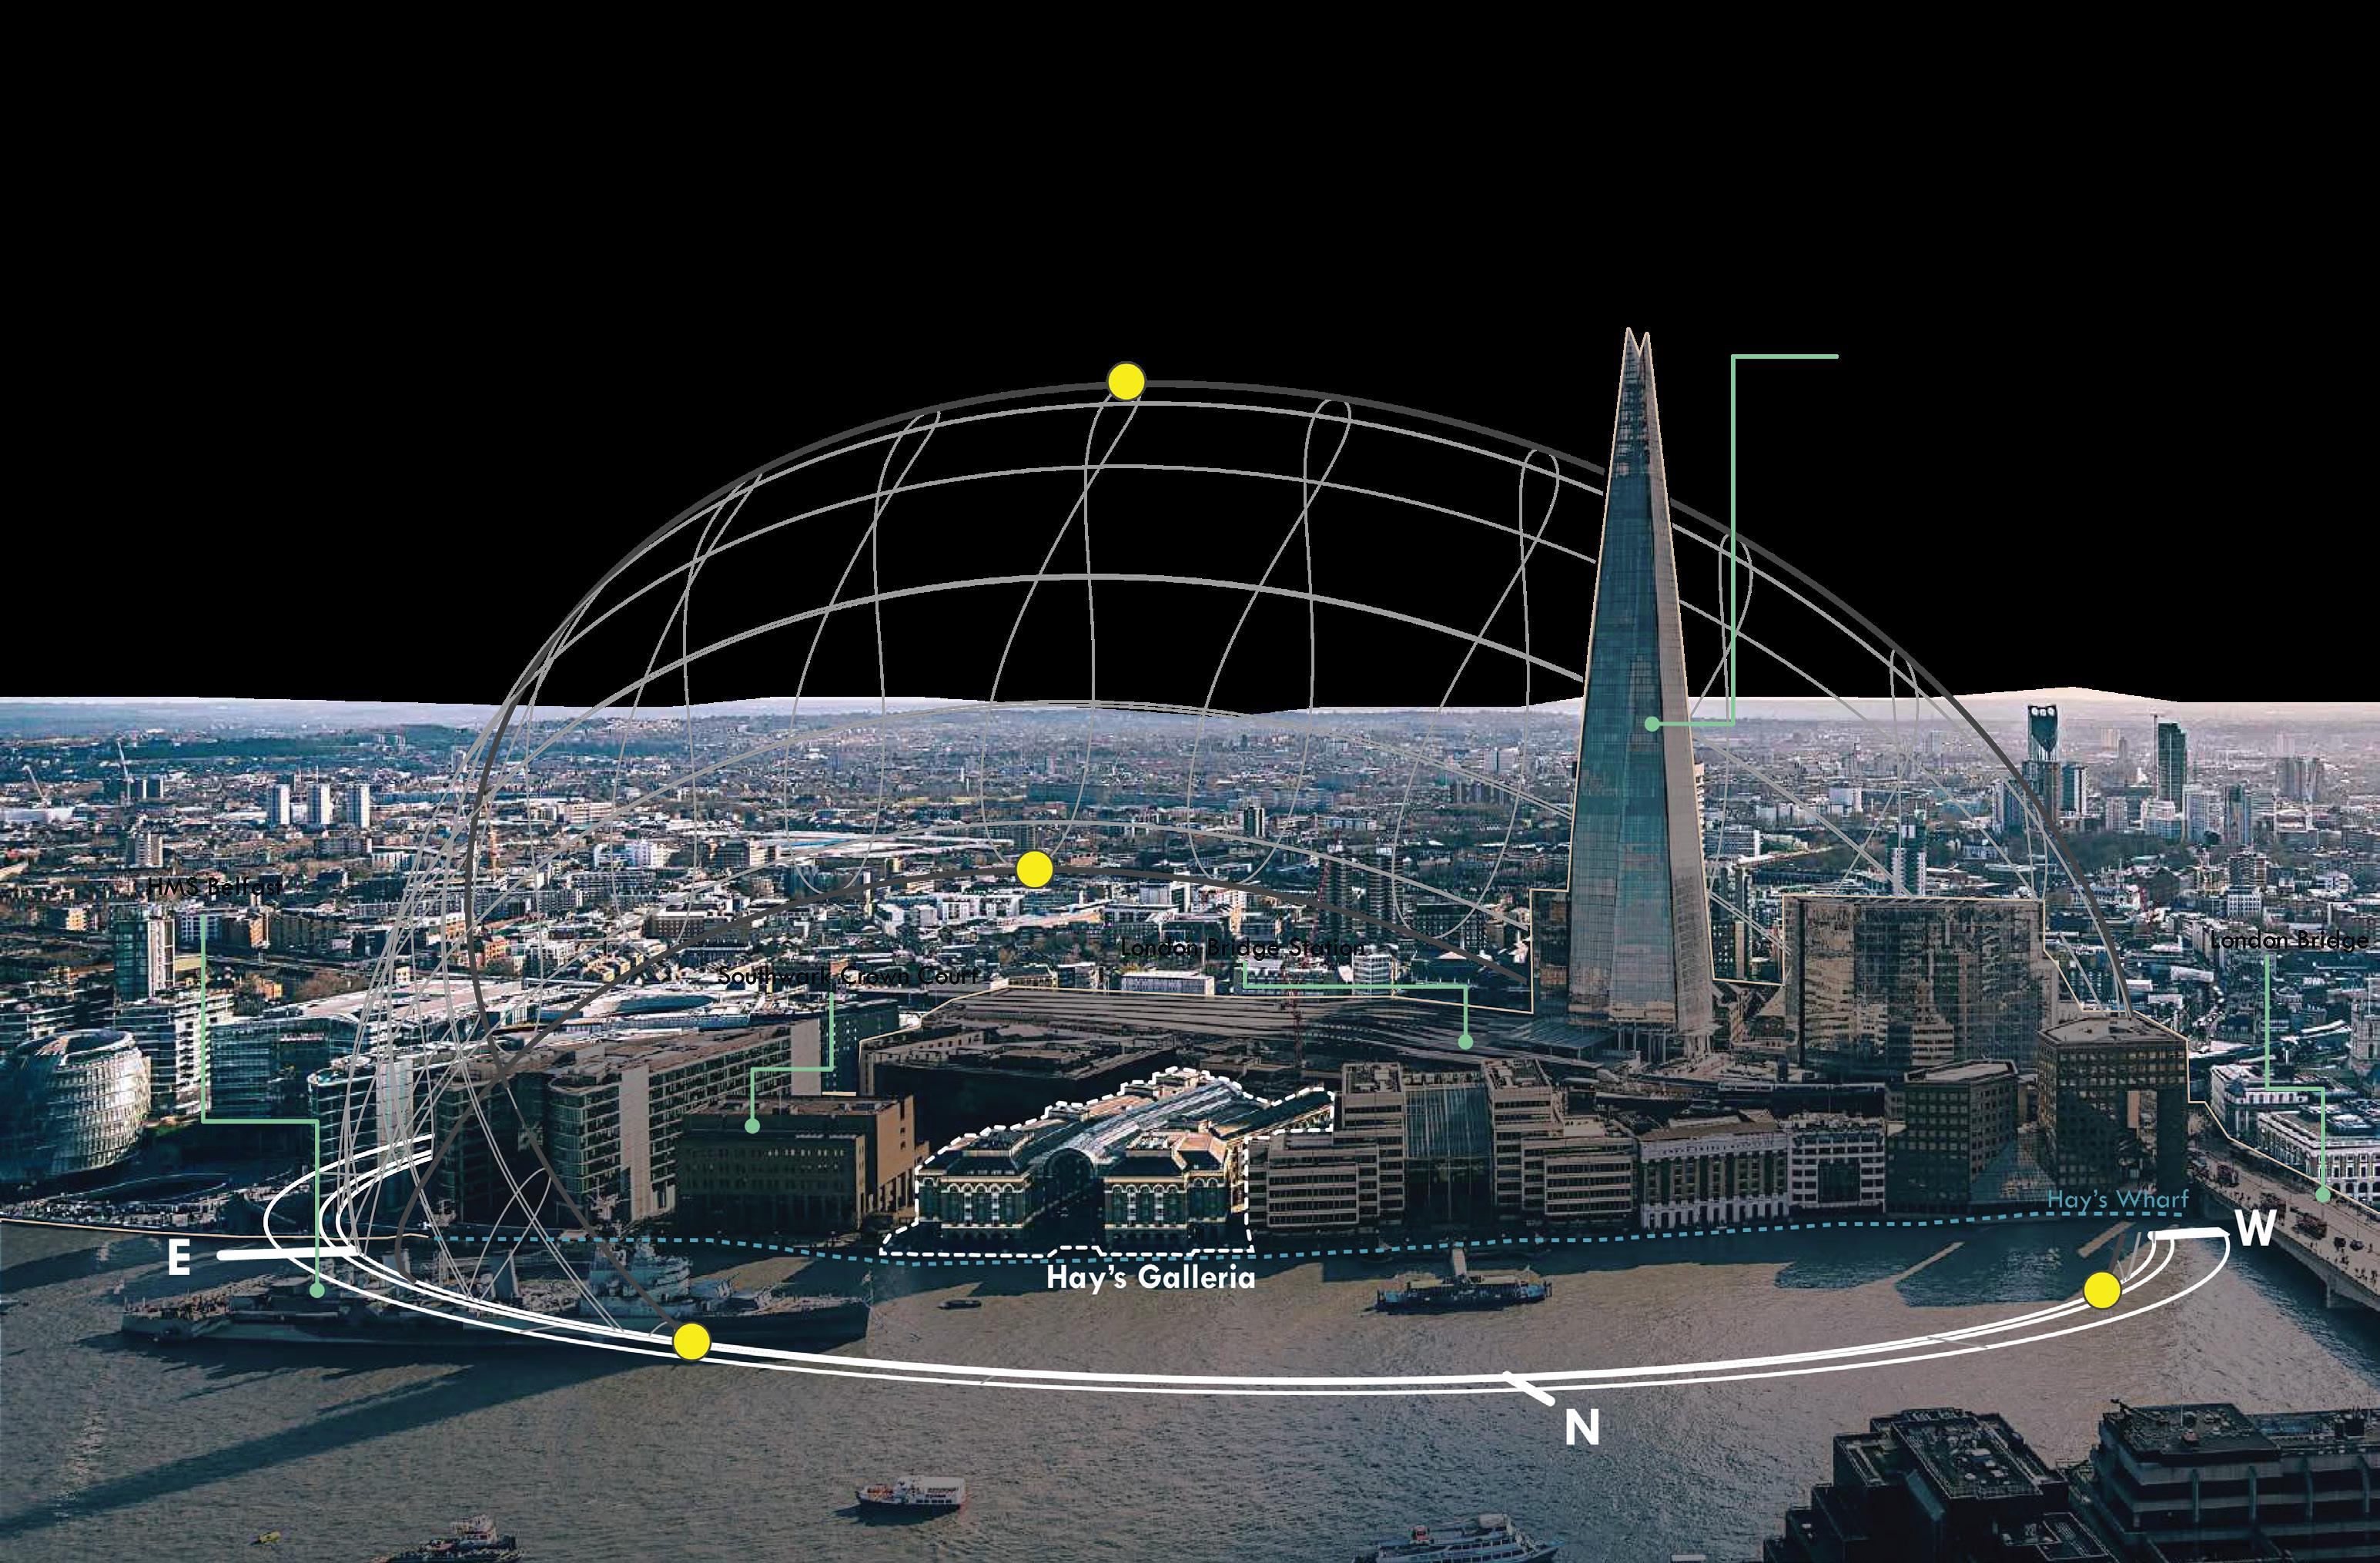
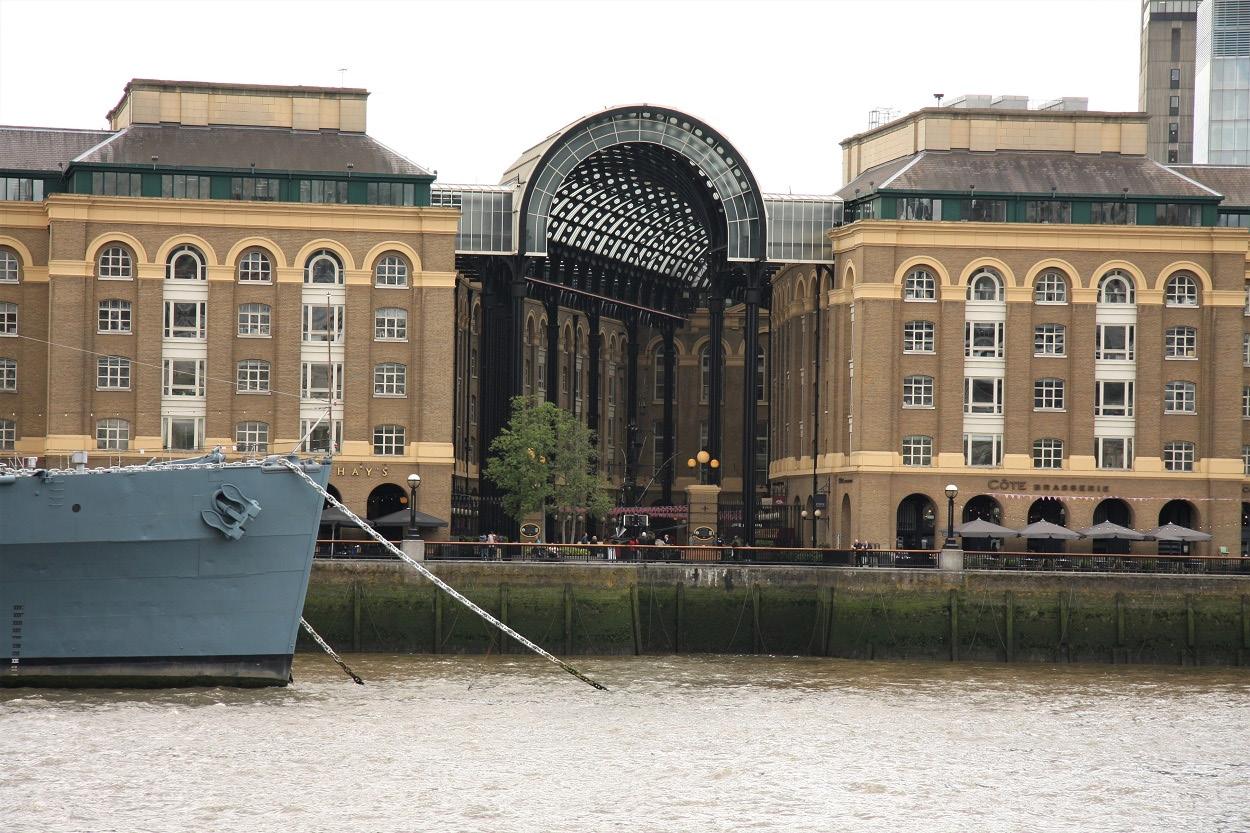
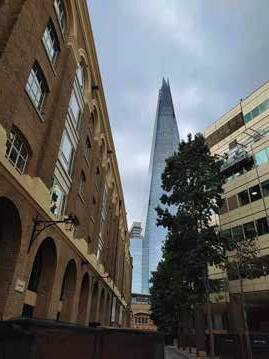
The Site is situated in the borough of Southwark, next to the London bridge station, therefore having excellent last mile connectivity with the Shard overlooking the building complex. The front façade of the building is north oriented, facing the city of London.
The U-shaped complex open outwards toward the Thames River, drawing in cool-river wind from the North-Eastern direction during the Autumn season. Furthermore, the predominant wind direction is from the South-western direction.
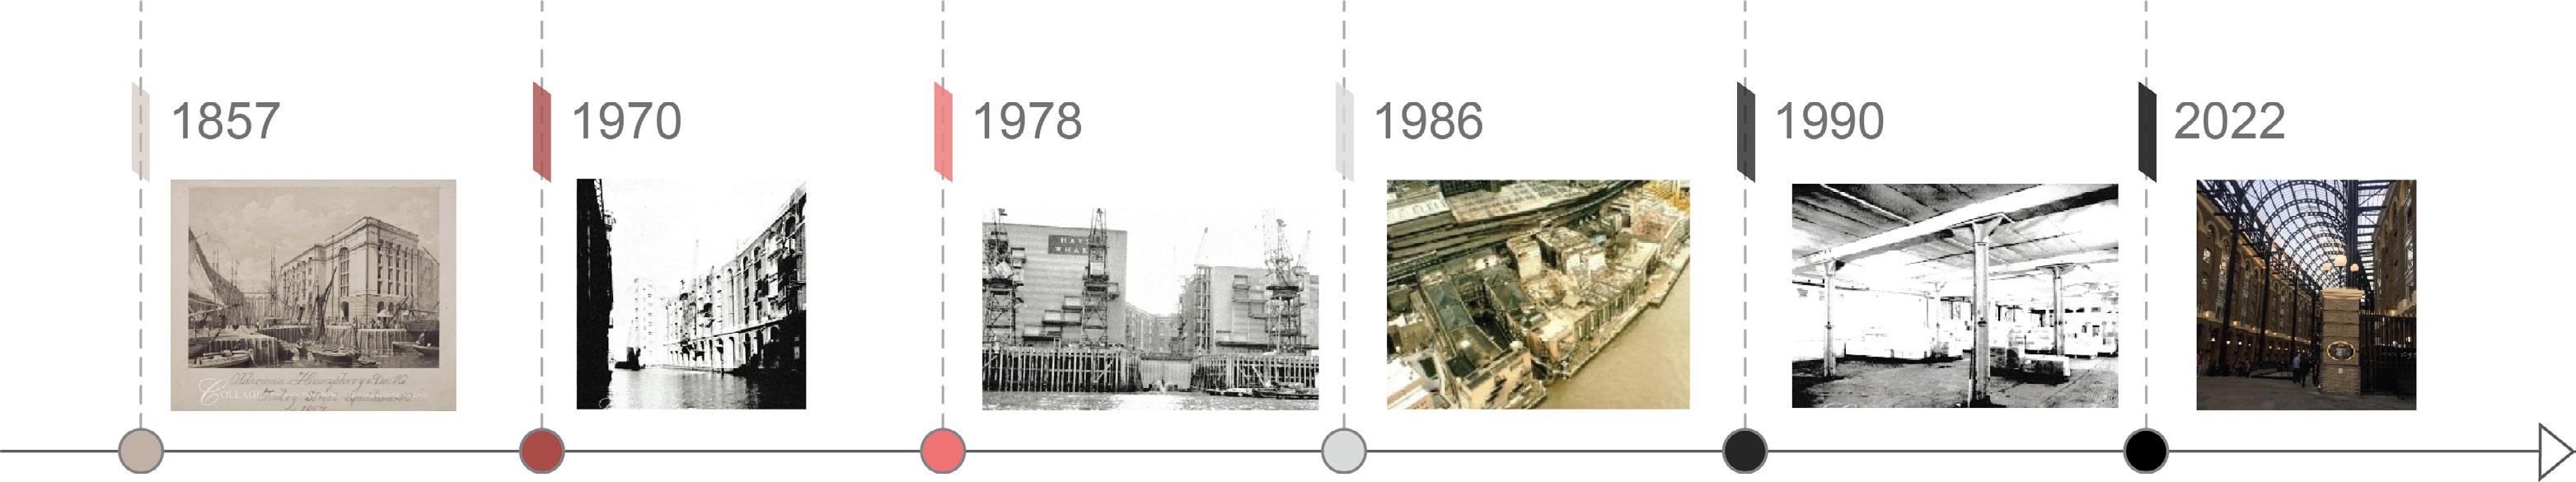
Likewise, the building has a very long-standing history going back hundreds of years. The provenance of the building consists of three major redevelopments but the original character has been retained, even after the great fire of London.
The site was originally a brewhouse, which was bought by Alexander Hay in 1651. However, the building was severely damaged in the Great Fire Of Southwark in 1676.
The building is a composite of many Architectural Styles such as the Georgian, Victorian and Art Deco among others. The site was gravely damaged thrice over it’s life span, first during the Great fire of London then the great fire of tooley street and finally the World War 2 Bombings. During the course of time, the building was refurbished multiple times as it changed ownership.
Currently, the building has been classified as grade II listed, therefore intervention can only be done on the interiors.
Figure 2.2.2 Site transition over the years
office at Hay’s galleria | 13
Hilson Moran
Figure 2.2.1 Site context with sun path overlay on Hay’s Galleria. (Image source: Hay’s Galleria official website)
Introduction - Overview - Outdoor - Indoor - Conclusions - References
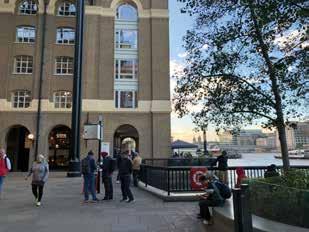
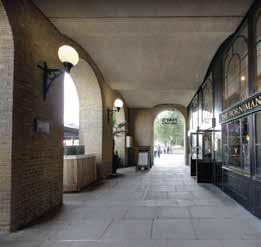
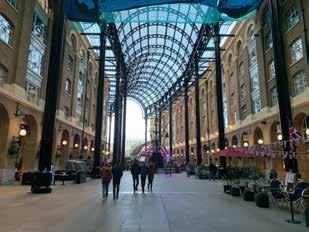
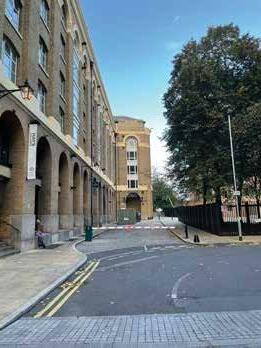
Figure 2.3.1 Hay’s Galleria zoning and information

Introduction - Overview - Outdoor - Indoor - Conclusions - References
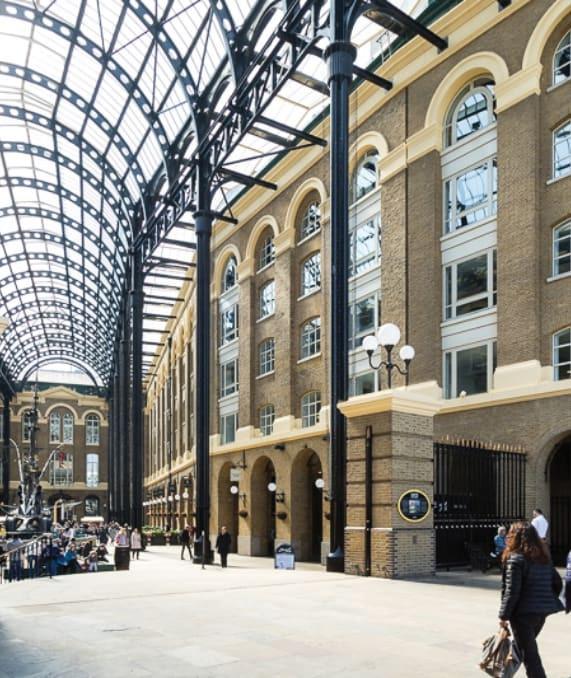
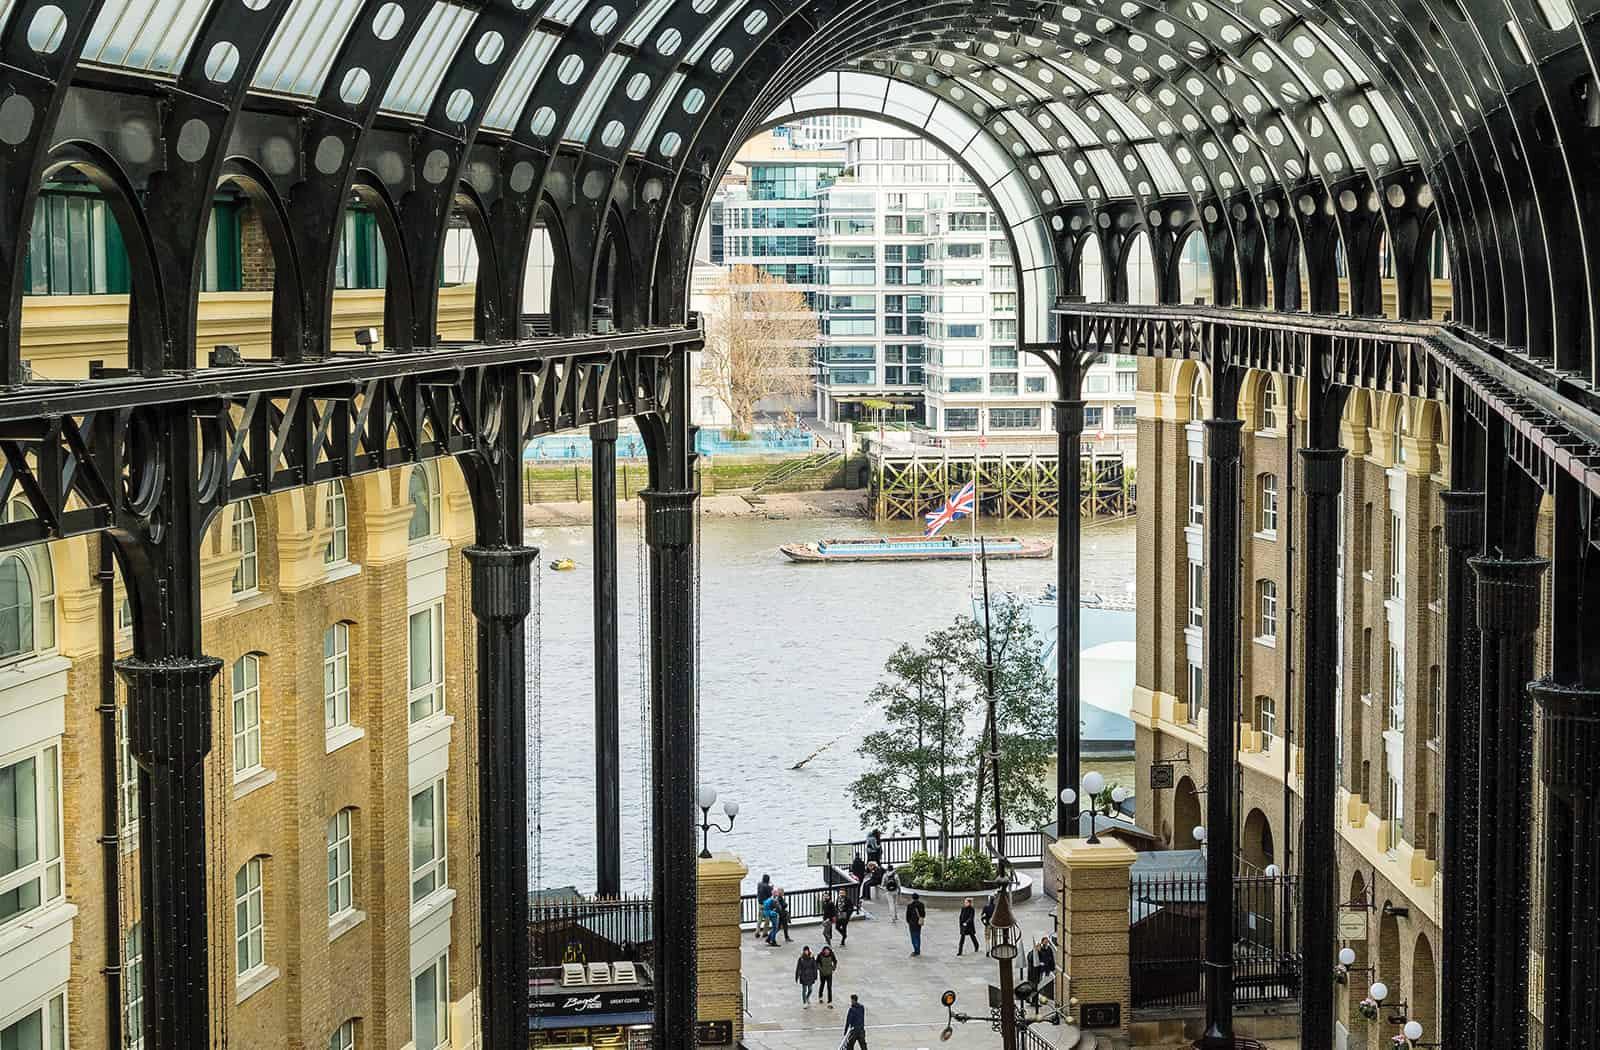
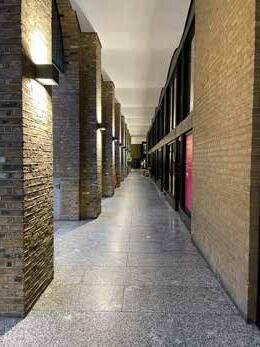
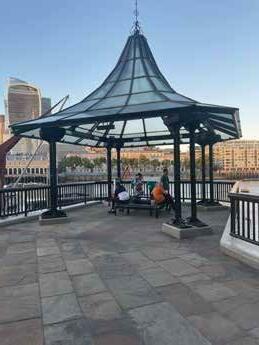
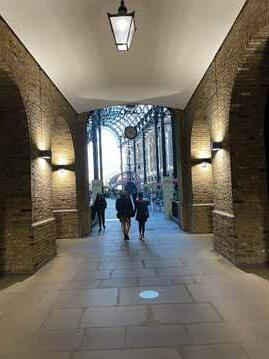
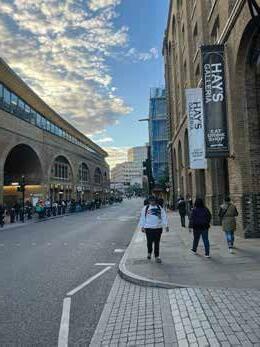
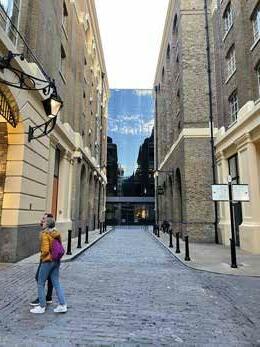
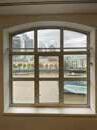
Figure 2.3.2 Site images
Shackleton House
Hilson Moran’s Office
Tea Auction House
Counting House Hay’s Lane House
Goldings House Hay’s Galleria
Arcade Area
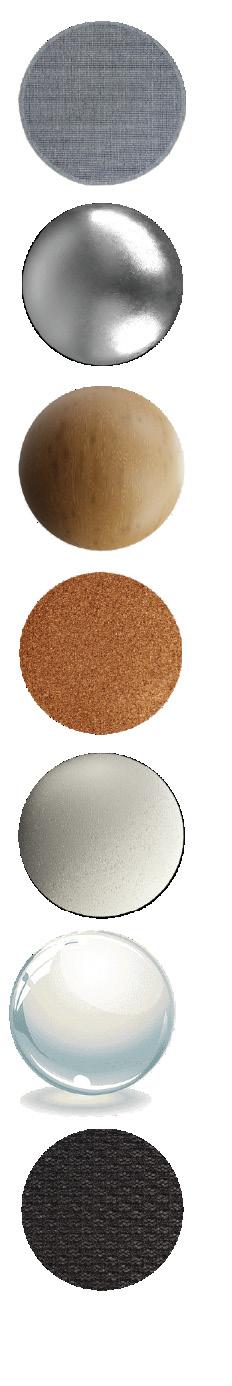
2.4 Material Profile
The materials used in construction are typical for that of the period in which the building was originally constructed. Even though the building has been through major refurbishments, there remains a resemblence of the original character.
To understand the environmental comfort of the space, a material study was conducted. The materiality found is majorly of exposed yellow brick with mortar on the external façade and granite stone on the flooring.
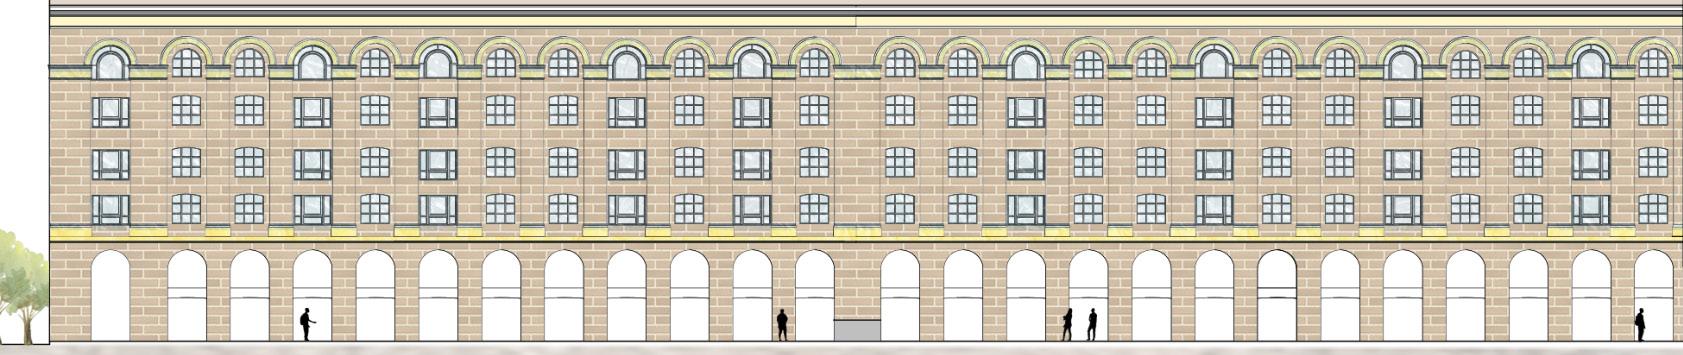


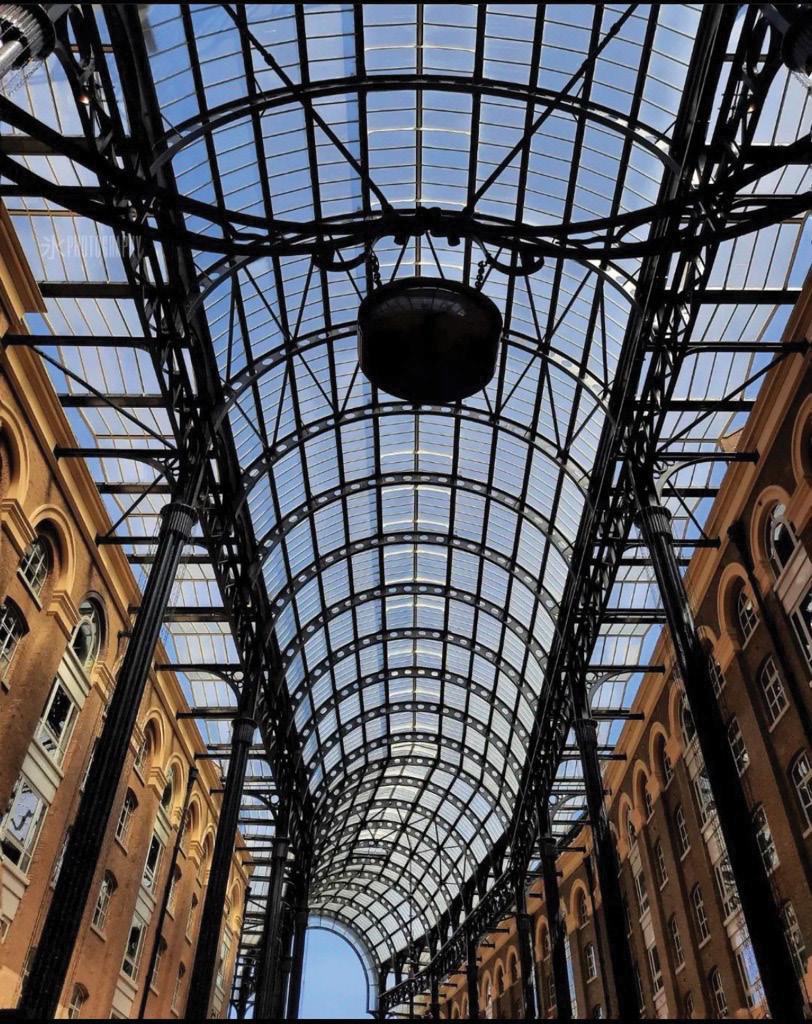
Due to constant refurbishments, the materiality pallette of the wharf was updated according to time. In late 20 th century, a glass and steel barrel-vaulted roof was erected over the former dock area in a Victorian style, providing shade to the Galleria area.
Material Specifications:
Roof Glass
VLT: 0.6
U Value: 2.85 W/m²K

The Glass blocks 20% of the direct radiation entering the galleria.
Yellow Stock Brick
U Value: 1.3 W/m²K
Facade
Figure 2.4.1 Materials on site
Introduction - Overview - Outdoor - Indoor - Conclusions - References
office at Hay’s galleria
Hilson Moran
Galleria space
Yellow stock Brick Limestone Aluminium sheet
Graphite Stone
03. OUTDOOR STUDY
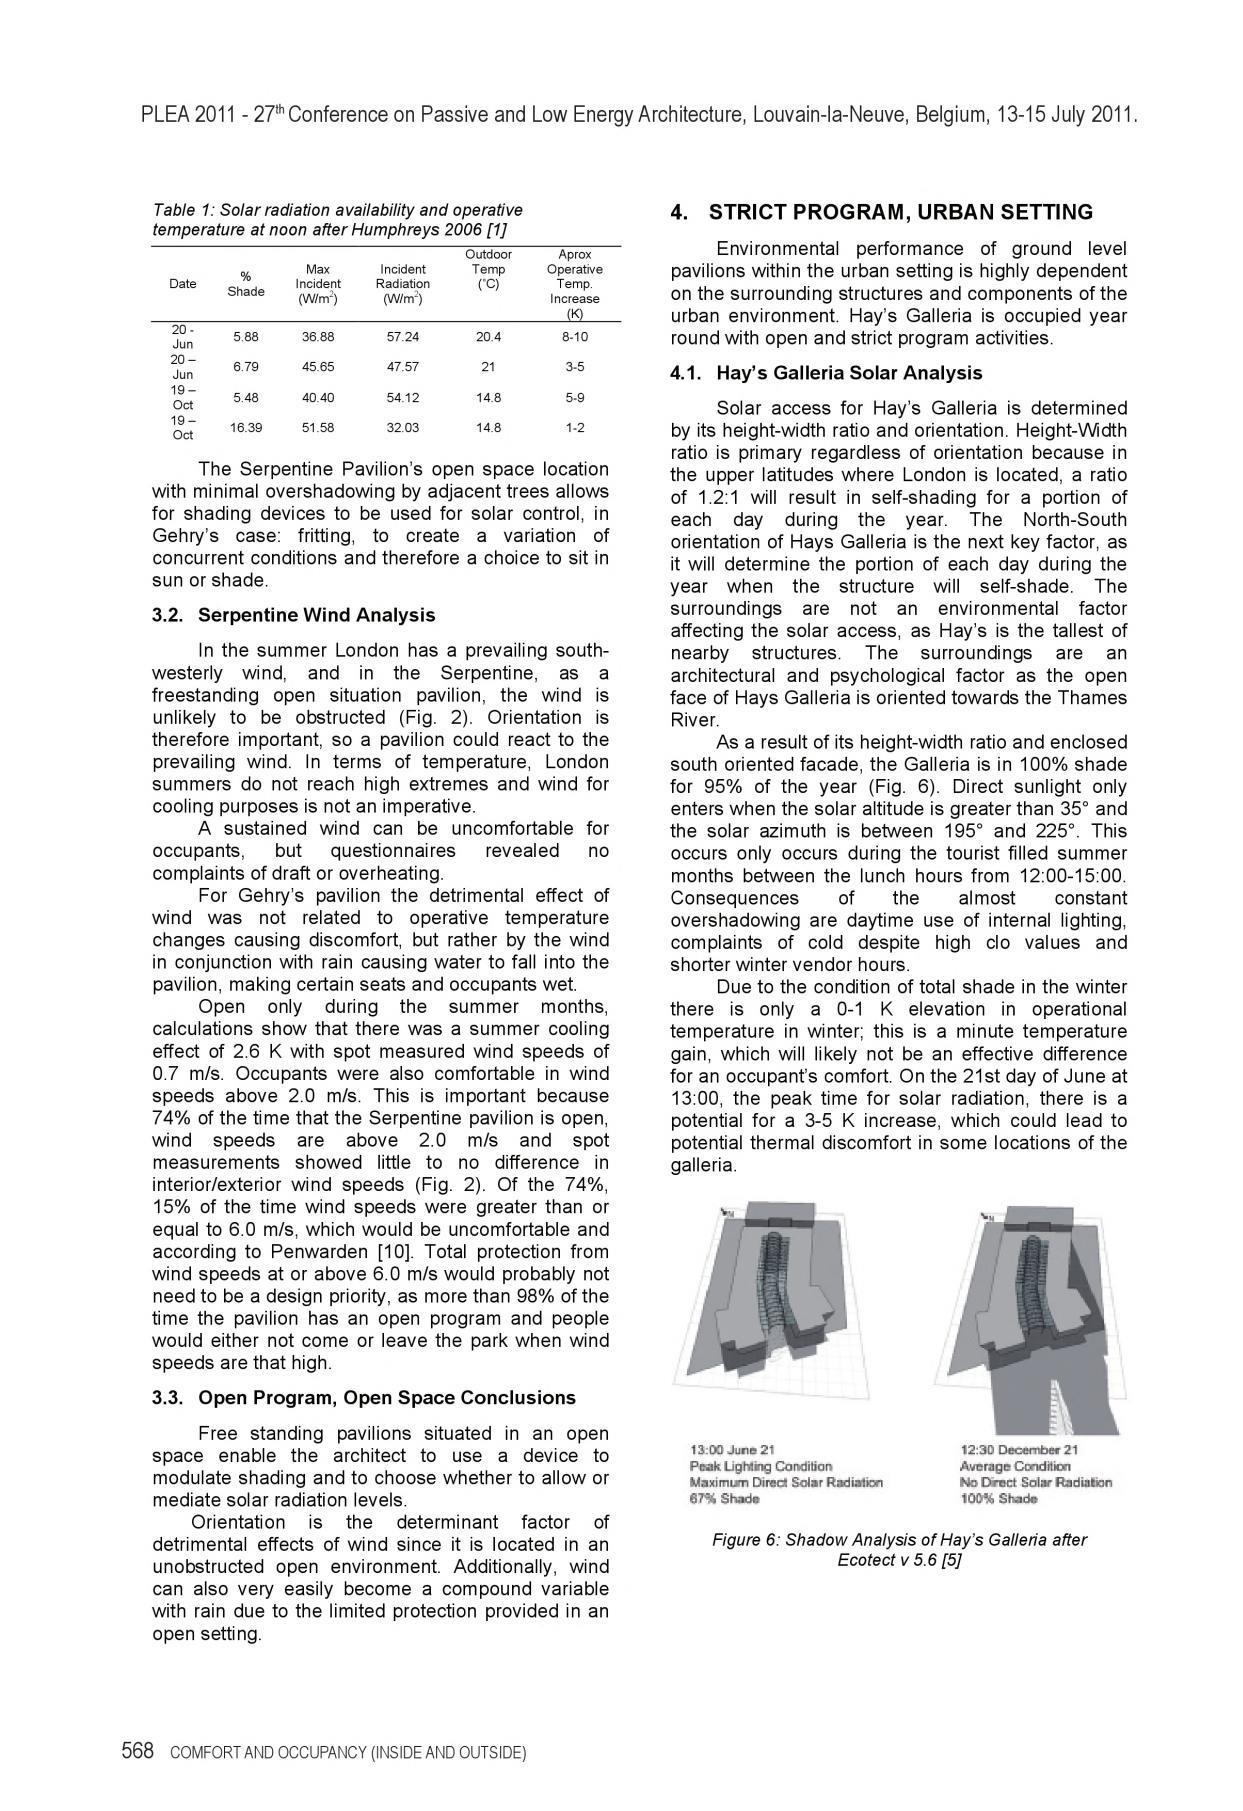
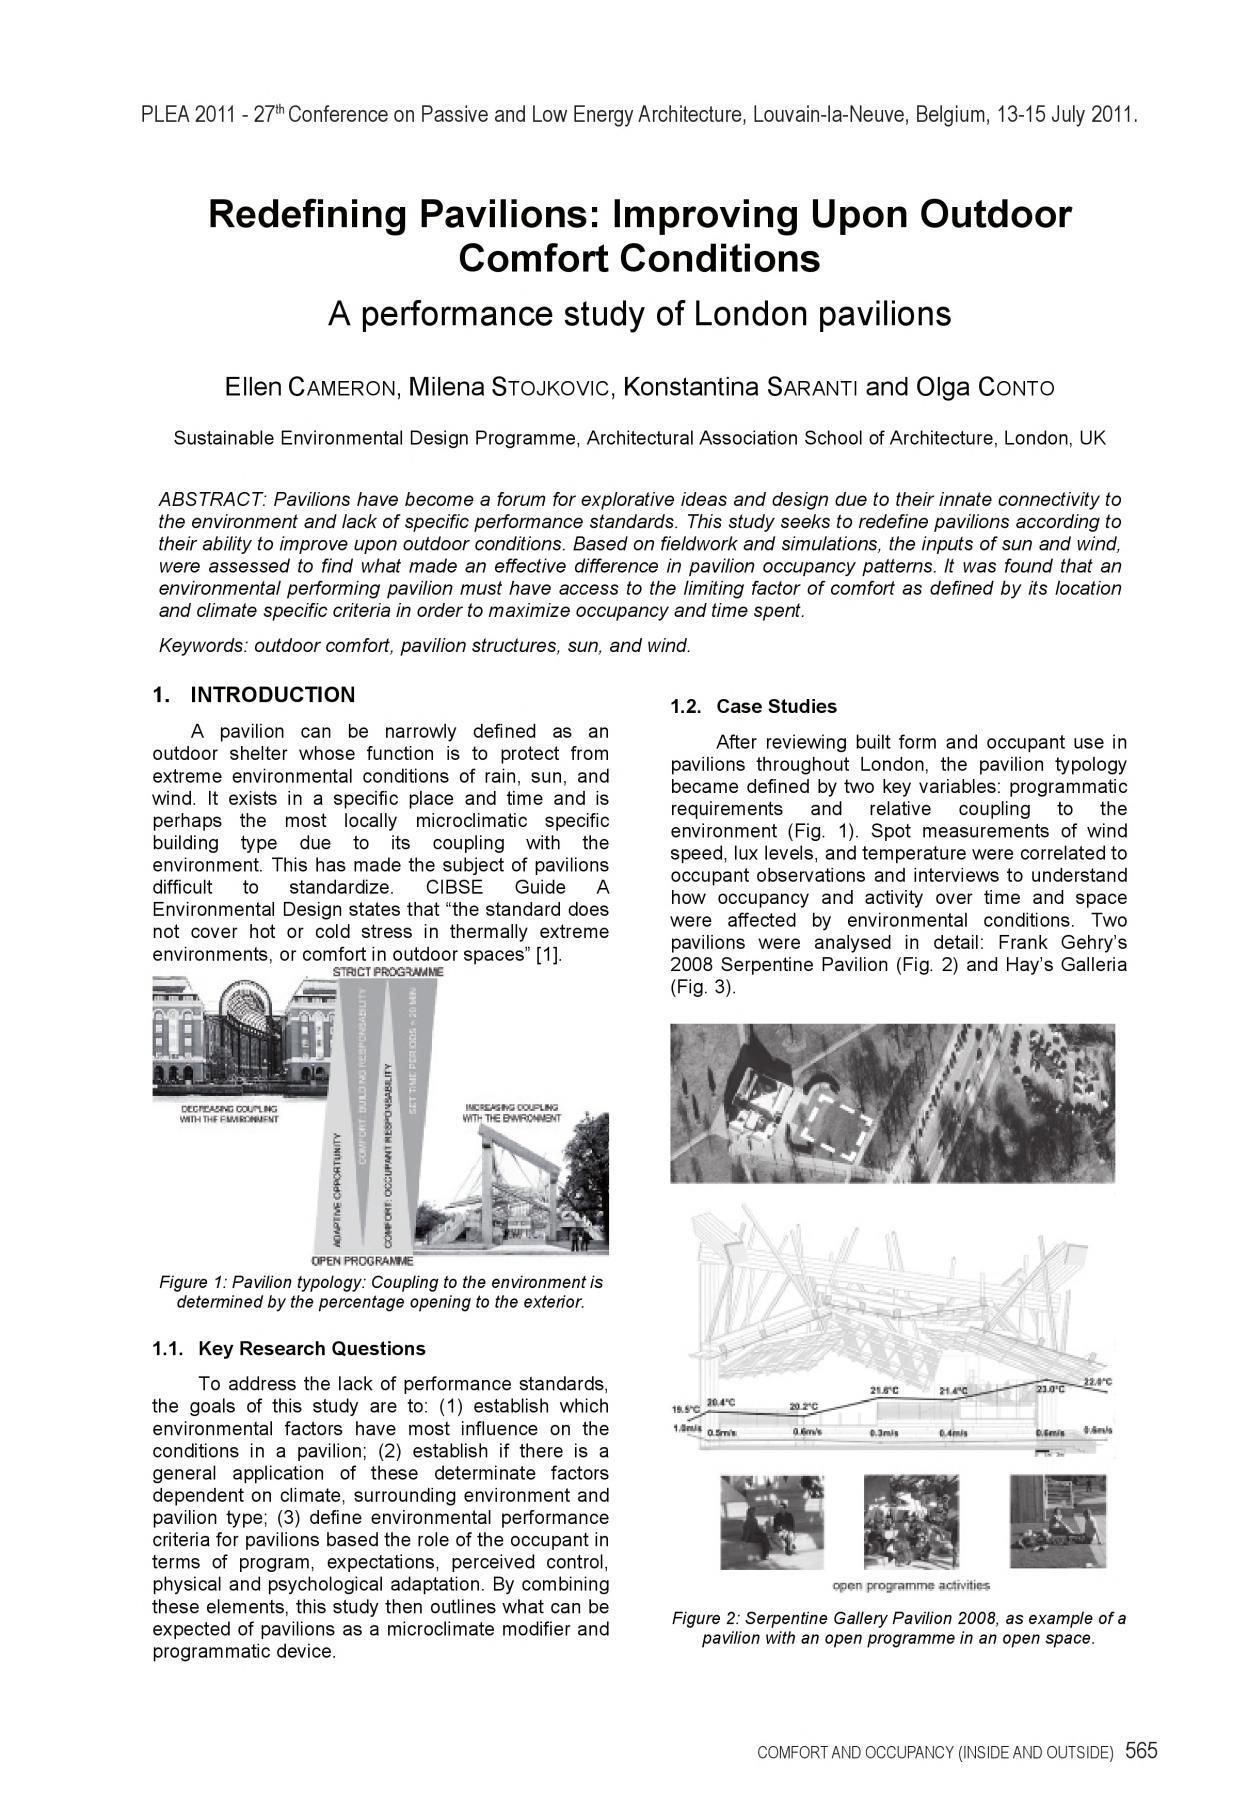
3.1 Research Precedence
At the initial stage of the outdoor studies, examination of the previously done research about the site was conducted. In one such study, the authors had observed a significant drawdown of the roofing structure in the galleria space. They noted:
“ As a result of its height-width ratio and enclosed south oriented façade, the galleria is in 100% shaded for 95% of the year. Direct sunlight only enters when the solar altitude is greater than 35 degrees and the solar azimuth is between 195 and 225 degrees.”
The outcome of this research precedence was considered as a perliminary basis for further examination.
Figure 3.1.1 Extract from previous study on Hay’s Galleria- Redefining pavilions by Yannas, S.. (Source: PLEA 2011)
Introduction - Overview - Outdoor - Indoor - Conclusions - References
18 | AA SED | Msc + MArch | 2022-23
3.2 Solar Analysis
As seen in the research precedence, due to the prevalence of the atrium roof, the site is self-shaded almost all of the time. In order to confirm this, the team did simulations to understand this further.

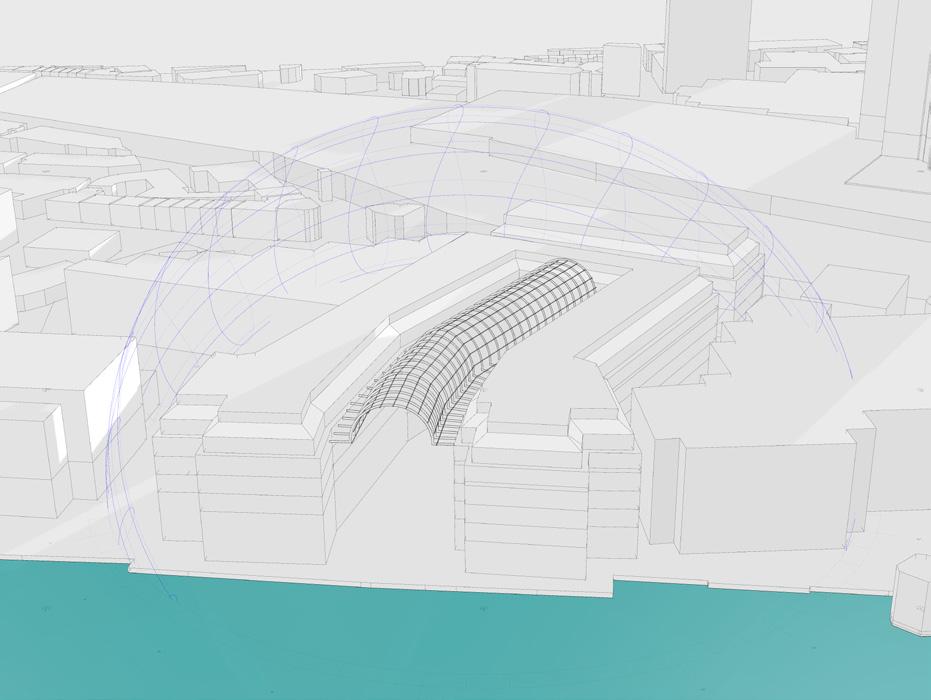
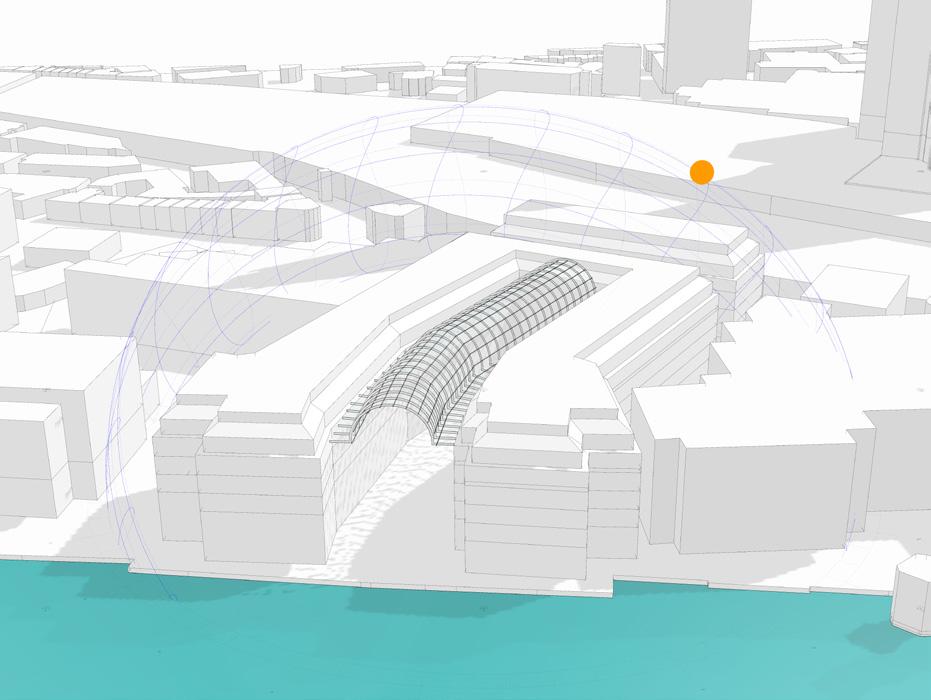
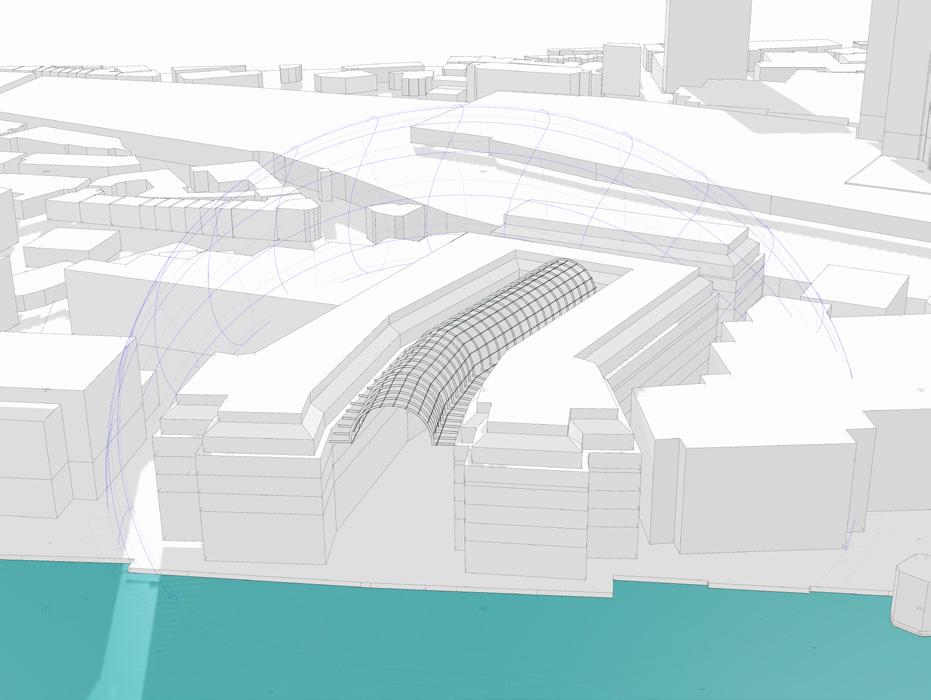
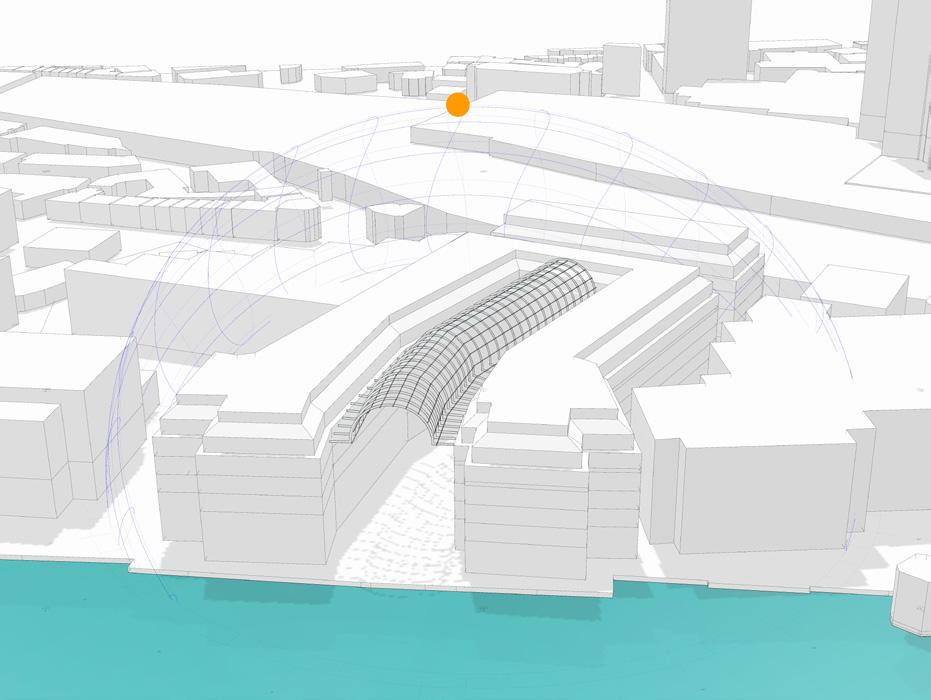
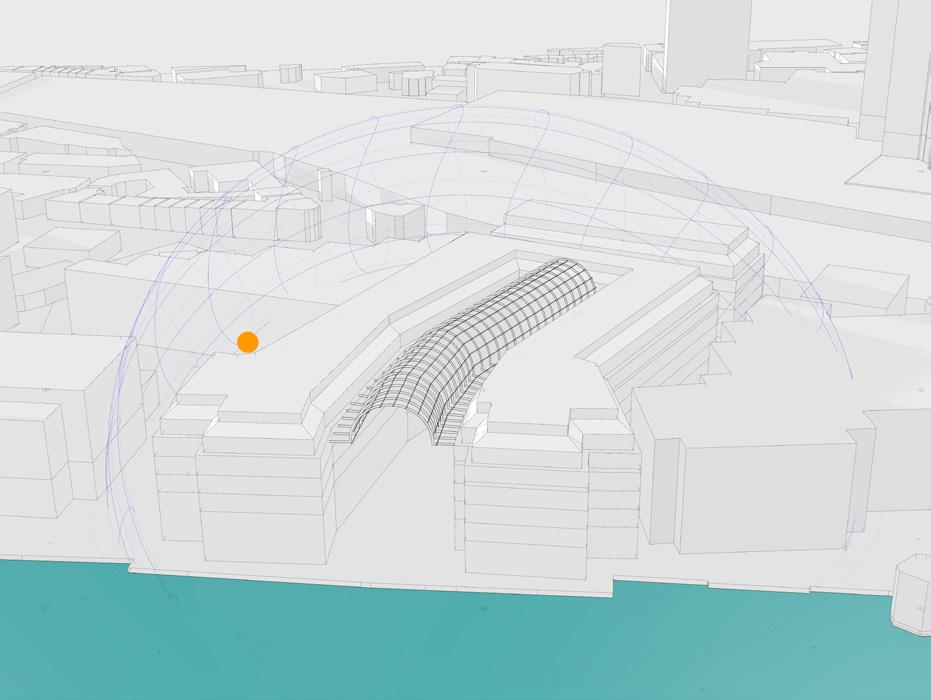
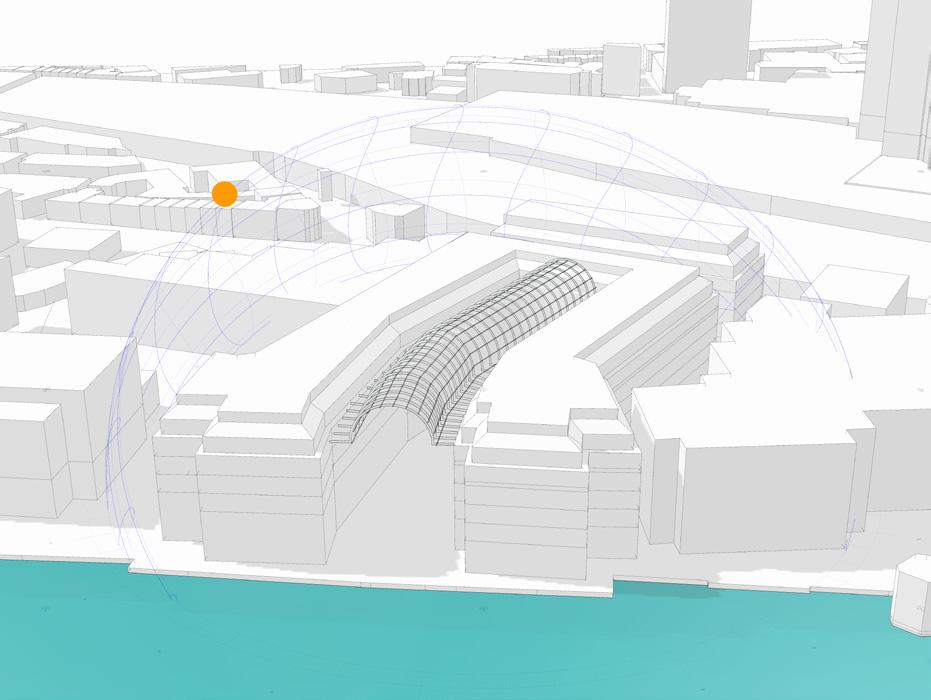
Some of the findings observed were that:
During summer, the galleria at the ground level receives 2-3 hours of sun exposure whereas during winter because of the low angles of the sun and the canyon, the ground level doesn’t receive any direct sun exposure.
Therefore, this study verifies the precedent that the form is such that it self shadows the atrium for most parts of the year.

21st June at 09:00 am
21st June at 12:00 noon
21st June at 3:00 pm
Figure 3.2.1 Shadow and sun exposure analysis for summer period.

21st December at 09:00 am
21st December at 12:00 noon
21st December at 3:00 pm
Figure 3.2.1 Shadow and sun exposure analysis for winter period.
Introduction - Overview - Outdoor - Indoor - Conclusions - References
office at Hay’s galleria
Hilson Moran
0.0 1.0 2.0 3.0 4.0 5.0 6.0 7.0 8.0 9.0 10.0 Unit: hrs
3.3 Experience Matrix
In order to gauge the environmental effects of the site, multiple site visits were conducted.
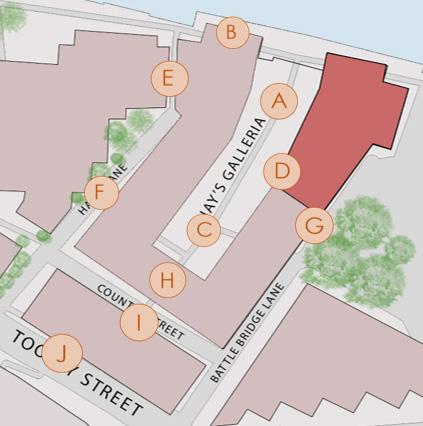
Initially, the team consisting of 4 members, split up to conduct subjective analysis at various locations while tranversing through the site in terms of visual experience such as comfort, Daylight and Windflow.
The results of the excercise was combined to form a experience matrix.
Figure 3.3.1 Field visit: Exprience Matrix
Figure 3.3.2 Key plan
Figure 3.3.3 Legend for the matrix
Introduction - Overview - Outdoor - Indoor - Conclusions - References
20 | AA SED | Msc + MArch | 2022-23
Hay’s
Street
Artifical Lighting ON Artifical Lighting ON C.
Artifical Lighting ON Comfort Daylight Wind Flow A B C D E F G H I J Location Parameter Comfort Cold Hot Daylight Wind Flow Min. Max. Slow Fast
F. Outdoor Space G. Battle Bridge Lane H. Entrance Passage I. Counter Street J. Tooley Street
Galleria London Station
Street Street Street A. Riverside Seating B. Walkway along River
Central Atrium D. Side Walkway
3.4 Spot Measurements
Spot measurements were carried out to measure the amount of daylighting and temperature. It was observed that there was no major difference in temperatures while traversing through the site. However, there was a drop in measured temperature closer to the river in comparision to Tooley and Counter street by around 1.5 °C.
In terms of the illuminance levels, it was observed to be higher near the river and Tooley street when compared to the the Galleria space, reducing by half to one-third. This was hypothised to be due to the prevalence of the roof which causes the interior portions to be shaded throught the majority of the year.
Therefore, it can be observed that a deep canyon effect results in poor daylighting conditions in the galleria space. Moreover, similar poor conditions can be detected due to the presence of high width to height ratio at Counter street.
Generally, the measurements of both lux as well as temperature readings were fairly constant in the internal galleria space with variance being not more than 5-10%.
Spot measurement observed on site were found to be similar to the subjective experience noted in the experience matrix.
6695 11540 4965 1990 3640 3175 11520 8175 9200 Lux
21.6
21.4
21.2
21.0
20.8
20.6
20.4
21.8 Dry Bulb Temperature in ⁰ C
20.2
20.0
Figure 3.4.1 Field visit: Spot measurments on site
Introduction - Overview - Outdoor - Indoor - Conclusions - References
Hilson Moran office at Hay’s galleria
3.5 Radiation Analysis
Radiation Analysis was simulated to investigate and understand the solar gains in galleria space and on the building facades. Maximum amount of radiation on the site seems to be on the roof with half as much of it falling on the south-eastern and north-western. There is virtually no radiation in the galleria area. Furthermore, the radiation analysis confirms the presupposition that during the seasonal shifts, winter is far lower than summers.
Figure 3.5.1 and 3.5.2 shows the simulation of annual radiation with roof and without the roof respectively. It can be noted that there is not a major impact of roof on the values of radiation on facade, due to the low angles of sun.
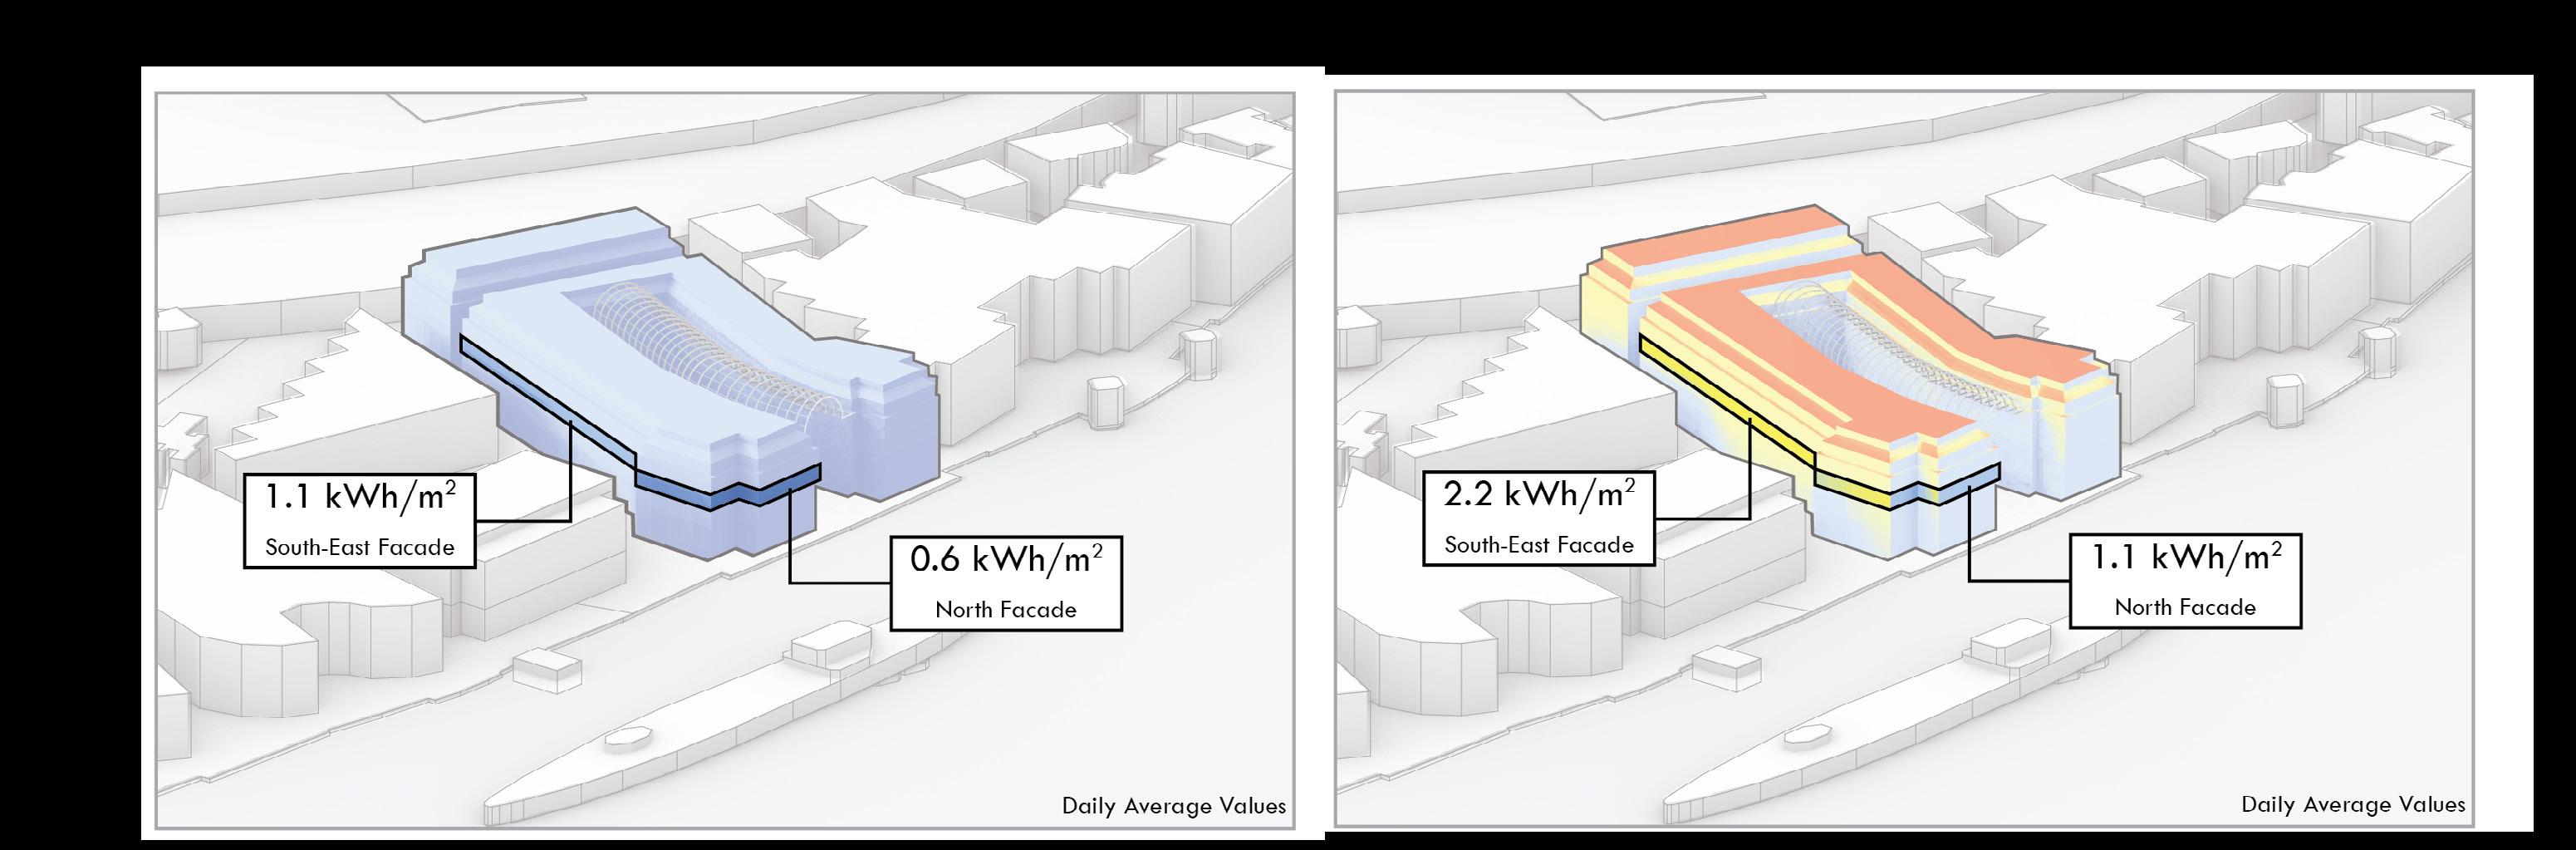
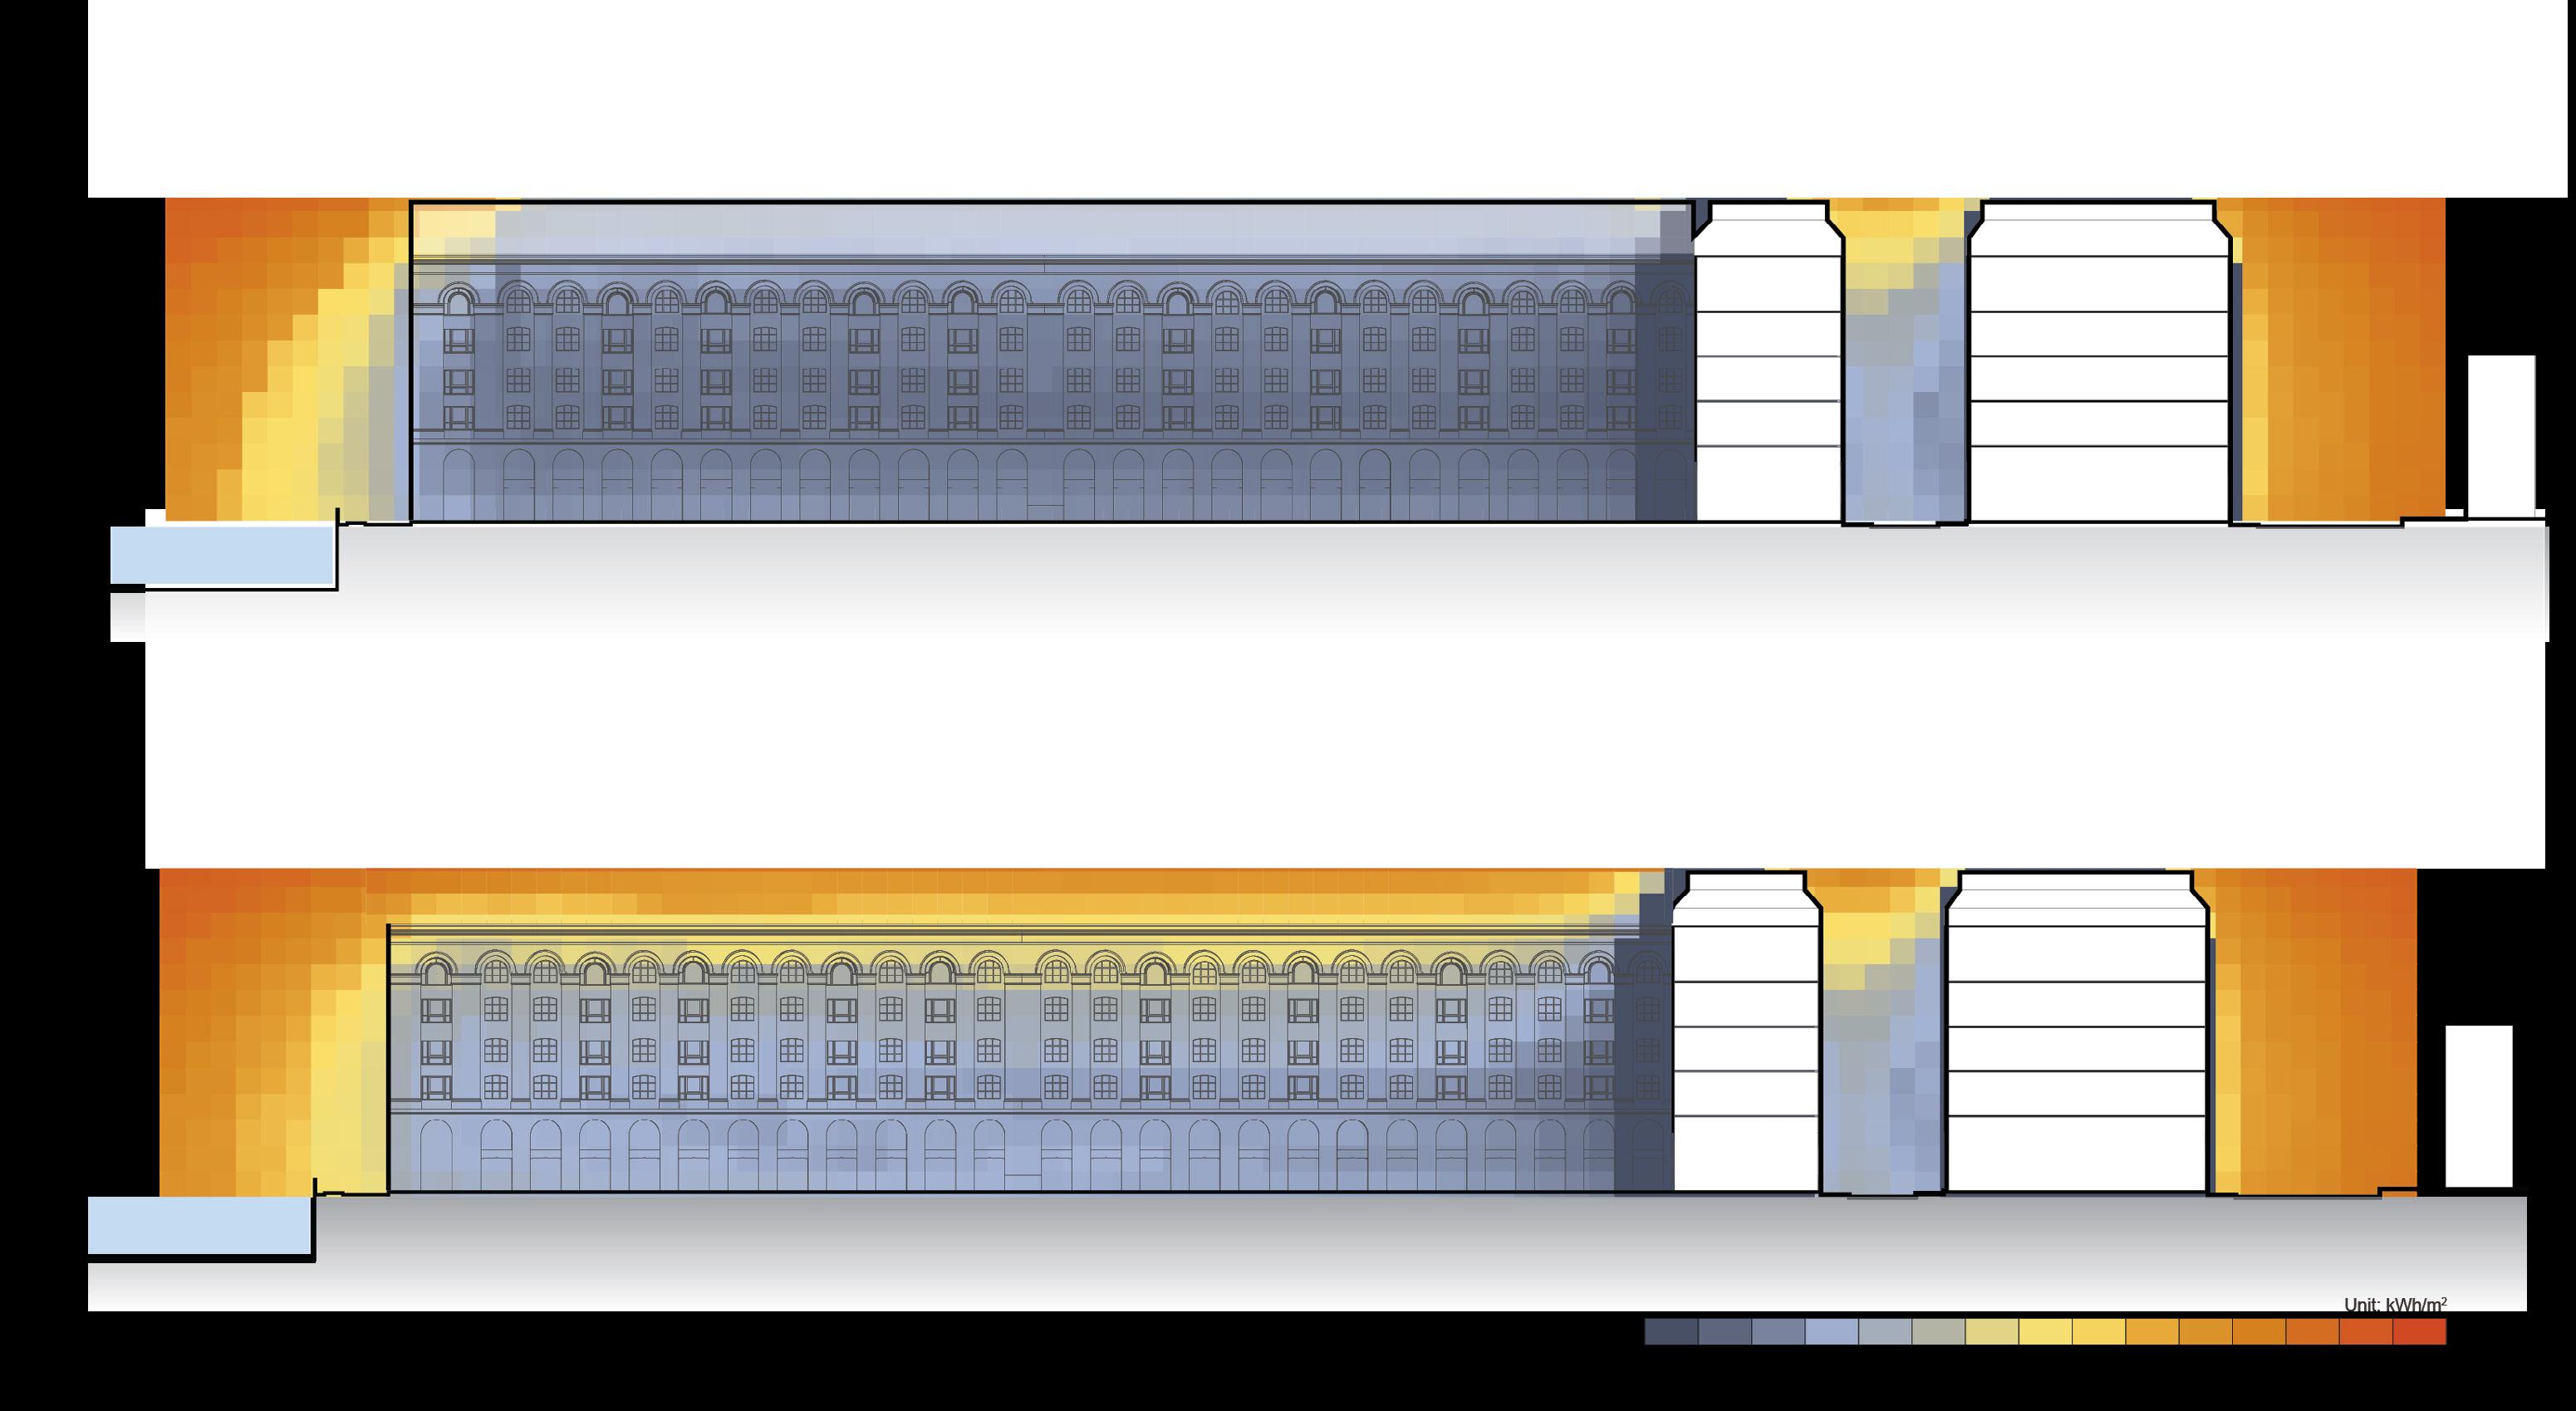
The Hilson Moran office, receives radiation from the northern and south-eastern sides. The side facing the galleria receives minimal amounts of radiation. Through computational simulations, it can be observed that the most amount of radiation enters the office through the south-eastern side. The Northern side receives half as much on the south-eastern side annually as represented in Figure 3.5.3 and 3.5.4.
*The methodology to calculate radiation with glass roof has been shown in appendix.
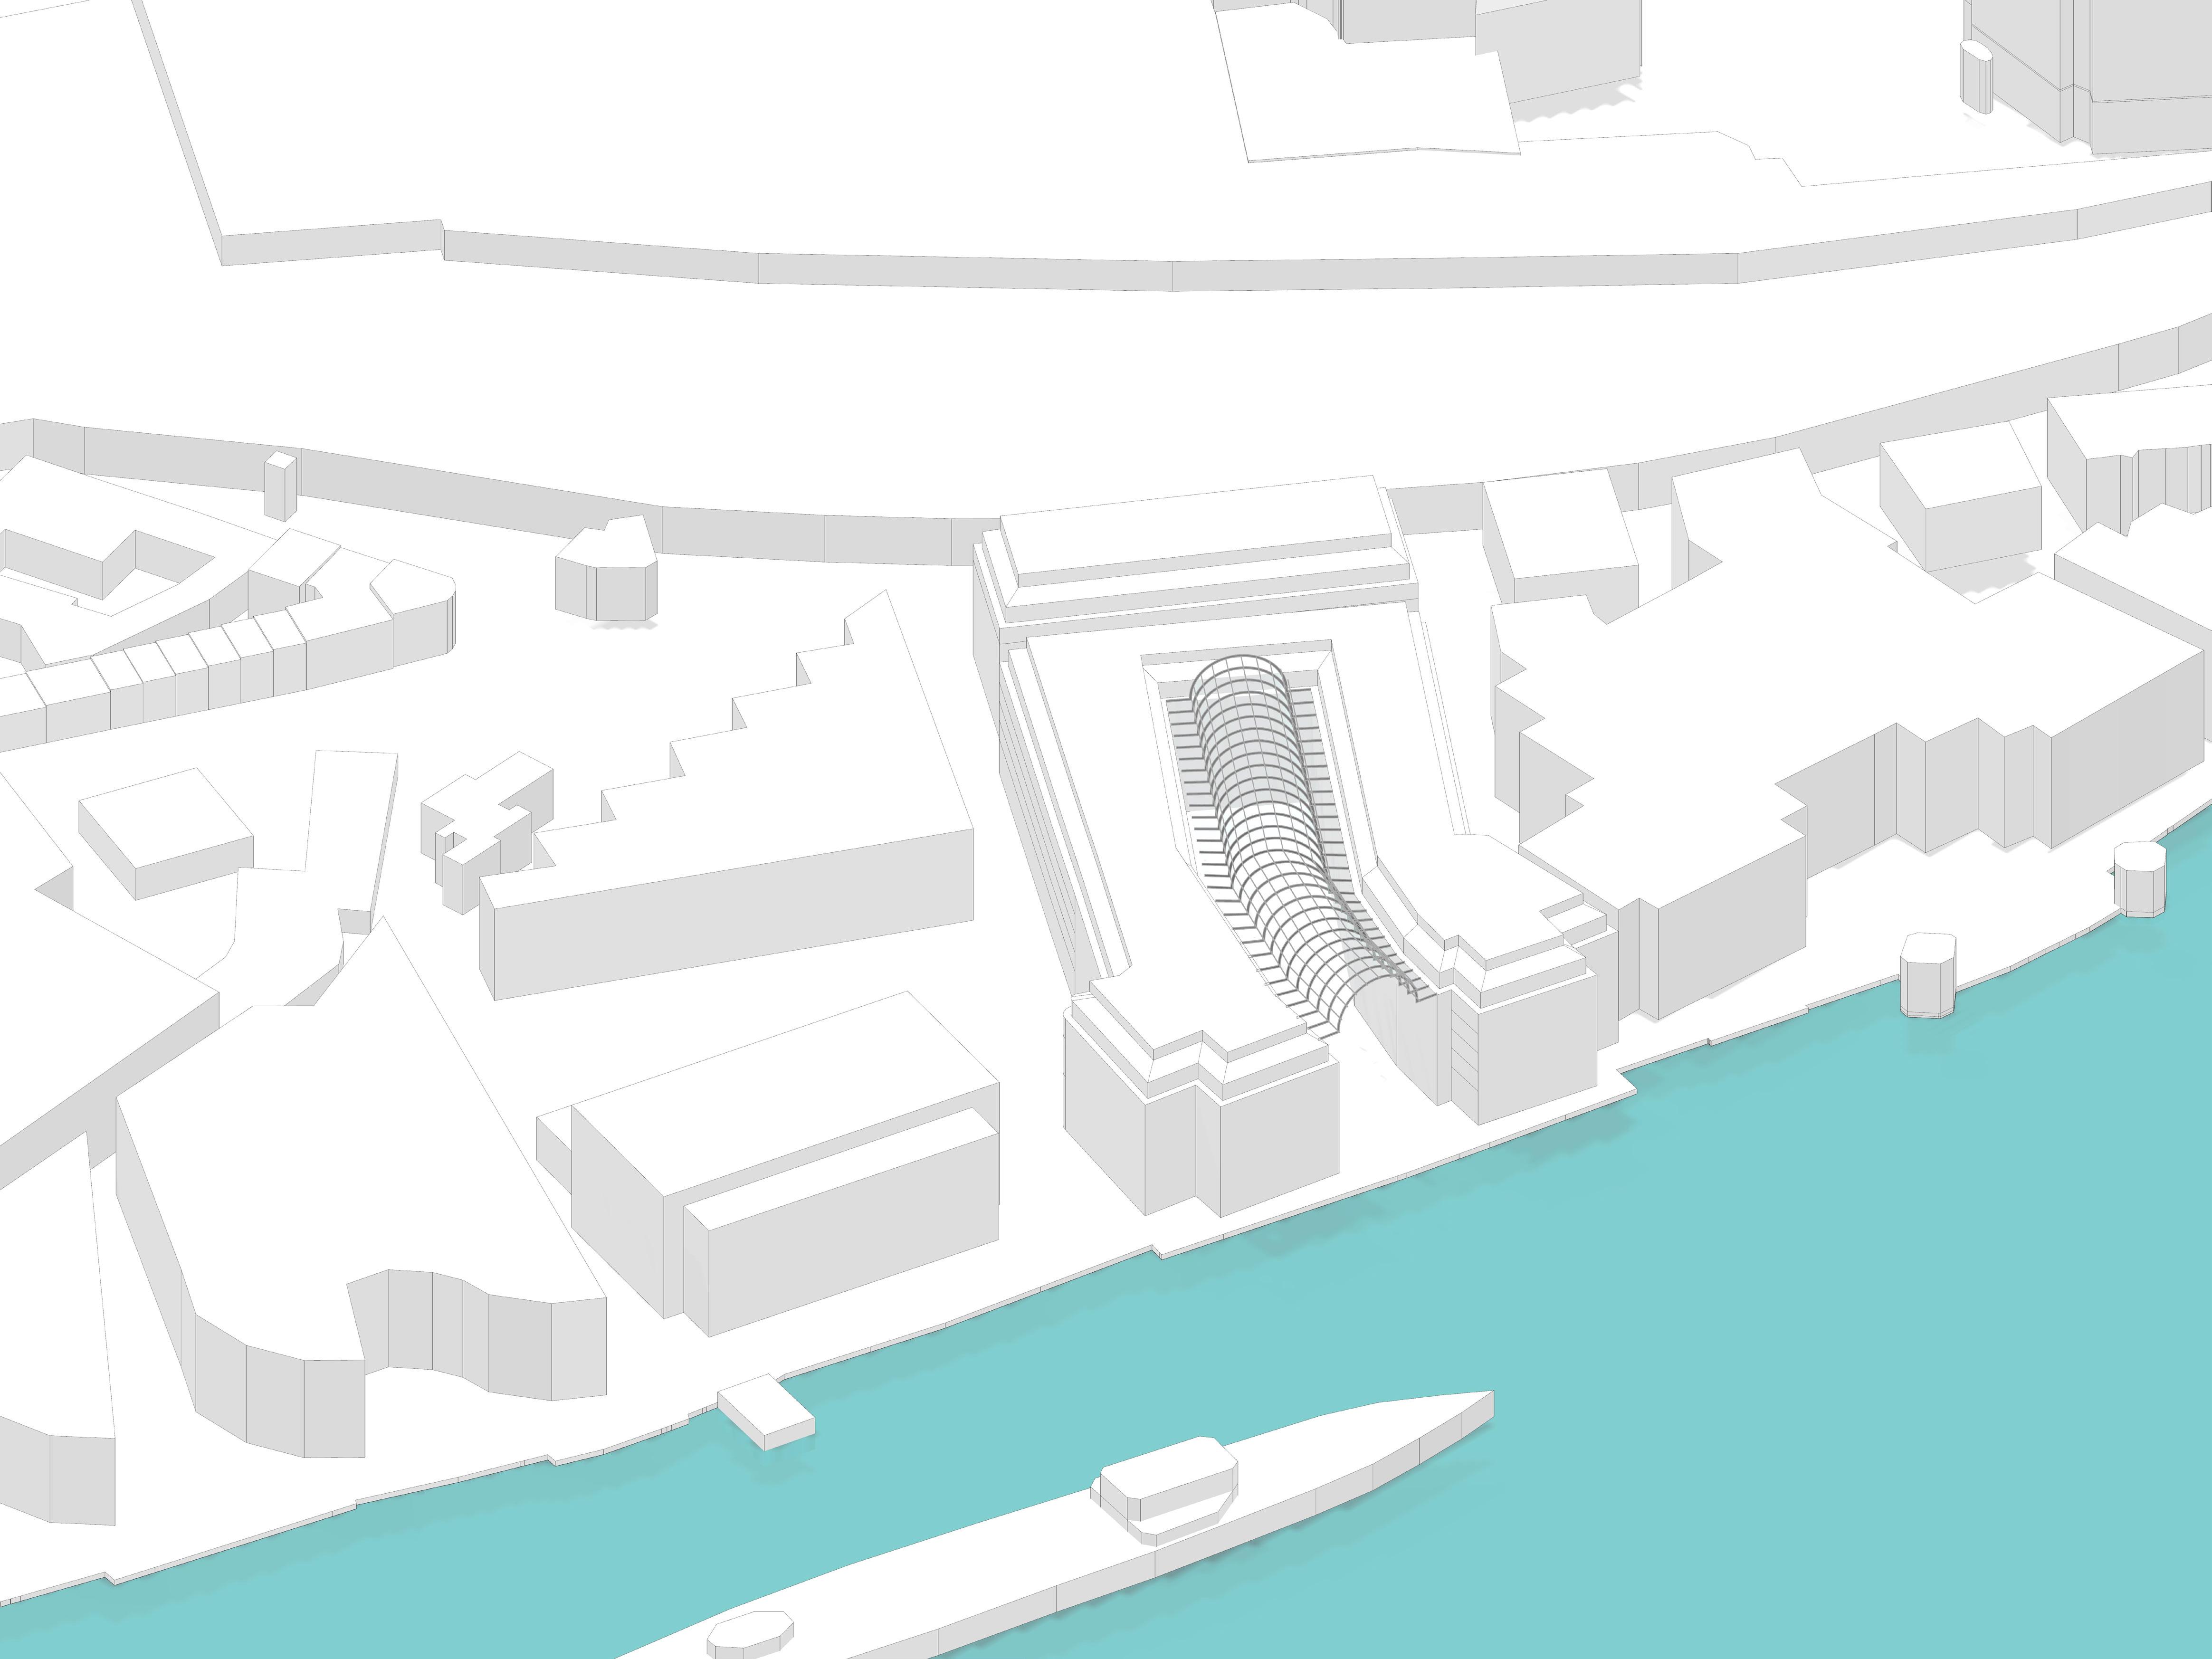
Figure 3.5.1 Annual solar radiation on N-W facade - with roof* (Base case) Source: Ladybug
Figure 3.5.2 Annual solar radiation on N-W facade - without roof (Source: Ladybug)

Figure 3.5.4 Solar radiation for summer period (Source: Ladybug) Introduction - Overview - Outdoor - Indoor - Conclusions - References
Figure 3.5.3 Solar radiation for winter period (Source: Ladybug)
22 | AA SED | Msc + MArch | 2022-23
3.6 UTCI Study
According to previous simulations, it was found out that the roof of the galleria is not impacting the radiation on inner façade. However, in order to check the impact on thermal comfort a further study of UTCI (Universal Thermal Comfort Index) was performed using Ladybug tool. The months of March, June, September and December at 12:00 noon were considered for simulations.
For UTCI, wind speeds were simulated using CFD, while considering prevailing wind from S-W for March, June and September and N-E for December as show earlier in (Fig. 2.1.1).
Furthermore, the UTCI was calculated considering radiation on the galleria space with and without the presence of roof.
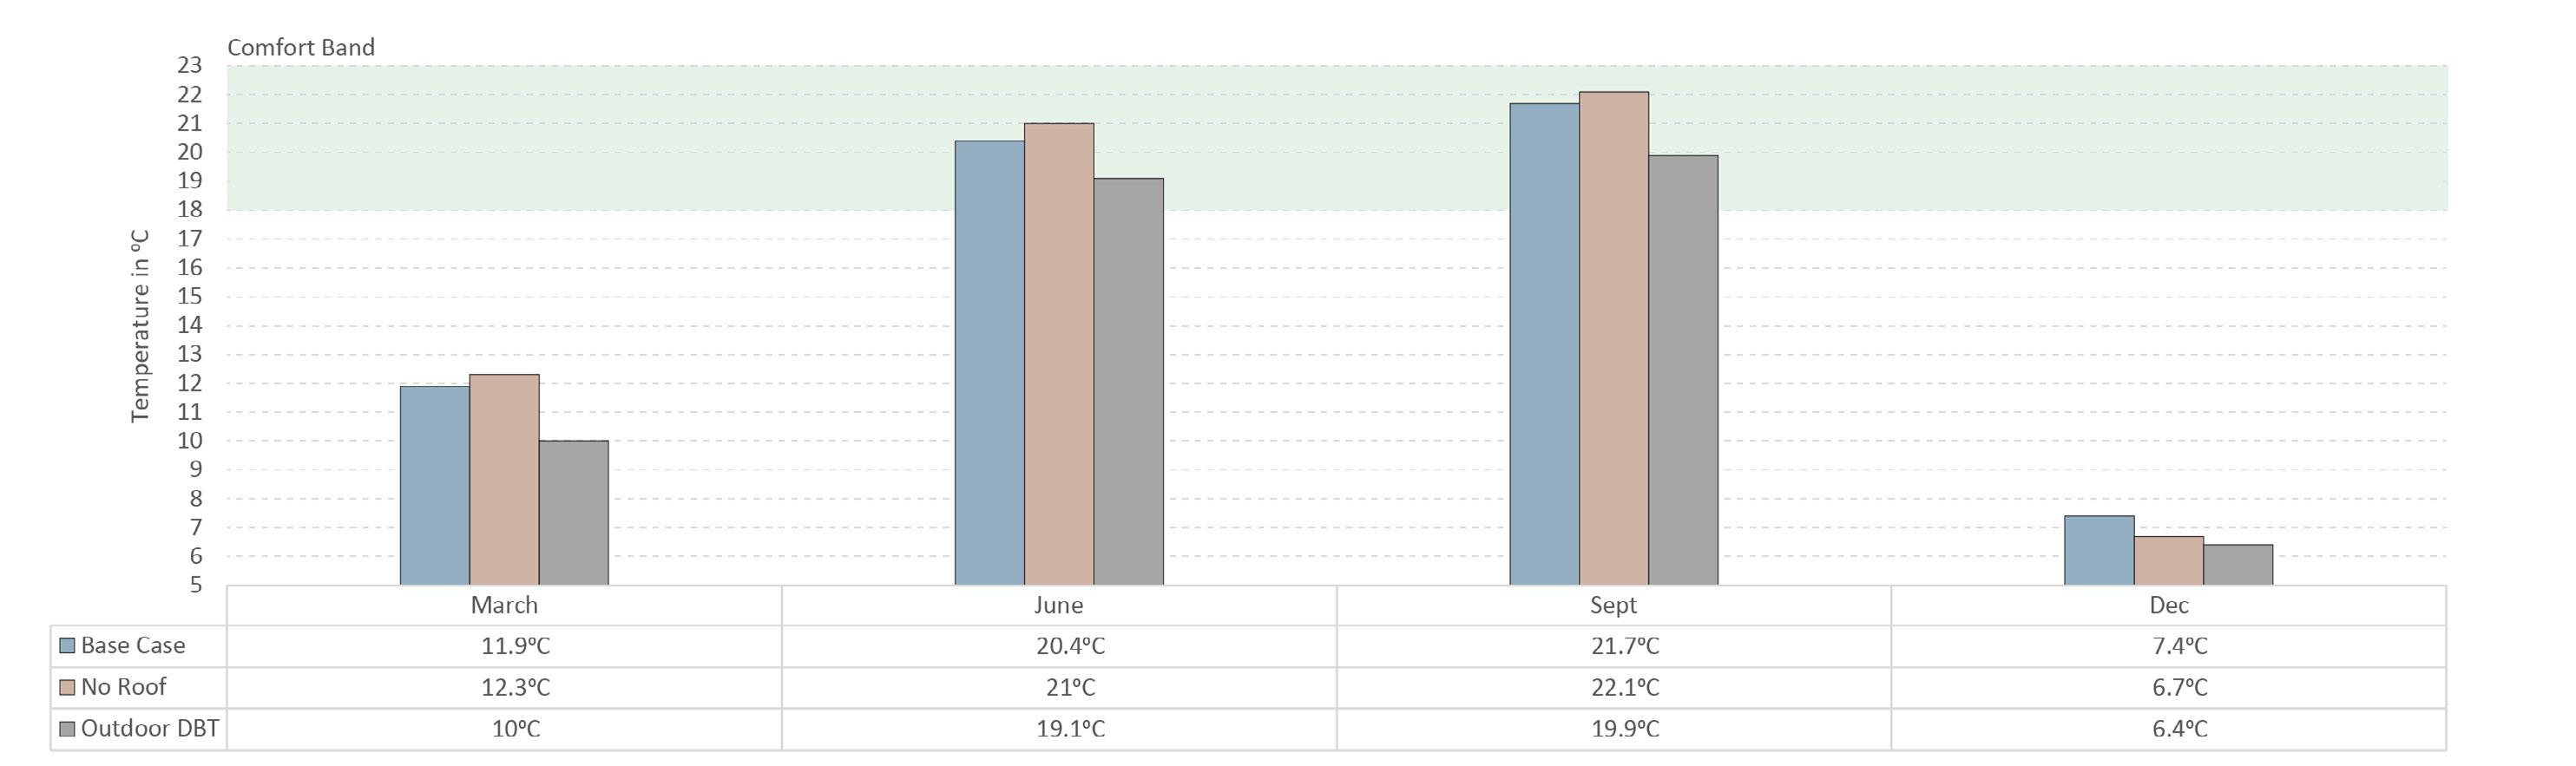
However, comparing the results across 4 months, it shows that there is no major impact of roof in creating a microclimate for the galleria space (Fig. 3.6.1). It was observed that there is a minor temperature difference of 0.50.8°C, without the roof in the galleria space.
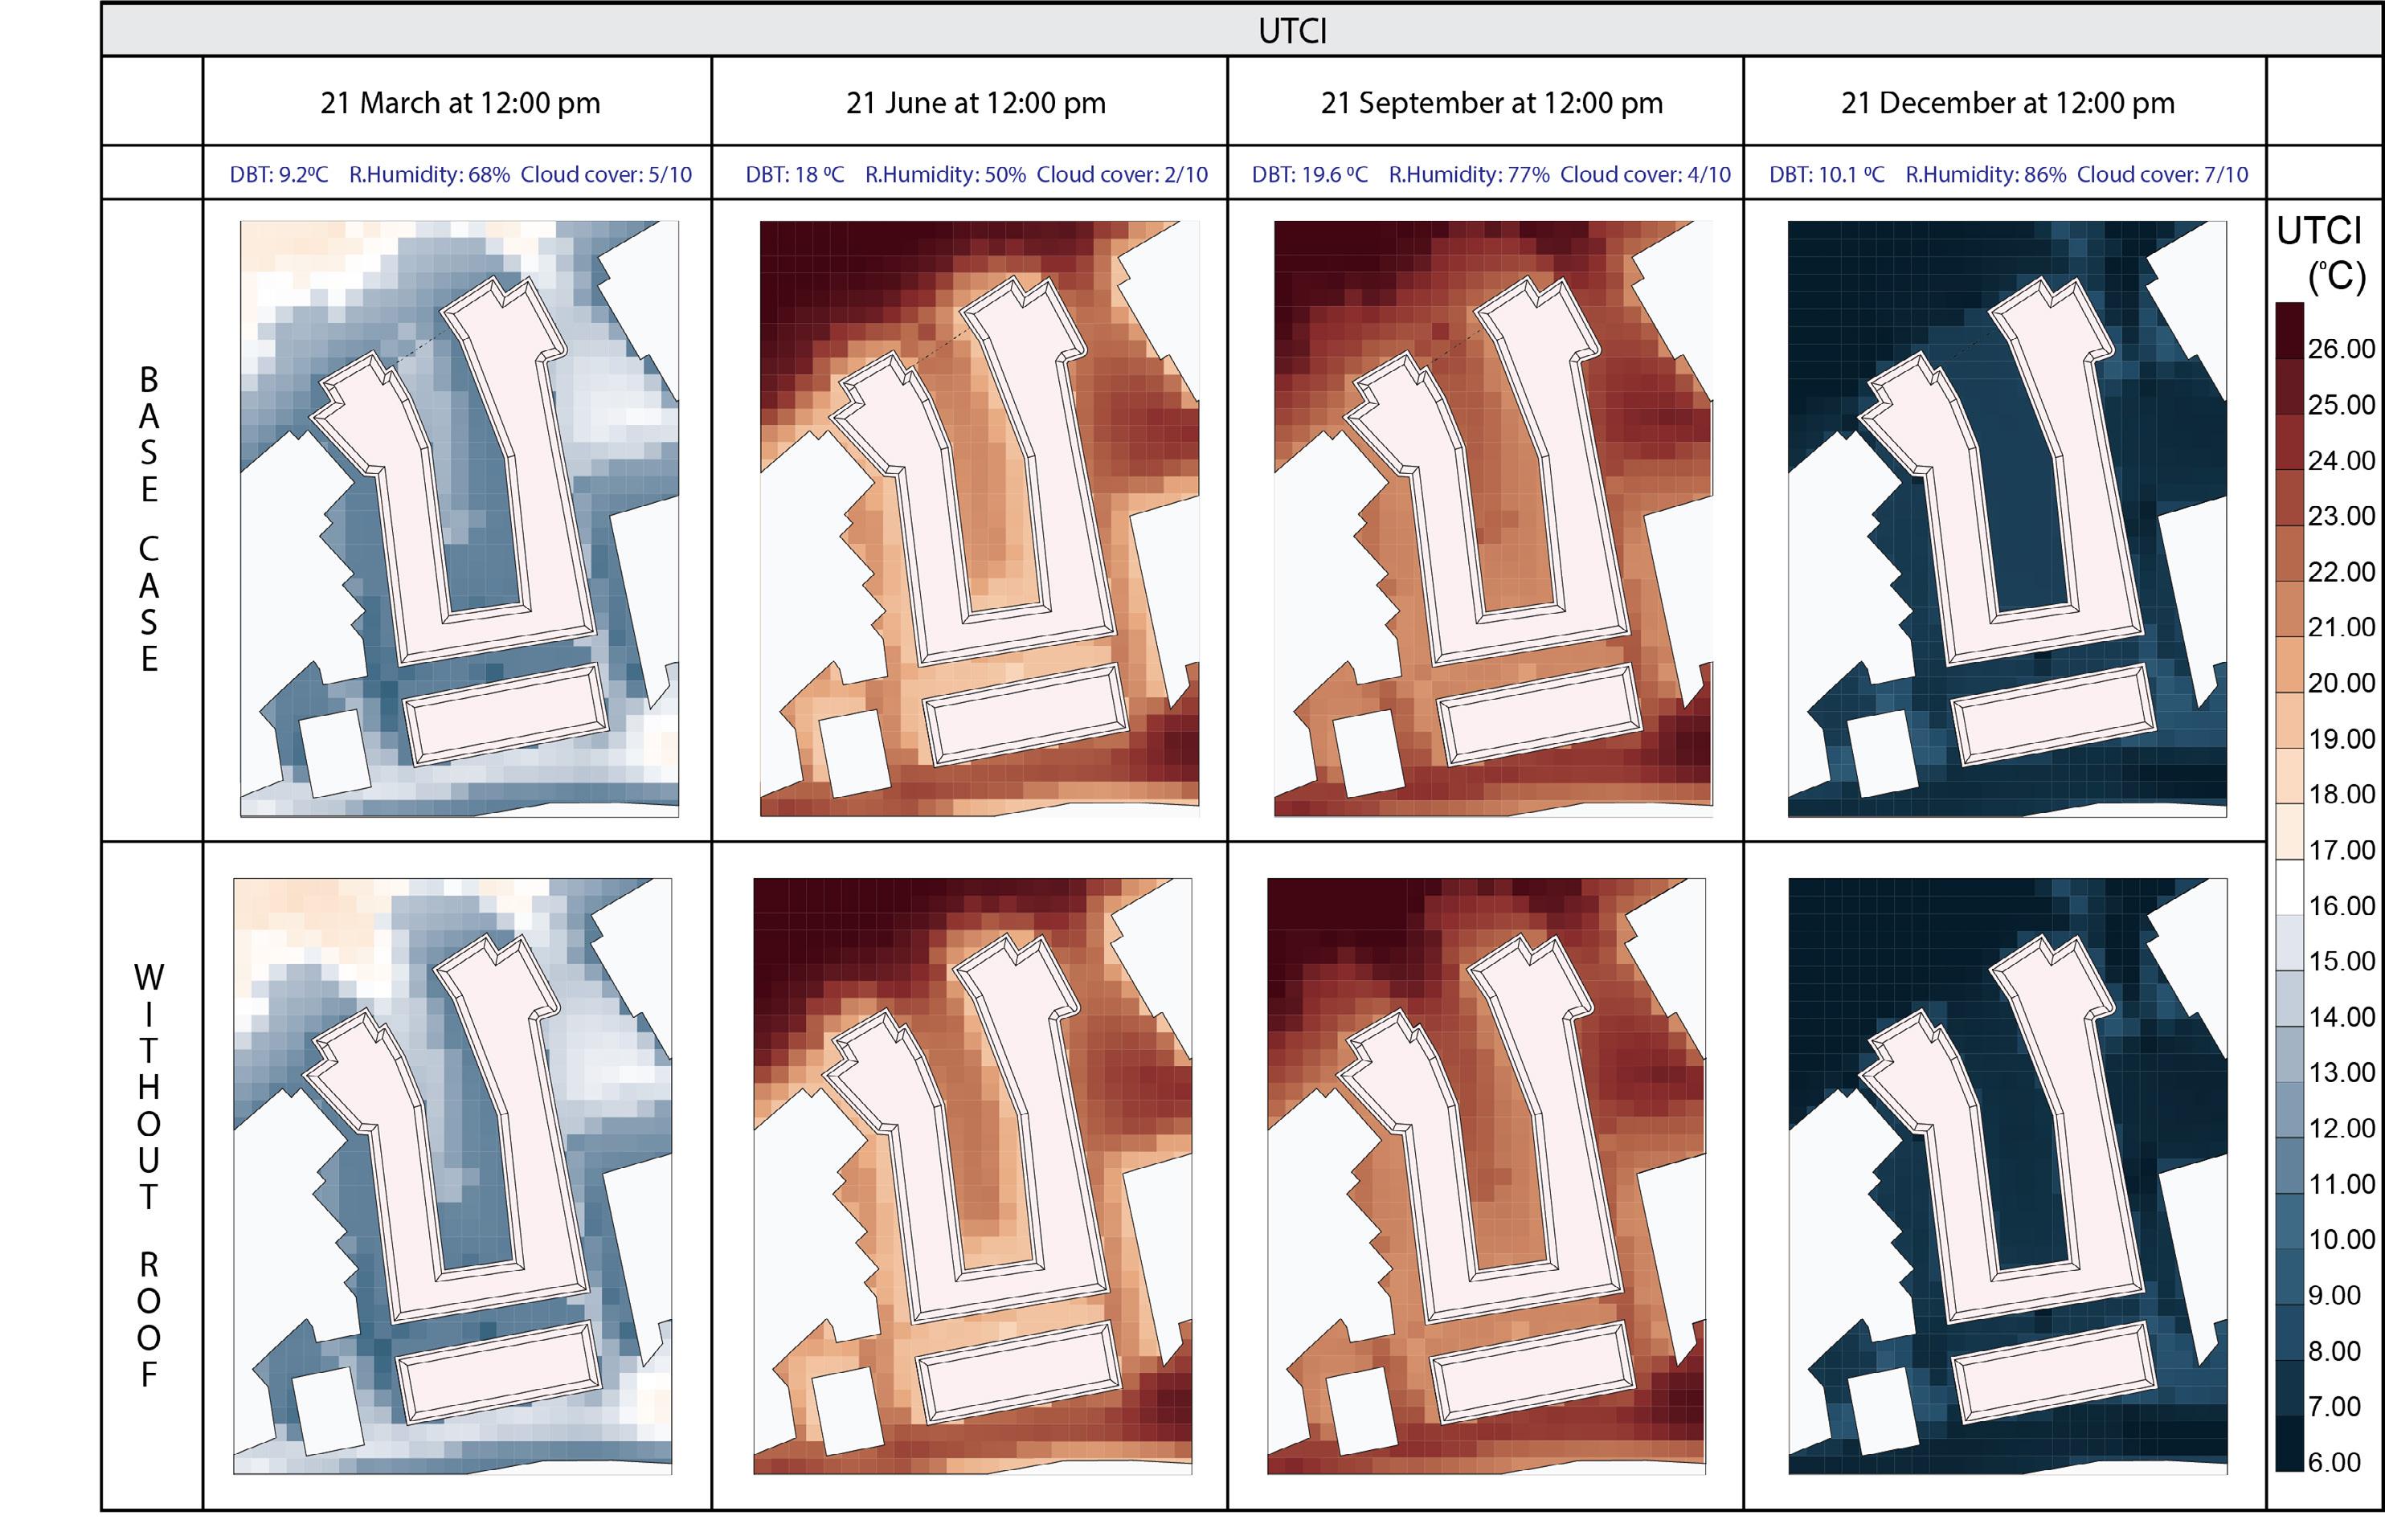
Figure 3.6.1 UTCI study for Hay’s galleria : with and without the roof
Figure 3.6.2 Graph showing comparision of Average UTCI Temperature
Introduction - Overview - Outdoor - Indoor - Conclusions - References
galleria | 23
Hilson
Moran office at Hay’s
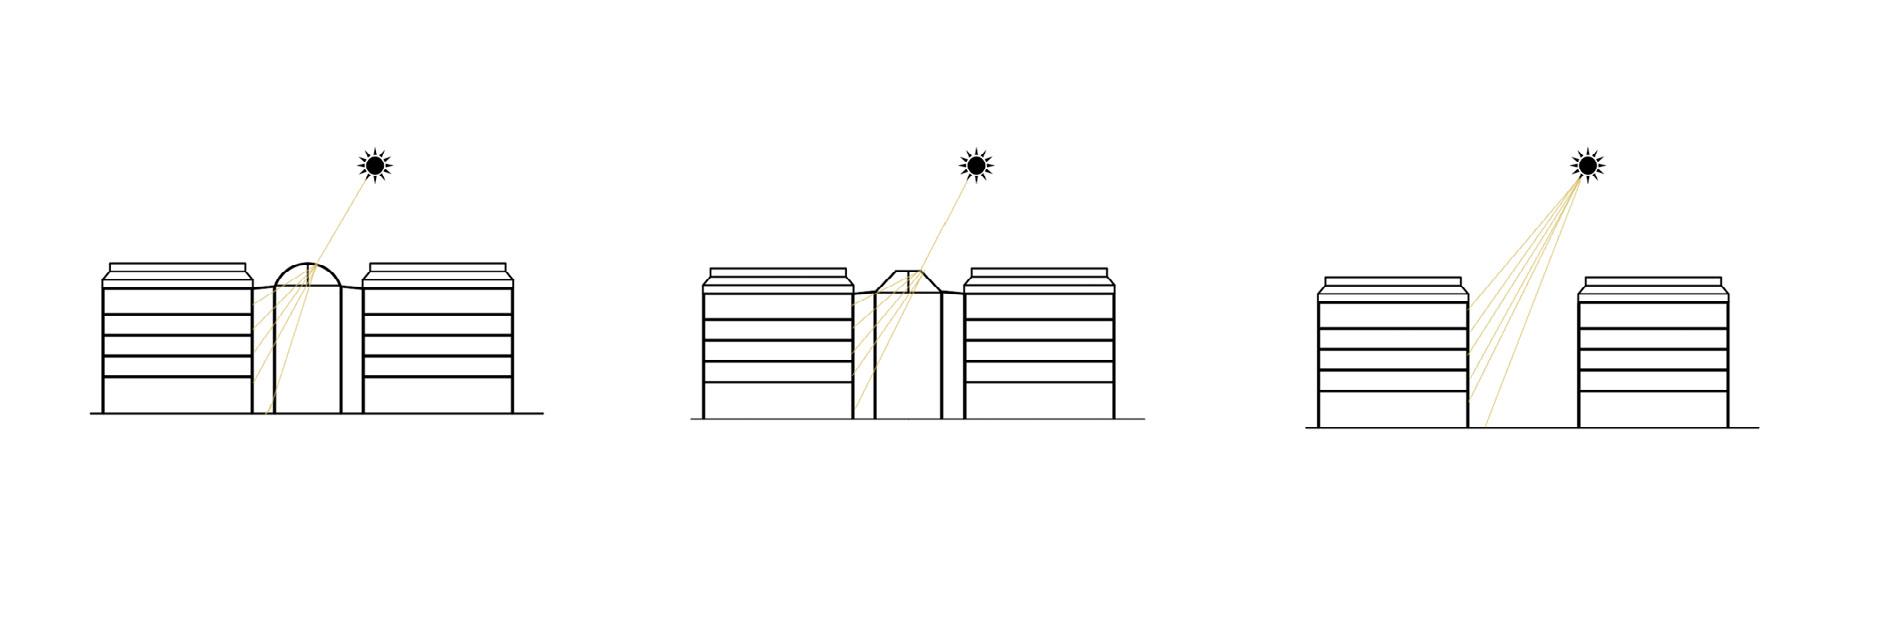
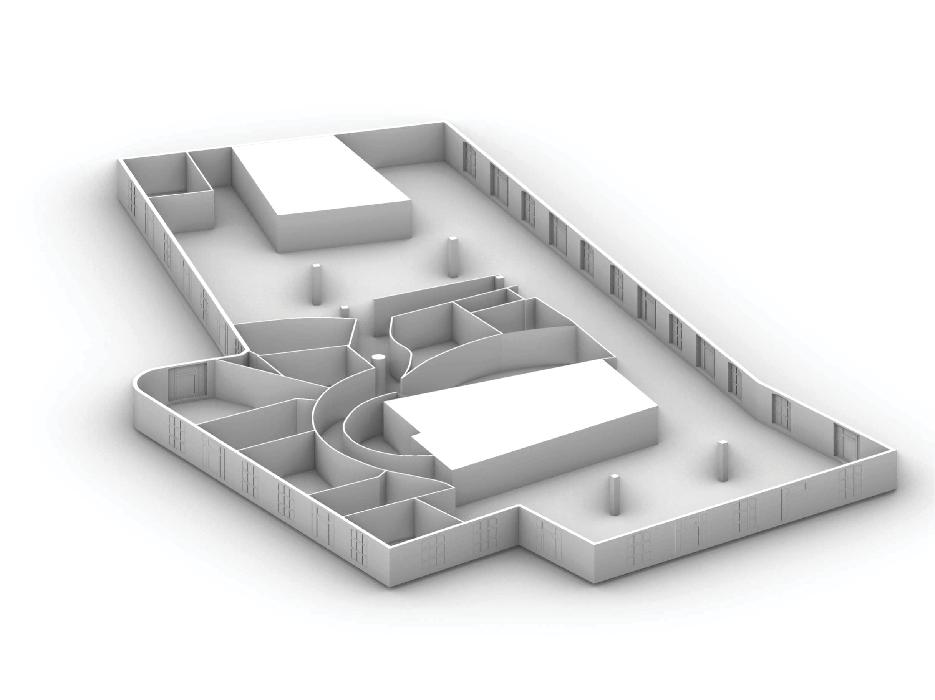
3.7 Roof Iterations for Indoor Daylight
After the UTCI study, the outdoor study was taken forward by testing the effects of glass roof on daylight in the internal space. The base case roof iteration was tested for the useful daylight illuminance (UDI) levels and it was found that more than 50% of UDI with threshold between 300 and 3000 lux is only achieved till about 4m of depth. Along with the base case curved roof iteration, two other iterations were tested out.
The first iteration being a flat roof with 45⁰ slope which portrayed similar results to the base case. The second iteration tested was for the daylight quality in the space without the roof being present which showed the target ed UDI to penetrate till the whole of 6m office depth. This experimentation helped us conclude that the space would receive better daylight quality in the absence of the roof.
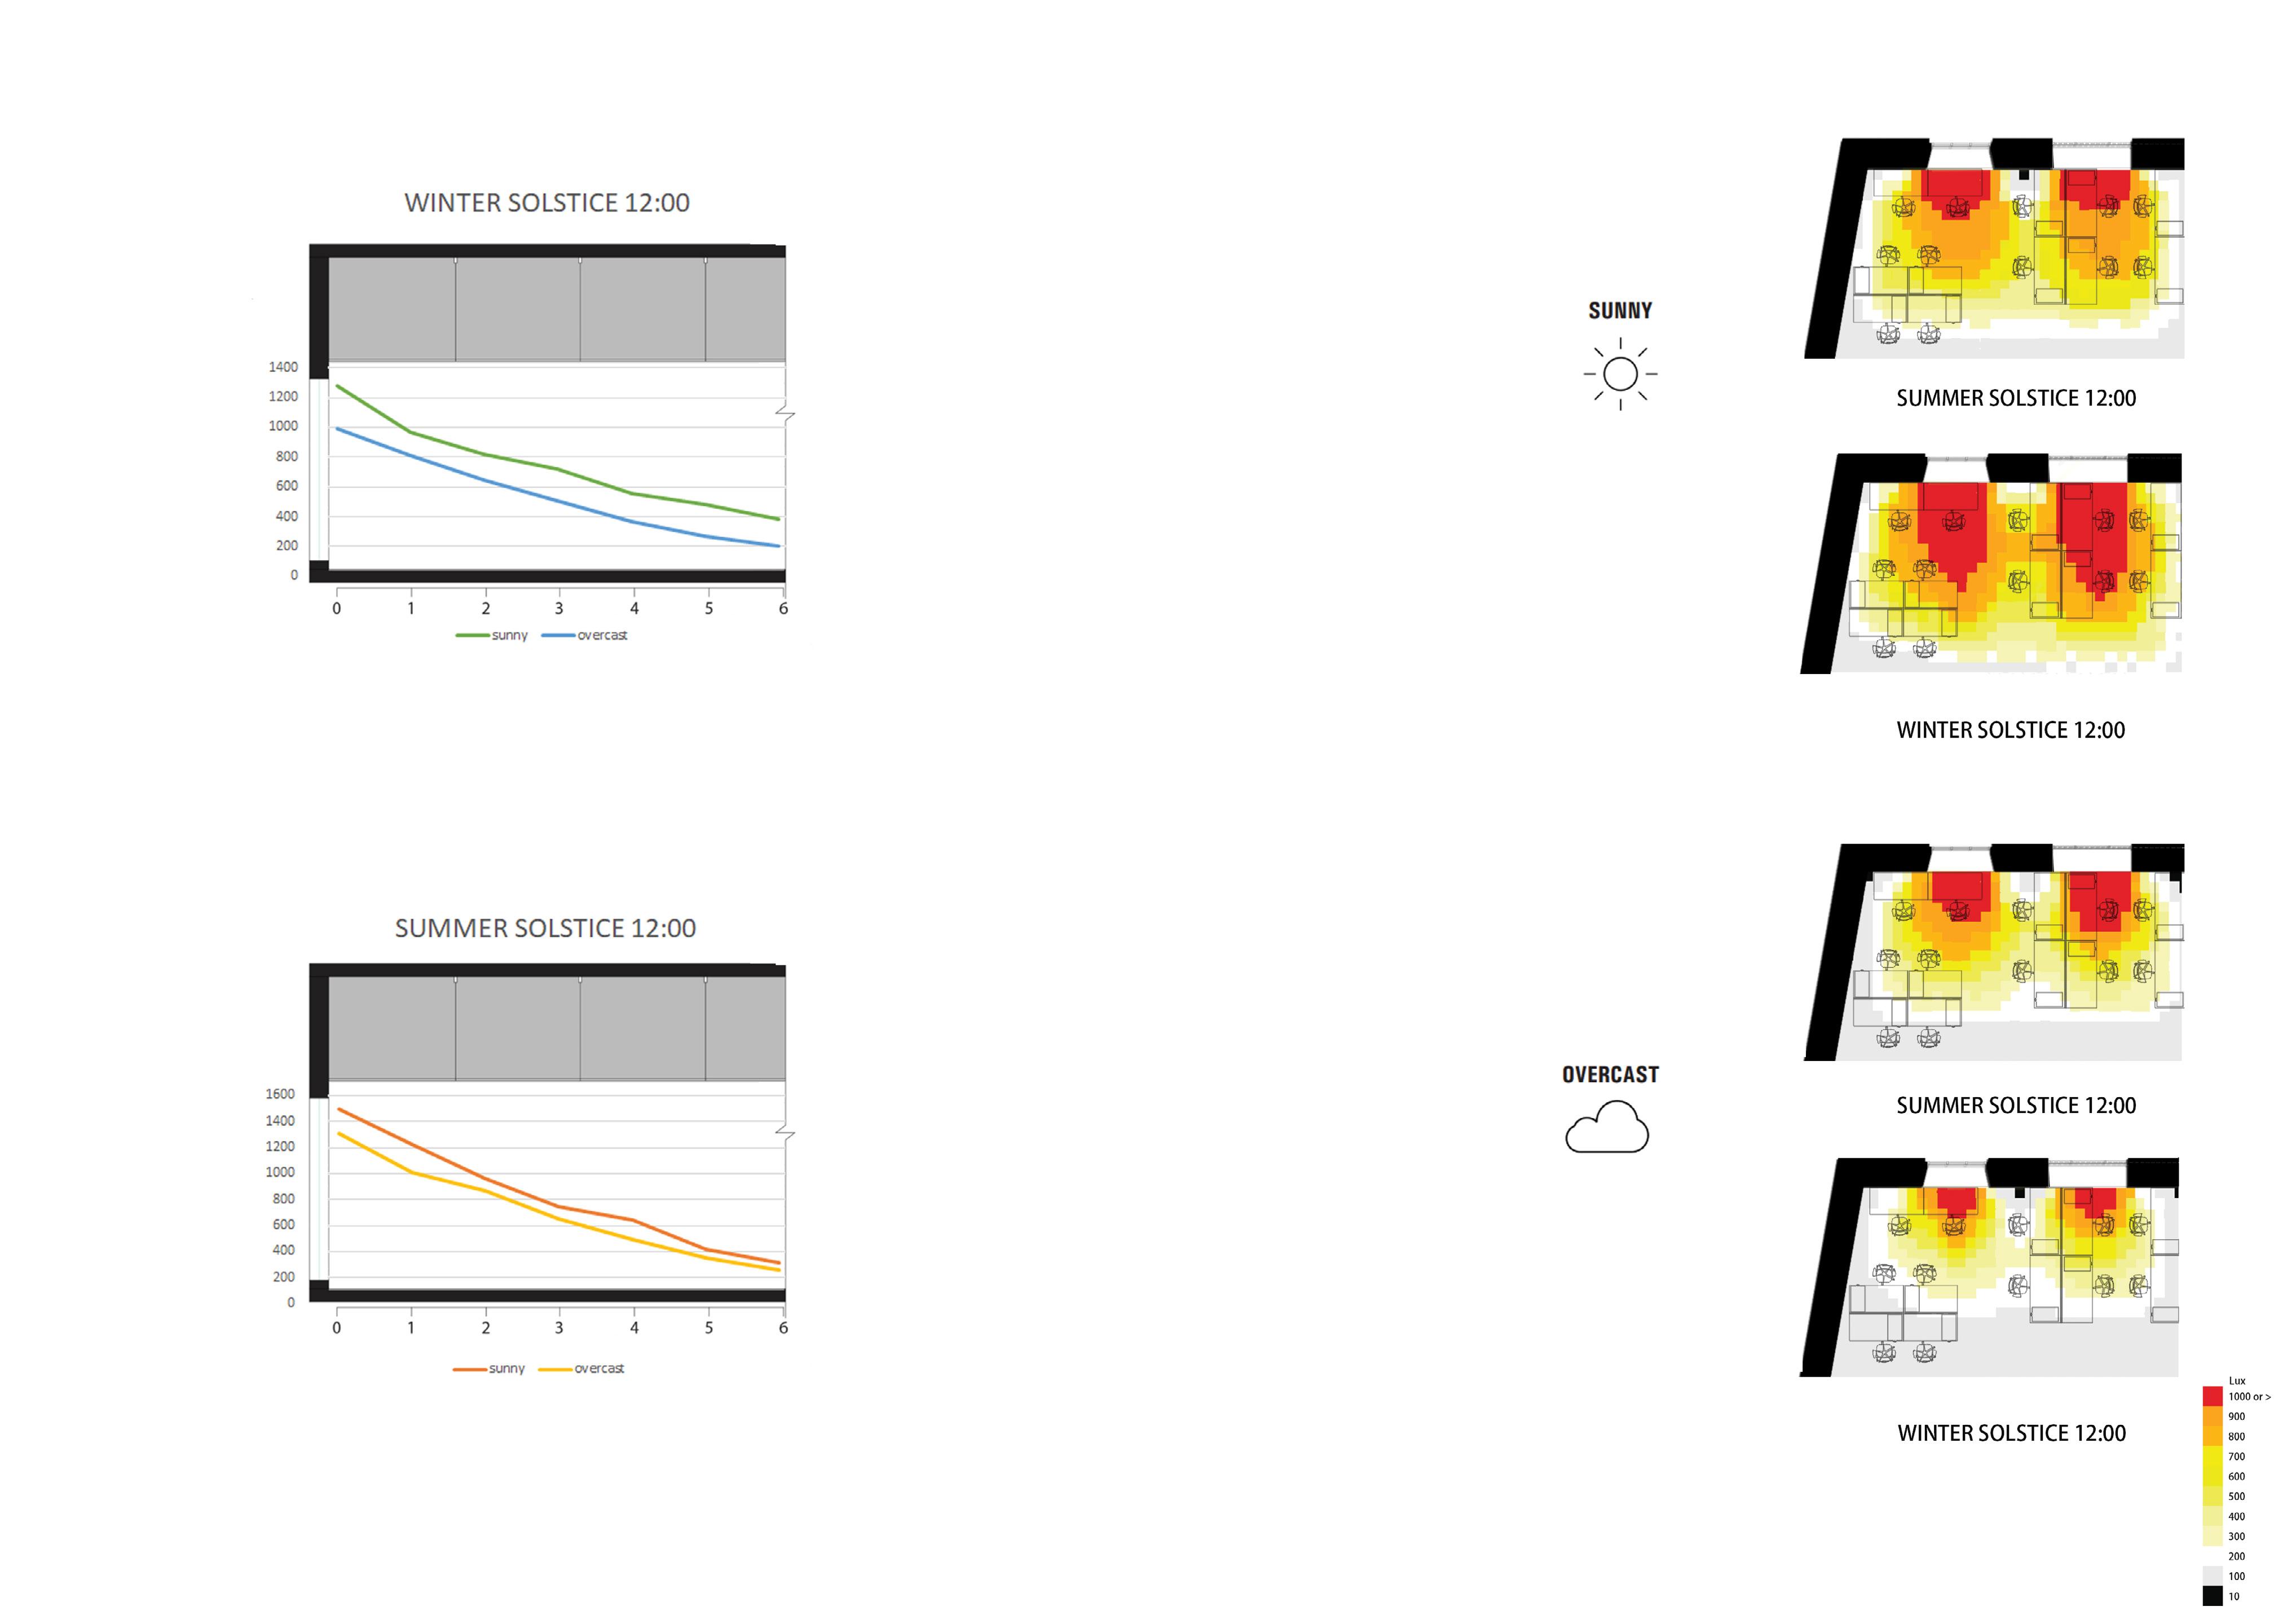
Further, the point in time illuminance was done to check whether the work stations facing the galleria receive the required light of 300 lux throughout the year.
Two main scenarios of summer and winter solstice were tested out for two sun conditions being sunny and overcast. It was deduced that in both sum mer and winter when the sky condition is sunny, the target lux levels are reached for almost 80% of the space, whereas when the sky conditions are overcast about 55-60% of the area receives the target lux.
This indicates the need for the space to rely on artificial lighting consider ing the weather conditions and higher number of overcast days in London.
Summer Sols�ce 12:00pm
Sols�ce 12:00pm
Figure 3.9.1 UDI Study for indoor office space with respect to galleria roof (Source: Radiance)

Introduction - Overview - Outdoor - Indoor - Conclusions - References
Figure 3.9.2 Point in time illumination for Base case (Source: Radiance)
24 | AA SED | Msc + MArch | 2022-23
O V E R C A S T C O N D I T I O N 800 900 1000 or < 700 600 500 400 300 200 100 0 Point in time illuminance
Winter
3.8 Outdoor Study Conclusions
The conclusions from the previous studies of outdoor outlined the effects of roof on UTCI and daylight. The studies indicate that the roof only makes a difference of 0.5⁰C-0.8⁰C in temperature when it comes to thermal comfort of the outdoor area and for daylight shows that the quality of daylight is affected by the roof, and therefore indoor spaces have to rely on artificial lighting.
The advantage of the roof is that it provides protection from rain. The pros and cons of the roof thus laid out indicates that the galleria would function with better environmental qualities without the presence of the roof.
It was concluded that the removal of the roof be proposed in order to en hance the quality of the space. But by removing the roof, the galleria would then be exposed to rain conditions.
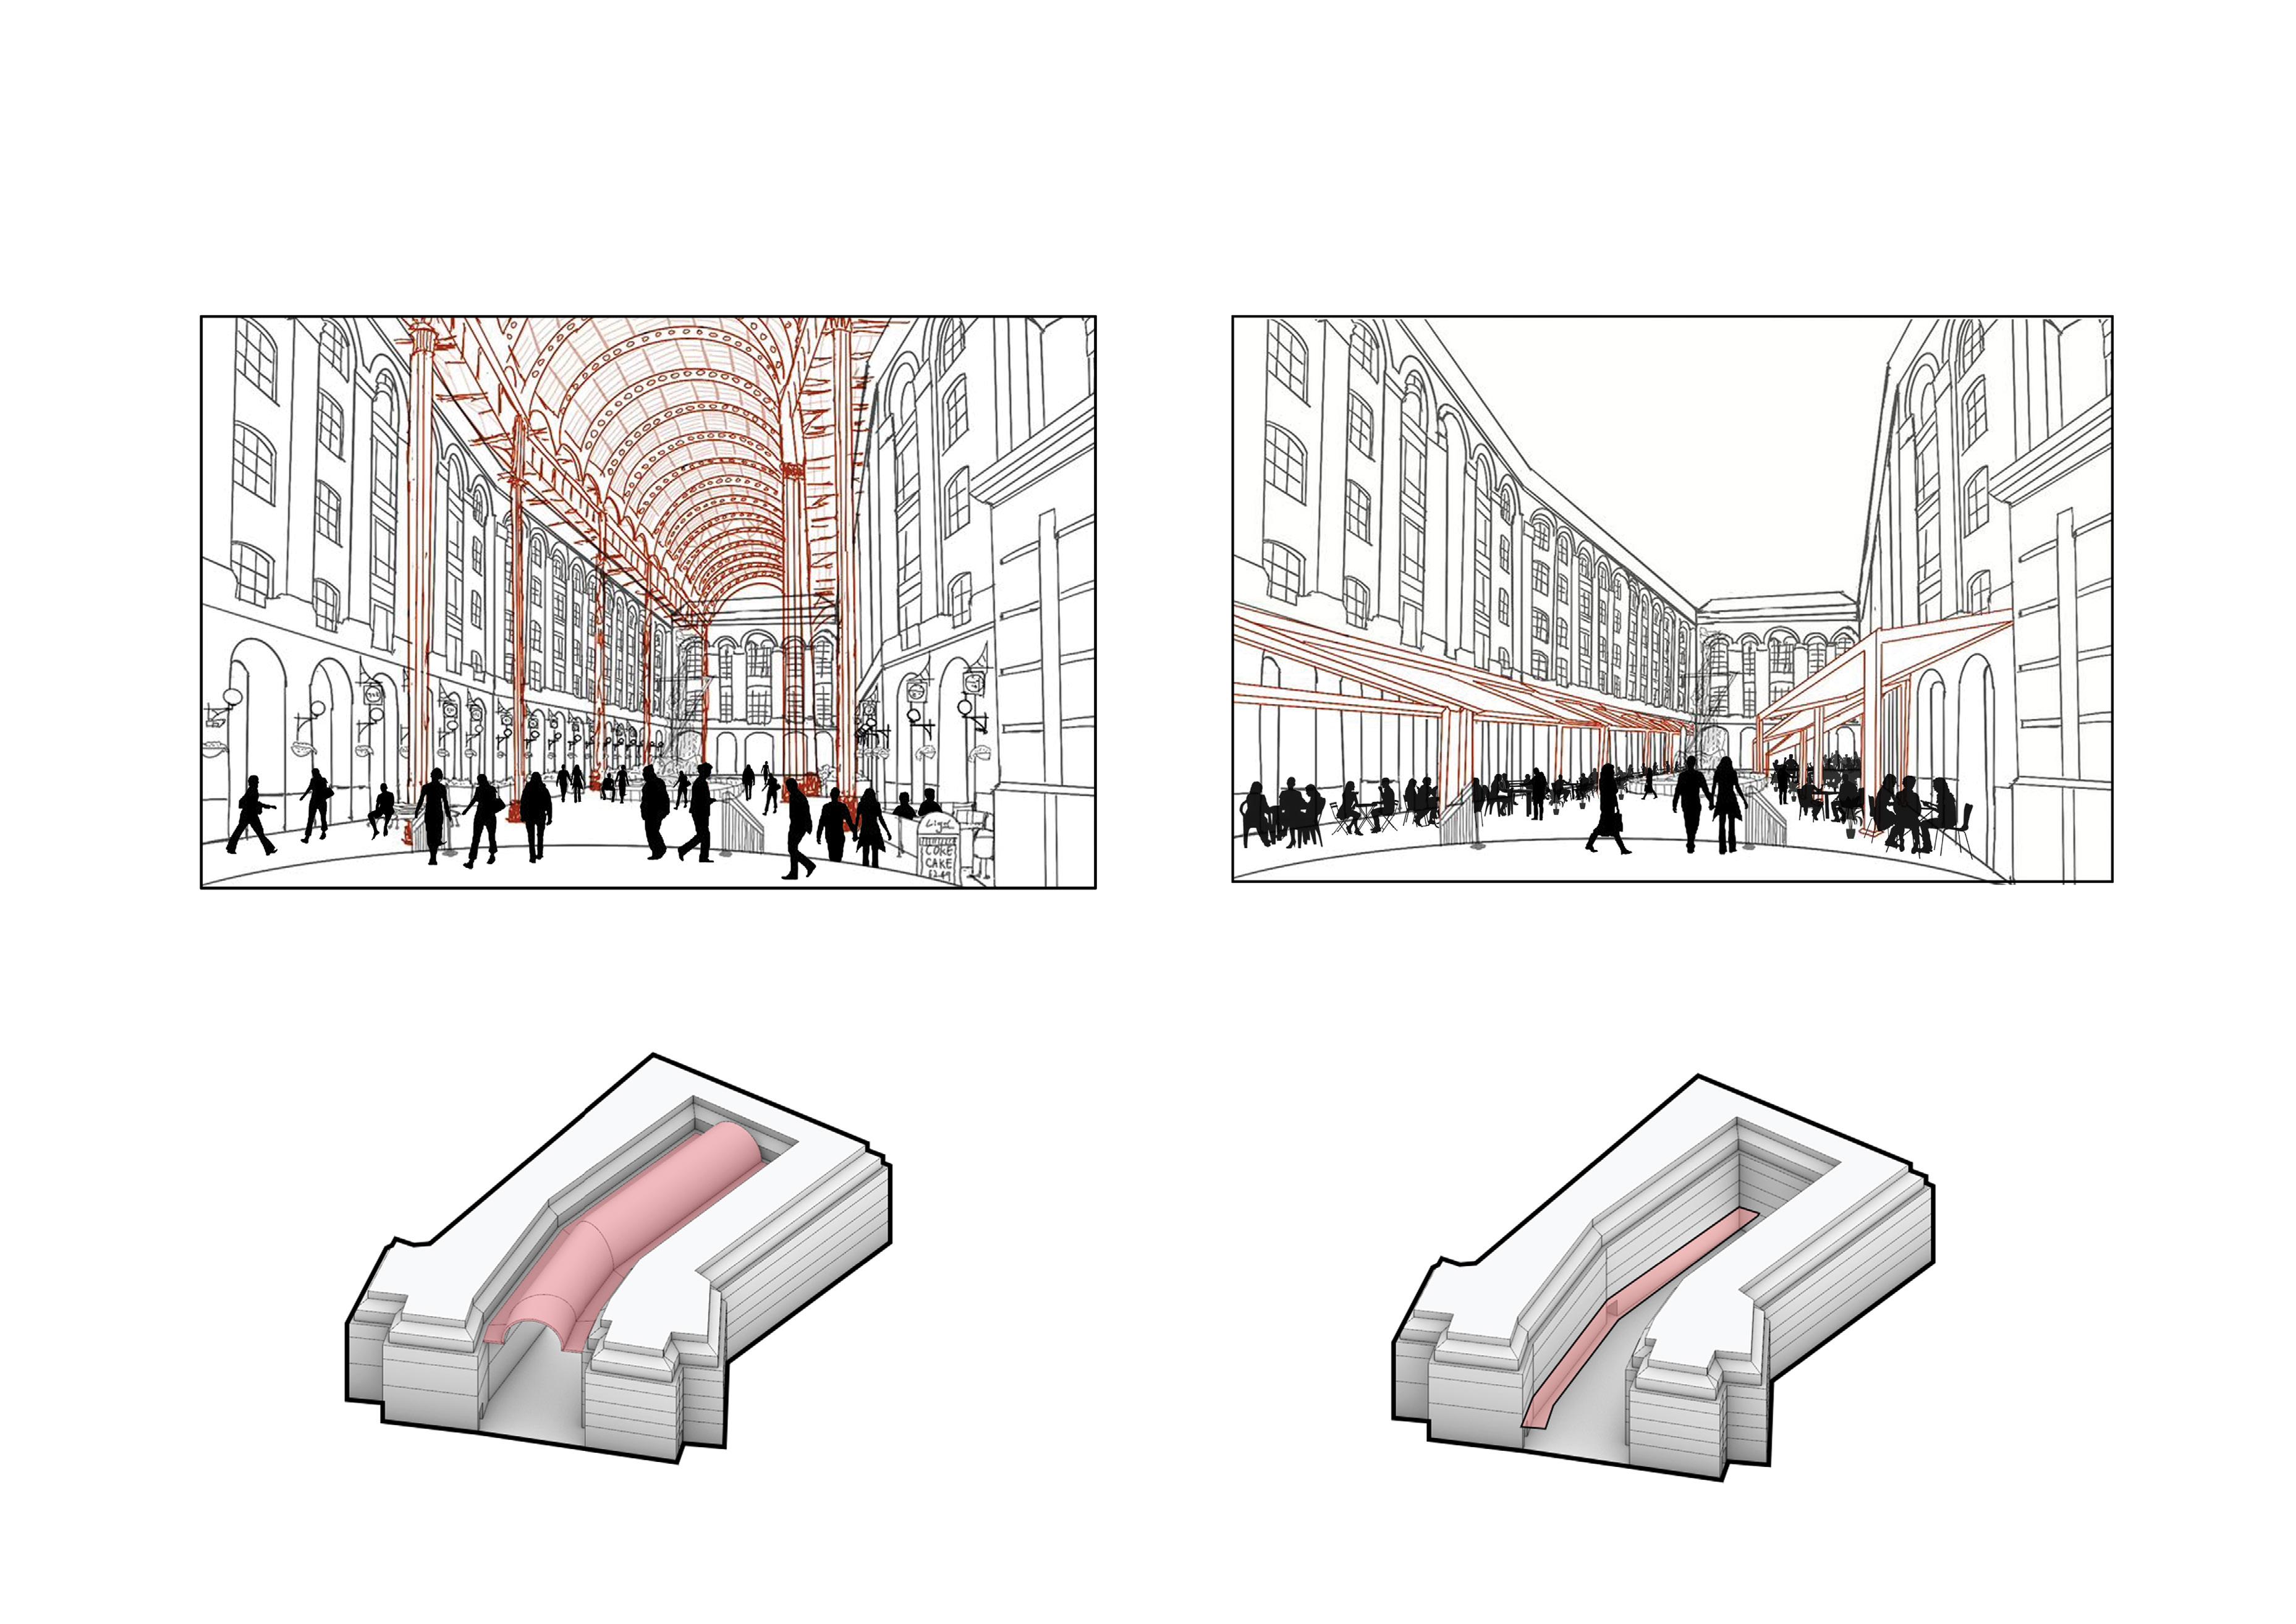
Therefore, a proposal of canopy is suggested above the seating areas of the café in order for rain protection, which starts acting like an extension of the indoor spaces which are mainly cafes and restaurants to the outside.
Hilson Moran office at Hay’s galleria | 25
Base Case Proposed Case Figure 3.10.1 Illustration showing base case and proposed case. Introduction - Overview - Outdoor - Indoor - Conclusions - References
04. INDOOR STUDY
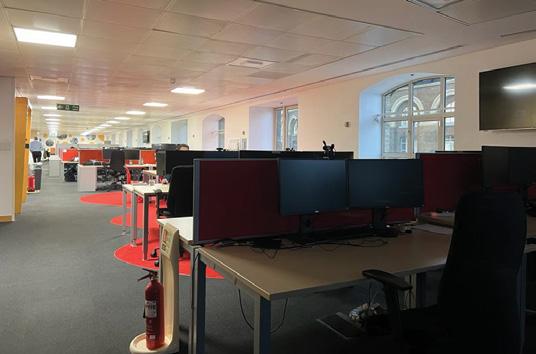
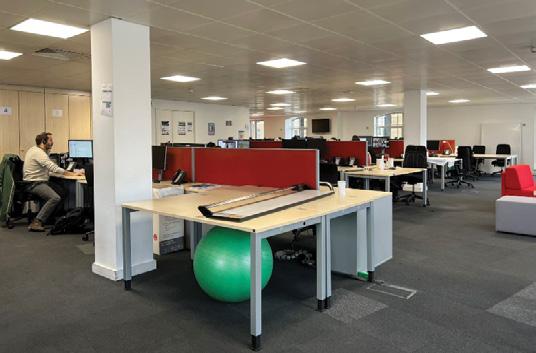
4.1 Office Information
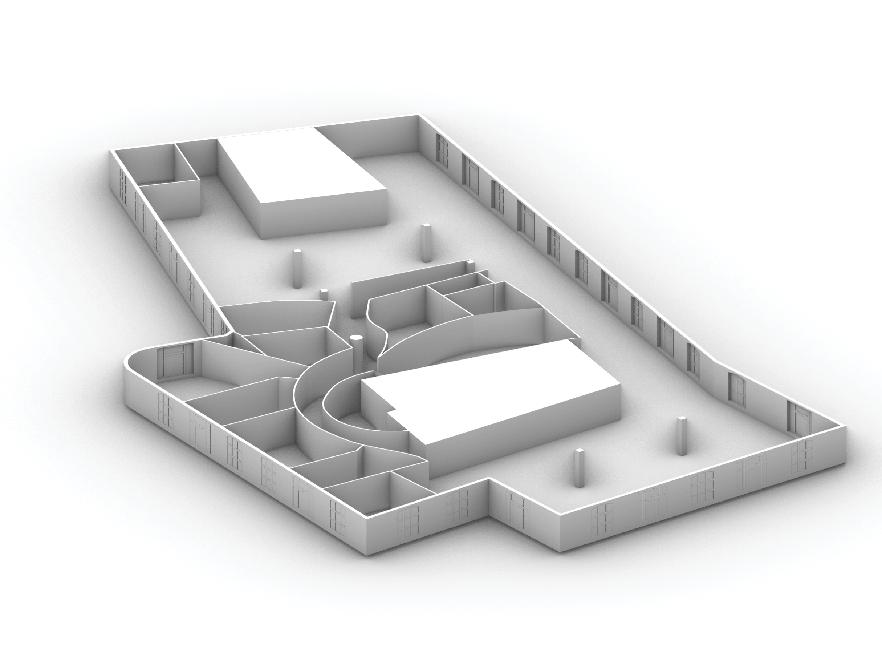
For the purposes of study discipline, The Hilson Moran Office, located on the 3 rd floor of Shackleton house, was demarcated into four distinctive zones according to the spatial character and layout. These zones are:
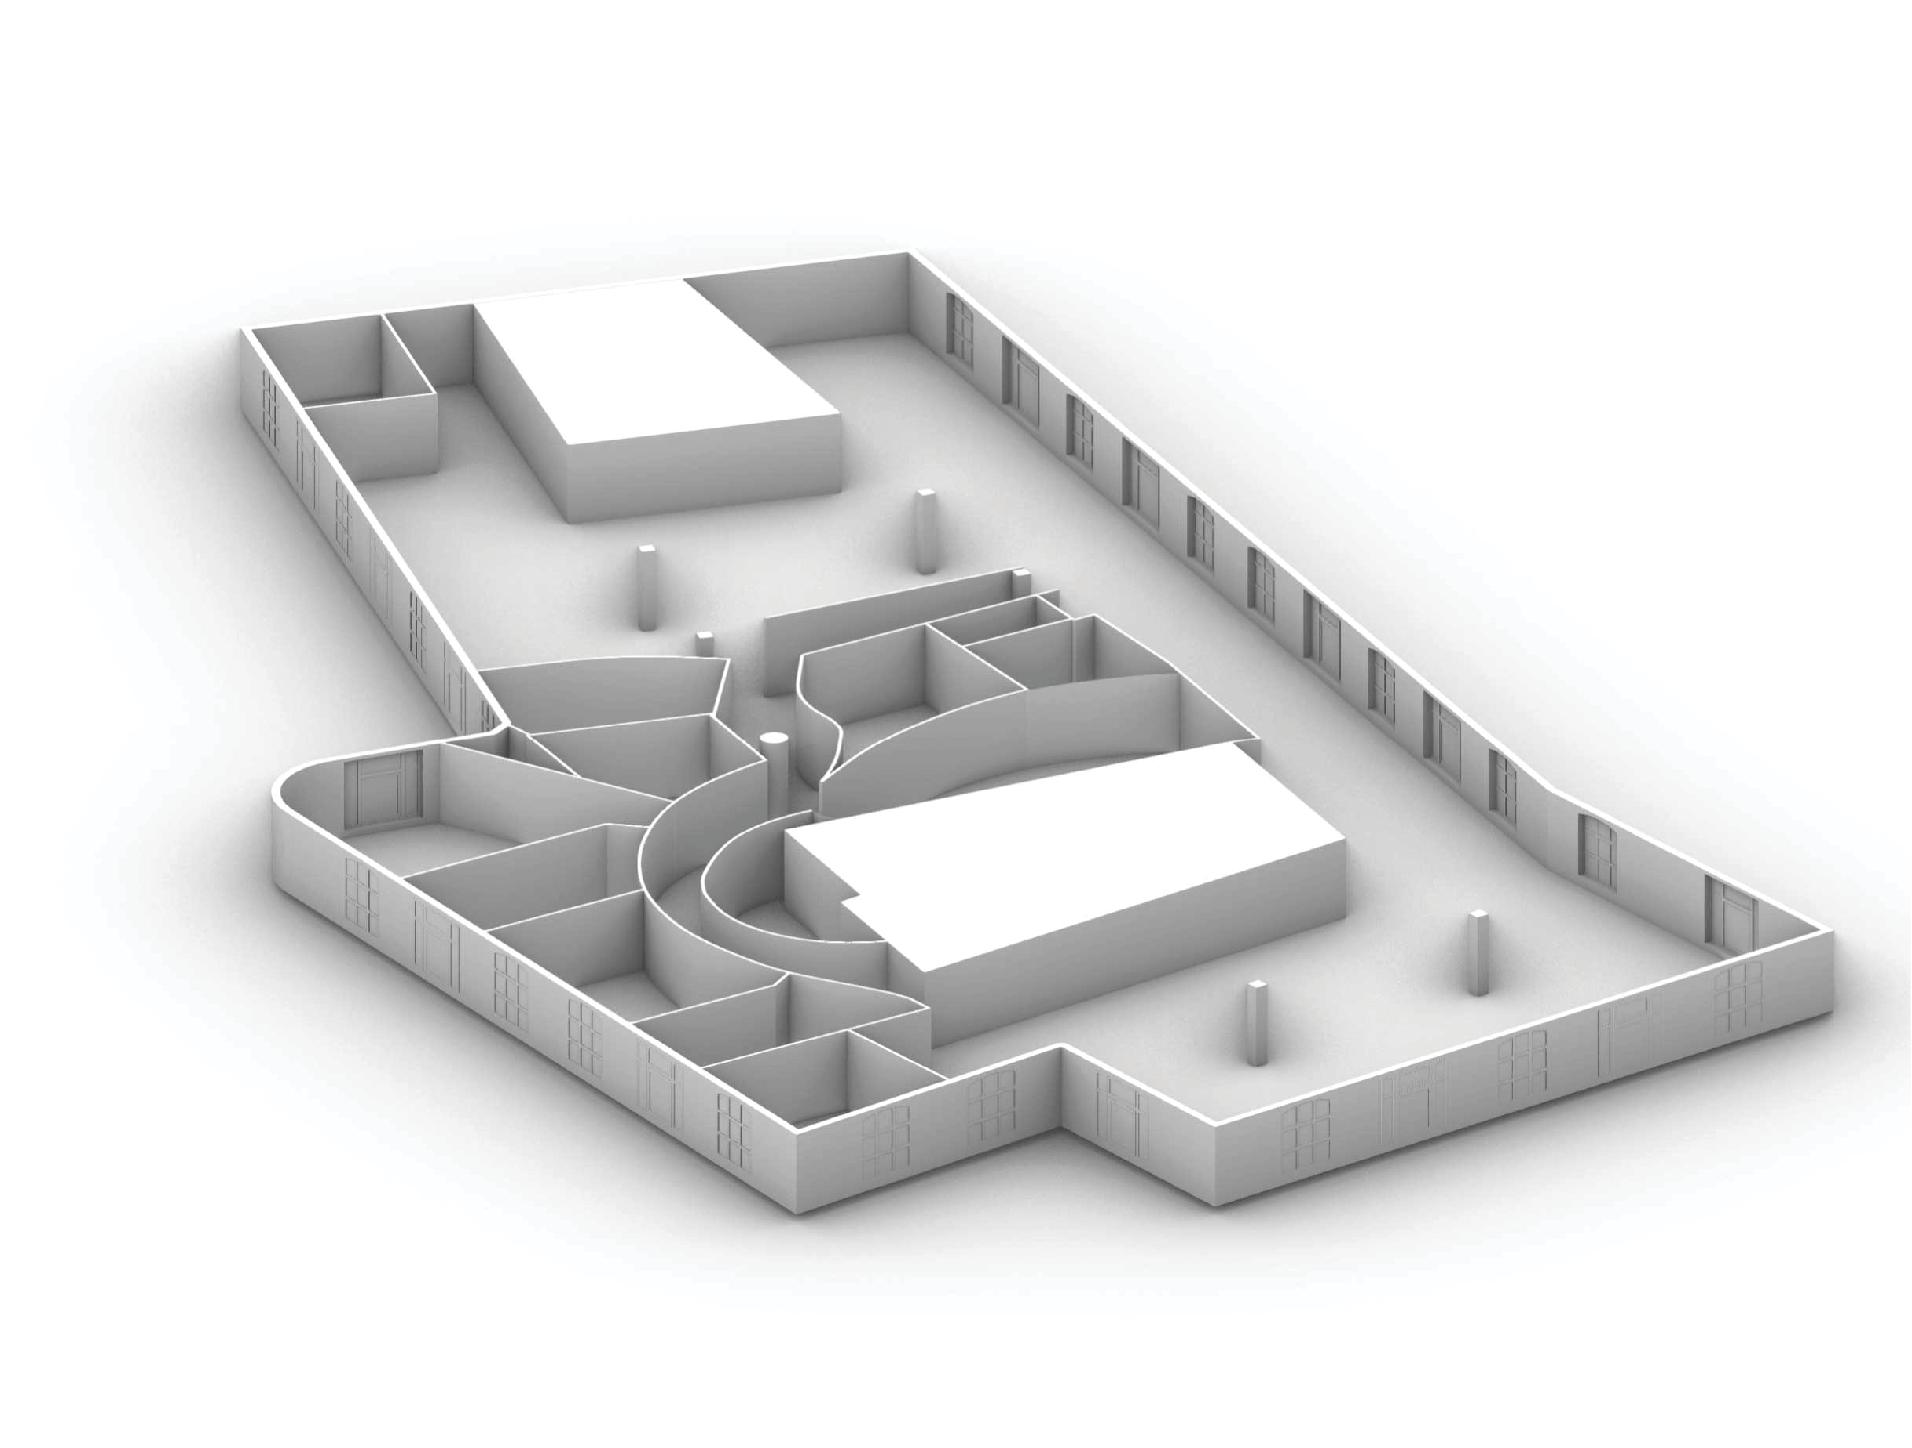
Zone 1 : River Facing – Northern
Zone 2 : Galleria Facing – North-Western
Zone 3 : Internal Zone
Zone 4 : Batterbridge Lane Facing – South-Eastern
Zone 5 : Southwark Crown Court Facing – North-Eastern
Thereafter, principal assessment including occupant interactions highlighted some learnings in the office area such as:
• Building envelope contains no insulation
• All electrical connection are in series. All the systems of each zone are connected to each other.
• The floor to ceiling height is relatively low at 2.4 metres even though there is provision for increasing it by another 1.2 metres.
• There is no fall ceiling design optimisation to increase daylight or volume parameters.
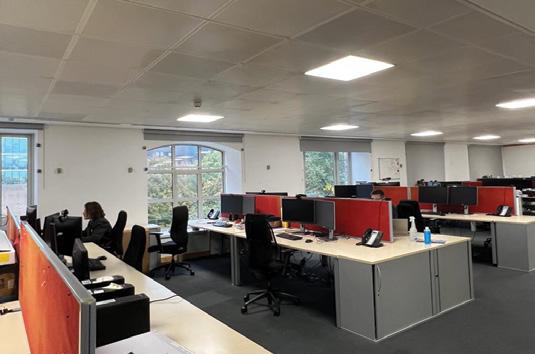
• The VAV system (for mechanical heating and cooling) is very old leading to high maintenance and electricity consumption inefficiencies.
As observed from site visit, the material character inside the office consists of hard as well as soft profiles such as carpets, wood, cork, glass, plaster and aluminium. Some relatively new-age materials such as synthetic fibres were also found.
Total Area : ~1534 sqm
Occupants : ~122 people
Office Hours : 9 Am – 6 Pm
Office Type : Sustainable Consultants
Figure 4.1.1 Hilson moran office: Overview
Introduction - Overview - Outdoor - Indoor - Conclusions - References
28 | AA SED | Msc + MArch | 2022-23
1200 2400 Single Layer (No Insulation) Single Glazing
A A Carpet B Aluminium D C Aluminium E Plaster E Glass E Synthetic Wood A G C D D C E F G B Zone 1 Zone 2 Zone 3 Zone 4 Zone 5
Schematic Section
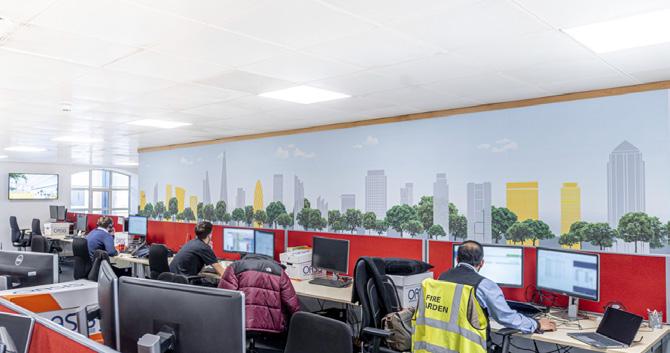
4.2 Field Work: Occupant Interviews
Some of the feedback revealed from on-site occupant interviews are as follows:
1. For most of the people, northern zone was the preferred area to work in.
2. There was no direct sunlight exposure on the galleria facing zone but some diffused lighting was measured.
3. When not in use, most of the time the office computers were kept on stand-by even on weekends.
4. Most of the occupants were dissatisfied by their working conditions in the central zone due to there being an absence of natural lighting and the ventilation system was complained to be extremely noisy.
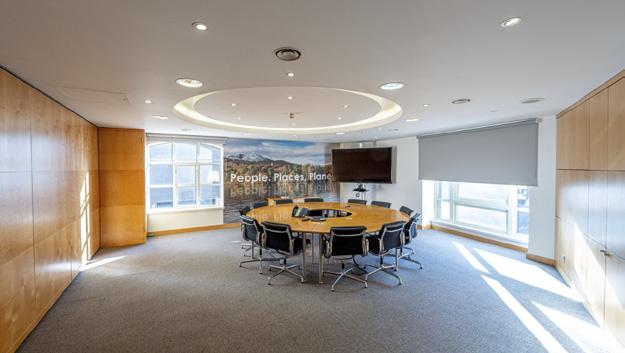
5. Energy inefficient CFL downlighting was observed in the conference zone which was occasionally occupied.
6. In the south-eastern zone, there were complaints of overheating during certain times but there were good natural lighting conditions prevalent here. Some female occupants complained of a male oriented comfort level set point.
Furthermore, it was discovered that, the office is at its peak occupancy during the hours of 0900 to 1700. Occupancy profile shoots up rapidly in the morning hours and disperses gradually in the evening causing stress on the building performance in the mornings. Moreover, there is a lower occupancy percentage when comparing pre and post covid profiles due to work from home.
Figure 4.2.1 Illustration on plan representing occupant interview outcomes Figure 4.2.2 Occupancy schedule as per interview
Introduction - Overview - Outdoor - Indoor - Conclusions - References
Based on
survey of
Data Logger Placements
Data Logger Placements
office at Hay’s galleria | 29
Hilson Moran
a
12 people 1 0 10 20 30 40 50 60 70 80 90 100 2 3 4 5 6 7 8 9 10 11 12 13 14 15 16 17 18 19 20 21 22 23 24
Good
Office official timing Time Occupancy Schedule Occupant % Pre-Covid Post-Covid P S Preferred area in the office Diffused light from galleria Work stations remain on standby Noisy vent system above Away from the windows No natural light Male oriented comfort levels Overheats sometimes
lighting
Air Conditioned area: Centralised VAV system (Air supply from the periphery)
Lighting: CFL Downlights Occassionaly occupied spaces Di used Natural Light All lights on single switch Views
Away
No natural
oriented
Good
Based on a survey of 12 people 1 0 10 20 30 40 50 60 70 80 90 100 2 3 4 5 6 7 8 9 10 11 12 13 14 15 16 17 18 19 20 21 22 23 24 Office official timing Time Occupancy Schedule Occupant % Pre-Covid Post-Covid S Preferred area in the office Diffused light from galleria Work stations remain on standby Noisy vent system above
from the windows
light Male
comfort levels Overheats sometimes
lighting
Air Conditioned area: Centralised VAV system (Air supply from the periphery)
Lighting: CFL Downlights Occassionaly occupied spaces Di used Natural Light All lights on single switch Views
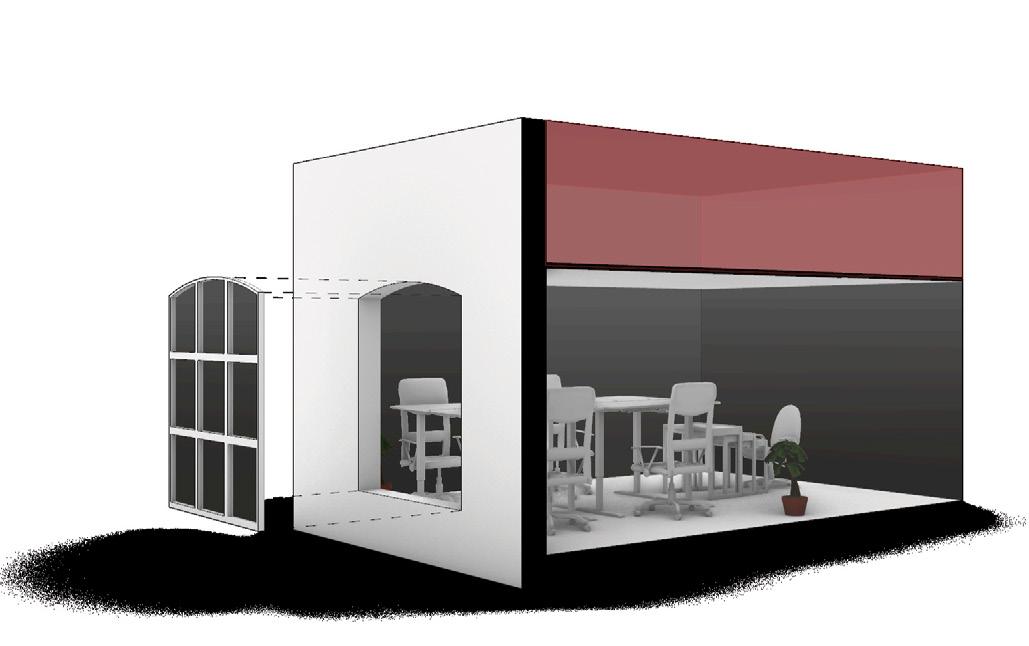
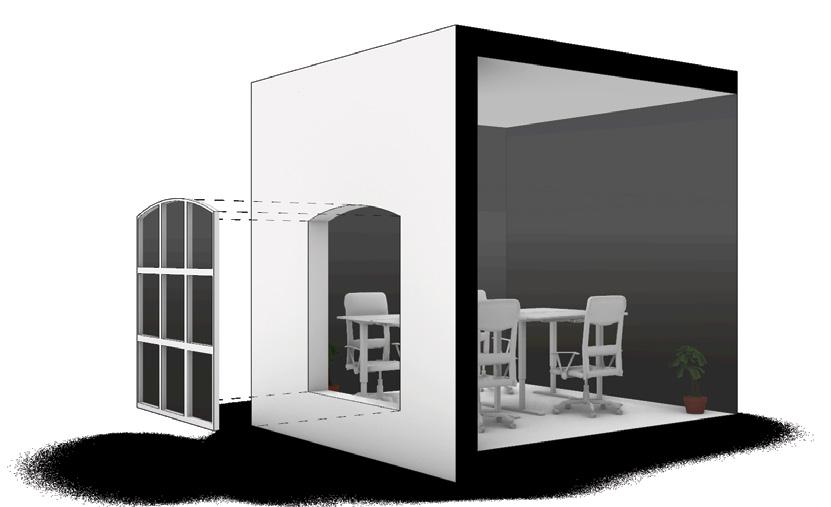
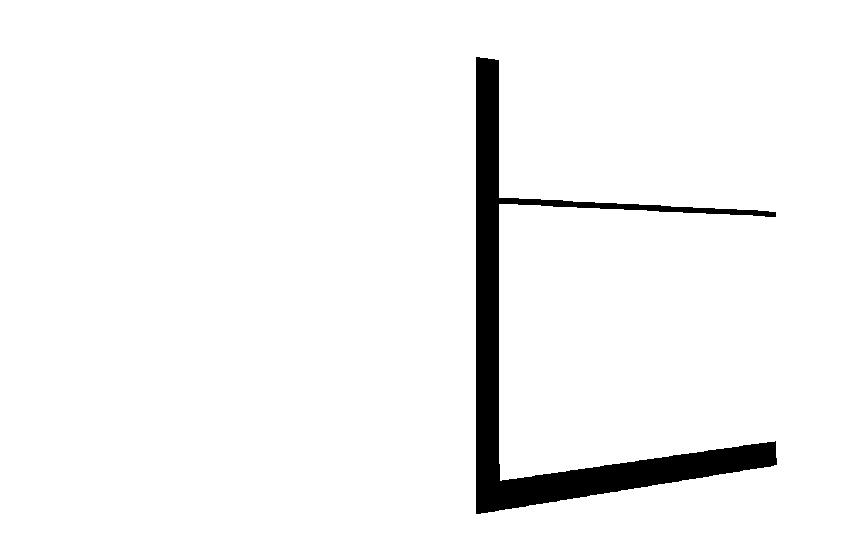
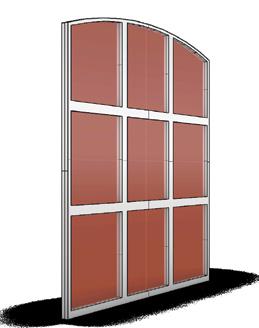
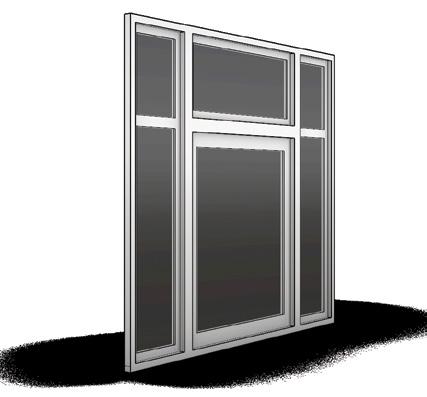
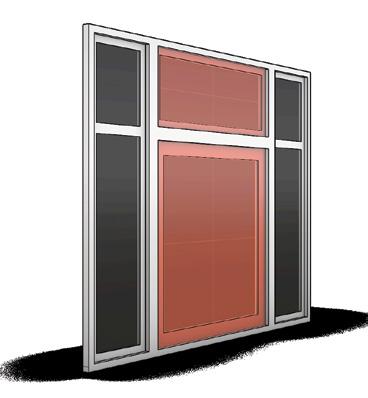
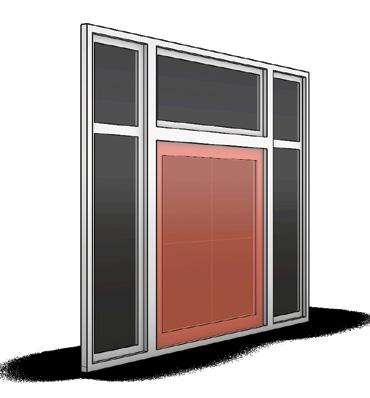
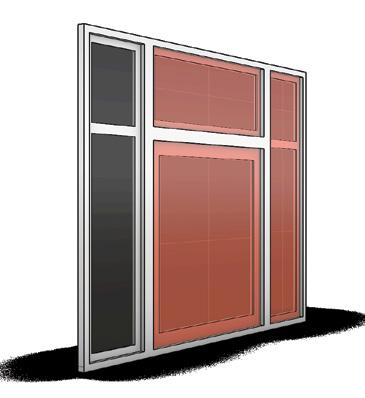
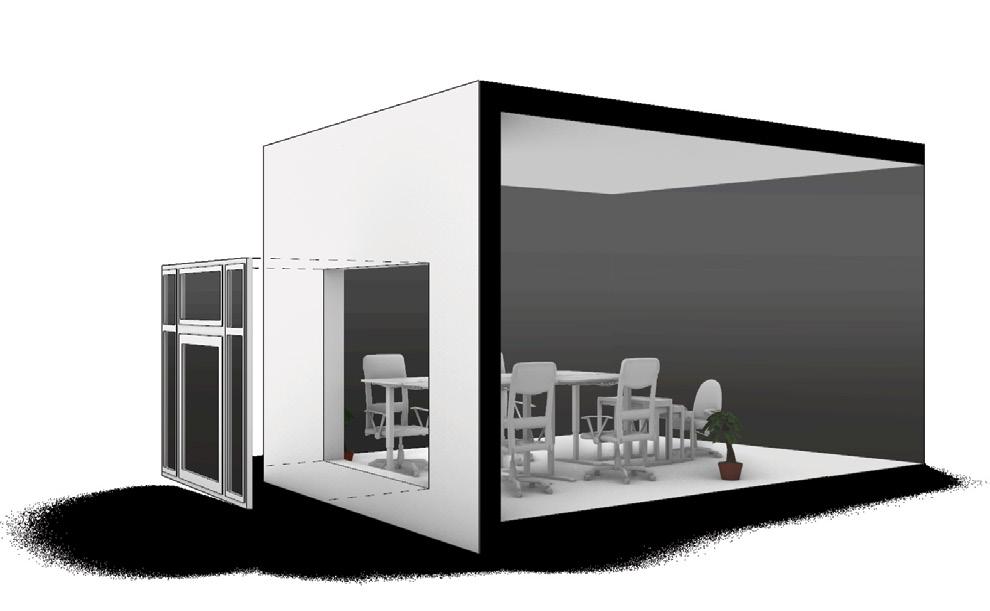
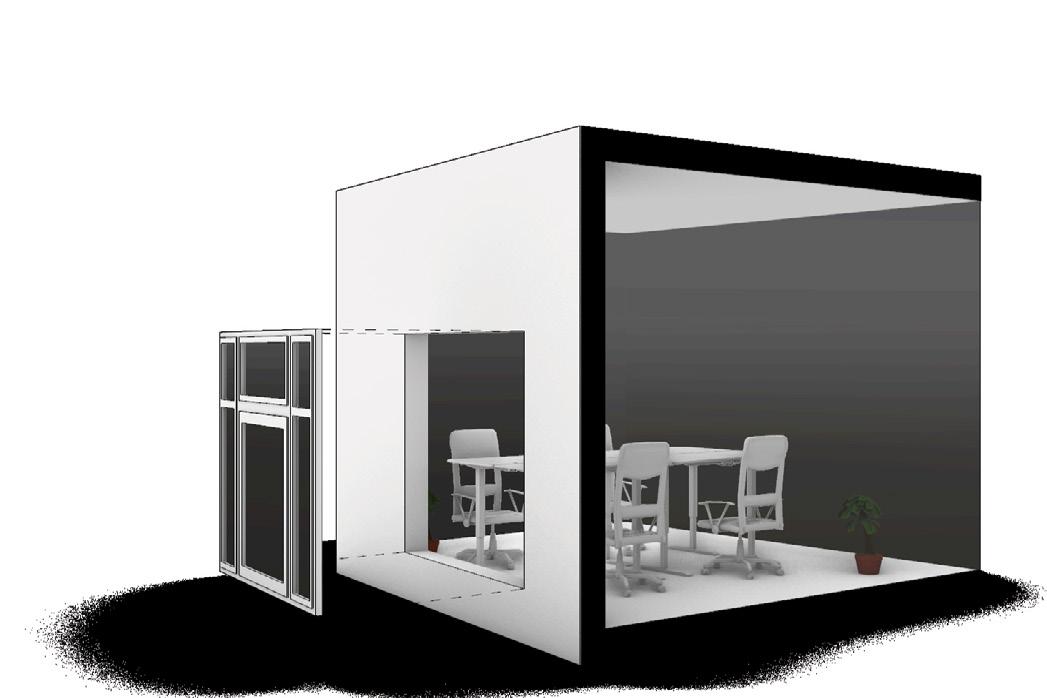
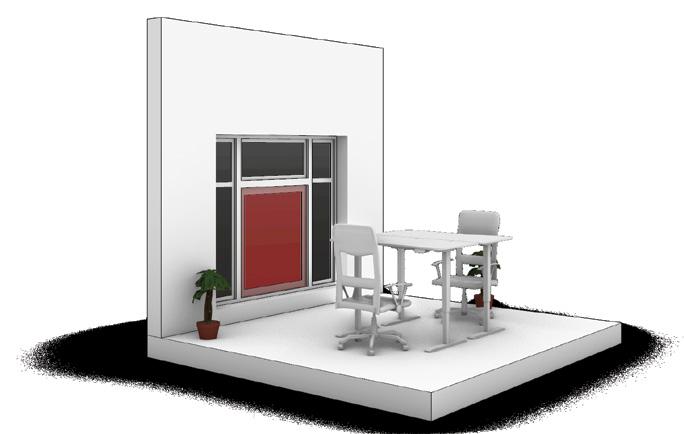
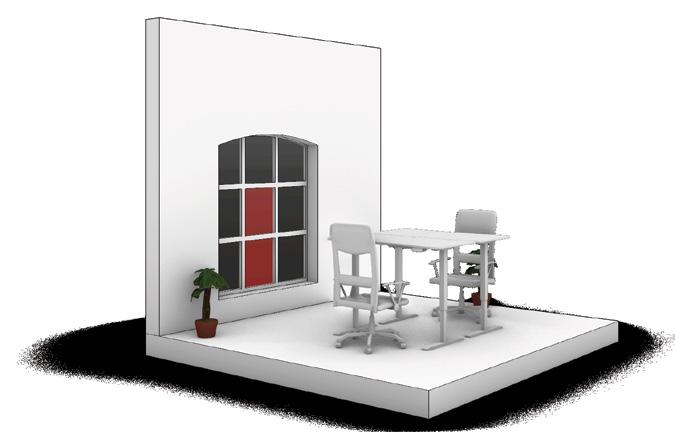
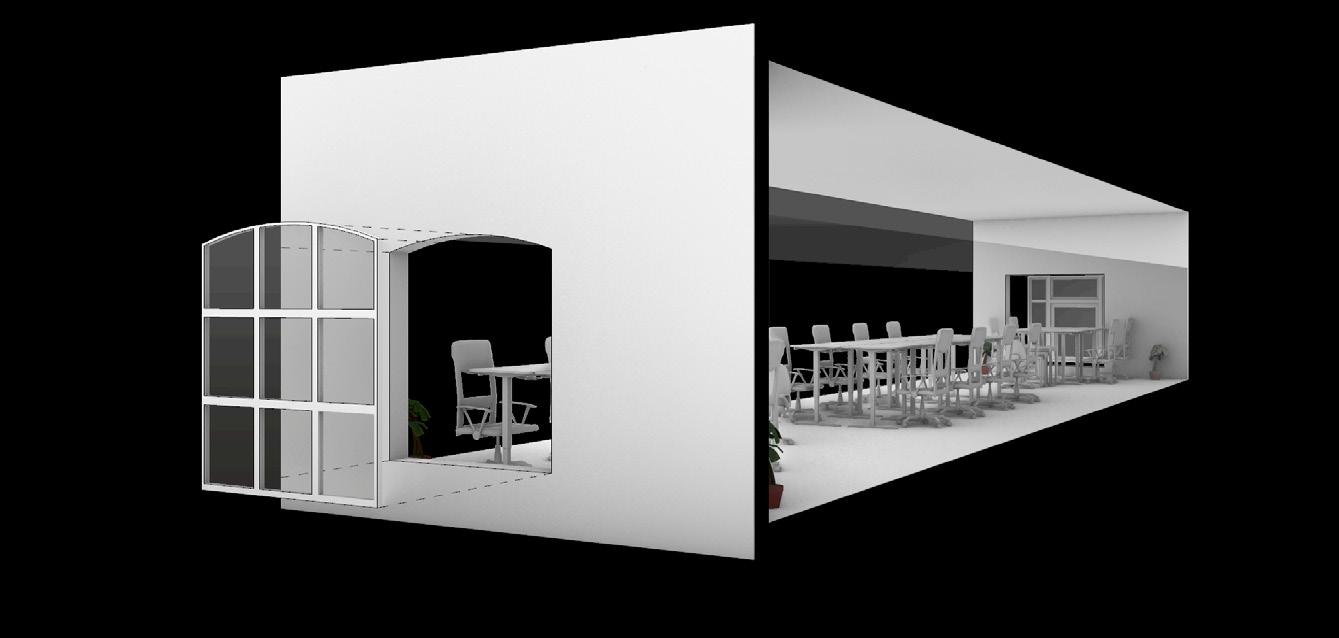
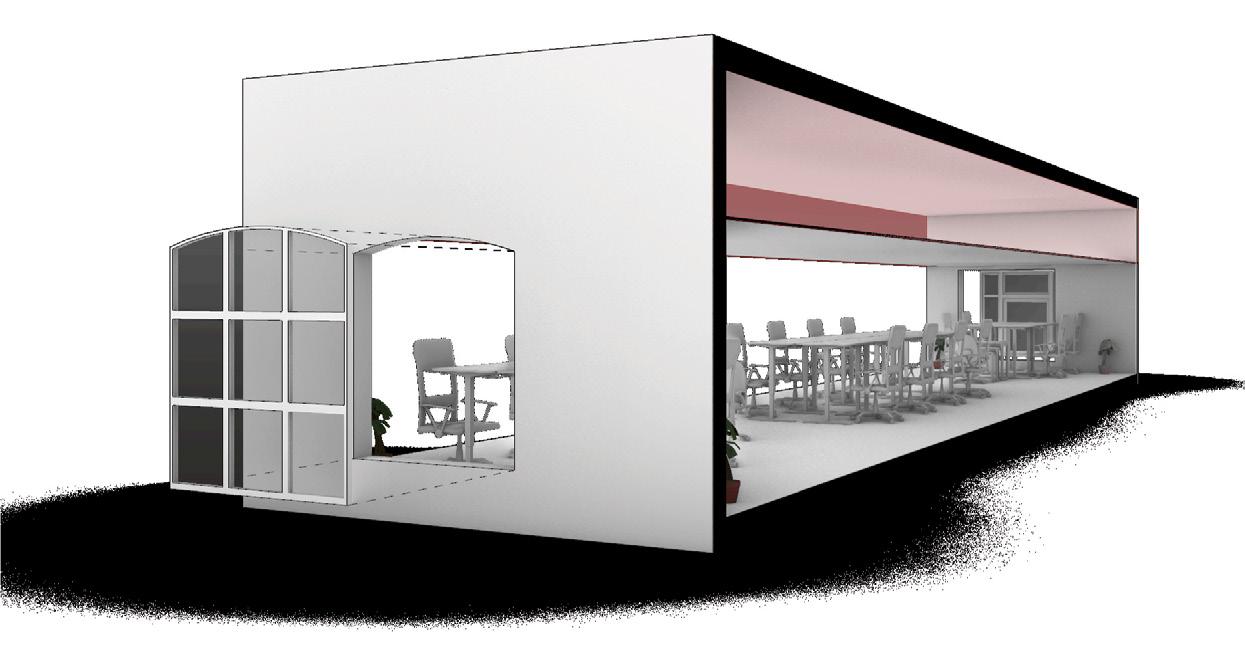
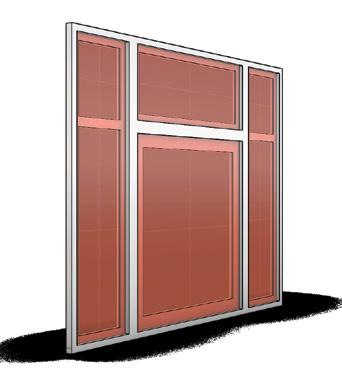
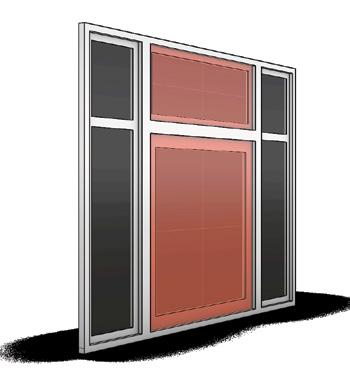
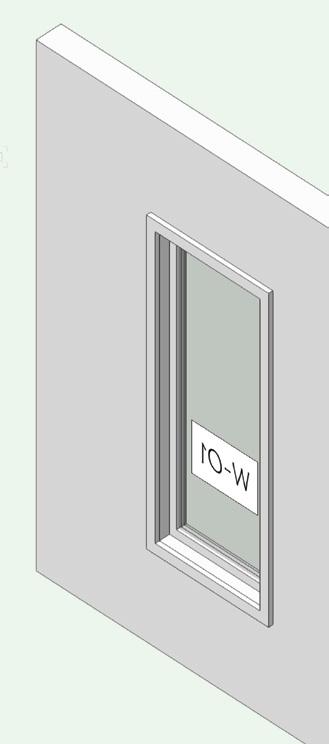
4.3 Façade Study
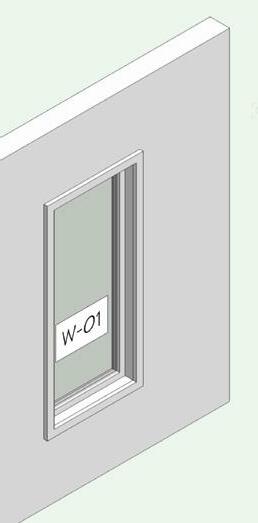
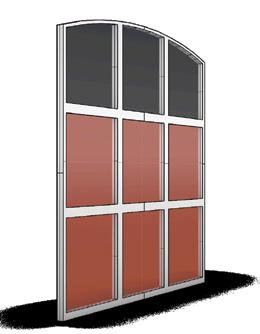
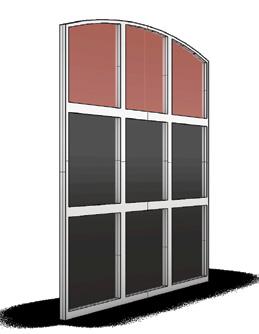
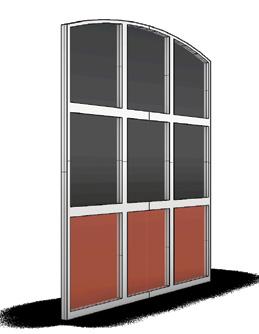
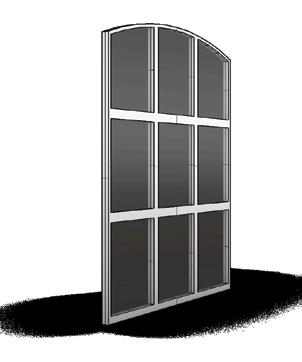
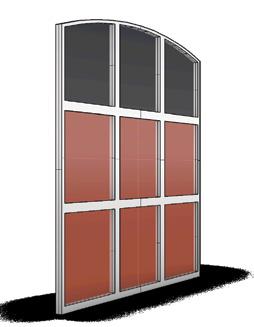
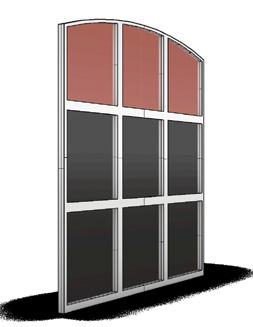
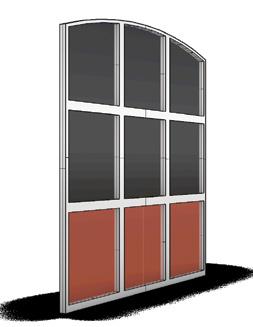
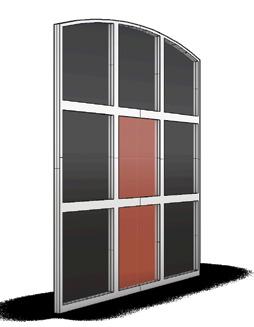
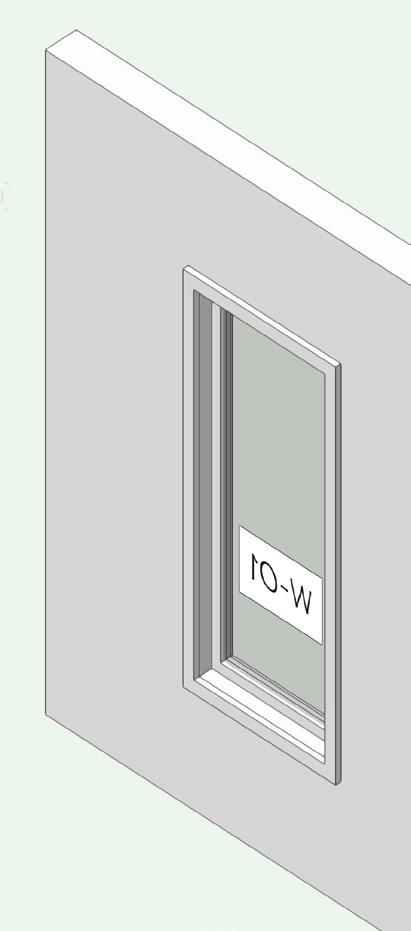
There are 2 types of windows in the office, classified as type A and B.
Type A windows have very high surface area of 5.04 square metres but there is only 34% of the area which is openable (Central panel). Swing of the type A windows is towards the inside of the office. Moreover, due to there being an unequal distribution of window panel proportion, this creates a security risk therefore most of these windows are shut most of the time.
Similarly, for type B windows, even though the surface area is lower when compared to type A at around 3.47 square metres, the characteristics of this is the same. Such as, only 18% of the window which is essentially 2 panels are operable with swing towards the inside of the space.
In terms of wall to window ratio, the building envelope is sufficiently open having achieved around 50% or thereabouts levels on all façades.
Furthermore, there is high glare on the South-Eastern zone due to high sun angles around noon.
Figure 4.3.1 Hilson moran office: Types of windows
Introduction - Overview - Outdoor - Indoor - Conclusions - References
30 | AA SED | Msc + MArch | 2022-23
Window
Window
Openable area
Openable area 18% ExistingUPS A B B B B B B B B B B B B B B B B B B B B A A A A A A A A A A A A A WWR West Facade South East
North Facade South East
Internal
54% WWR 53% WWR 50% WWR
Sun
100 Blocked due to surrounding 320 530
Openable Panel
Type B
Type A
Windows are blocked due to their large size. (security reasons) 34%
Facade 1
Facade 2
Partition
54%
Angles on South East Facade
4.4 Datalogger Analysis
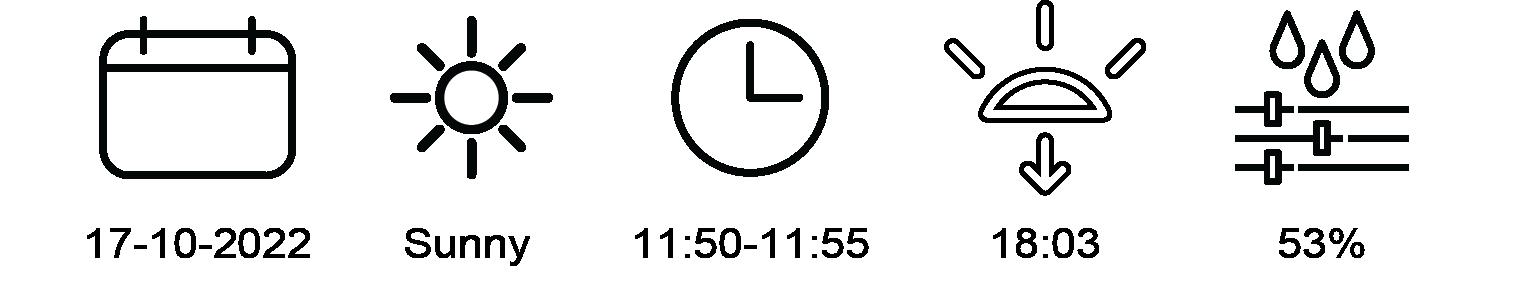
To analyse the present environmental comfort levels of the occupants with relation to building performance, three dataloggers were placed in different zones during the period between 17th October 2022 to 27th October 2022. Moreover, during weekdays, the office is mechanically controlled with thermostat set points at 22 - 24 °C. On the weekends, the office is in freerunning condition.
The results obtained were as follows:
I • On weekdays, due to the rapid rise in temperatures in the morning hours, it can be observed that there is stress on the building systems (from 0800 hour, when the thermostat turns on) thereafter temperatures generally remains constant in the afternoons (upto 1800 hour) and thereafter falls very steadily beacuse of the system switching off.
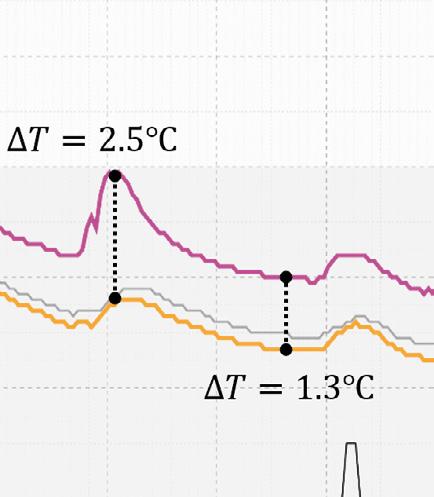
II • The dataloggers placed in the northern and north-western zones indicated virtually indistinguishable temperature readings but the one placed in the South-Eastern zone showed consistently higher temperatures by 1.2 °C at an average.
III • During free running conditions, there is a divergence of 4-5 °C when comparing Dry-bulb temperature to that inside the building. This is due to the thermal performance of the building envelope. Furthermore, high heat retention during weekdays can be noticed which is relieved on weekends when the office is in free-running condition. Even though the DBT falls sharply, the indoor temperature shows a gradual decline. This phenomenon occurs due to a low wall to surface area ratio of 0.1 per metre.
Additionally, Minimum Indoor Temperature calculations were performed to understand the quantum of loads effecting the building performance with and without mechanical heating and cooling as well as occupant parameters.
MinT calculations confirmed the results observed by datalogger readings.
Figure 4.4.1 Field Work: Measured indoor operative temperature for three zones.
Introduction - Overview - Outdoor - Indoor - Conclusions - References
C
Hilson Moran office at Hay’s galleria | 31
Free
by VAV System
Temperature at A Temperature at B Temperature at C Outdoor Temperature Comfort Band Day time Hours Night time Hours Office Working Hours Weekend Hours ncrease n Temp Drop
Temp Mechanically controlled by VAV System II II Exposed Wal Area 365 m². Tota Vo ume 3680 m³ W al Area/Total Vo ume Rat o: 0 1/meter ( High Hea reten ion due to smal rat o )
Time 12:00 PM 17-10-2022 Monday Tuesday Wednesday Thursday Friday Saturday Sunday Monday Tuesday Wednesday Thursday 18-10-2022 19-10-2022 20-10-2022 21-10-2022 22-10-2022 23-10-2022 24-10-2022 25-10-2022 26-10-2022 27-10-22 00:00 AM 12:00 PM 00:00 AM 12:00 PM Thermostat control (22-24 ⁰ C)
running condition Mechanically controlled
00:00 AM 12:00 PM 00:00 AM 12:00 PM 00:00 AM 12:00 PM 00:00 AM 12:00 PM 00:00 AM 12:00 PM 00:00 AM 12:00 PM 00:00 AM 12:00 PM 00:00 AM 10:00 AM 8 10 12 14 16 18 20 22 24 26 28 30 Temperature ( ⁰ C)
n
Average = 1.2⁰C ( is the difference between Temperature at C and A)
A B
4.5 Volume Study
The study was conducted by taking the northern zone as a test case to explore the effects on temperature, with relation to an increase in the profile of volume.
The datalogger and MinT Analysis showed that the difference in indoor temperature when compared to outdoor DBT was high in summers. If the volume is kept the same, then there is a requirement of higher rate of ventilation in order to reduce the temperatures. (Fig 4.5.1)
To explore the environmental optimisation of the space, multiple iterations of volume profiles and their effects were analyzed. As can be noticed from graphs, there was a decrease in temperatures difference with the increase in volume during both summer as well as winter. The summer period requires lower temperature difference compared to winter.
The volume study concludes that, higher volume is required during summer period whereas in the winters a lower volume is needed.
Volume and wall area considered for calculations
T e m p e r a t u r e D f f e r e n c e Vo ume (cu me res)
Base Case Volume: 610 cu. metres.
Iteration-01 Volume: 915 cu. metres.
Iteration-02 Volume: 915 cu. metres.
T e m p e r a t u r e D i f f e r e n c e
Iteration-03 Volume: 915 cu. metres.
Iteration-04 Volume: 915 cu. metres.
June
Avg. DBT: 16.63⁰C Avg. Humidity: 71%
Avg. Incident Radiation: 1.64 kWh/m² per day
2 2 2 2 4 2 6 2 8 3 3 2 3 4 3 6 3 8 4 4 2 4 4 4 6 4 8 5 5 2 5 4 5 6 5 8 6 6 2 6 4 6 6 6 8 7 7 2 7 4 7 6 7 8 8 8 2 8 4 8 6 8 8 9 600 700 800 900
2 2 2 2 4 2 6 2 8 3 3 2 3 4 3 6 3 8 4 4 2 4 4 4 6 4 8 5 5 2 5 4 5 6 5 8 6 6 2 6 4 6 6 6 8 7 7 2 7 4 7 6 7 8 8 8 2 8 4 8 6 8 8 9 600 700 800 900 December
Vo ume cu metres
Avg. DBT: 07.25⁰C Avg. Humidity: 77%
Incident Radiation: 0.20 kWh/m² per day
Volume iterations to be considered for further study ac/h:1 5 ac/h 2 ac/h:2 5 ac/h:3 ac/h:3 5 ac/h:4

Figure 4.5.1 Volume vs Temperature chart with varying air changes for summer and winter period
Introduction - Overview - Outdoor - Indoor - Conclusions - References
32 | AA SED | Msc + MArch | 2022-23
Avg.
Vo u m e 600 700 800 900 Ex p o s ed wa l (Area ) 50 65 80 96
Orientation
Technical Studies
Daylight Ventilation
Window study Schedules
Optimization
Indoor Study Conclusions
Figure 4.6.1 Methodology for Technical studies
Glare analysis Operable Area Thermal
Design Proposals Material study
Strategies
Volume study
Introduction - Overview - Outdoor - Indoor - Conclusions - References
Hilson Moran office at Hay’s galleria | 33
4.6 Daylight Study: Useful Daylight Illuminance
To check daylight of the space, useful daylight illuminance (UDI) was looked at in the overall plan. The threshold set for it was kept between 300 to 3000 lux. The simulation showed that UDI ranging from 50-100% lied in the patch demarkated in the corresponding figure 4.6.1. This illustrated that useful daylight applicable for the space lies within 5-6m away from the window. Additionally, the central zone demarcated at spot 4 lies below the 50% UDI range.
Further workstation spots 1,2,3 and 4 in the open plan were identified considering different orientations of workstations. The corresponding sky exposure percentage was checked for each spot. The reason for the UDI being below 50% was identified for spot 4 because of its sky exposure being 1%. Spot 4 currently acts as a workstation in the office. On the contrary spot 2 which has fairly good UDI levels and decent amount of sky exposure is a space in the office that is not used very often.
The analysis was further taken ahead by taking Spots 1,2,3 to test out required wall to window ratios (WWR) in different orientations for better UDI levels.
Useful Daylight Illuminance Base Case: Single Glazed Windows
Figure 4.6.1 UDI and Sky view factor study for base case. (Source: Radiance and Ladybug)
Introduction - Overview - Outdoor - Indoor - Conclusions - References
34 | AA SED | Msc + MArch | 2022-23
Existing UDI near the windows is around 40-50% Demarketed area shows 50-100% UDI 2 3 4 1 80 90 100 70 60 50 40 30 20 10 0 UDI (300<lux<3000) In % Sky View Factor: 28% North Facade NNW NW WNW WSW SW SSW SSE SE ESE ENE NE NNE W S E N 1 2 3 4 Sky View Factor: 11% South East Facade NNW NW WNW WSW SW SSW SSE SE ESE ENE NE NNE W S E N Sky View Factor: 12% North West (towards galleria) NNW NW WNW WSW SW SSW SSE SE ESE ENE NE NNE W S E N Sky View Factor: 1% Central Area N E S W NNE NE ENE ESE SE SSE SSW SW WSW WNW NW NNW
4.7 Daylight Study: Orientation Study
In continuation, the three spots marked 1,2 and 3 were further categorized under their respective orientation being North, South East and North West.
Furthermore, in this study, different iterations being 40%, 50%(Base Case), 60% and 90% (full glazing) were tested out for their respective UDI.
The results showed that the base case WWR i.e. 50% for the South East oriented workstations provides the necessary amount of UDI whereas for the North and the North-west Side , a higher WWR is required. The main reason behind these orientations having low UDI, which the Northern orientated zone receives, is due to the diffused light.
Furthermore, another cause for this phenomenon is that, the north-western zone consists of the galleria area with a glass barrel vault. This partially blocks part of the daylight entering the space as shown in the previous section 3.7.
Since the Hay’s Galleria is a grade II listed building, the requirement to change the façade for better daylight cannot be put forward as a strategy.
South East North North West
Moran office at Hay’s galleria | 35
Hilson
40% WWR 10% reduced than Base case 50% WWR Base case 60% WWR 10% more than Base case 90% WWR Typical O ce Glazing 80 90 100 70 60 50 40 30 20 10 0 UDI (300<lux<3000) In % Figure 4.7.1 Matrix for Daylight study with respect to orientation and WWR. (Source: Radiance) Introduction - Overview - Outdoor - Indoor - Conclusions - References
Furthermore, on plotting the UDI levels of the three workstations on a section, we conclude that the light entering the space is within desirable levels only till about 3.5-4m for the North and the South-eastern direction. Moreover, for the North-western direction, it is a little over 2.5m.
These studies combined with the issues explained by the users of the space through interviews, we conclude that there is a need to re-arrange the layout of the workstations for better daylight access for the users. The swapping of the central zone, which currently acts as a space for workstation with the South-eastern zone, which is currently designated as the conference area, creates an office layout where each workstation then gets a proper daylight and visual access to the outside.
Athough the North and South East provide desired UDI till approx. 4 meters from the window, the North-western direction needs to be further looked at with design changes to achieve better levels of daylight.
Figure 4.7.2 Proposal for change in zoning of office layout.
Figure 4.7.3 UDI study: Light penetration in section for different orientations. Introduction - Overview - Outdoor - Indoor - Conclusions - References
36 | AA SED | Msc + MArch | 2022-23 South East North North West
75%
4 0% 5 0% 6 0% 9 0% 4 0% 5 0% 6 0% 9 0% 4 0% 5 0% 6 0% 9 0% 0 1 2 3 4 5 6 0 1 2 3 4 5 6 0 1 2 3 4 5 6 Existing UPS CUP'D Existing UPS 6
N
SE
N No exposure to outside 5.5-6.0m 5.5-6.0m
12.0
Conference Areas
South East North North West 0%
0%
75% 50%
4 0% 5 0% 6 0% 9 0% 4 0% 5 0% 6 0% 9 0% 4 0% 5 0% 6 0% 9 0% 0 1 2 3 4 5 6 0 1 2 3 4 5 6 0 1 2 3 4 5 6 Existing UPS CUP'D Existing UPS
N
SE
N No exposure to outside
0% 100% 75% 50% 25% 0% 100% 75% 50% 25% 0% 100%
50% 25%
m 4 m
Facade (River Facing) NW Facade (Galleria)
Facade
5.5-6.0m
m
(Seldomly used spaces) Workstations
100% 75% 50% 25% 0% 100% 75% 50% 25%
100%
25%
6 m 4 m
Facade (River Facing) NW Facade (Galleria)
Facade
5.5-6.0m 5.5-6.0m 5.5-6.0m 12.0 m Conference Areas (Seldomly used spaces) Workstations
4.8 Daylight Study: Ceiling Iterations
The North West oriented workstation was taken further to test iterations and propose new design strategies for better daylighting. Additionally. numerous iterations of volume were tested out to improve daylight conditions. The ceiling iterations were taken forward from the previous section 4.5.
Iterations 03 and 04 showed a potential to achieve desired UDI within those scenarios. In doing so, the UDI range that was initially 2.5m away from the window was increased to about 4-6 meters.
These ceiling strategy can be used throughout the office layout to attain better levels of UDI for each orientation.
Hilson Moran office at Hay’s galleria | 37
80 90 100 70 60 50 40 30 20 10 0 UDI (300<lux<3000) In % 0 1 2 3 4 5 6 Base Case Iter- 01 Iter- 02 Iter- 03 Iter- 04 0% 100% 75% 50% 25% Figure 4.8.2 UDI study: Light penetration in section for N-W facade. Figure 4.8.1 Matrix for Daylight study for different ceiling iterations. (Source: Radiance)
References
Base Case Iteration 01 Iteration 02 Iteration 03 Iteration 04
Introduction - Overview - Outdoor - Indoor - Conclusions -
4.9 Daylight Study: Glare Analysis
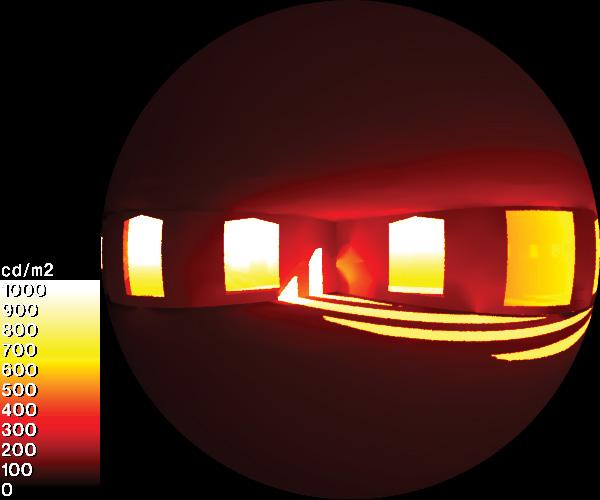
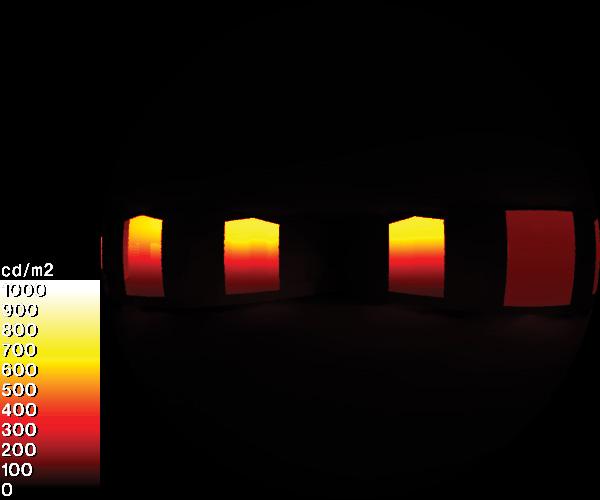
One of the most important observations made was that the windows facing the South East remained shut, in the morning, using blinds during the operational hours of the office.
Since major work in the office is based on computers, the need to check for possible glare was tested out. The point in time simulation for lux levels on the South-eastern direction was carried out on 21st June (Summer Solstice), 21st Sept (Equinox) as well as 21st Dec (Winter Solstice). The results showed that there is a possibility of glare from March-Sept within the timeframe of 9am-12pm.
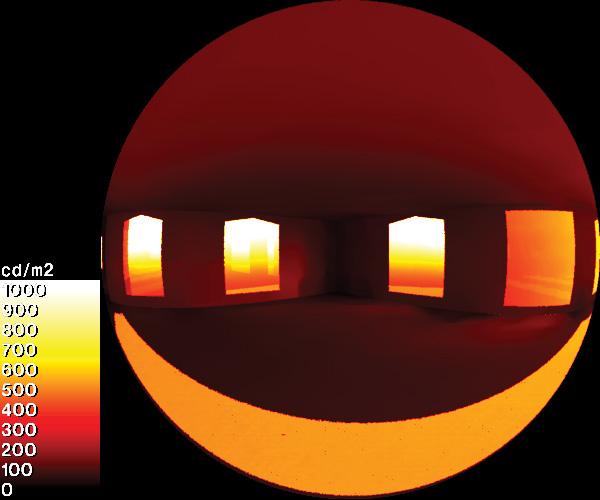
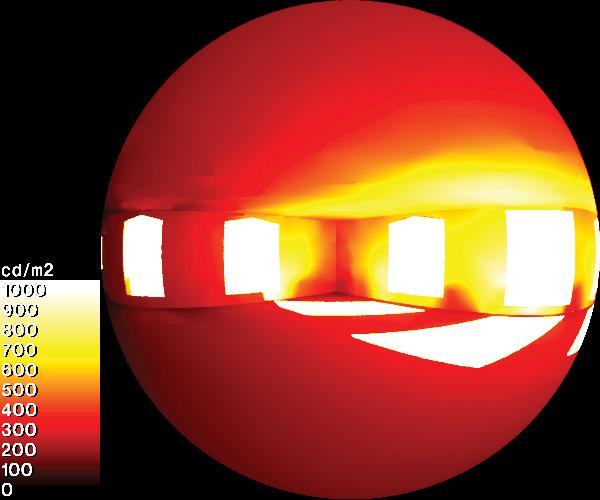
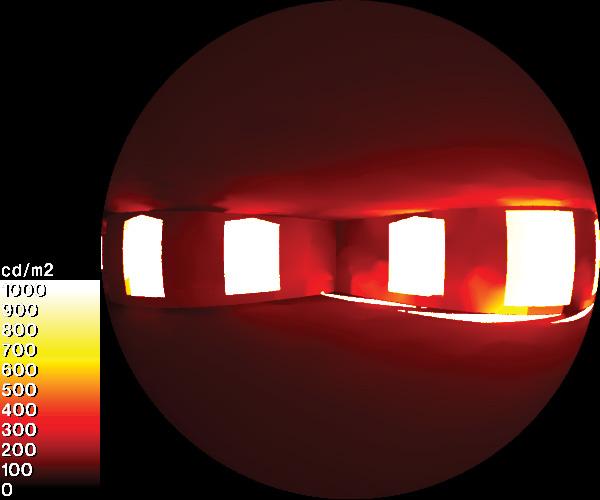
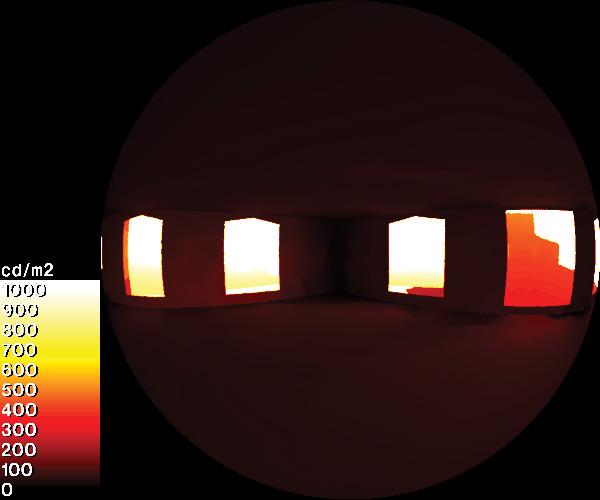
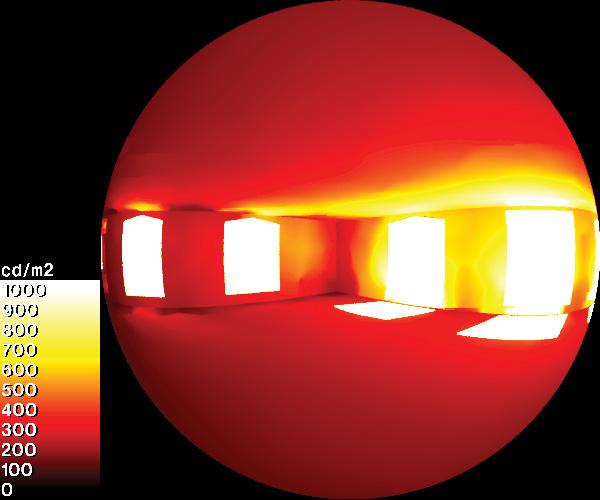
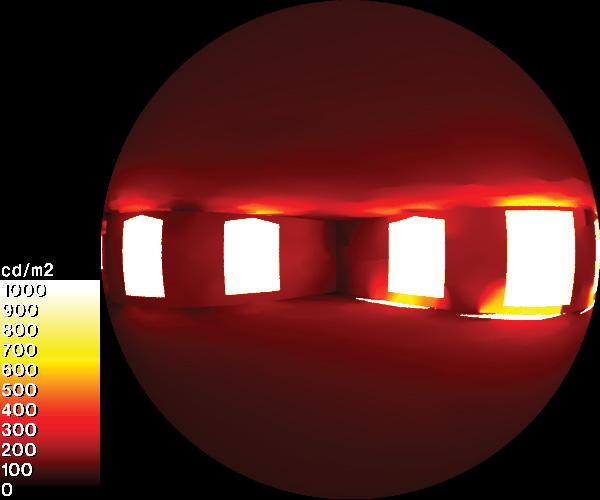
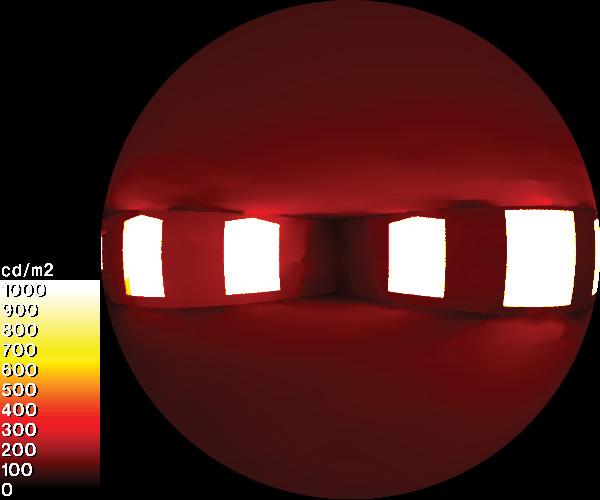
Therefore, current base case strategy of using blinds to avoid possibility of glare allows the users a choice of adaptability by deciding the percentage of closure of the blinds.
38 | AA SED | Msc + MArch | 2022-23
Point in time: June 21st (4:00 pm) Point in time: June 21st (9:00 am) Point in time: June 21st (12:00 pm) Possible Glare Issues: Need
it to be shaded Point in time: Sept 21st (4:00 pm) Point in time: Sept 21st (9:00 am) Point in time: Sept 21st (12:00 pm) Point in time: Dec 21st (4:00 pm) Point in time: Dec 21st (9:00 am) Point in time: Dec 21st (12:00 pm) 0 100 200 300 400 500 600 700 800 900 1000 cd/m2 90° 0° 45° 135° 180° 225° 270° 315° Figure 4.9.1 Point in time Illuminance study with false colour for glare analysis. (Source: Radiance) Figure 4.9.2 Sun path masking for possible glare hours.
Outdoor
Indoor
Conclusions
References
for
Introduction - Overview -
-
-
-
4.10 Daylight Study: Conclusion
Another major issue identified with the lighting of the space was that the ceiling light panels of a 3-4 workstations were connected on a single switch. Therefore, although the natural light was enough for certain parts of the workstation, the users had to roll down the blinds in order to avoid excessive light within the space. To mitigate this, we propose desk lights for the users thereby allowing them more adaptability of light and the use of pendant lights in place of the ceiling lights wherever required.
The proposed ceiling form along with new strategies in lighting fixtures and current adaptable strategy of the blinds work in combination to help enhance lighting levels in the space.
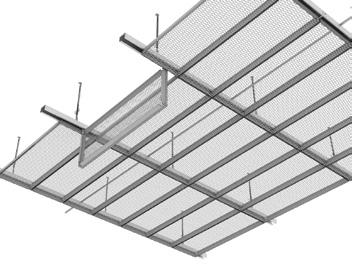
The lights are connected in series and therefore all lights turn on together
The exposing partial ceiling with retaining part of it as mesh ceiling
Suspended false ceiling Pendant lights wherever ceiling light is needed
Blinds for adaptable shading
Desk lights
Base Case Proposal
Figure 4.10.1 Design proposals according to daylight study
Introduction - Overview - Outdoor - Indoor - Conclusions - References
Hilson Moran office at Hay’s galleria | 39
4.11 Ventilation Study: Single-sided Ventilation

For the entire study, the average of highest temperatures of the hottest month was taken into consideration to test the required air changes for the worst conditions.
In order to check the effects of compartmentalizing of the working areas, a (6 X 4)-meter box of 3.6 meter height was compared to the same sized box with lower volume (2.4 meters height), in the SE zone with type B windows.


Considering single sided ventilation, in cases 2 & 3, even the air changes required for fresh air is not achieved whereas Case 1 does so, even with lower percentage of operable area. Due to inef-fective turbulent wind circulation, there is a rise in indoor temperatures.
When simulating the current scenario of compartment having 2.4 meters height, the trends are similar but after about 10-12 ACH, more amount of ACH is needed to achieve the same temperature difference.
Around 41 air changes are required for cooling which achieves a temperature difference of 0.7 °C. This illustrates that there is cer-tain amount of heat which is always retained.
Figure 4.11.1 Effects of Air Changes on Cooling with Volume (Single Sided Type B). (Source: Optivent)
Introduction - Overview - Outdoor - Indoor - Conclusions - References
40 | AA SED | Msc + MArch | 2022-23
Optimum amout of Air Changes
25 JULY 2022 0 1 2 3 4 5
0 2 67 0 96 0 89 8 17 16
4 2 1 31 1 22 12 2 25
7 5 4 6 6 1 6 2 2 5 1
0 5 10 15 20 25 30 0 18% 26% 28% 55% 81% 18% 26% 28% 55% 81% A
r C
( II ) Number
Tempera
(
)
0 4 98 2 84 3 06 15 2 31
3 32 1 91 2 05 10 14 20
5 3 4 2 4 9 4 8 2 5 1
0 5 10 15 20
0
( III
Adaptive Comfort Band Adaptive Comfort Band
(6 x 4 x 2.4) (6 x 4 x 3.6) (4 x 4 x 2.4) u Mtr (4 x 4 x 3.6)
92
32
5
i
h a n g e s P e r H o u r Operab e Area
o A r Changes
ure Di ference
I
Number of Air Changes
38
93
6
25 30 35
A i r C h a n g e s P e r H o u r Operable Area Tempera ure D ference
) Number of A r Changes ( IV Number of Air Changes I I II III IV
Similarly, in the NW zone with type A windows, an effort to study the effects of lowering the volume even further was undertaken.
It can be observed that there is a large temperature drop in open-ing windows from case A to B even though the incremental percent-age of area opened is relatively small at 12 %. Also, the air chang-es increase by a multiple of 5.
Furthermore, if we lower the height by around 1.2 metres from 3.6, there is a massive increase in required air changes to produce the same temperature drops. This is due to heat getting trapped inside the space.
Moreover, when all the panels are opened, air changes required for cooling which is around 38, isvv achieved.
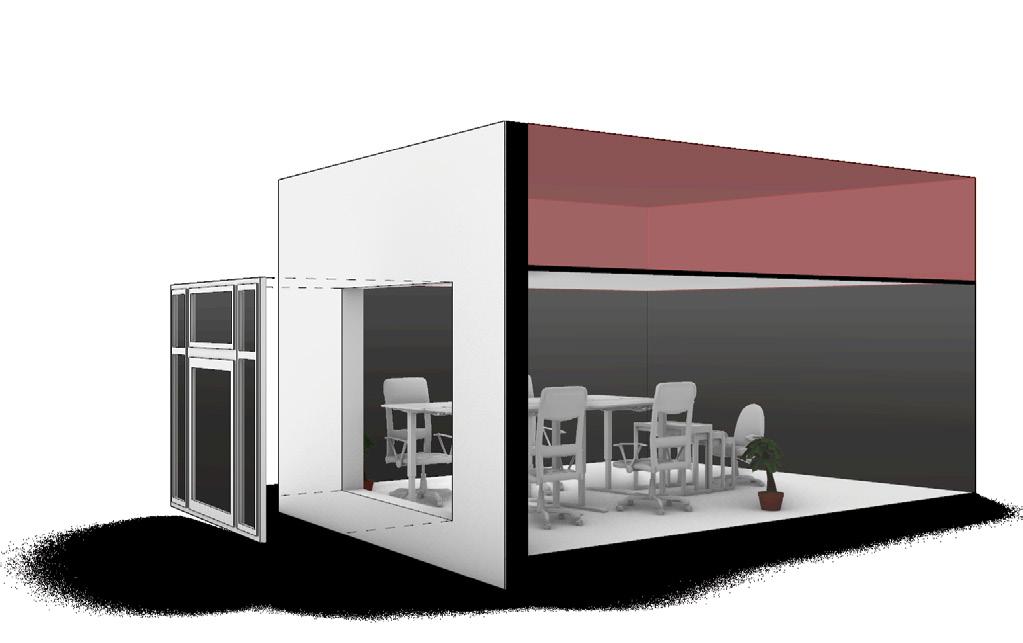
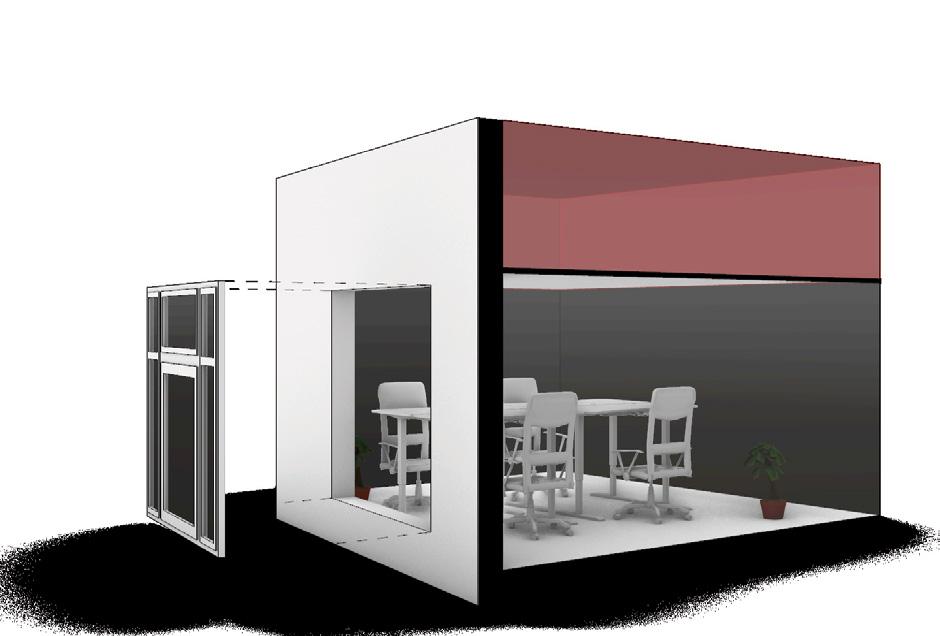

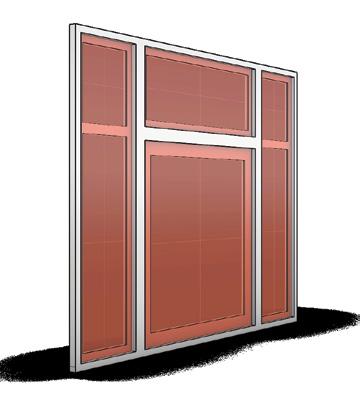
Figure 4.11.2 Effects of Air Changes on Cooling with Volume (Single Sided Type A). (Source: Optivent)
Introduction - Overview - Outdoor - Indoor - Conclusions - References
Hilson Moran office at Hay’s galleria | 41
JULY 2022
( ) Number o A r Changes 2 42 10 35 14 62 18 89 0 3 6 15 51 21 92 28 33 5 3 3 7 1 9 1 5 1 2 0 5 10 15 20 25 30 0 34% 46% 65% 84% 34% 46% 65% 84% A i r C h a n g e s Per Hour Operab e Area II ) Number o A r Changes Tempe a ure Di ference 0 3 62 15 52 21 93 28 34 5 4 23 27 32 88 42 49 5 3 3 7 1 9 1 5 1 2 0 5 10 15 20 25 30 35 40 45 0 A i r C h a n g e s P e r H o u r Operable Area ( III ) Number o A r Changes Temperature D f erence ( IV ) Number o A r Changes Optimum amout of Air Changes Adaptive Comfort Band Adaptive Comfort Band 0 A B C D 25
(6 x 4 x 2.4) (6 x 4 x 3.6) (4 x 4 x 2.4) (4 x 4 x 3.6) I II III IV
4.12 Ventilation Study: Cross Ventilation


Forbye, av section of the floor plate was considered to check if there will be any cross-ventilative flows which were taken from SE to NW due to pressure difference cause by wind velocity. Also, the thumb rule of 1:5 width to height ratio established by CIBSE was checked. Thereafter, operative areas of windows were changed according to present panels, this was considered as the building is a grade 2 listed structure.
The results observed are as follows:
- Lower operative temperatures as well as higher air chang-es were observed in case 1 (18%) when compared to cases 2 & 3. This is due to the stack effect.•
- There is no difference in terms of air changes between top opening to bottom openings, as can be seen in cases 2 & 3. This is due to the turbulence caused in flows of air intake vs outtake.
-The differences in drops of temperature becomes incremen-tal after around 5 – 6 Air Changes per hour.
- When comparing fully opened windows to opening only half, there is around 0.9 °C temperature drop only. Moreover, to achieve another 0.9 °C temperature difference, the Air Changes needs to be tripled.
42 | AA SED | Msc + MArch | 2022-23
18% 26% 28% 55% 81% Current Current Adaptive Comfort Band 34% 46% 65% 84% A B C D 2 1 1A 3 4 5 2A 3A 4A 5A 5B 5C 5D 25 °C JULY 2022 0 2 69 3 88 3 66 5 85 6 71 8 21 9 79 10 74 6 9 4 3 3 3 4 2 6 2 4 2 1 1 9 1 7 0 2 4 6 8 10 12 0 1 2 3 4 5 6 7 8 A i r C h a n g e s P e r H o u r Number of Ins ances (operab e area) Number o A r Changes Tempera ure D f erence Optimum amout of Air Changes 324 Cu Mtr (5 x 18 x 3.6) 216 Cu Mtr (5 x 18 x 2.4) Proposed Proposed Figure 4.12.1 Effects of Air Changes on Cooling (Cross Ventilation). (Source: Optivent) Introduction - Overview - Outdoor - Indoor - Conclusions - References
4.13 Ventilation Study: Conclusions
At the inception of this study, through computational fluid dynam-ics, it was ascertained that there is around 0.5 – 0.7 meters per second of wind flow on the south-eastern façade of the office.
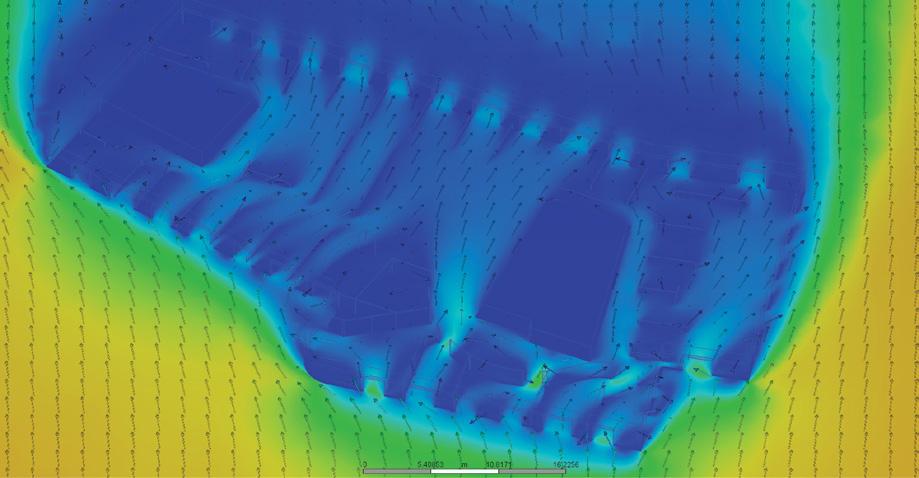
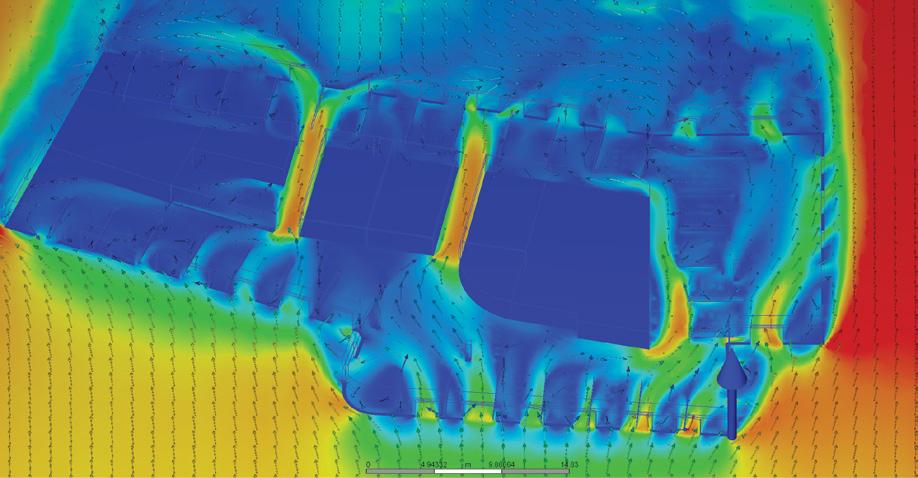
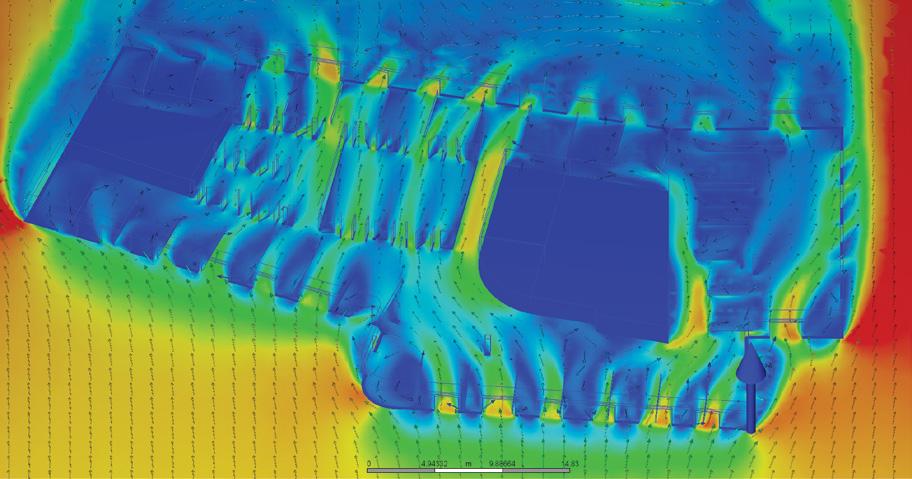
Furthermore, due to the enclosed galleria space, it was assumed that there will be minimal amount of wind flows on the north-west-ern façade. Southern façade was also considered, as the predomi-nant wind direction is from south-west to north west which reverses direction during the fall season.
Thereafter, MinT calculations awere conducted to get operative temperatures inside the office with no ventilation to ascertain the heating loads generated. These two parameters were taken as in-put to simulate the required and achieved air changes on optivent, which were again taken back to MinT to calculate the reduction in temperatures achieved through ventilation.
Conclusions based on the ventilation study states that for deep plan spaces, cross ventilation is insufficient. Therefore, there is a need to compartmentalise the space into relevant zones with me-chanical ventilation wherever cross ventilation in infeasible. Within those zones, higher volume spaces are preffered over low volume. In terms of window opening sizes, it can be stated that there is no supplemental benefit to opening more than 60-70% operable area of the entire window, given that WWR is around 50-60%.
INDOOR STUDY
Layout optimisation of indoor spaces was tested to augment the wind flows.
In the base case (current) scenario, due to the shape and orien-tation of the building, maximum amount of wind doesn’t enter the office directly. However, cross ventilation occurs due to the differ-ence in pressures. As can be observed, there are multiple zones with no wind flows.
To improve this further, testing of conference reorganisation was done, as is the proposed scenario. However, due to the presence of blocks, extreme contrast of winds flows in only the passageway region was observed. Nonetheless, there still are zones with no wind flows.
In the final scenario, adaptable panels for conference walls were tested. The resultant distribution of flows were descried to be much better due to openable ceiling to floor panels with user customisa-tion.
6mdepthgoodfor ventilation
Hilson Moran office at Hay’s galleria | 43
Single sided buoyancy driven ventilation Operable area required for adequate ventilation
Partition walls to be added to separate zones Mechanical ventilation Base
Conference Reorganization Adaptable Organization 0 0.5 1 Velocity Magnitude - m/s
Case
Partition added Base Case 0 0.5 1 Velocity Magnitude - m/s
Introduction - Overview - Outdoor - Indoor -
- References
6mdepthgood ventilation
Figure 4.13.1 Design proposals according to ventilation study Figure 4.13.1 CFD analysis for indoor layout (Source: Autodesk CFD)
Conclusions
4.15 Thermal Study: Base Case Annual Performance
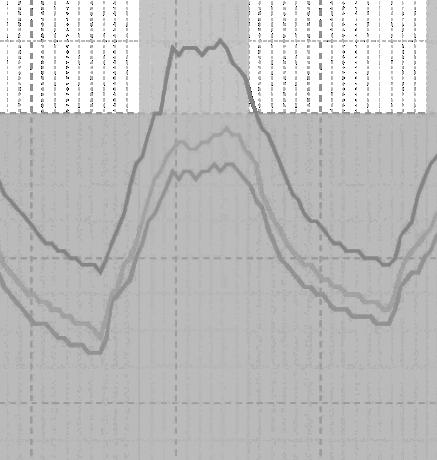
Thermal simulation of the base case was performed in its free running mode with the outdoor temperature and radiation as shown in figure 4.15.1 and figure 4.15.3 respectively. The higher radiation levels during June to Aug show possibilities of higher solar gains within the space resulting in higher indoor operative temperatures compared to the period between Oct to April. The indoor operative temperatures thus obtained were analyzed and heating, cooling and comfortable periods were identified in accordance to the comfort band EN-15251.
The cooling period season ranges from June to Aug where the indoor operative temperatures of the space reach up to 35⁰C and the heating period ranges from Oct to April where the temperatures can go as low as 5⁰C.
The identified periods need to be countered through strategies which help in getting the internal operatives temperatures within the comfort range in return helping save energy usage.
Introduction - Overview - Outdoor - Indoor - Conclusions - References
Hilson Moran office at Hay’s galleria | 45
Jun July Aug Sept Oct Nov Dec 5.0 0.0 8.0 11.0 14.0 17.0 20.0 23.0 26.0 29.0 32.0 35.0 C 0 Energy (kWh) 70 140 210 280 350 420 490 560
July
Sept Oct Nov Dec Solar Gains
July Aug
Dec
Heating Period Cooling
Jan 00:00 06:00 12:00 18:00 00:00 Feb Mar April May
630 700 Jan Feb Mar April May Jun
Aug
Jan 00:00 06:00 12:00 18:00 00:00 Feb Mar April May Jun
Sept Oct Nov
Heating Period
Period Figure 4.15.1 Annual Outdoor Dry Bulb Temperature chart. (Source: Honeybee) Figure 4.15.2 Base case Indoor operative temperature chart. (Source: Energy plus) Figure 4.15.3 Base case monthly solar gains. (Source: Energy plus)
4.16 Thermal Study: Typical Summer Week
This section discusses the comparison of base case scenario’s performance over a typical summer week with different strategies that can be used to get the internal operative temperatures within the comfort range. The period from 17th-23rd July was selected for analysis. The outdoor temperature within this period ranges from 16-21⁰C diurnally.
Observation for the different strategies tested are as follows:
I: Base Case
The operative indoor temperatures during the office period range between 24⁰C and 27⁰C, which is on higher side.
II: Double Glazed Units (U-value of 2.86 W/m²K)


Since the solar gains through the single glazing windows were identified as bieng substantially high during the summer, a strategy with double glazing windows was tested out which showed about 0.5⁰C-1⁰C drop in the operative temperature.
III: Natural ventilation
Using natural ventilation as a strategy with a set point for the internal operative temperatures between 24⁰C-27⁰C was used. The window operable areas were according to the ventilation study discussed earlier section 4.15. This strategy showed a drop of 1⁰C-1.5⁰C from the base case temperatures.
IV: Night ventilation
In order to further optimize the indoor temperature, night ventilation was used. Night flushing was made operational during scheduled hours between 9pm and 6am. This helps to cool down the space during the night time thus reducing the indoor temperatures by 1⁰C-2⁰C within the space during operational hours.
Figure 4.16.1 Hourly mean indoor operative temperature for selected summer week with different strategies. (Source: Energy Plus)
Introduction - Overview - Outdoor - Indoor - Conclusions - References
46 | AA SED | Msc + MArch | 2022-23
28
17th July Monday 18th July Tuesnday 19th July Wednesday 20th July Thursday 21st July Friday 22nd July Saturday 23rd July Sunday Temperature ( ⁰ C) Time
Natural Ventilation (Setpoint) Outdoor Temperature Day time Hours Office Working Hours Global Horizontal Radiation Glass U-value: Min. Indoor Temp 24⁰C Max. Indoor Temp - 27⁰C 9pm to 6am Base case: No Insulation Strategy 03: Natural Ventilation with Setpoint OUT IN I III IV
II 0 2 4 6 8 10 12 14 16 18 20 22 24 26
00 : 0 0 0 6 : 0 0 1 2 : 0 0 18:00 00 : 0 0 0 6 : 0 0 1 2 : 0 0 18:00 00 : 0 0 0 6 : 0 0 1 2 : 0 0 18:00 00 : 0 0 0 6 : 0 0 1 2 : 0 0 18:00 00 : 0 0 0 6 : 0 0 1 2 : 0 0 18:00 00 : 0 0 0 6 : 0 0 1 2 : 0 0 18:00 00 : 0 0 0 6 : 0 0 1 2 : 0 0 18:00
Wh/m2 80.0 0.0 160.0 240.0 320.0 400.0 480.0 560.0 640.0 720.0 800.0
All the strategies specified in section 4.18 resulted in lowering the indoor operative temperature to some extent and therefore simulation was further done to check the effect of combining these different strategies.
V: Combination
As illustrated in the figure 4.16.2, strategies (I+II+III+IV) were combined to form a new strategy. It was done to allow ventilation for 24 hours with scheduled natural ventilation during day time and night ventilation in the other half. This combination resulted in a drop of 2-2.5⁰C compared to the base case.
The thermal simulation graph as well as our previous datalogger and MinT analysis showed that low exposed wall area to voulme ratio increases the internal heat storage resulting in increased indoor temperatures.
VI: Volume change
In order to increase the volume, the false ceiling is removed and floor to ceiling clear height is changed from 2.4 metres to 3.6 metres. The volume change was simulated along with the combination of previous strategy.

The resultant operative temperatures lie within the comfort band during the operational hours of the office and thus eliminates the cooling loads with the use of passive strategies.
Figure 4.16.2 Hourly mean indoor operative temperature for selected summer week with combined strategies. (Source: Energy Plus)
Introduction - Overview - Outdoor - Indoor - Conclusions - References
Hilson Moran office at Hay’s galleria | 47 2.4 M Strategy 05: Combination Strategy 06: Volume Change I V V Volume change VI II III IV 0 2 4 6 8 10 12 14 16 18 20 22 24 26 28 00 : 0 0 0 6 : 0 0 1 2 : 0 0 18:00 00 : 0 0 0 6 : 0 0 1 2 : 0 0 18:00 00 : 0 0 0 6 : 0 0 1 2 : 0 0 18:00 00 : 0 0 0 6 : 0 0 1 2 : 0 0 18:00 00 : 0 0 0 6 : 0 0 1 2 : 0 0 18:00 00 : 0 0 0 6 : 0 0 1 2 : 0 0 18:00 00 : 0 0 0 6 : 0 0 1 2 : 0 0 18:00 17th July Monday 18th July Tuesnday 19th July Wednesday 20th July Thursday 21st July Friday 22nd July Saturday 23rd July Sunday Temperature ( ⁰ C) Time Wh/m2
Base Case Combined Volume change Outdoor Temperature Comfort Band Day time Hours Night time Hours Office Working Hours Diffused Horizontal Radiation Global Horizontal Radiation Weekend Hours
M
80.0 0.0 160.0 240.0 320.0 400.0 480.0 560.0 640.0 720.0 800.0
3.6
4.17 Thermal Study: Typical Winter Week
This section discusses the comparison of base case scenario’s performance over a typical winter week with different strategies that can be used to get the internal operative temperatures within the comfort range. The period from 06th-12th Dec was selected for analysis as shown in figure 4.17.1. The outdoor temperature within this period ranges from 1-10⁰C diurnally.
Observation for the different strategies tested are as follows:
I: Base case
The operative temperatures during the office period range between 10⁰C and 12⁰C.
VII: Thermal Insulation
Since the base case is not insulated, a thermal mass with a lower u-value (Existing material + insulation) was tested out. The resultant u-value of the insulated wall was brought down to 0.34 W/m²K from 1.30 W/m²K. The resultant indoor temperatures showed about 0.5-1⁰C rise within the space. The rise in temperature was marginal due to the low exposed wall area to volume ratio.


VIII: Night Shutters
As discussed in section 4.16, there is a high percentage of heat losses through windows. Most of these unwanted losses occur during the night, when no daylight or ventilation is required; this offers the opportunity to use night shutters as an adaptive option.
Night shutters in the simulation are 5cm thick panels with a thermal conductivity of 0.05 W/m²K. Overnight operation for the shutters to remain closed is scheduled between 9pm and 6am.This strategy was combined with thermal insulation which resulted in a further reduction o f 0.5-1⁰C.
However, the operative temperatures still fail to achieve indoor operative temperatures that lie in the comfort band.
Figure 4.17.1 Hourly mean indoor operative temperature for selected winter week with different strategies. (Source: Energy Plus)
Introduction - Overview - Outdoor - Indoor - Conclusions - References
48 | AA SED | Msc + MArch | 2022-23
0 2 4 6 8 10 12 14 16 18 20 22 24 26 28 00 : 0 0 0 6 : 0 0 1 2 : 0 0 18:00 00 : 0 0 0 6 : 0 0 1 2 : 0 0 18:00 00 : 0 0 0 6 : 0 0 1 2 : 0 0 18:00 00 : 0 0 0 6 : 0 0 1 2 : 0 0 18:00 00 : 0 0 0 6 : 0 0 1 2 : 0 0 18:00 00 : 0 0 0 6 : 0 0 1 2 : 0 0 18:00 00 : 0 0 0 6 : 0 0 1 2 : 0 0
06th December Wednesday 07th December Thursday 08th July Friday 09th July Saturday 10th December Sunday 11th December Monday 12th December Tuesday Temperature ( ⁰ C) Time
Base Case Insulation Night Shutters Outdoor Temperature Comfort Band Day time Hours Night time Hours Office Working Hours Diffused Horizontal Radiation Global Horizontal Radiation Weekend Hours VII VIII U-value: 1.30 W/m²K U-value: 0.34 W/m²K U-value: 0.5 W/m²K 50mm Mineral wool Insulation Base case: No Insulation Strategy 07: Ext. Wall Insulation Strategy 08: Night Shutters OUT IN I
VII
18:00
Wh/m2 80.0 0.0 160.0 240.0 320.0 400.0 480.0 560.0 640.0 720.0 800.0
Since the internal temperatures could not be increased any further with passive strategies,the strategy to use heating systems was relied upon to attain comfortable internal temperatures.
IX: Heating
The office space uses an inefficient VAV system with a setpoint of 22⁰C for heating. A more efficient way of heating with a setpoint of 20⁰C is proposed with a schedule as per the occupancy schedule without taking into consideration the non-occupied hours of the day.
The figure 4.17.2 shows that indoor temperature is now within comfort range during office working hours.
Further, the heating loads were reduced from 59.45 kWh/m2/yr to 45.11 kWh/m2/yr as indicated in the figure 4.17.2.
Figure 4.17.2 Hourly mean indoor operative temperature for selected winter week with heating loads. (Source: Energy Plus)
Hilson Moran office at Hay’s galleria | 49
:
:
0 1 2 : 0
: 0 0 0 6
0 0 1
: 0 0
0 0
0
0
:
0 0
0 0
0
: 0 0
06th December Wednesday 07th December Thursday 08th July Friday 09th July Saturday 10th December Sunday 11th December Monday 12th December Tuesday Temperature ( ⁰ C) Time
Comfort Band Day time Hours Night time Hours Office Working Hours Diffused Horizontal Radiation Global Horizontal Radiation Weekend Hours VIII IX Heating Setpoint: 20⁰C Strategy 09: Scheduled Heating Base Case Night Shutters Scheduled Heating Outdoor Temperature 0 10 20 30 40 50 60 Base case Strategy 09 59.45 kWh/m²/year 45.11 kWh/m²/year kWh
0 2 4 6 8 10 12 14 16 18 20 22 24 26 28 00 : 0 0 0 6 : 0 0 1 2 : 0 0 18:00 00
0 0 0 6
0
0 18:00 00
:
2
18:00 00 : 0 0 0 6 :
1 2 : 0
18:00 00 : 0 0 0 6 : 0 0 1 2 : 0
18:00 00
0
6 :
1 2 : 0
18:00 00
0 6 : 0 0 1 2 : 0 0 18:00
Wh/m2 80.0 0.0 160.0 240.0 320.0 400.0 480.0 560.0 640.0 720.0 800.0
Introduction - Overview - Outdoor - Indoor - Conclusions - References
4.18 Thermal Study: Proposed Annual Performance
Previous sections revealed a number of possible energy saving measures both in typical winter and summer conditions. This section proposes a combination of measures that will be applied to the base case model and tested on an annual basis. Simulation results will be compared to the Annual Base Case performance (See Section 4.14 and 4.15).
As per the previous analysis, overall strategies used were:
1. Double glazed U nits for windows
2. Natural ventilation
3. Night ventilation
4. Voulme change
5. Wall thermal insulation
6. Night shutters
7. Mechanical heating
In order to achieve comfort annually, these strategies were used in combination as shown in Fig.4.18.1. Simulation data shows that the indoor operative temperature is well within the comfort band for vast majority of office working hours.
Over the course of the year the heating demand is reduced by 25% from 59.4 kWh/m²/year to 45.11 kWh/m²/year. Whereas the cooling demand is reduced by 100% from 4.6 kWh/m²/year to 0.0 kWh/m²/year.
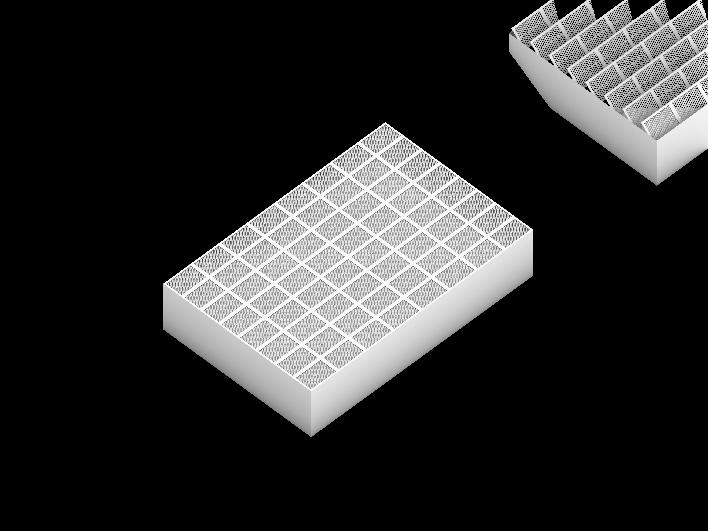
In the thermal simulations for summer and winter week it was observed that the volume change strategy used in summer results in drop of indoor temperature which is not desirable for the winters.
So to counter this a dynamic mesh ceiling panel is proposed as illustrated in Fig.4.22.2. During the winters, the ceiling mesh can be closed to restrict the height to 2.4m creating a smaller volume to retain heat. On the contrary, during summers, the ceiling mesh can be opened to create a height of 3.6 metres resulting in a larger volume to exposed area ratio.
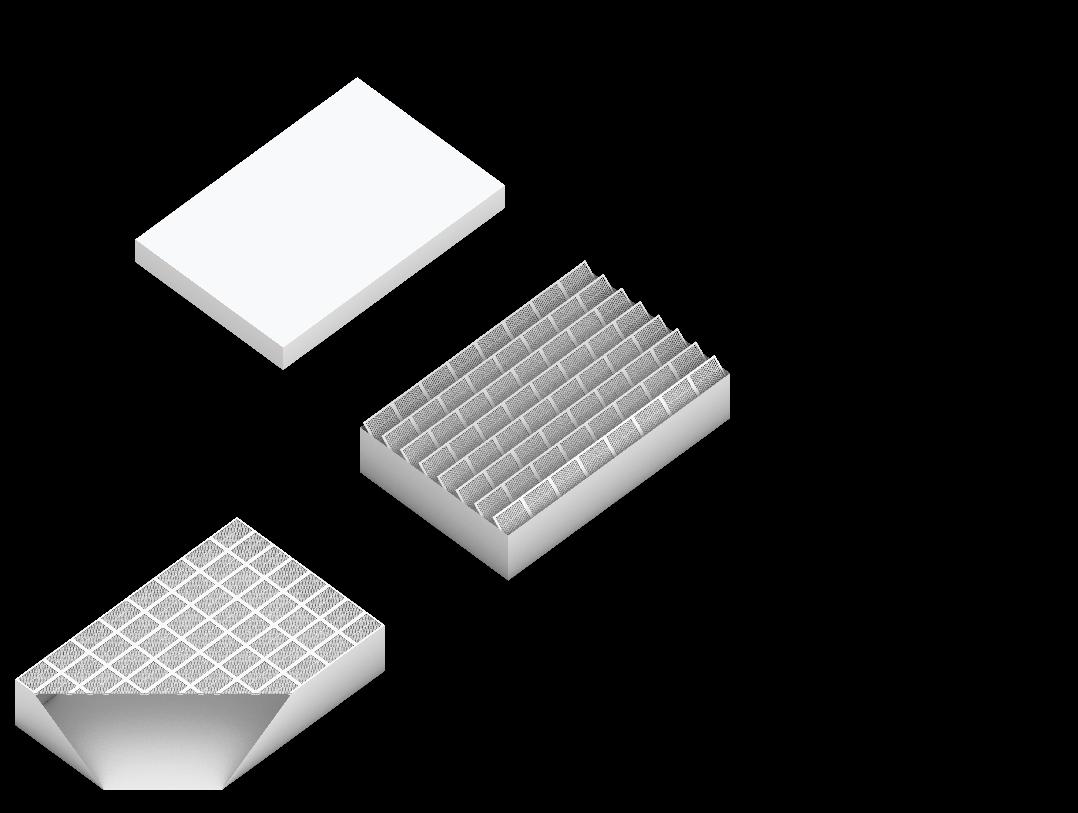
Volume Change - full height (3.2 metres)

Volume Change - Base case (2.4 metres) Wall Insulation Night Shutters Heating Loads
Figure 4.18.1 Annual hourly mean indoor operative temperatures with corresponding strategies illustrated. (Source: Energy Plus)
Figure 4.18.2 Ceiling design proposal.
Figure 4.18.3 Annual heating and cooling loads for proposed case.
Introduction - Overview - Outdoor - Indoor - Conclusions - References
50 | AA SED | Msc + MArch | 2022-23
0 2 4 6 8 10 12 14 16 18 20 0 2000 4000 6000 8000 10000 12000 14000 Jan Feb Ma Apr May Jun Ju Aug Sep Oc Nov Dec
Temperature
Months Hea ng
ng
Jan
March April May June July Aug Sept Oct Nov Dec Jan Feb March April May June July Aug Sept Oct Nov Dec
Glazed Unit
Heating (kWh)
( ⁰ C)
Coo
Avg.Outdoor Temperature 45.11 kWh/m²/year Heating 0.0 kWh/m²/year Cooling -4 -2 0 2 4 6 8 10 12 14 16 18 20 22 24 26 28 30 32 34 36
Feb
Temperature (⁰C) Double
Natural Ventilation (Setpoint between 24⁰C to 27⁰C) Night Ventilation (9pm to 6am)
200 0 400 600
1200 1400 1600 1800 2000
Comfort Band Diffused Horizontal Radiation Global Horizontal Radiation Indoor Operative Temperature Outdoor Temperature Winter Strategies Summer Strategies
2.4 metres 3.6 metres
800 1000
(Wh/m²)
Summer
This section discusses the overall strategies considering outdoor study, Indoor daylighting, ventilation and thermal analysis as discussed in previous sections.
Also, this section highlights a set of proposal for the new office which is to be re-located on the 2nd floor of same building in Hay’s Galleria complex.
Fig.4.19.1 demonstrates the design proposals to enhance the performance of the space according to our analysis. The summarised strategies are:
For Improving Daylight
A: Use of roller blinds to avoid glare.
B: Good visual connect and access to daylight for each workstation.
C: Interchanging layout of central zone and conference rooms to allow daylight access to all workstations.
D: Provision of pendant lighting wherever ceiling lights are required.
E: Provision of desk lights for more adaptability in usage of artificial lighting.
For better Ventilation
F: Provision of partition walls 6m away from the window to facilitate single sided ventilation.a
G: Allowing for single sided ventilation to reduce cooling loads during summer period.
H: Optimized openable areas to facilitate better ventilation in the space.
For Optimized thermal performance
I: Changing all single glazing windows to double glazing.
4.19 Thermal Study: Conclusions daylight6mdepthgoodfor andventilation
J: Exposing part of ceiling in a way where more daylight penetrates inside as well as to reduce heating demands.
K: Use of perforated mesh as ceiling panel to allow for a more large volume for better air movement.
L: Provision of night shutters helps reduce heating loads.
*All the strategies were considered with the limits of no change possible to facade according to the grade-II heritage building regulations.
Figure 4.19.1 A combined design proposals according to daylight, ventilation and thermal studies
Introduction - Overview - Outdoor - Indoor - Conclusions - References
Hilson Moran office at Hay’s galleria | 51
J A L B D
F K
I E H G C
05. CONCLUSIONS
General Conclusions
The Hay’s Galleria is a building that shows significant historical importance by going through several functional adaptations over the years from being a wharf to currently being a mixed-use typology. This importance of preserving history is why the building stands today as a grade II listed building. The Hilson Moran office is one such typology that functions in this mixeduse complex and therefore the study as discussed takes into account the Galleria as it’s micro-climate.
The project team conducted several fieldworks and computational simulations to understand how these spaces function and correlate to each other as a whole entity. The main conclusions deduced from the study are highlighted below:
• Several studies done on the glass roof of the galleria suggest that the space and the indoor qualities would function better with in the absence of the roof.
• By outlining some of the issues obtained from the users of the office and understanding the site constraints of the building façade certain conclusions were made with respect to daylight, ventilation and thermal properties of the interior space.
• The daylight quality can be improved by means of a vaulted or a stepped ceiling profiles although the source quality is reduced through the galleria roof. The change to desk lighting fixtures for occupants helps save energy as well as results in a more adaptable method of using lighting. The use of shading devices is advised towards the South west orientation to avoid possibility of glare.
• The office space currently fails to benefit from the natural ventilation. The study suggests otherwise, that there is a need to compartmentalise the floor plate into zones with single sided ventilation, since cross-ventilation is infeasible, in order to attain comfortable indoor operative temperatures. Furthermore, it was observed that the performance of larger volume was better than smaller one.
• With respect to the thermal properties, requirements to change the window to double glazing with u-value of 2.86 W/m2K from the base case window type of single glazing is advised (u-value 5.0 W/m2K). Moreover, the volume studies conclude the need for a larger volume during the summer and a smaller volume for the winter which is countered by using dynamic mesh panelling in the ceiling. Insulation added towards the inside results in marginal benefit towards the heat capacity, due to the low exposed surface area to volume ratio.
• Divisions of the open plan into smaller zones would help to focus on efficient ways of controlling smaller micro-climates rather than focusing on the office as a whole. This would facilitate in the above-mentioned strategy for single sided ventilation and also show significant reduction in energy consumption
These combinations of the proposals identified within each parameter of study can help in the betterment of environmental quality of the space. The above-mentioned proposals give a list of strategies that can be taken into consideration in the existing plan of re-locating the Hilson Moran office on the floor below (2nd floor) in the same building.
54 | AA SED | Msc + MArch | 2022-23
5.1
Introduction - Overview - Outdoor - Indoor - Conclusions - References
Personal Learnings
Divy Vora
The Term 1 project has helped me get a clear perspective of how environmental factors are so important and should be taken into consideration in designing a space. The surprising part of the case study for us personally was to find an office, that mainly deals with environmental consultancy themselves, refrain from using the power of environmental factors to their advantage for their own space.
The whole process from the initial bit of research moving on to fieldwork and eventually testing out models with computational tools has led to an in depth understanding of applying environmental theories in design practice. The site was a major advantage to the team because it helped in not just understanding inadoor studies but also how the outdoor can act as a microclimate for its surrounding.
Different topics led to different learning outcomes and the correlation of outcomes with one another taught us how an environmental factor cannot be used to its 100% potential but a balance of these factors is what forms an efficient design strategy for any space.
Lastly, this exhaustive process of findings and learning outcomes have led to immense enthusiasm and we look forward to using the acquired skills in order to design for the next term. The learning and lectures have made sure to always keep in mind, that environmental factors are not an add on to the design but they help the design evolve further.
Sarab jot Singh
The outcome of this research is a combination of group and individual studies which helped me with an in-depth understanding of the parameters involved in the design process. In this study, Ventilation proved to be one of the key inputs required to augment the space reorganisation. By design, this study explored the possibilities of improving the ventilation by taking into account an average of the hottest days from the 3 hottest months in the year. In doing so, the worst case was taken into account thereby ensuring the relevance of the proposed strategy throughout all the scenarios. The experimenting in the research was conducted to optimised the air changes required as well as the volume needed.
One of the key personal learning outcomes for me was to grasp the explorative power of researching any topic. This is one of the most important learning for me since experimenting to derive solutions was rarely done by me in my previous study. Another equally important outcomes for me were to solve issues with a mindset of cojoining various tools of research. Implementation of tools in a real-world scenario to propose solutions, as student of the field, for professional was an enthusiastic journey for me.
Lastly, through the course of this study, I got to absorb critical thinking and analytical mindset from the crème de la crème of the profession. Moreover, I got to learn a lot from my peers during the groupwork who have been nothing but supportive towards me and each other.
Stavan Gang
The analysis of Hilson Moran’s office in Hay’s Galleria for term 1 Project has given me a new perspective for designing office buildings. In the lectures, I got introduced to various new theories about environmental design. This case study has helped to understand them better. The site visits to Hay’s Galleria provided opportunities for me to investigate the building through readings and observations which helped me acquire a practical understanding of the theories taught in lectures.
Hay’s galleria being a grade-2 heritage building has a relatively old-fashioned brick façade with WWR of approx. 50%. This gave us a good opportunity to study the environmental aspects of an office space in a non-conventional setup keeping in mind the constraints that cannot be changed. The process of analysis within the project has given us a clear understanding of annual demands and performance of the building and the learnings have helped us in identifying design solutions through the lens of environmental factors.
The repeated back and forth process of field-work, assessing theories and testing them out on computational tools has given us a better understanding of a very realistic scenario of how an environmental building design evaluation is conducted.
The whole process from the beginning till the end has made us feel very confident and equipped us with knowledge to explore various design ventures and ideas for the next term design project.
Wang
The project under study is interesting and challenging, and as a building that incorporates atrium daylighting design is sustainable. During the study, the historical context of the building is explored, the attitudes of the local people and the influence of the surrounding environment are observed, and the conclusions are then reflected upon in terms of their contemporary economic value and future trends.
The interviewing of office sites and the measurement of data is very innovative, from learning how to use the equipment to analyzing the data and using it to carry out simulations, the subject maintains a rigorous process and rational thinking. The lectures and tutorials helped me to expand my knowledge and to understand the basic principles of sustainable architecture.
office at Hay’s galleria | 55
Hilson Moran
Yanfai
Introduction
References
5.2
- Overview - Outdoor - Indoor - Conclusions -
06. REFERENCES
Information and data provided by Hilson Moran office Plans Material’s Technical Information
Books and research papers
1. Cameron, E., Stojkovic, M., Saranti, K. & Conto, O., 2011. Redefining Pavillions: Improving upon Outdoor Comfort Conditions. PLEA 2011, pp. 13-15.
2. Reinhart, C., 2014. Daylighting Handbook: Fundamentals, Designing with the Sun, Vol.1. s.l.:Christoph Reinhart.
3. HLW, 2022. Hay’s Galleria, Issue 6. [Online] [Accessed October 2022].
Computational Tools
1. Autodesk CFD
2. Ladybug / Honeybee
3. Open Studio & Energy Plus
4. Radiance
5. Rhino 6. Excel MinT Spreadsheet
Tools:
1. Spot measurement tools (temperature/ relative humidity/ lux)
2. Data loggers (temperature/ relative humidity)
Others:
1. Berkeley clima Tools - https://clima.cbe.berkeley.edu/
2. London Wunderground data - http://www.wunderground.com
3. Hay’s Galleria official website - https://www.hays-galleria.com/
4. Optivent - https://naturalcooling.co.uk/optivent
5. EPW File - https://climate.onebuilding.org/
Introduction - Overview - Outdoor - Indoor - Conclusions - References
office at Hay’s galleria | 57
Hilson Moran
06 References
07. APPENDICES
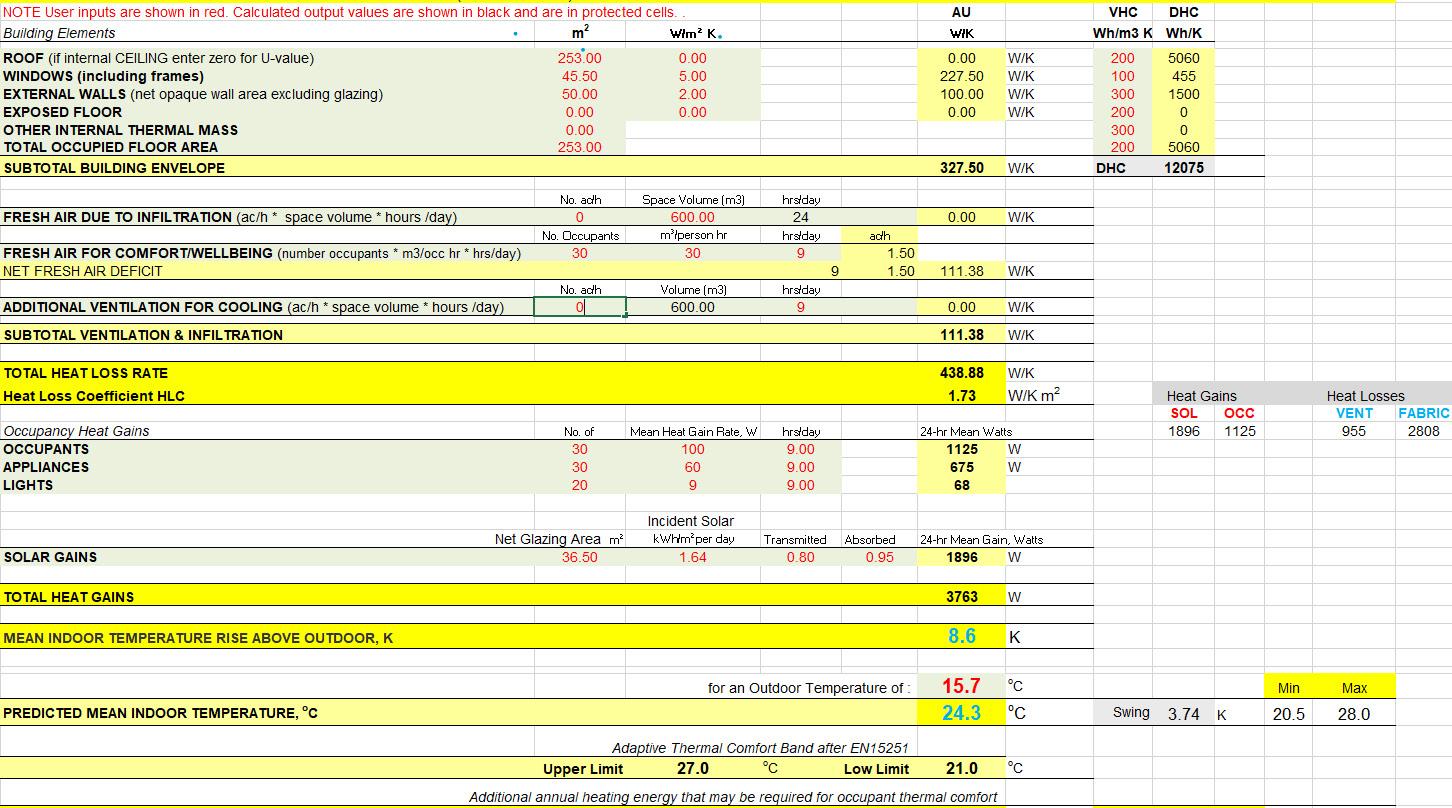
60 | AA SED | Msc + MArch | 2022-23 MinT Sheet
maybe a b t c oser to the w ndow when here s some sun en er ng he ki chen I go there o work
more pass ve means of dayl ght natura ven i at on for fresh air
e c oser o he w ndows near Zone 5 o en oy he outdoor v ews The sea ng eels a bo a away rom he w ndows
The ndoo s fee p easan and thermal y comfor ab e wh le I ee the
wear ng hin ong s eeved c othes ayout could be a tered to enhance dayl ght ng further
Due o the ee s w hout he presence o day gh ng The w ndow are ac ng the No th-Wes or en a on so
deep floo p an dark
m ted dayl ght ng is ava lable Ar i icial l ght ng s used th oughout he day nex o he window dayl ght
No I persona y haven t expe ienced any acous c ssues indoo s as he o ce se dom fee s no sy
Yes From my know edge dur ng he coo er months w ndows a e comp e e y shu am unaware f w ndows a e ke p open n summer
Yes I go down and use he outdoo space eve yday du ng unch breaks
We prefer us ng he seat ng on he bot om gh of zone 5 or unch me We a so use he d n ng k chen space nex to zone 8 or co ee tea and snack breaks imon Lambe t EB London 8 Yes as s t and en oy wo k ng predom na y by 2 years We have f ex b e working so can s whe e we ke Good day gh , herma and hum nd y genera y OK a r qua ty good no se f ne do open w ndow some mes f gets s u fy
Excel ent No no No Occas ona y ake t w h me occa sonal y s ou s de a co ee shop or ba
ron o o f ce n breakout space and tea oom rancesca P es non EB 04 yes - 6 mon hs no - i ke he windows and natura ght day gh warm qu e a ot o natura gh No no No not much yes never, bu d ke o use n the summe
02
natural igh and w ndows w th r vers de v ew
c oser to the w ndow
I f nd hat working w th day igh s mo e eff cient for me compared o us ar i ic a l ght ng
10 months My prev ous desk was st n zone 5 but d ferent ocat on
wou d s p ck zone 5 bu c ose o he w ndow or zone 4 nex to he w ndow
Maybe d s in zones 4 or 5 because here s more na u a ght and a g ea v ew o the boa
Yes, due o view to Hay Ga ler a dayl gh and ess d st act ons 6-7 mon hs Yes can move to 05
03
ha Rash d EB
I s OK some mes hot somet mes co d I s c ose o he k chen and o e fac es 7
06
ark Conner CAD/B M
ay Pate EB London
02
Yes I wou d ike he ab y to move desks and t y d feren ocat ons to see hey wo k be er for me Hav ng a xed PC preven s h s
are y nna EB g oup 05 Yes and kes my p ev ous pos ion which was same oca on but Has a v ew on he r ver which nd de-st ess ng and is br ght
some imes s gett ng co der un ess he new b g ab es on he common area n zone 5 are used for meet ngs Those we e nt oduced the ast 10 mon hs as a test for our new off ce
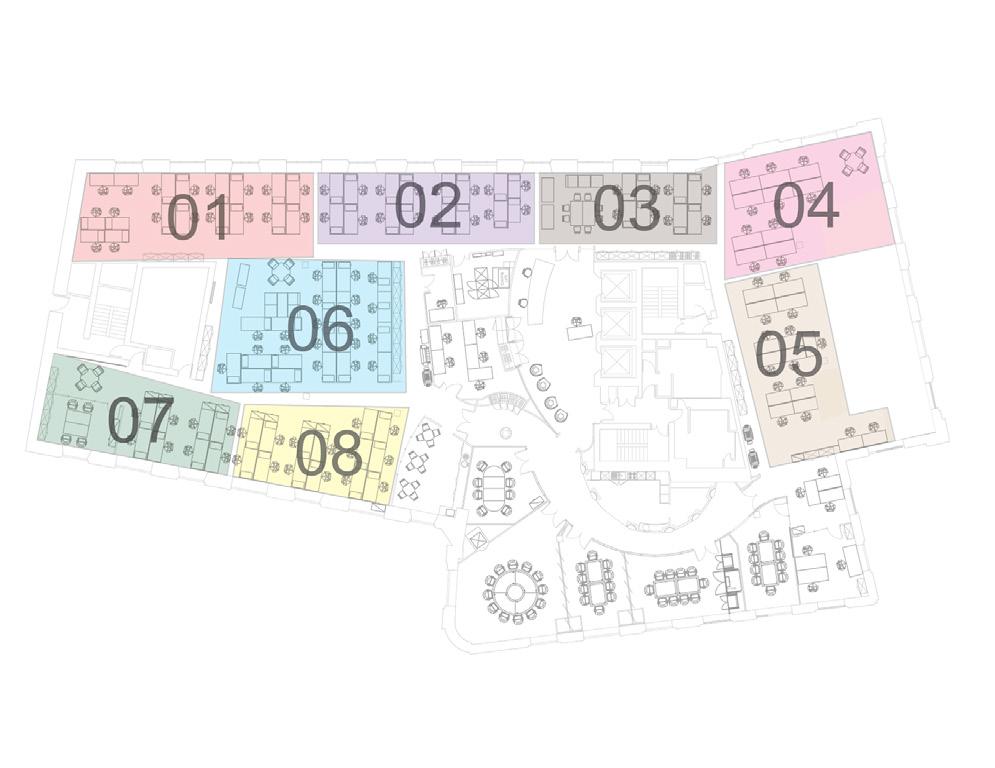
day gh good due o some ssues rom he oca systems s s not very no sy
h nk s he mos b gh p ace of the o f ce No no No A mos never had he need to ha on y 2-3 t mes n my 6 yea s n he of ce
have been a ways urn ng off my pc Bu w h pandem c and wfh, had o eave my desk op on stand by mode so can conne c remote y w th he aptop when work ng rom home
We had he reasu e s andin he corner o zone 5 now we use the same ab es on the same oca on for lunch
Good day gh ge s ove y ho orescen gh s annoy ng A r qua y and no se are ne Good No No No No
Co d under the a r vent need o use he ma c o h ng n th s area, ess noise good day gh
Some mes oo ho some mes oo co d he ven sys em s qu e no sy when unn ng bu ve got used o hat now on y not ce now hoe no sy t s when t shu s o f n the even ng
Zone 03 s reasonably day t bu we s l need ar ic a ghts No Not much No
don as I ve been o d do ng so wou d r gger a sensor to urn on he hea ing wh ch wou d heat up
Rare y bu some mes f ee ng need for f esh a r Yes
s n the m dd e o he oor p a e so does ge l gh rom bo h s des bu s a fa d s ance f om the w ndows No Noise rom vent sys em No None nearby
Some imes go down to s t n the ga er a when I need a break away f om the sc een and some f esh a r or 5-10 m nu es
m e ther as my desk or n he ki chen or a co ee m no ea y drawn to any o he spaces a though he Canteen ype arrangemen n he new p ans wou d d aw me more to he Nor h End
Hilson Moran office at Hay’s galleria | 61 Interview our Name n what depar men do you work? In wh ch zone do you wo k? (Refer the above image Do you ke you workspace? Why? Fo how ong have you been work ng n h s space? given a chance wou d you move you desk to any o he pos on? Why/Why no ? Wha s you work env ronment ke? ( n te ms o day ght ng he ma / hum d ty/ qua ty of a / w nd/ no se e c ) How does h s space fare n e ms o day ght ng? Do you face any v s b ty ssues regard ng g a e? Are there any acoust ca ssues? I yes p ease desc be A e you happy w h he hea ng co o ng sys ems? How o ten do you open the w ndow for natu a vent a on? Do you leave you PC/Lap op on s and-by mode when you a e away? Do you use he ou door space a Hay s Ga e a? When/ How o ten? Are here any spaces in he o ce where you o you co eagues congrega e? aryJoe Env ronmenta Bu d ngs 05 yes s no crowded and has f om a good v ew 1 year cou d bene t rom na u a vent a on when he wea he s n ce a so cou d bene t f om and herma com o t when ou door empe a ure s adequate poo No no No t y to n he morn ng dur ng he warmer season yes du ng summer somet mes fo unch he co abora ve space
London 8 ke o wo k c ose w h my co leagues work on he same projec s I a so l ke the fac that h s a ea s c ose o he k tchen
mon hs wou d ke to move to a zone w th a be te v ew Comfor
e
05 Yes pa t a y ke this wo kspace en oy the arge work desks and the v ews to the Thames rom h s sea ng oca on
hrysanth Tsaous EB
3
ab
haven no ced as the ght ng s a ways on Yes I haven t no ced any Yes Never Yes I do Yes do A mos eve y t me am n he o f ce No me o my team But know tha some o my co eagues congrega e at zones 4 and 5 a sha Kaku uru Susta nab y
h
to
1 mon
wou d ke
move the seat ng mo
yes mos common s fo wa ks dur ng unch break o a ter wo k mma Go d Ma ke ng
I s ok - I ke he natu a igh rom he w ndow am not a fan of he f uorescen overhead gh and where I s t can ge very stuf y and ho 1 year
Yes got or wa ks every unch We tend to s ay n ou area
No much, on y for wa k ng to shops common a ea n zone 05
PC s a ways ve as far as am aware un ess t goes n o s andby o t s own accord have had prob ems n the past o he compan es w th PC s no estar ing as expec ed f om s andby No so much of an ssue you a e w h he PC but s a rea pa n i you are ry ng o ge emo e access o i
C aus rophobic so need to be next to w ndow work stat on a o ed to su o hea th reasons 8 years p us yes f t su ts my cond t on good good No no Yes most days no no no
Model for solar radiation simulation
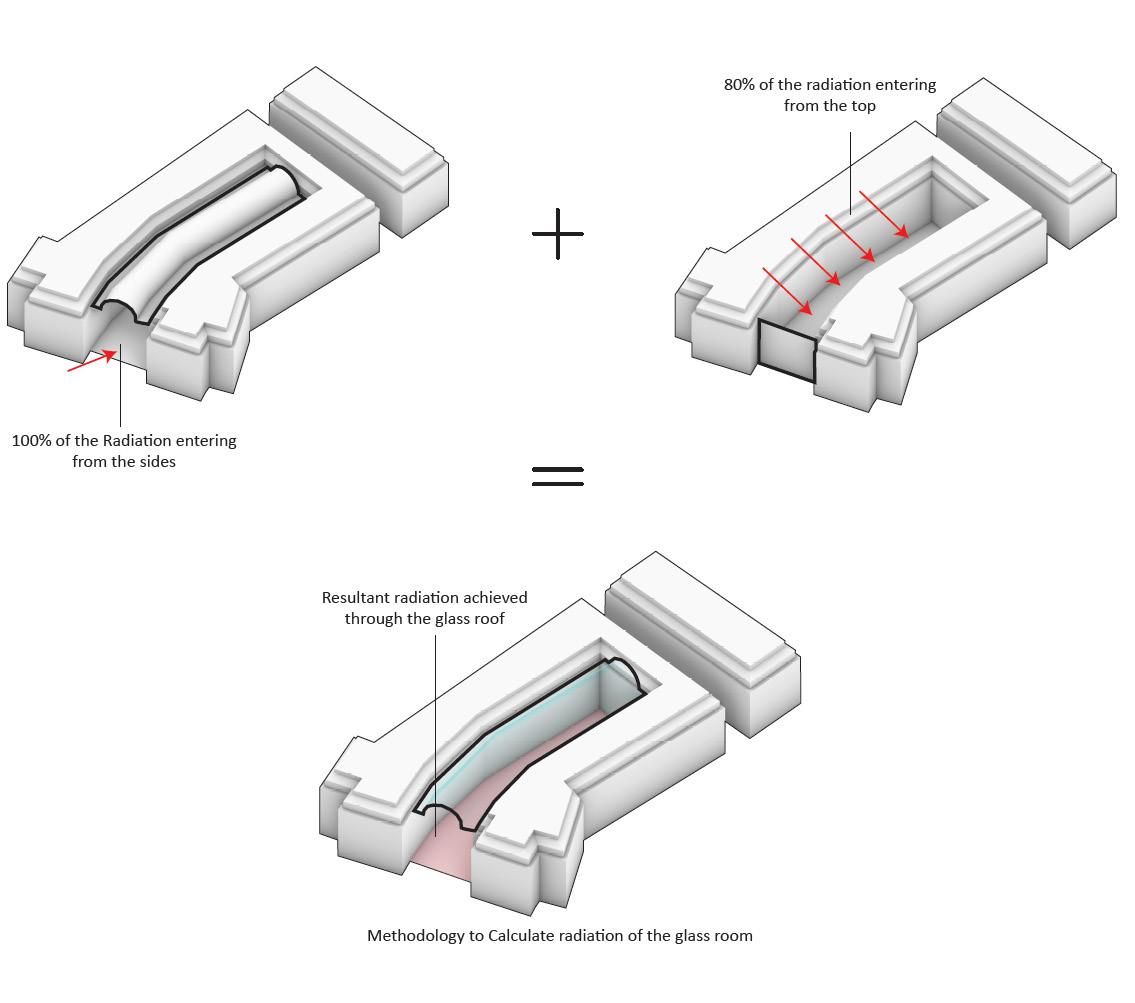
62 | AA SED | Msc + MArch | 2022-23
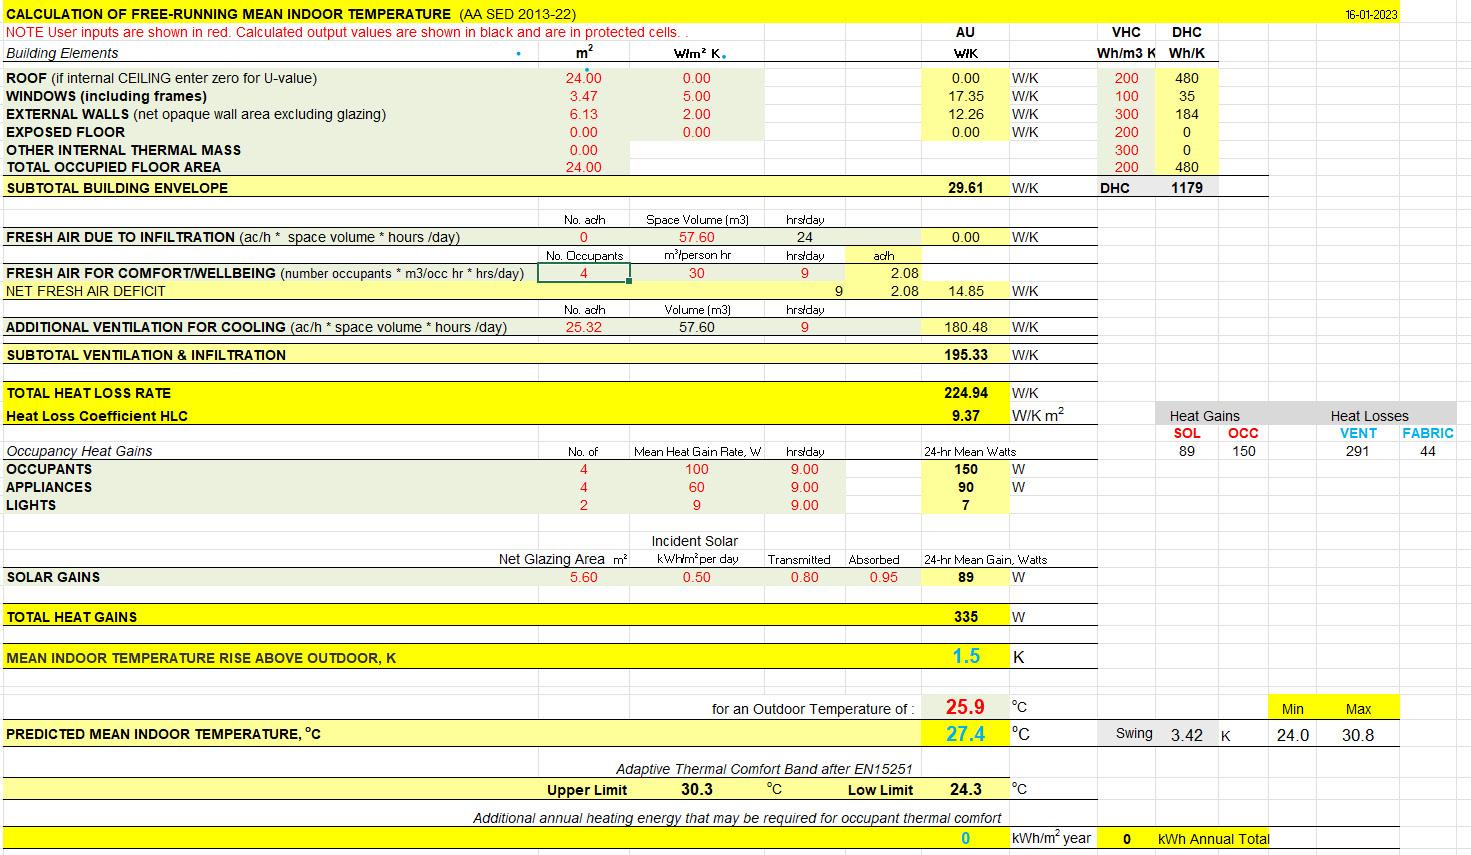
Hilson Moran office at Hay’s galleria | 63
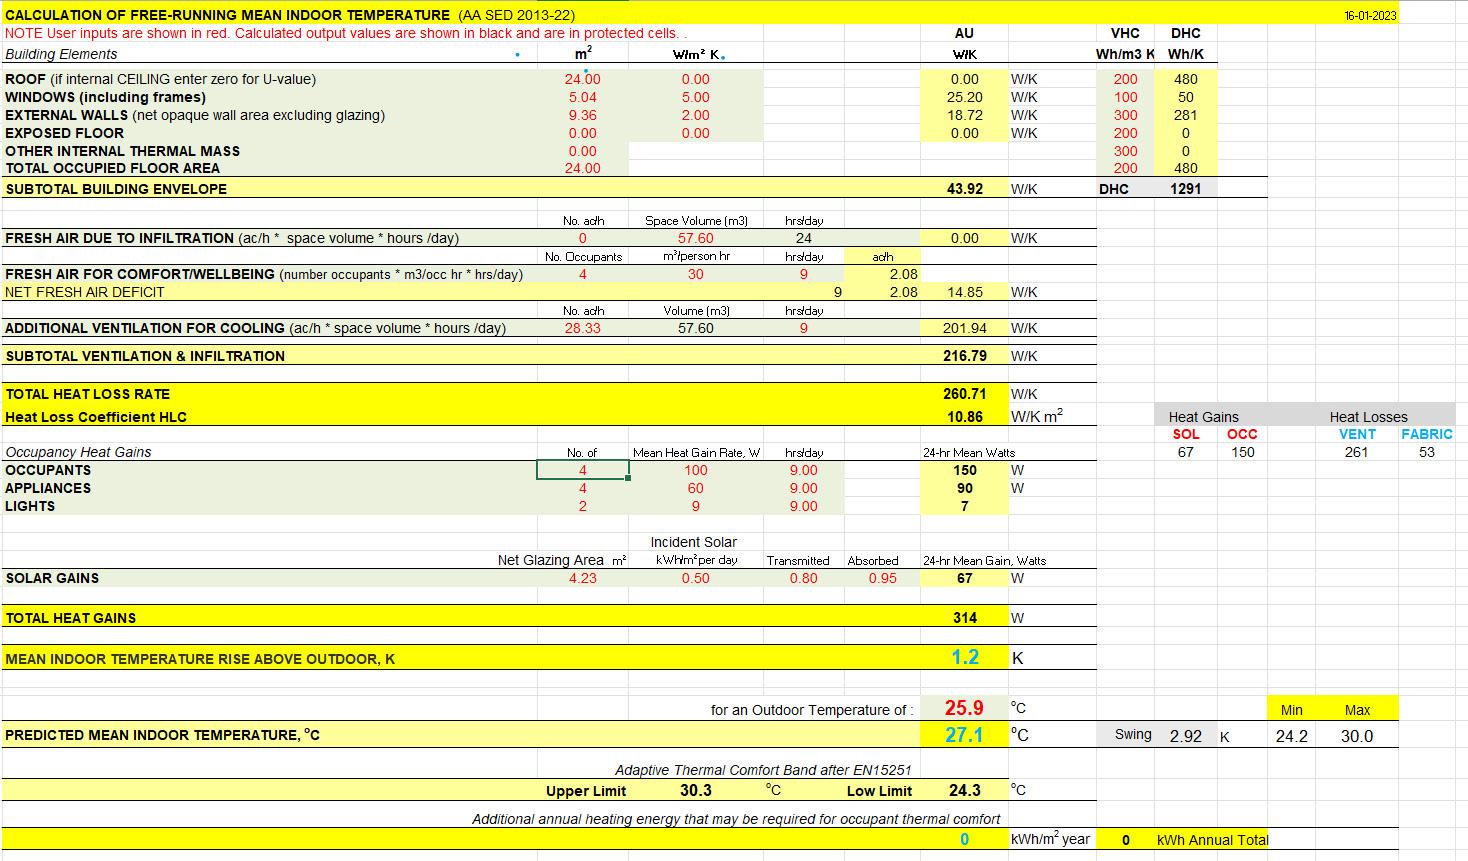
64 | AA SED | Msc + MArch | 2022-23
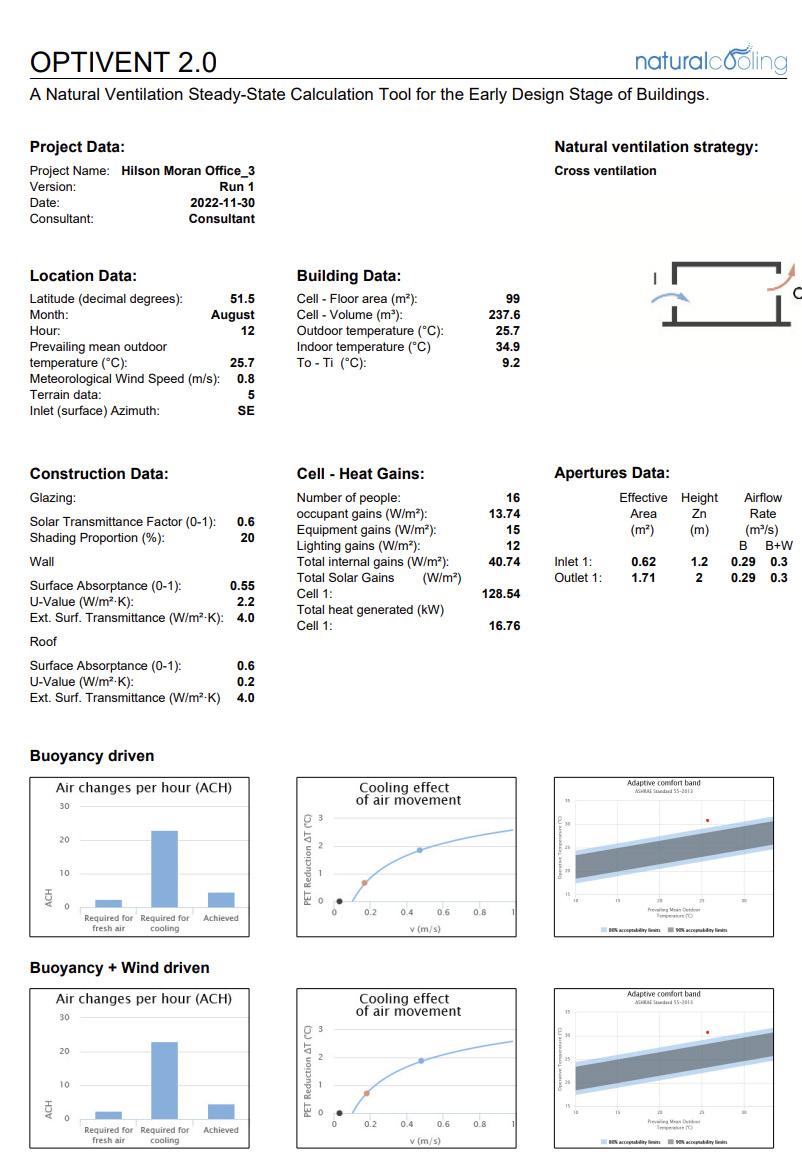
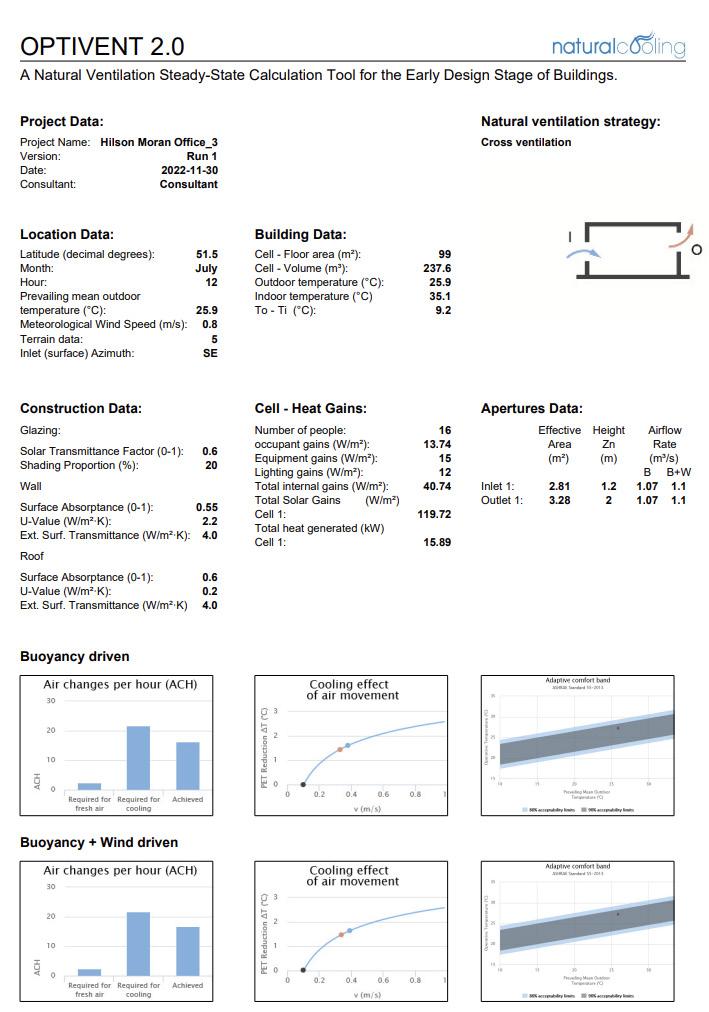
Hilson Moran office at Hay’s galleria | 65
