2022 STATE OF DOWNTOWN MADISON

It wasn’t long ago businesses across the country were shuttered during the COVID-19 pandemic. The virus forced shoppers from downtown storefronts to online marketplaces and students from university lecture halls back to their childhood bedrooms.
The impact on downtown Madison was significant, but it’s also opening doors to new opportunities for businesses, amenities and other developments, as students, workers, residents and visitors transition to post-pandemic life.

Downtown is at a point of reimagination with investments pouring in for hotels, multi-family residential housing and modern office spaces. You can almost hear the excitement outside growing, with more than 1.5 million pedestrians reported monthly on State Street and King Street.
In this period of reinvigoration, Downtown Madison Inc. (DMI) is proud to present its 12th annual State of Downtown Madison, a report that provides objective and accurate information on downtown. Twelve years of data has given us a wealth of information to better understand the current state of downtown and help plan for future projects, growth, challenges and opportunities to maintain a healthy and vital downtown Madison.
While downtown is still recovering from the pandemic, we hope the numbers in this year’s report will help to inform us on the work needed to best sustain, grow and reimagine downtown Madison now and into the future.
We encourage residents, businesses, community organizations and city officials to join DMI in using the information in this report to help ensure downtown Madison is a thriving, inclusive, equitable and welcoming place for all.
2 | State of Downtown

State of Downtown | 3 TABLE OF CON TABLE OF CONTENTS 6-7 8-11 12-15 16-19 20-23 24-27 28-31 32-35 36-39 40-43 44-47 Employment Education Retail & Restaurants Tourism & Attractions Mobility Boundaries & Map Development & Investment Residents Housing Quality of Life & Safety Office Market


4 | State of Downtown
MENTS 2022 State of Downtown Sponsors Major Sponsors: Supporting Sponsors: Associate Sponsors: ACKNOWLEDGEMENTS Ho-Chunk Gaming Madison 360 Commercial Real Estate & 360 Homes LLC C.D. Smith CG Schmidt Sid Grinker Restoration Sprinkman Real Estate Monona Terrace Community & Convention Center TDS Telecom
ACKNOWLEDGE
ACKNOWLEDGE
2022 State of Downtown Report Contributors
A special thank you to the following people and organizations for their contributions and assistance with the compilation of the 2022 State of Downtown report:
• Broadwing Advisors, LLC (Craig Stanley, Tina Bolek & Deana Porter)
• CBRE (Gretchen Richards)
• Clean Lakes Alliance (Adam Sodersten)
• City of Madison Assessor’s Office (Michelle Drea, Megan Lukens & Scott West)
• City of Madison Economic Development Division (Meghan Blake-Horst)
• City of Madison Parking Utility (Bill Putnam)
• City of Madison Planning Division (Heather Stouder, Colin Punt & Kevin Firchow)
• City of Madison Police Department (Daniel Haueter & Julie Laundrie)
• City of Madison Treasurer’s Office (Craig Franklin)
• Madison BCycle (Helen Bradley & Lissy Kettleson)
• Madison’s Central Business Improvement District (Tiffany Kenney & Tim Jenquin)
• Madison Metropolitan School District (Eric Lequesne & Brianne Monahan)
• Madison Public Schools Foundation (Melinda Heinritz & Mary Bartzen)
• Madison Region Economic Partnership (Jessica Reilly & Jana Moore)

• Metro Transit (Mick Rusch)
• Nelson Schmidt (Daniel Nelson Jr., Cody Pearce, Jake Prinsen, Anna Ward & Alison Ban)
• REALTORS® Association of South Central Wisconsin/South Central MLS (Patty Stuard)
• UW-Extension (Matt Kures) Plus all other people, businesses and data sources who contributed time and information to this report!
• Destination Madison (Ellie Westman Chin & Maureen Martin)
Designed By:
Print Sponsor:

State of Downtown | 5
BOUNDARIES & MAP BOUNDARIES & MAP
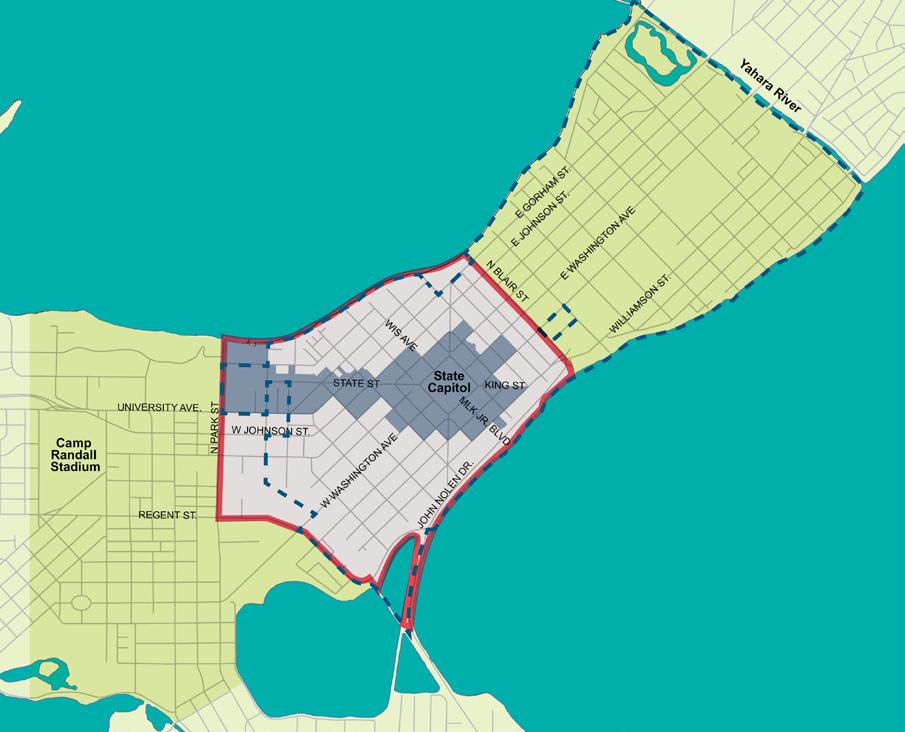
The central downtown is defined in this report as the area bounded by Lake Mendota, Lake Monona, Blair Street and Park Street. The majority of data compiled in this report focuses on the central downtown area. On a broader scale, downtown Madison is often viewed as the Madison isthmus from Camp Randall Stadium on the West to the Yahara River on the East. This broader definition is reflected in various metrics throughout the report, but the primary focus is the central downtown. The geographic boundaries of Madison’s Central Business Improvement District (BID) and 53703 zip code area are also used in the report.

Central Downtown Greater Downtown Area Central Business Improvement District 53703 Zip Code Area
6 | State of Downtown
Lake Mendota
Lake Monona
BOUNDARIES

State of Downtown | 7
DEVELOPMENT INVESTME DEVELOPMENT & INVESTMENT

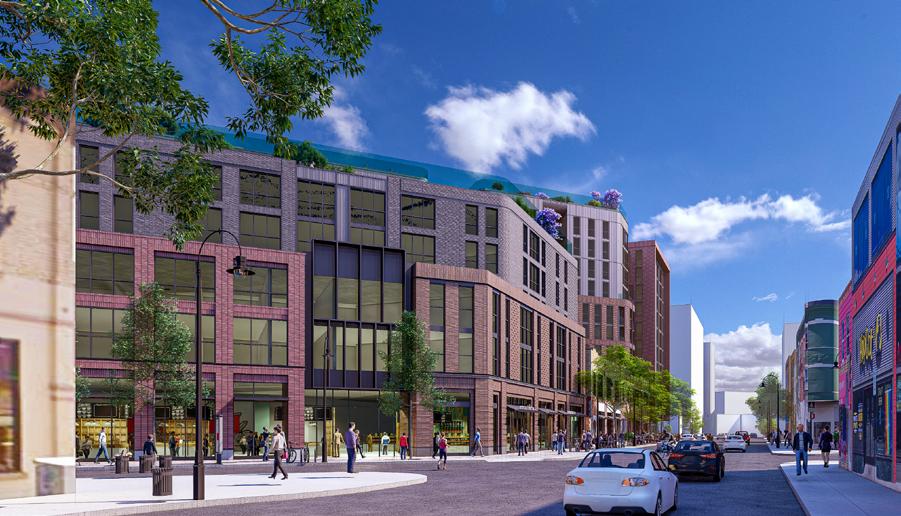
Downtown Madison continues to see strong investment and development activity, as multi-family residential and hotel spaces remain in high demand.
Eleven new development projects were approved in 2021, including 641 residential units, 236 hotel rooms and more than 24,000 sq. ft. of commercial space. In 2022, downtown saw more than $35 million in new construction. One of the new projects is making waves for the innovative, yet old-fashioned way developers plan to blend living and workspaces.
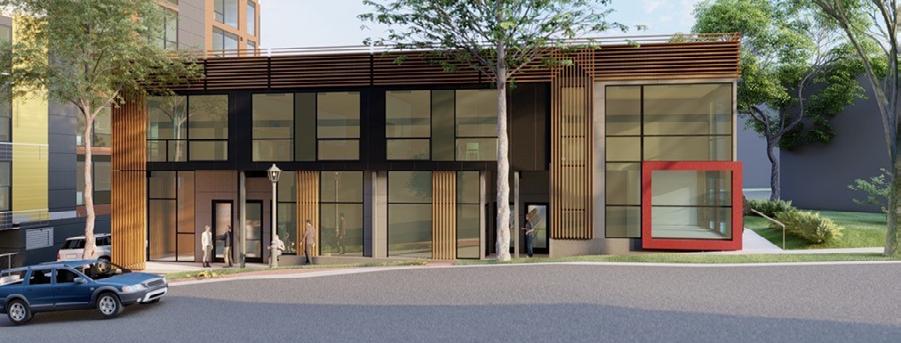
The brains behind the Luminous Development off Hamilton Street hope to secure a small business, like a coffee shop or hair salon, where its proprietor could make use of the living space upstairs. Developers say it’s a way to adapt to how work culture has changed during the pandemic, with many residents looking for jobs with the ability to work from home.
“We say it’s a smart, innovative idea, but when you really think about it, every Main Street in America was originally built like this,” said Jason Iverson with Realty 4 Good on a DMI Downtown Happenings Podcast. “People lived in their businesses, and that’s kind of what we’re hoping to bring back to downtown.”
More than 2,300 residential units have been approved for construction downtown in the past five years, about 20 percent of residential units approved throughout the city. In 2022, the tax base downtown was $3.43 billion, an increase of nearly 83 percent or $1.55 billion since 2011. Developers say the vocational living spaces will be a key part of downtown's future offerings.
8 | State of Downtown
Credit: Lithosphere LLC, Luminous Live Work LLC, Chris Gosch, Populance LLC, and Jason J Iverson, Realty 4 Good – Coldwell Banker Real Estate Group
Downtown
Base
State of Downtown | 9
INVESTME New Development Approved in Downtown Madison in 2021 Residential units approved for construction in downtown Madison in the past five years (20172021) which is 20% of the total residential units approved citywide Sources: City of Madison Planning Division, City of Madison Assessors Office (*compiled by DMI) 11 236 641 14,435 24,654 projects hotel rooms new residential units sq. ft. of institutional space sq. ft. of commercial space 2,338 424 39% Acres in downtown Madison, which is about 1% of acres citywide* Percentage of tax-exempt parcel acres in downtown Madison* TAX New Construction in Downtown Madison (in millions)* $75 $25 $50 0 $3.5 $16.6 $20.1 2018 2020 2021 2022 2019 $2.4 $17.3 $19.6 $1.0 $74.0 $75.0
*2022
Residential Commercial Total $10.8
$4.8
Real Estate and Personal Property Taxes
millions)
$43.0
2011 $68.0*
2022
DEVELOPMENT
Source: City of Madison Assessors Office (*compiled by DMI). Residential defined as SingleFamily, Condominium, 2-unit and 3-7 unit properties only. All other properties including large apartment buildings defined as commercial. Central Downtown area only. Figures represent new and rehab construction projects.
figures only include new development completed prior to the 2022 tax assessments and do not include development currently under construction.
$43.3 $54.1
$30.8 $35.5
Generated (in
Source: City of Madison Assessors Office & Treasurers Office (*compiled by DMI) Downtown Madison City of Madison
$474.5
$680.1
Madison Tax
In 2022, the tax base downtown was $3.43 billion, an increase of nearly 83 percent or $1.55 billion since 2011. Sources: City of Madison Planning Division, City of Madison Assessors Office (*compiled by DMI)
Citywide Taxes Generated from Downtown Madison
Multi-Family Buildings
10 | State of Downtown For current, recently completed, and planned development projects in the
check out DMI's Downtown Madison Development Tracker
downtown Madison area,
Development in Downtown Madison 2017-2021
Other Projects
Approved or Under Construction Non-Residential Building Prepared
the City of Madison Planning Division, August 2022 Source: City of Madison Assessors Office & Treasurers Office (*compiled by DMI)
2011 2013 2014 2017 2018 2019 2020 2021 2022 2016 2015 2012 10% 9% 11%
Constructed 2017-2021 Total Units Constructed: 644 Approved/Under Construciton Units: 1,694
2-9 10-24 200+ 100-199 50-99 25-49
by
9.1% 9.3% 9.6%
10.2% 10.2% 10% 10.9% 10.5% 11% 10% 9.7% 9.1%
firmly believe that having this live-work component is the way things are moving. The reaction against going back to the workplace, the ability to have separated work areas from living areas – this is the next step in what we feel is a smart, natural evolution to rethinking the way we’ve been living.”
 CHRISTOPHER GOSCH POPULANCE, LLC
From a DMI Podcast
CHRISTOPHER GOSCH POPULANCE, LLC
From a DMI Podcast
State of Downtown | 11
“We
RESIDENTS
Downtown Madison residents fall mostly into student age demographics, but the area is becoming more attractive to young professionals and empty nesters.
Most downtown residents fall in the age group between 15 and 34 years – about 83 percent – while the next highest age group is 35 to 54 years old – about 7 percent – according to U.S. Census Bureau estimates.

No matter their age, residents say the area is rife with culture, activities and a diverse food scene that’s on par with much larger cities. Of course, it’s also walking distance from the University of Wisconsin-Madison.
“You get a little slice of everything with what this area is about,” said Cleo Le, vice president of the Campus Area Neighborhood Association “Of course, there’s the nightlife and game days where you can hear tailgating at 7:30 a.m. It kind of penetrates the entire area.”

Le said this year the Campus Area Neighborhood Association and other neighborhood organizations are focusing on affordable housing. As rent and housing costs continue to climb, they want to make sure the area remains a viable living space for everyone.
There are six neighborhoods/associations in the central downtown Madison area including Bassett, First Settlement, James Madison Park, Mansion Hill, Miffland (all part of Capitol Neighborhoods, Inc.) and Campus Area Neighborhood Association, and nine additional neighborhoods/associations in the greater downtown Madison area including Bayview Foundation, Inc., Brittingham Apartments Resident’s Association, Greenbush, Marquette, Monona Bay, Parkside Resident Association, South Campus Property Owners Association, Tenney-Lapham and Vilas.*
12 | State of Downtown
Nat R.
Credit:
*Source: City of Madison Department of Planning, Community & Economic Development website
Population
Dane County Downtown Madison City of Madison
American Indian & Alaska Native +0.1%
0.3% | 0.4% 0.4% | 0.5%
Asian +0.1%
6.1% | 5.8% 13.8% | 9.6% +7.7% +3.8%
Black or African American -0.9% +1.5%
Race/Ethnicity (percentage change by race) Downtown Madison City of Madison 2000 2022 12% 10% 8% 6% 4% 2% 0% -2% -4% -6% -8% -10% -12% -14% Source: U.S. Census Bureau, 2000, ESRI Estimates: 2022*
White 4.3% | 5.8% 3.4% | 7.3%
3.7% | 4.1% 6.4% | 8.8%
Hispanic or Latino (of any race) +2.7% +4.7%
85.8% | 84.0% 73.3% | 70.6% -12.5% -13.4%
3.4% | 4.0% 9.0% | 11.9%
Other Race / 2 or More Races +5.6% +7.9%
State of Downtown | 13
Source: U.S. Census Bureau, 2000, 2010, 2020 Census, ESRI Estimates: 2022* 426,526 208,054 22,168 2000 488,073 233,209 24,009 2010 561,504 578,227 269,840 277,146 32,996 33,707 2020 2022 Age Cohort 2000 2022 Under 15 years 0.8% 1.3% 15 to 34 years 87.4% 83.3% 35 to 54 years 7.7% 7.3% 55 to 74 years 2.1% 5.7% 75 years and older 2.0% 2.4%
Age in Downtown Madison
Source: U.S. Census Bureau, 2000 Census; ESRI estimates, 2022* Accessibility In 2020, the population with a disability in the City of Madison was 8.3% and in Dane County was 8.8%.
Sources: Source: U.S. Census Bureau, 2016-2020 American Community Survey 5-year estimates* (for downtown Madison, the margin of error exceeds the limit to use in the report) ACCESS
Gender
Downtown Madison
Female 46.9% Male 53.1%
City of Madison Female 50.2% Male 49.8%
Source: ESRI estimates, 2022*
Downtown Madison 1.82
Source: ESRI estimates, 2022*
Occupied Housing Units With 30% or More of Monthly Housing Costs as a Percentage of Household Income in the Past 12 Months
Downtown Madison 48.9% City of Madison 2.11
City of Madison 33.4%
Dane County Downtown Madison City of Madison
Source: U.S. Census Bureau, 2016-2020 American Community Survey 5-year estimates* (Households spending over 30% of their income on housing are considered cost-burdened)
Occupied Housing Units With vs. Without Related Children of Householder Under 18 Years
Downtown Madison City of Madison 97.2% 79.2%
Source:
Bureau,
$39,595
Source: U.S. Census Bureau, 2016-2020 American Community Survey 5-year estimates*
$26,748
2.8% 20.8% 2016-2020
Downtown Madison City of Madison
Community
Census Bureau, 2016-2020 American Community Survey 5-year estimates*
Source:
*ESRI data are estimates only that may not include local changes or factors such as the increase of population due to recent development projects. These estimates and Census figures are also not direct comparisons due to differences in the sources and data collection methodologies. Comparisons are for estimates only. U.S. Census Bureau, American Community Survey 5-year estimates figures are subject to a margin of error based on a 90 percent confidence interval. Per capita income figures are based on periods that contain overlapping years. Period differences in the figures may not be statistically significant. Figures are adjusted for inflation in 2020 dollars. Income for downtown includes student population. Downtown defined as 53703 zip code for household spending on housing, available vehicles and related children of householder under 18 years data.
14 | State of Downtown
Average Household Size
Occupied Housing Units Vehicles Available
U.S.
One or Fewer 76% Two or More 24% One or Fewer 53.5% Two or More 46.5%
Per Capita Income
U.S. Census
2009-2013, 2016-2020 American
Survey 5-year estimates* 40,000 35,000 30,000 25,000 20,000 15,000 $41,755 2009-2013 $19,572 $34,790 $37,445
CLEO LE VICE PRESIDENT OF THE CAMPUS AREA NEIGHBORHOOD ASSOCIATION

State of Downtown | 15
"We’re trying to figure out ways to approach the housing crisis with opportunities for affordable housing. It’s getting more and more vital to advocate for, and secure housing that’s affordable for students, young professionals and even families.”
HOUSING HOUSING
Downtown Madison experienced housing growth in 2022, primarily due to an increased demand in apartment units.
One of the new developments, the ōLiv Madison, is a 10-story residential apartment building with a wealth of retail space for new, growing businesses.
Located on the corner of Gorham and State Street, the development is expected to bring more than 1,000 residents to downtown Madison.
“It feels like the right project at the right time,” said Brian Munson, Vandewalle & Associates principal urban designer on a DMI Downtown Happenings Podcast. “It’s exciting to have an opportunity to bring a lot of activity in support of everything that’s happening downtown and really help the revitalization and reimagining of the district.”
ōLiv project managers are doing their own reimagining with the building concept. The apartment unit will provide unprecedented affordable housing for college students, as well as creating an incubator space for new businesses.

16 | State of Downtown
Credit: Antunovich Associates
State of Downtown | 17 HOUSING Median Value of Owner-Occupied Housing Units Downtown Madison $393,925 Downtown Madison $500,532 "We’re really excited about the retail incubator. If you have a new business concept and are looking for support, advice, mentorships or partnerships, we’re hoping this space is an opportunity to foster those and really be their key connection to the community.”
a DMI Podcast 2021 2022 Downtown Madison Apartment Units In 2022, there were 9,946 apartment units in downtown Madison, an increase of 34 percent from 2011. Source: City of Madison Assessors Office (compiled by DMI) APARTM City of Madison $313,068 City of Madison $265,882 RETAIL INCUBAT Types of Units in Downtown Madison Source: City of Madison Assessors Office (*compiled by DMI) Source: CBRE, ESRI 2021, 2022 Single-Family Properties Condo Living Units Duplexes Apartment Units 2011 2022* 7,423 9,946 1,181 170 251 1,240 148 225
ROB BAK CORE SPACES DEVELOPMENT MANAGER From


18 | State of Downtown Multi-Family Rental Vacancy Rates in Downtown Madison Source: Madison Gas & Electric, www.mge.com, Q2 figures for 53703 zip code area
2% 3% 4% 5% 6%
2018 2019 2021 2020 2017 2016 2015 2014 2013 2012 2011 2010 2009 2008 2007 2006 2005 Source: REALTORS® Association of South Central Wisconsin/South Central Wisconsin MLS *downtown defined as the greater downtown area Median Sales Price in Greater Downtown Madison Single-Family Condos $400k $450k $350k $300k $250k $200k 2010 2010 $225K $247K $296K 2015 $405K 2021 $395K 2021 2015 $297K
4.98% 3.70% 3.37% 3.36% 3.63% 3.25% 2.87% 2.56% 3.02%
4.95% 5.31% 4.46% 5.89% 5.28% 3.68% 3.56% 4.64%

State of Downtown | 19
QUALITY OF LIFE QUALITY OF LIFE & SAFETY

Water is an important factor in the quality of life of downtown Madison residents and for its visitors. Together, Lake Mendota and Lake Monona provide more than 13,000 acres of recreation and scenic enjoyment. But downtown public access to this outsized amount of water has historically been limited. That’s changing thanks to the Lake Monona Waterfront Design Challenge Fourteen national and local design firms responded to the challenge of reimagining the 1.7 miles of lakeshore between Machinery Row and Olin Park. In October, three firms were selected to proceed to the next stage of submitting master plans to transform Madison’s foremost public lakefront into a beautiful park that links the south, downtown, east and west neighborhoods.
“These are big-time design firms,” said Allen Arntsen, chair of the city-appointed ad hoc committee leading the challenge at a DMI committee meeting. “They’ve designed projects like the High Line in New York City and the Chicago Riverwalk. Importantly, all three semi-finalist firms also included local Madison partners in their plans.”
A final firm and master plan will be selected in late January 2023. This iconic project is one of many ways downtown Madison is continuing to focus on the quality of life and safety of its residents and all people who enjoy the city.

20 | State of Downtown
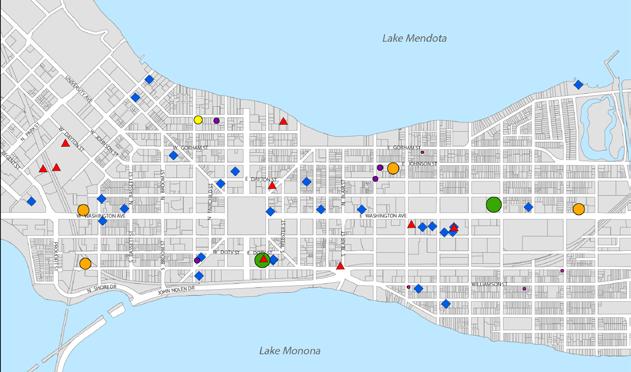
Places of Worship in Greater Downtown Madison
State of Downtown | 21 QUALITY
Average
150 100 50
Criminal
Downtown
3750 4000 3500 3250 3000 2750 2500 2010 3,735 2011 3,400 2012 3,623 2013 3,635 2014 3,542 2015 3,883 2016 3,497 2017
2018
2019
Members in 2022: 15,976 Average weekly service attendance in 2022 (in-person and/or virtual): 3,285 Meals/people served at onsite food pantries/meal programs in 2021: 38,789 Source: The Beacon The Beacon
Daily Guest Visits from June-May 200 250
0 2018-2019 223 2019-2020 208 2020-2021 103 2021-2022 129 Operated by Catholic Charities, The Beacon is a comprehensive day resource center for people experiencing homelessness in Dane County Source: City of Madison Police Department (*offenses include: battery simple assault, burglary, theft from building, theft from vehicle, all other larceny, damage/ vandalism of property, drug/narcotic violations, disorderly conduct, liquor law violations, and trespass of real property)
Offenses in Downtown Madison*
Madison Safety
3,173
2,998
3,167 2020 2,831 2021 2,569
MADI "This [the Lake Monona Waterfront] is really a unique and spectacular geographic site. We have a location that’s as good as any of the great parks around the world.”
DESIGN
CRIMIN THAT'S Sources: Bethel Lutheran Church (in-person and virtual service attendance)*, Blackhawk Church-Downtown (in-person service attendance), Calvary Lutheran Chapel, First United Methodist Church*, Grace Episcopal Church*, Pres House (numbers based on students served per month), Madison Catholic Diocese (St. Raphael Cathedral Parish and St. Paul Catholic University Center, numbers are from Oct. 2021), St. John’s Lutheran Church (includes virtual attendance), UW Hillel (numbers based on Jewish undergraduate and graduate students at UW-Madison and attendance at Friday services and dinners), and Wisconsin Lutheran Chapel (in-person and virtual service attendance). Additional places of worship may be located in downtown that are not included in these numbers. *Place of worship included in onsite food pantry/meal program figure. The City of Madison is currently collaborating with Dane County to plan for and design a purposebuilt shelter facility that will serve primarily men in our community who experience homelessness.
ALLEN ARNTSEN LAKE MONONA WATERFRONT
CHALLENGE COMMITTEE CHAIRMAN From a DMI Committee Meeting
In 2022, the daytime capacity at child care facilities in greater downtown Madison was 649.
Source: Wisconsin Department of Children & Families, YoungStar Program. *Downtown facilities include: Child Development Lab, Creative Learning Preschool and Child Care Center, Cultured Kids Vilas, Dane County Parent Council Wee Start, First Happy Children, Meriter Children’s Center, Nina Okwali, Red Caboose Child Care Center Inc., SSM Health Child Care Center, Tenney Nursery & Parent Center Inc., and University Ave Discovery Center Inc. Additional child care facilities may be located in downtown Madison that are not included in these numbers.
Parks and Beaches in Downtown Madison
6 18 2 9 5
Parks in central downtown Madison (Brittingham Park, James Madison Park, Law Park, Peace Park, Period Gardens & Proudfit Park)
Parks in greater downtown Madison
Playgrounds in central downtown Madison (1 all-inclusive playground at Brittingham Park)
Playgrounds in greater downtown Madison
Beaches in greater downtown Madison (B.B. Clarke Beach Park, Brittingham Park, James Madison Park, Tenney Park & Vilas Park)
Source: City of Madison Parks Division website
Lakes in Downtown Madison Phosphorus Concentration (mg/L)
0.045 0.040 0.035 0.030 0.025 0.020 0.015 Water Clarity (ft)
10 9 8
2013
0.026 0.026 2014
0.030 0.030 2015
0.030 0.026 2016 0.022
0.030
0.022 2018
0.025
Source: R. Lathrop (UW Center for Limnology) and Clean Lakes Alliance's annual State of the Lakes (*COVID-19 prevented UW’s Long-Term Ecological Research (LTER) program’s ability to collect info). Data is July-Aug medians.
Lake Mendota Lake Monona Goal = <0.02-0.032 Lake Mendota Lake Monona Goal= >5 – 8.1
Source: R. Lathrop (UW Center for Limnology) and Clean Lakes Alliance's annual State of the Lakes (*COVID-19 prevented UW’s Long-Term Ecological Research (LTER) program’s ability to collect info). Data is July-Aug medians.
22 | State of Downtown
7 6 5 4 3 4.6 3.6 2013 4.9 4.1 2014 4.9 4.6 2015 7.2 6.2 2016 2017 5.1 4.9 2018 6.6 6.6 2020 0.045 2021 0.036 0.039 2020 5.2 2019 3.9 5.9 2021 4.6 4.9 NA* NA* 2017 0.036 0.037 2019 0.045 0.045

State of Downtown | 23
OFFICE MARKET OFFICE MARKET
Downtown office space vacancies are rising, but there remains a wealth of appealing spaces, especially for tenants seeking Class A or B spaces.
The overall vacancy rate for downtown office space is hovering right around 13 percent, up 2.5 percent from last year. Despite the empty spaces, real estate leaders are noticing a trend with more people starting businesses out of vocational pursuits.

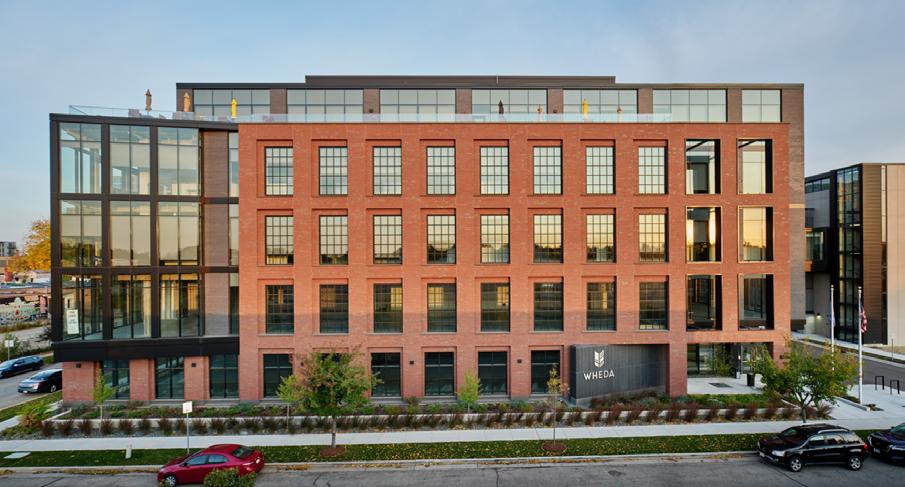
New office spaces were completed at the beginning of the year in the WHEDA Building and Structured Parking complex. The five-story, 92,000 sq. ft. building has retail and office spaces on the first two floors, as well as offices for WHEDA on the top three floors.
Despite vacancies, there’s optimism that once the spaces are filled, employees will be easier to find than in other areas because of downtown’s location in the heart of the city.
24 | State of Downtown
Credit: Potter Lawson, Inc.
Downtown Madison Office Market
Overall vacancy rate for office space in downtown Madison was 13.4 percent in 2022, up 2.5 percent from 2021.
Downtown Madison Office Market by the Numbers: Downtown Madison is comprised of 44.6% Class A, 47.6% Class B, and 7.8% Class C office space.
Source: Broadwing Advisors, LLC, REDI/Catylist, JLL and Hubbell Commercial, Q2 2021 and 2022. Downtown Madison defined as Madison, WI, CBD (Capitol Square+).
OFFICE MARKET
Office Space by Class in Downtown Madison
Class A
Inventory: 2,330,517 sq. ft. Vacancy Rate: 9.6%
Class B Inventory: 2,489,179 sq. ft. Vacancy Rate: 15%
Total
Inventory: 5,227,217 sq. ft. Vacancy Rate: 13.4%
Class C Inventory: 407,521 sq. ft. Vacancy Rate: 26%
"Overall the downtown office market is similar to the overall office market. Demand for smaller space continues to be in short supply as office tenants continue to reduce square footage needs. The downtown market is generally healthy. While growth is limited the market continues to slowly strengthen.”
“Expect this trend to continue as companies continue to figure out hybrid models of work.”
CRAIG
DOWNTOWN MARKET
STANLEY FOUNDING PRINCIPAL BROADWING ADVISORS, LLC
State of Downtown | 25
MARKET
Source: Broadwing Advisors, LLC, REDI/Catylist, JLL and Hubbell Commercial, Q2 2022. Downtown Madison defined as Madison, WI, CBD (Capitol Square+).
Office Space Vacancy Rates in Downtown Madison
13.4%
9.8% 2012
2011
13.91% 2013
17.17% 2014
15.85% 2015
8.99% 2010
10.77% 2017
7.35% 2016
7.95% 2018
9.05% 2019
10.9 2020
13.4% 2021
9.35% 2022
Source: Broadwing Advisors, LLC, Xceligent, Q3 2010-2011, Q2 2012-2017 and Broadwing Advisors, LLC, REDI/Catylist, Q2 2018-2020, Broadwing Advisors, LLC, REDI/Catylist, and JLL Q2 2021, Broadwing Advisors, LLC, REDI/Catylist, JLL and Hubbell Commercial, Q2 2022. Downtown Madison defined as Madison, WI, CBD (Capitol Square+).
Office Space Vacancy Rate Central Business District Comparisons in 2022
Portland, OR 23.7%
Minneapolis, MN 26.3%
City of Madison, WI 11.7%
Downtown Madison, WI 13.4%
Milwaukee, WI 23.8%
Boulder, CO 21.6% Austin, TX 18.1%
Des Moines, IA 18.7%
Source: Broadwing Advisors, LLC, REDI/Catylist, JLL and Hubbell Commercial, Q2 2022. Central Business Districts for each city. Downtown Madison defined as Madison, WI, Central Business District (Capitol Square+).
26 | State of
Downtown
20 15 10 5

State of Downtown | 27
EMPLOY EMPLOYMENT
Employment in downtown Madison is bolstered by its large public sector workforce, but there is still plenty of opportunity for other employment.

Business leaders say they’ve seen several employment trends accelerated by the pandemic, including thriving deliveries businesses brought on by the transition to ecommerce. Companies that were able to quickly pivot and adjust their offerings were not only able to survive the economic downturn, but also position themselves for success coming out of it.
“All of these business owners said you have to take action and move on things quickly – you can’t wait and see how things are going to end up,” said Joseph Muenich, ActionCOACH of Madison Business Development Manager on a Downtown Madison Happenings Podcast. “Looking forward, it’s really about how are you going to position yourself to be ready for a tidal wave of business.”
Some downtown business leaders feel there are inherent advantages to working downtown. There’s a business community, and the proximity fosters communication between businesses and stakeholders.
“I think it's a natural way for a collaboration to happen or to be triggered by being downtown and being in that vicinity of people who are thought leaders and business leaders,” said Emily Gruenewald, Overture Center for the Arts Chief Development & Communications Officer. “I’m in the office in part because of that ability to run into others and start those conversations.”

28 | State of Downtown
PRIVATE -SECTOR
Downtown Madison Employment
In 2022, 17 percent of employees citywide were located in downtown Madison.

Source: CBRE, ESRI 2022
EMPLOY
Number of Employees
Number of Businesses
Downtown Madison: 2020: 50,627 2022: 49,118
City of Madison: 2020: 236,099 2022: 262,258
Dane County: 2020: 410,694 2022: 421,841
Source: CBRE, ESRI 2020-2022
Downtown Madison: 2020: 1,992 2022: 1,984
City of Madison: 2020: 11,565 2022: 11,663
Dane County: 2020: 22,240 2022: 22,520
PRIVATE -SECTOR
In 2022, 10,802 people were employed by the 10 largest private-sector industry businesses in downtown Madison compared to 29,849 by the University of Wisconsin-Madison, State of Wisconsin, Dane County and City of Madison combined.
Sources: Madison Regional Economic Partnership (MadREP), Lightcast Q3 2022 Data Set, August 2022, businesses for all industries in 53703, 53706, 53707 and 53715 zip codes, and University of Wisconsin-Madison, www.wisc.edu/about/facts. Size measured by the combined number of full-time and part-time employees. Not all employees work onsite. Data for individual businesses from MadREP is provided by DatabaseUSA.com, which maintains a database of more than 14 million U.S. business entities. Note that in aggregate, data from DatabaseUSA.com will not be consistent with Lightcast labor market data due to differences in definitions, methodology, coverage, and industry/geographic classification. Due to a lack of source data at the ZIP code level, Lightcast's ZIP-level estimates can be less accurate when looking at a small number of ZIP codes. This is especially likely to occur in rural areas.
State of Downtown | 29
EMPLOY
GRUENEWALD OVERTURE
30 | State of Downtown
just feels magical. We have
a beautiful place
with the lakes, the capitol, State Street
the other iconic places that just
Madison.”
“It
such
here
and all
say
MAGIC Employment by Industry in Downtown Madison in 2022 (Top 10) 0% 10% 20% 30% 40% Educational Services 38.1% 14.7% Public Administration 11.1% Accommodation and Food Services 7.9% Food Services and Drinking Places 5.7% Professional, Scientific and Technical Services 4.4% Finance and Insurance Information 5.0% Other Services (excluding Public Administration) 4.4% Legal Services 4.4% Health Care and Social Assistance 3.2% Source: CBRE, ESRI 2022
EMILY
CENTER FOR THE ARTS CHIEF DEVELOPMENT & COMMUNICATIONS OFFICER FEELS

State of Downtown | 31
EDUCATION EDUCATION
Madison’s strong public school system brings new families and educators to the downtown area, and that’s no accident.
Madison Metropolitan School District leaders say part of their recruitment strategy is highlighting the businesses and amenities of downtown for new families and teachers. The strong business district has a symbiotic relationship with the school system.

“Strong schools really are a part of the recruitment process with strong businesses,” said Madison Metropolitan School District Superintendent Dr. Carlton Jenkins. “Strong business means strong schools when we start talking about the quality of life that we want.”

Madison public schools are invested in students’ success not only in the classroom but also after graduation, where they often have an immediate impact on the community. The district has emphasized STEM and trade skill programs in recent years and hope to expand those offerings with an innovation hub that provides real world applications.
“We’re talking about students being able to, in high school, get those critical experiences, and raise expectations for learning,” Jenkins said. “We even want to go beyond that and tap into the passion and natural curiosity of students.”
Like many other organizations and businesses downtown, the school district is also focused on fostering a culture of diversity, equity and inclusion to attract and retain workers downtown. Jenkins said he’s thrilled to see that as a common goal in the community.
32 | State of Downtown
Credit: Madison Metropolitan School District
EDUCATION
Downtown Madison Education by the Numbers
The University of Wisconsin-Madison had an enrollment of 47,932 students in fall 2021 and a budget of $3.6 billion.

Source: University of Wisconsin-Madison, www.wisc.edu/about/facts
EDUCAT THE NUM
Madison Metropolitan School District (MMSD)
District Enrollment 25,580 students (all grades)
Development Partner Key philanthropic and resource development partner to MMSD: Madison Public Schools Foundation
Sources: Madison Public Schools Foundation, August 2022, Madison Metropolitan School District and www.madison.k12.wi.us*
State of Downtown | 33
DMI Member Organizations who are foundation-based Adopt-A-School partners: 16
2022-23 Spending Plan $543M (includes $39.8M in 1-time ESSER (federal COVID) funding)
MMSD Elementary Enrollment
Downtown Madison All-District 1,189 11,960 1,032 12,486
2010-2011 2021-2022
Source: Madison Metropolitan School District and www.madison.k12.wi.us*
*Downtown schools include: Lapham (4K-2), Marquette (3-5), Franklin (4K-2) and Randall (3-5). Figures exclude 4K and PK programs for 2010-2011 and include 4K and PK on-site and off-site programs for 2021-2022.

“That’s a serious thing in terms of trying to recruit people here and retain them. That’s a real conversation in our city right now, and it’s a big deal for me to be able to say we’re not the only one trying to recruit diverse talent.”
CARLTON JENKINS
SERIOUS THING
34 | State of Downtown
DR.
MADISON METROPOLITAN SCHOOL DISTRICT SUPERINTENDENT
I
Credit: Madison Metropolitan School District
SERIOUS

State of Downtown | 35
RETAIL & RESTAURANTS
The pandemic had a major impact on downtown Madison’s retail and restaurant spaces and continues today, with vacancy rates still higher than before the pandemic.
Despite the unused space, real estate leaders say there’s more interest now than ever in entrepreneurial ownership, particularly pop-up shops and restaurants.

“There’s a deep desire and passion that has been heightened from that time period to live a life in accordance with what you truly desire, aligning that with your gifts and passions,” said Heather Ewing, Founder & CEO of Abstract Commercial Real Estate on a Downtown Madison Happenings Podcast. “When you talk about restaurants, I don’t think you could have a more heartfelt, passionate area.”
One of those new restaurants started as a food trailer in Milwaukee and now is one of the better-known vegan joints in the state. Sookie’s Veggie Burgers set out to provide healthy, fast, affordable vegan food with sustainable packaging. Founders John McCune and Elle Borden brought their startup to Madison in March after winning a competition through UW-Milwaukee’s business school in 2020.
It’s a great story, but just how did the place get its name?

Sookie is their dog, according to the restaurant’s website. “Full disclaimer, Sookie is not vegan.”
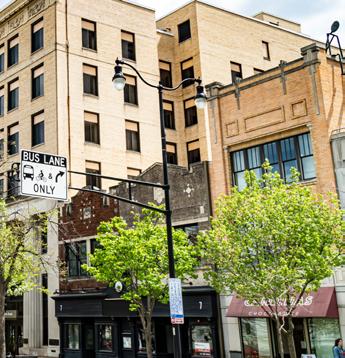
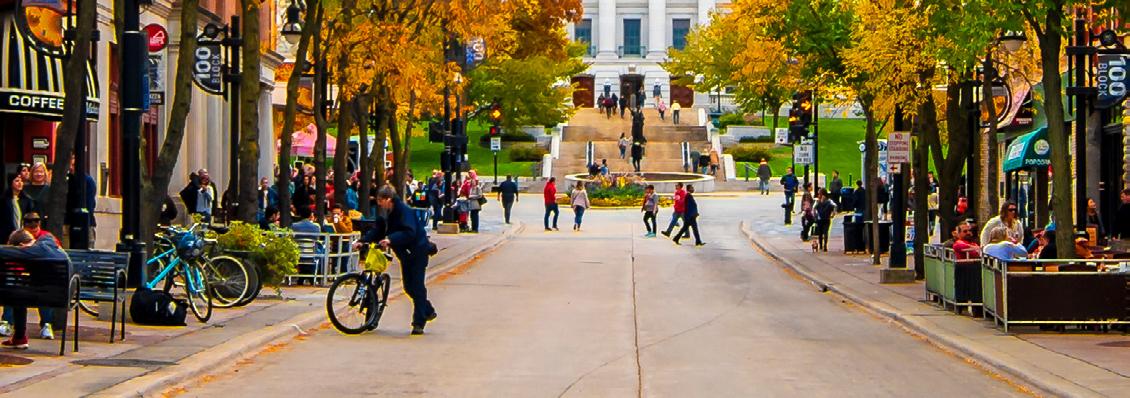
The new restaurants and retail spaces shouldn’t have trouble finding customers, with pedestrian counts continuing to trend positively. State and King streets are seeing more than 55,000 pedestrians each day, totaling more than 1.5 million people each month. That’s an increase of 104 percent from last year’s numbers.

36 | State of Downtown

State of Downtown | 37 Pedestrian Counts Comparison City of Madison Traffic Engineering Eco-Totem counts (*counts from January-July 2022) 800,000 2,200,000 3,400,000 1,600,000 2,800,000 200,000 0 2019 3,274,997 1,554,676 1,582,738 379,839 602,914 410,360 2,688,244 2020 2021 2022 YTD* 625 State Street 107 King Street 900,777 MADISONS CENTRAL Madison’s Central Business Improvement District (BID) Madison’s Central BID is at the heart of downtown’s retail/restaurant area and encompasses the greater State Street, Capitol Square and King Street areas (see map on page 6). The Downtown Madison Mall Concourse is roughly the same boundaries as the BID. BID Business Ownership Mix Source: Madison’s Central BID, 2022 (Ownership mix figures do not include non-profits. Locally owned includes Wisconsin ownership, locally owned franchises.) Locally Owned Regional Companies, Chainlets National Companies, Chains 12% 6% 82% Source: Madison’s Central BID (as of 8/8/22) Customers helped by the BID’s Downtown Information Ambassador Program in 2021: 12,307 and YTD 2022: 11,127 Pedestrian Counts Along State Street & King Street Monthly Average: 1,679,712 Weekly Average: 387,626 Daily Average: 55,223 Source: Madison’s Central BID (counts for May 2021-April 2022)

38 | State of Downtown BID Business Space Vacancy Rates Sources: Madison’s Central BID (BID boundaries expanded in 2018 impacting the number of businesses and spaces available. Available spaces do not include properties slated for development. As of 8/17/22, 26 previously occupied or available spaces are slated for development.) 5 4 1 2 11 10 7 8 9 6 3 2016 6.3% 2018 6.3% 2020 9.5% 2021 10.2% 2019 7.1% 2017 5.8% Street Vending in Downtown Madison Mall Concourse Source: City of Madison Economic Development Division (statistics are current as of 8/31/22) Food Carts Vending Licenses: 35 Sidewalk Cafés and Roadway Café Mall Concourse Applications Submitted: 65 (83% of applications submitted city-wide) 2022 10.6% “I see our downtown Madison as a canvas, something that we can paint upon and create even greater beauty. It’s nice to join together with a shared energy for really bringing out greatness and enriching peoples’ lives. I think that’s what it’s all about is living fully." HEATHER EWING FOUNDER & CEO OF ABSTRACT COMMERCIAL REAL ESTATE BID Business Type Mix Sources: Madison’s Central BID and Gibbs Report 1998 (BID boundaries expanded in 2018 impacting the number of businesses and spaces available. Available spaces do not include properties slated for development. As of 8/17/22 26 previously occupied or available spaces are slated for development.) *greater State Street area only I SEE OUR DOWNTOWN 50 40 30 20 10 0 Food & Drink Retail Service Total: 212 1998* 38% 50% 12% 2010 37% 28% 35% Total: 360 2022 43% 18% 39% Total: 363 From a DMI Podcast

State of Downtown | 39
DOWNTOWN
OUR
TOURISM & ATTRAC TOURISM & ATTRACTIONS
Tourists and visitors are flocking to downtown Madison in increasing numbers, but the activity is still below pre-pandemic levels.
Visitor-associated state and local tax revenue in downtown Madison in 2021 totaled $21.1 million, an increase of 38 percent from 2020. Visitor spending in downtown Madison in 2021 topped $187.6 million, an increase of about 63 percent from 2020.
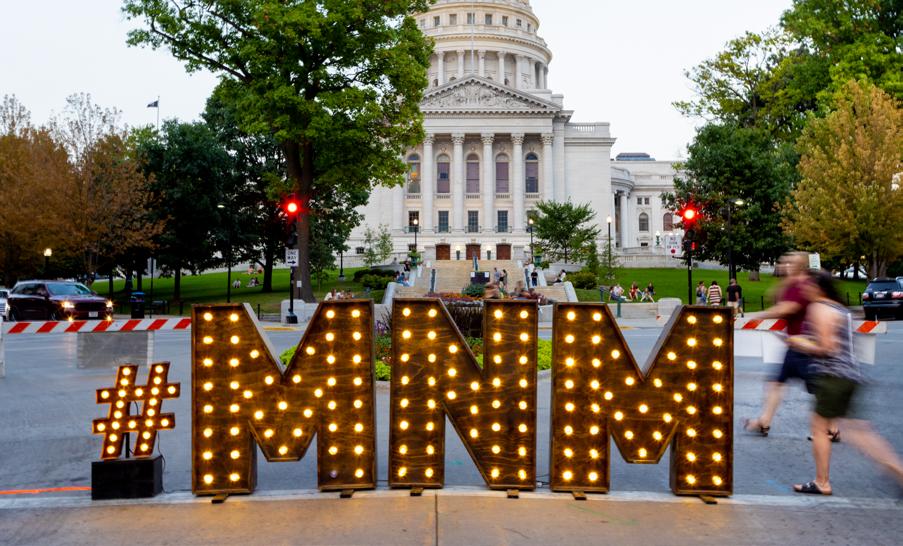
Those numbers are influenced by influx of exciting new events that came to downtown, as well as the return of several favorites. The Mad Lit and Jazz on State concert series, as well as Art Fair on the Square, Taste of Madison, Concerts on the Square, the Dane County Farmers' Market and Madison Night Market have all seen fantastic participation and enthusiastic crowds. Events also included sporting events such as Wisconsin Athletics, Forward Madison FC, the CrossFit Games and Ironman Wisconsin.
Downtown Madison leaders say the events are important to drive the local economy, but they’re also hoping to serve a larger purpose. Diversity has been a key factor in booking events and encouraging artist and business participation.
40 | State of Downtown
Credit: Sharon Vanorny
TOURISM
Downtown Madison Tourism
Many signature events were held again in downtown Madison in 2022 including the Dane County Farmers’ Market, Concerts on the Square (reporting over 250,000 attendees over the course of the summer in 2022 by Wisconsin Chamber Orchestra), Madison Night Market, Art Fair on the Square, Maxwell Street Days, Taste of Madison and sporting events such as Wisconsin Athletics, Forward Madison FC, the CrossFit Games and Ironman Wisconsin.

Number of Hotel Rooms/ Accommodations in 2022
6000 7000 8000 4000 5000 3000 1000 2000
3,198
7,972
135 315
Downtown Madison City of Madison 0 ADA Compatible Rooms
Source: Destination Madison (downtown defined as State Street/Campus and Capitol/Downtown, including properties around the Alliant Energy Center). Numbers include hotel/ motel/resort, bed & breakfast and extended stay rooms.
State of Downtown | 41 TOURISM
ATTRAC-
SIGNATURE
Visitor Spending by Category in Downtown Madison in 2021 (in millions) 0 5 10 15 20 25 30 35 40 45 Retail Food and Beverage Lodging* Transportation** Recreation/ Entertainment Source: Destination Madison, Tourism Economics, *Lodging includes 2nd home spending, **Transportation includes both ground and air transportation $24.6 $13.7 Visitor Spending in Downtown Madison (in millions) Source: Destination Madison, Tourism Economics 150 100 125 75 25 50 200 225 250 275 300 325 175 2017 $276.1 2018 $296.5 2019 $303.7 2020 2021 114.8 187.6 50 55 60 $47.2 $43.9 $58.2 Total: $187.6
Downtown Madison Tourism by the Numbers:
Million in visitor associated state and local tax revenue in downtown Madison in 2021, an increase of 38% from 2020
$21.1 $187.6 2,296 13 955 $5.9 9,369
Million in visitor spending in downtown Madison in 2021, an increase of 63.3% from 2020
Jobs directly supporting visitors in downtown Madison in 2021, an increase of 8.7% from 2020
Conferences and conventions at Monona Terrace Community & Convention Center in 2021 (up from 10 in 2020)
Average attendance (up from 903 in 2020)
Million in economic impact (up from $3.4 million in 2020)
Room nights generated (up from 3,364 in 2020)
Sources: Destination Madison, Tourism Economics, Monona Terrace Community & Convention Center Annual Report 2021
Visits to Destinations in Greater Downtown Madison* (in millions) 2020-2021
2019-2020 2021-2022
0 1 2 3 4 5 6 7 8 9 10 2,054,483 7,609,340
9,895,888
In 2021-2022, total visits to destinations in greater downtown Madison increased 73% from total visits in 2020-2021.
Sources: Alliant Energy Center, Big Top Baseball Breese Stevens Field, Henry Vilas Zoo, Madison Children’s Museum (fiscal year July 1–June 30), Madison Museum of Contemporary Art, Madison Public Library, Monona Terrace Community & Convention Center Annual Report (guests served at all catered functions, tour attendance and in-person attendance at community events), Overture Center for the Arts (experiences and engagements in a season), UW Athletic Department (all facilities, July 1–June 30), Wisconsin Department of Administration, Wisconsin Historical Museum, Wisconsin Institutes for Discovery, Wisconsin Union (fiscal year July 1-June 30), Wisconsin Veterans Museum. *Additional destinations may be located in downtown Madison that are not included in these numbers.
42 | State of Downtown
TIFFANY KENNEY EXECUTIVE DIRECTOR OF MADISON’S CENTRAL BUSINESS IMPROVEMENT DISTRICT
 From a DMI Podcast
State of Downtown | 43
“On a larger, more philosophical level, we want everyone to feel like downtown is their space. We love the diversity of events that are coming and encourage more people to use downtown.”
Credit: Sharon Vanorny
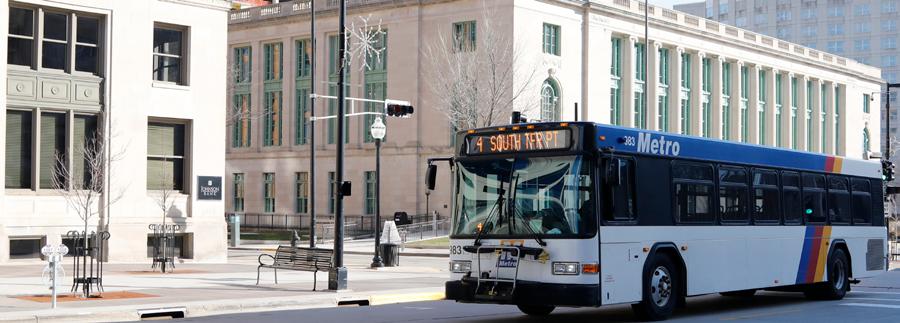
MOBILITY MOBILITY
The pandemic had a resounding impact on transportation trends in downtown Madison that continues to be felt today.
Occupancy rates for garages and parking lots in the area are down significantly due in part to work-fromhome culture, ecommerce and other factors. To put it simply, there just aren’t as many people downtown every day.
“You can get a lot of information from food truck operators,” said City of Madison Transportation Director Thomas Lynch. “If you ask how’s business, they might say Tuesday, Wednesday, Thursday and Saturday are good, but Monday and Friday are much slower.”
While there was a decrease in automobile traffic downtown, metro transit ridership, bicycle and pedestrian counts were up this year compared to last. The trends are in line with city planners, who are focusing on creating complete green streets and people-centered roadways.

Lynch said city planners are thinking about the direction mobility is headed. After relying on the automobile for more than a century, the city must look forward and focus on the infrastructure that will be needed for what's coming next.
Part of that future is coming sooner rather than later with a groundbreaking ceremony for the new Bus Rapid Transit slated for December. Construction is expected to begin in late 2022 with a targeted start date in fall 2024. The more than $186 million project is expected to improve transit reliability, shorten travel times, reduce congestion and support economic development.
A Metro Transit Network Redesign aimed to create a new system of bus routes to better meet the needs of Madison area residents and businesses is also planned for implementation in 2023.
44 | State of Downtown
Credit: City of Madison
Downtown Madison Pedestrians
The daily average pedestrian count on State Street and King Street in 2021-2022 was 55,223, an increase of 104% from the year prior.
Source: Madison’s Central BID (counts for May 2021-April 2022)
MOBILITYPEDEST
Downtown Madison Mobility in 2021 by the Numbers
Air
• Dane County Regional Airport passengers: 1,413,500, an increase of 66% from 2020
Automobile
• City of Madison parking spaces in downtown: 4,133 off-street (84 ADA accessible) and 1,032 on-street metered (27 designated ADA spaces)
Bus (Metro Transit)
• Fixed route ridership: 5,390,018, an increase of 14.8% from 2020
• Paratransit ridership: 67,993, an increase of 9.8% from 2020
Bicycle
• Bicycle counts on Southwest Path at Monroe St.: 300,652, an increase of 1.5% from 2020
• Bicycle counts on Capital City Trail at North Shore Dr.: 495,085, a decrease of 7.7% from 2020
Bike Share (Madison BCycle)
• Stations: 58
• Miles biked: 978,278, an increase of 22.3% since 2020
Sources: Metro Transit, Madison BCycle, Dane County Regional Airport, City of Madison Traffic Engineering Eco-Totem counts, City of Madison Parking Utility (Offstreet parking spaces include State Street Capitol, Wilson Street, Overture Center, State Street Campus, and Capitol Square North Garages; Brayton, Buckeye, Blair, and Wilson Lots. On-street metered spaces exclude periphery spaces (Schenk’s Corner and Monroe St.) and spaces out-of-service long-term.)

State of Downtown | 45
THOMAS LYNCH CITY OF MADISON TRANSPORTATION DIRECTOR

46 | State of Downtown “Downtown has
changed, and the way people work
I
we’ll want to prepare ourselves
by improving our infrastructure
mass transit
modern rapid transit.”
fundamentally
has fundamentally changed.
think
for the coming decades
and moving into not only
but
CHANGED Means of Transportation to Work Downtown Madison 2011 3.4% 3.4% 0.3% Drove Alone Overture Center (G) Buckeye (L) Government East/Wilson St. (G)* State Street Campus (G) State Street Capitol (G) Capitol Square North (G) South Livingston St. (G) Carpooled Public Transportation Walked Bicycle Other (Taxi, Motorcycle, or Other Means) Worked at Home 40.1% 27.5% 15.2% 10.1% Downtown
2022 City of Madison 2022 8.1% 1.3% Source: U.S. Census
estimates; figures are
margin
percent confidence
zip
38.6% 3.7% 15.6% 28.2% 62.5% 9.0% 8.2% 6.9% 4.0% 6.9% 5.8% 1.3% Occupancy Rates for Garages and Lots in Downtown Madison (percentage) Source:
rates
Wilson
90% 80% 70% 60% 50% 40% 30% 20% 10% 2019 2020 2021
FUNDAME
Madison
Bureau, 2007-2011 and 2016-2020 American Community Survey 5-Year
subject to a
of error based on a 90
interval. Downtown Madison defined as 53703
code.
City of Madison Parking Utility (occupancy
measured from 10am-2pm). *The
Street Garage opened in late June 2020, replacing the Government East Garage. Occupancy is Government East for 2019, average of Government East from January through June and Wilson Street July through December 2020 and Wilson Street for 2021. G=garage, L=lot
FUNDAME CHANGED

State of Downtown | 47
Produced in November 2022 by:
MISSION STATEMENT: Make Downtown Madison an economically strong, inclusive, equitable and vibrant place to live, work and visit.
VALUES STATEMENT: DMI strives to be an inclusive organization committed to respect and generosity of spirit. We believe that diversity strengthens downtown Madison and our entire community and encourage our members to engage with, learn from, and develop an understanding of others. We expect behavior that exhibits respect for all people and supports these values at DMI gatherings.

Downtown
Inc. | 122 W. Washington Ave., Suite 250 | Madison, WI 53703 | www.downtownmadison.org
Madison,
