DOWNTOWN RALEIGH SUMMARY AND HIGHLIGHTS:
There are 14 developments under construction and when completed they will deliver 1,772 residential units, 11,200 square feet of renovated office space, and 56,134 square feet of retail space.1 An additional 41 projects are either working their way through the planning process or have been proposed.1
Six residential developments delivered 710 units in 2024, increasing the total number of residential units downtown to 9,607 units.1 2025 is poised to add even more, with 1,520 units expected to deliver.1 Average asking rent per unit for Q4 2024 is $1,767 and the stabilized apartment occupancy rate* is 88.4%.2 Downtown Raleigh absorbed 477 apartment units through 2024.2
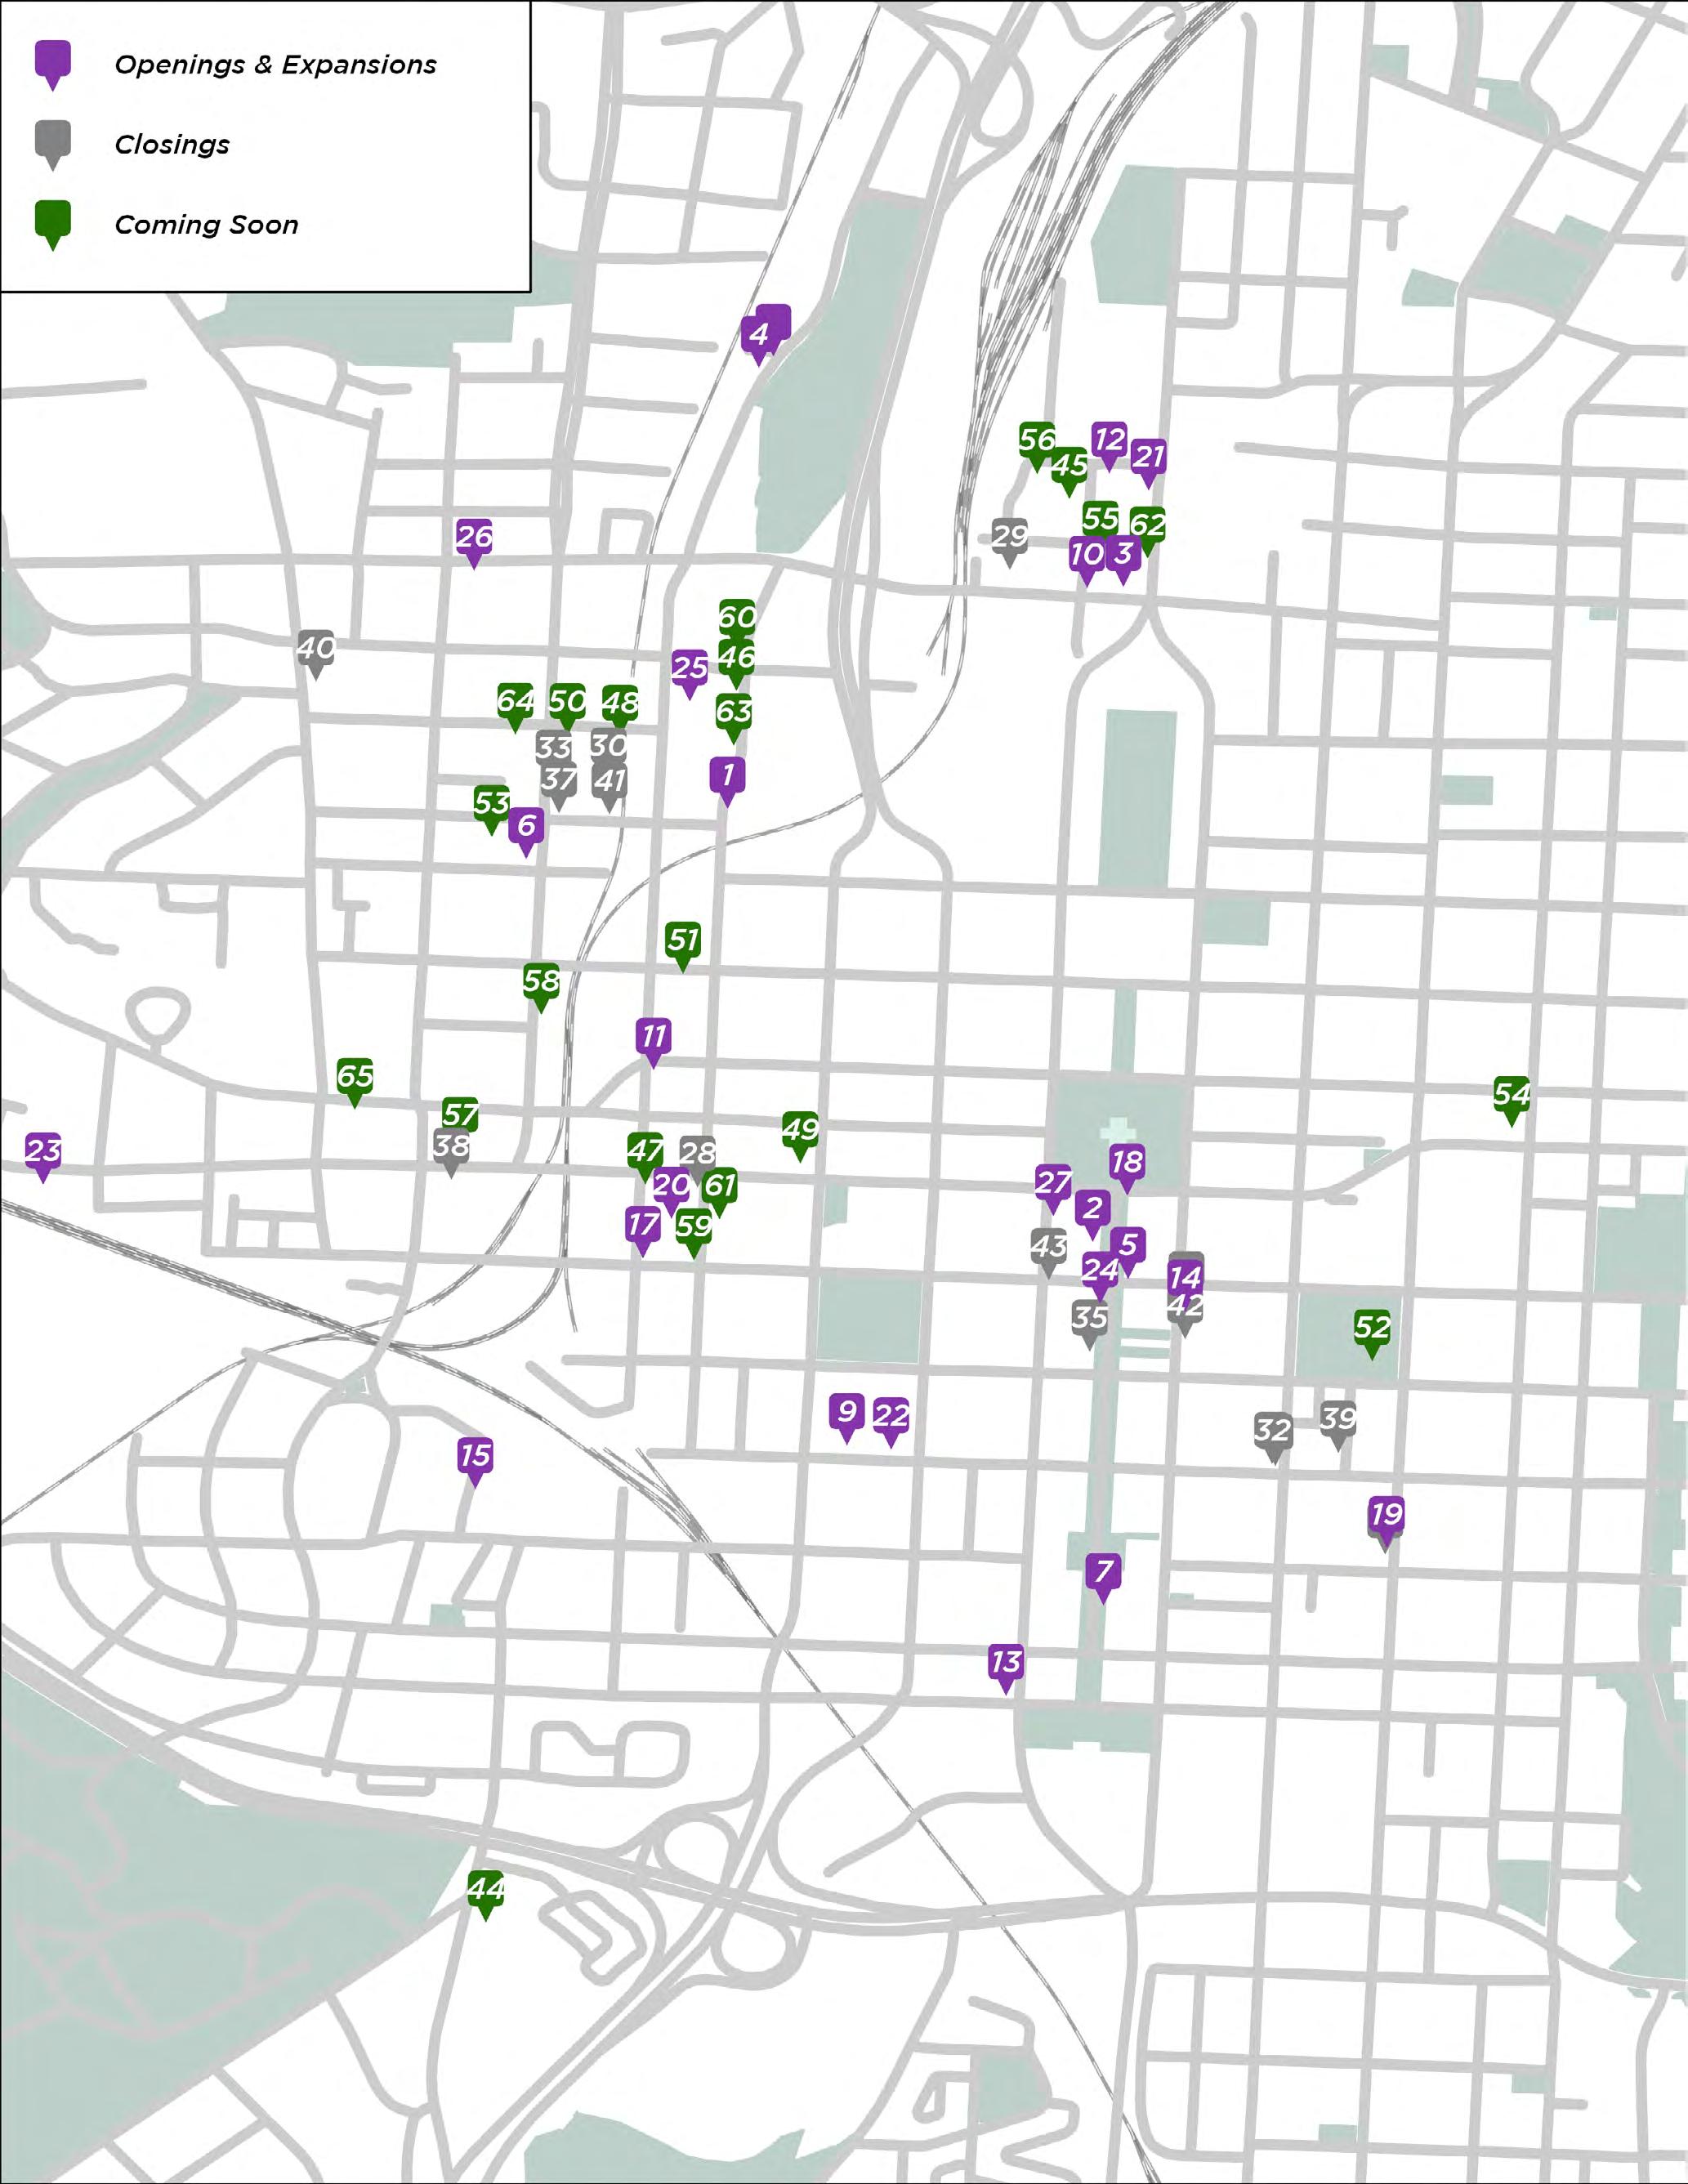
The fourth quarter saw 27 new storefront businesses open and 16 close for a net gain of 11 storefront businesses.1 An additional 22 storefront businesses have announced they will be opening in the near future.1 The fourth quarter also saw five new storefront businesses open along Fayetteville Street 1
14 Q4 2024 PROJECTS UNDER CONSTRUCTION1
1,772 RESIDENTIAL UNITS UNDER CONSTRUCTION1 Q4 2024
1DRA 2CoStar *Stabilized occupancy does not include recently completed projects 27
NEW STOREFRONT BUSINESS OPENINGS1 Q4 2024
Total visitor visits to Downtown Raleigh increased +2.4% year over year for Q4 and were 95.5% of Q4 2019’s total.4 Average monthly food and beverage sales for Q4 in downtown increased by +16.3% over the same period last year.2 Glenwood South saw the largest increase in average monthly food and beverage sales, increasing 21.4% year over year.2
As of Q4 2024, 83.4% of Downtown Raleigh’s 1,789,911 square feet of storefront space is occupied or leased and Downtown Raleigh absorbed 42,010 square feet of storefront space since Q2 2024.1
Office average asking rental rates were $38.50 for Class A in Q4 2024, increasing 3% year over year.7 Downtown Class A direct vacancy, although up in 2024, remains the lowest in the region at 15.7%.6 400H, Downtown Raleigh’s newest office development, has signed their first office tenants: STV Inc. and Savills.8 Significant office announcements included Smith Anderson announcing plans to expand by two additional floors at the 150 Fayetteville building to bring its total footprint to 112,327sf to support its team of over 260 people.8
Two new hotels delivered in 2024, the dualbrand Tempo by Hilton & Homewood Suites and Hyatt House, adding 410 hotel rooms and increasing the total inventory of hotel rooms in downtown by +25%. 1 Average monthly hotel room tax revenue increased +20.8% year over year for the two months of October and November.2
419 S East St, a .38 acre parcel on the eastern edge of Downtown Raleigh, sold in October for $1.38 million.5 519 S Blount St, an approximately 4,000 square foot two-story building built in 1945, solid in October for $1.15M.5
84.3%
Class A Office Direct Occupancy Q4 20246
+6.2%
INCREASE
Total Visits To Fayetteville Street Year Over Year Q4 20244
$28.7M
Estimated Average Monthly Food & Beverage Sales October & November2
+20.8% INCREASE
Average Monthly Hotel Room Sales Revenue From Q4 20232
1.8M Q4 20244 UNIQUE VISITORS
1DRA
2Wake County
3Eco-Counter
4Placer.ai
5CoStar
6JLL
7CBRE
8Triangle Business Journal
Overall, there is $7.4 billion of investment in the current Downtown Raleigh development pipeline.1 This includes an estimated $2.7 billion in projects completed since 2015, $824 million in projects under construction, and $3.8 billion in proposed or planned developments.1
$2.7 Completed (since 2015) BILLION $824 Under Construction as of Q4 MILLION $3.8 in Site Preparation/ Proposed/Planned Developments BILLION
$7.4 Completed since 2015, Under Construction, and Planned Developments BILLION
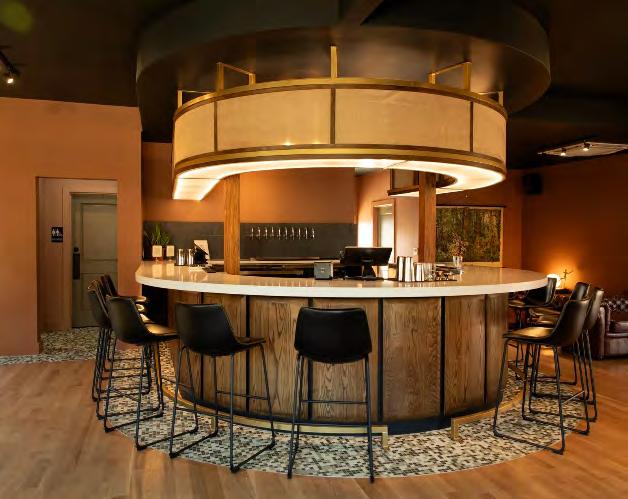
Construction has completed on Bend Bar, a 3,350+ square foot retail development located at 853 W Morgan Street. The three 100+ year old houses have been renovated and connected via a large shared porch and patio space. State of Beer has opened their new location ahead of their upcoming move from 401 Hillsborough in 2026.
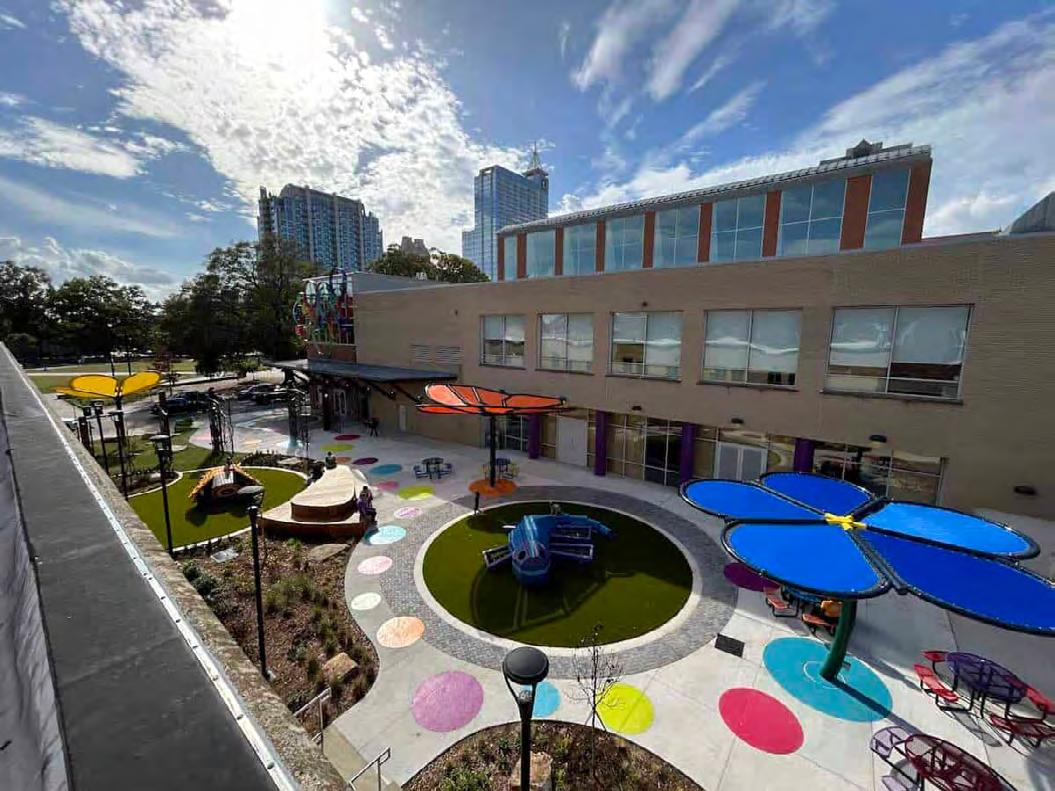
The Marbles Kids Museum has completed construction on the Playway, an outdoor play space that features vibrant shade structures, picnic tables, pollinator pals for climbing and greenspace with native plants. Museum admission is not required to play in this space, enriching the outdoor experience for all families passing through Downtown Raleigh.
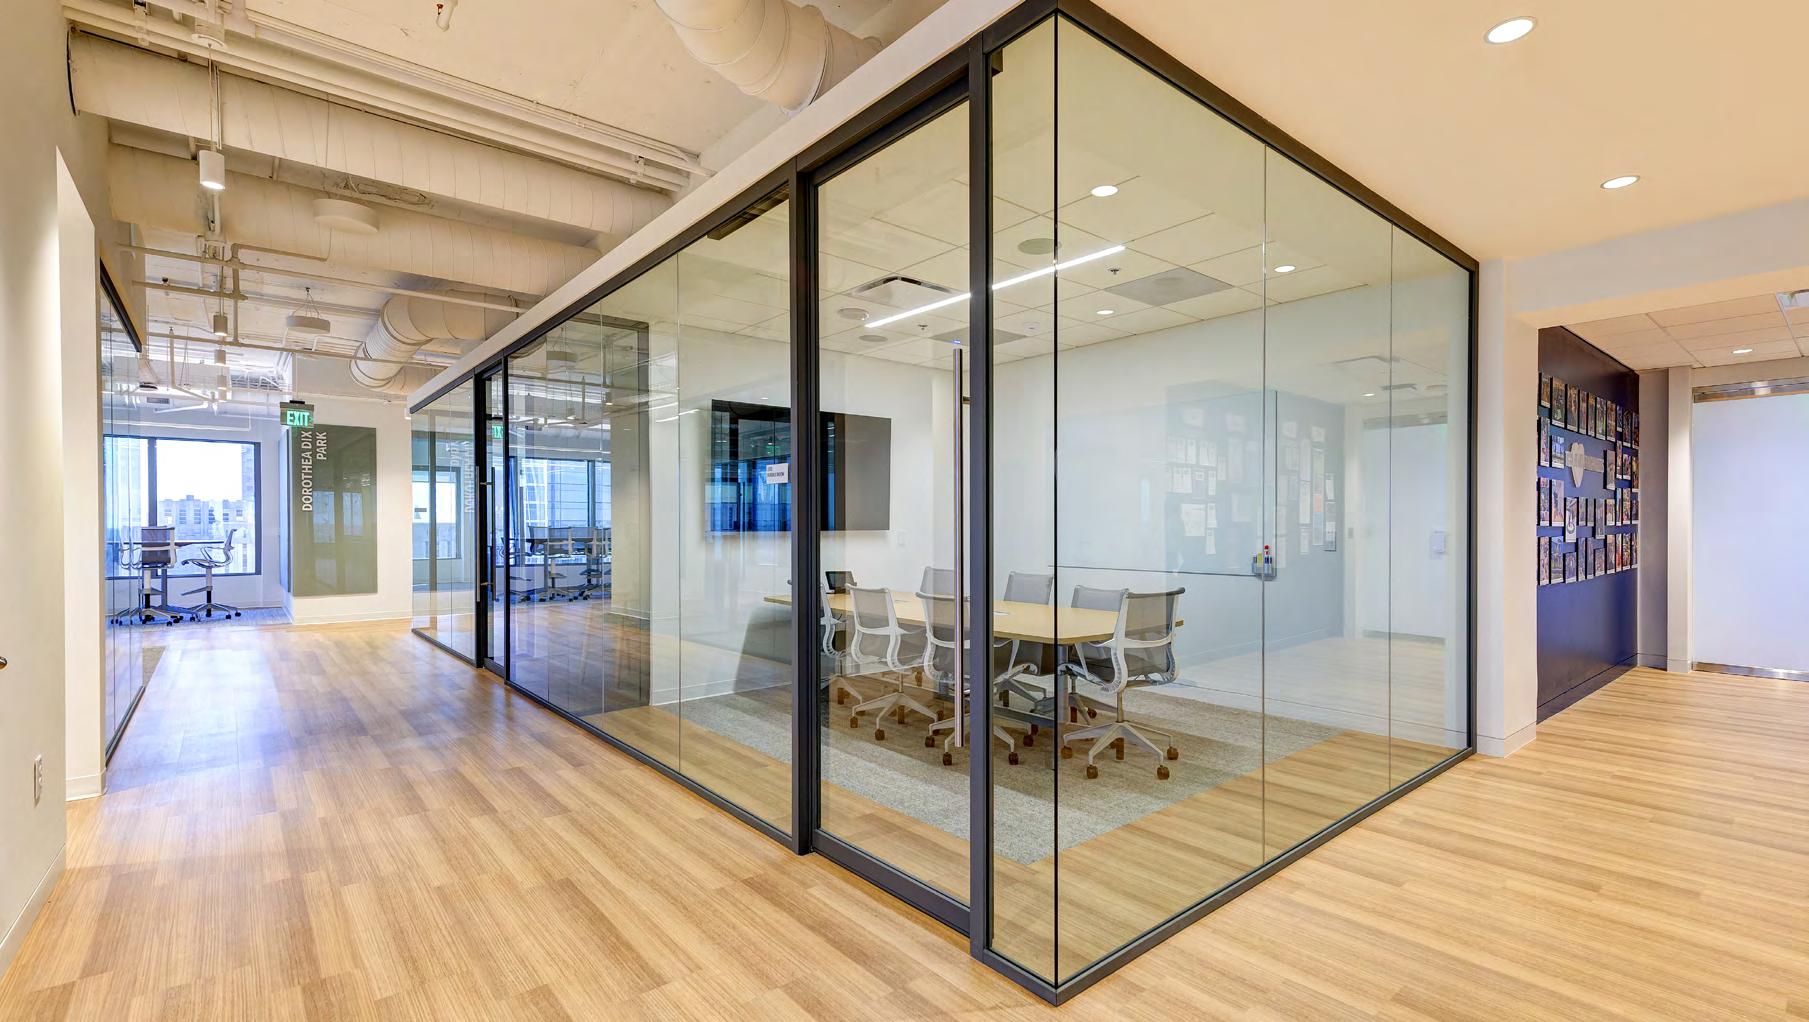
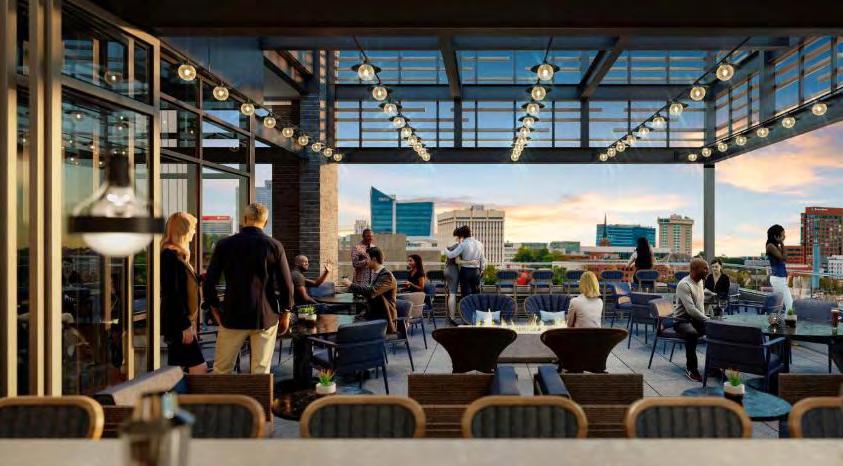
The dual-branded Tempo by Hilton & Homewood Suites at 200 W Davie has completed construction, adding 261 hotel rooms and another rooftop bar called Urban Oak. The development is approximately one block north of the soon to be expanded Raleigh Convention Center and improved Red Hat Amphitheater. The hotel features a fitness center for guests and an on-site restaurant.
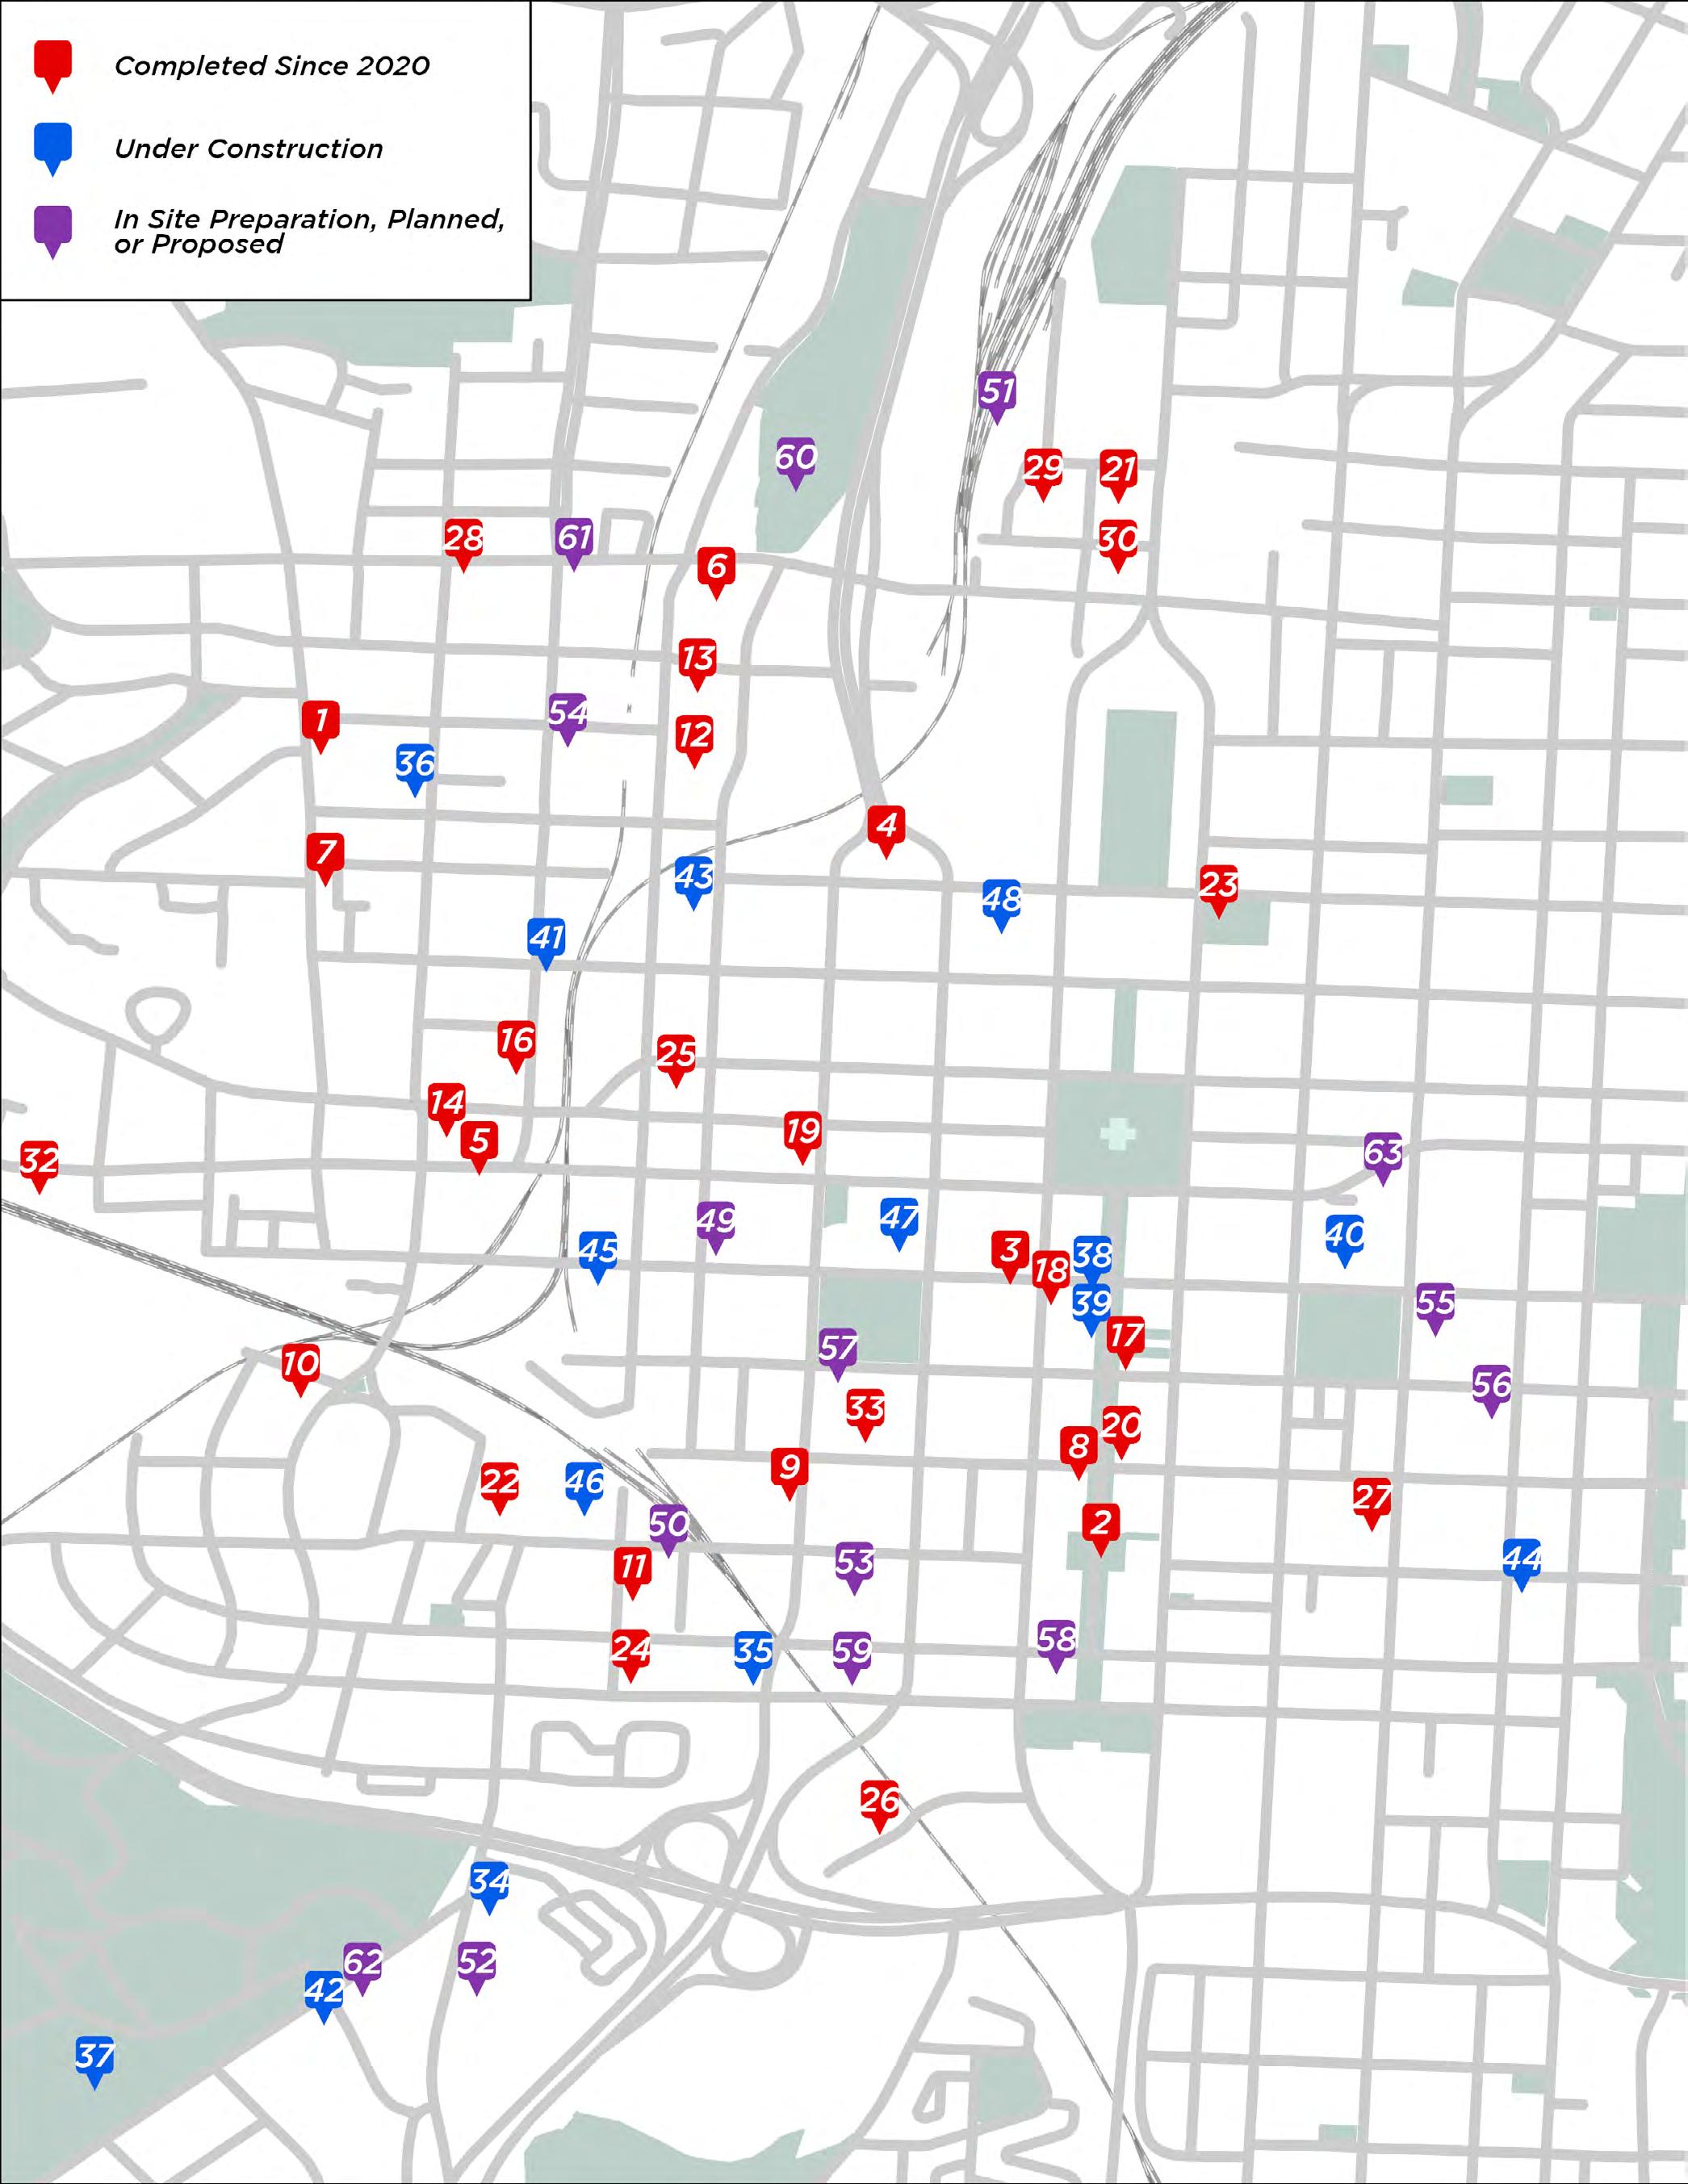
An interactive development map with updated listings of project information and images is viewable at downtownraleigh.org/ do-business/ developments
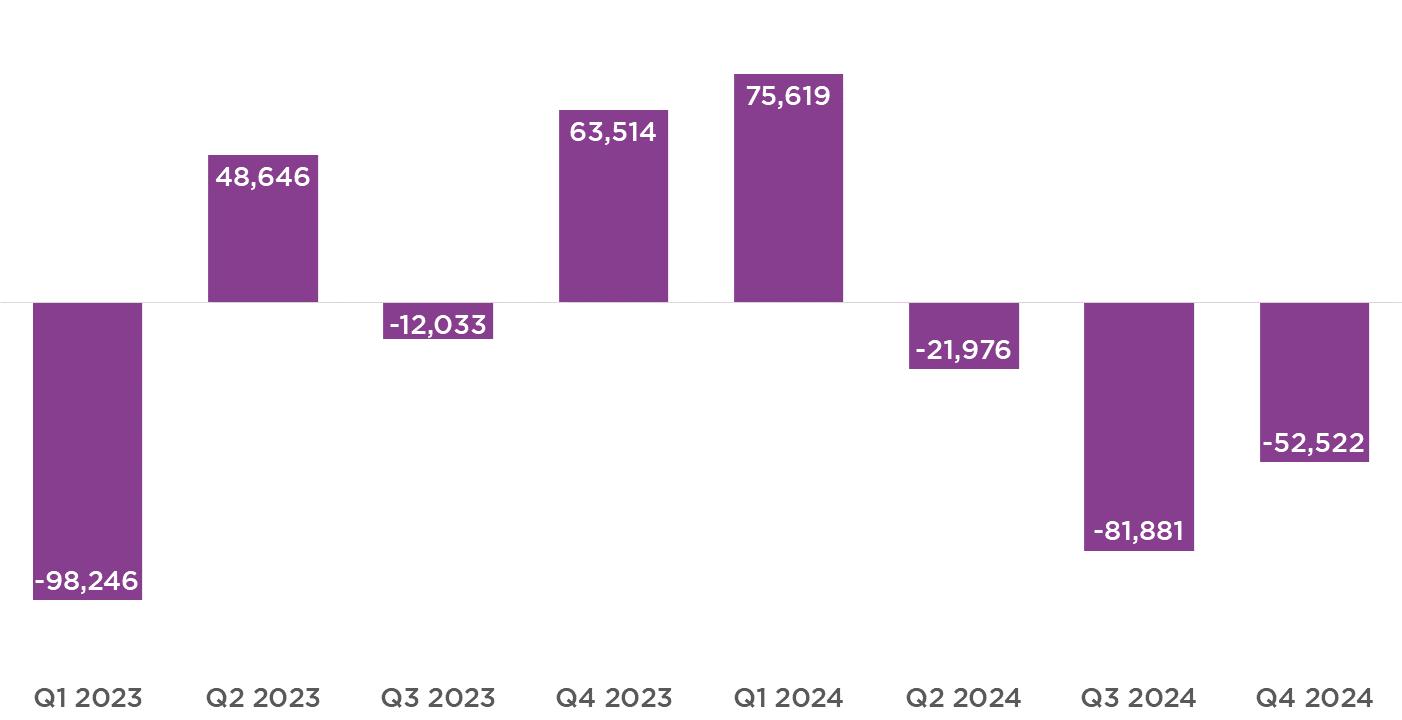
Downtown’s newest office development, 400H, has signed their first office tenants with STV Inc. and Savills signing leases.4 Significant office announcements included Smith Anderson announcing plans to expand by two additional floors at the 150 Fayetteville building to bring its total footprint to 112,327sf to support its team of over 260 people.4 Class A average asking rental rates were $38.50 in Q4 2024, increasing 3% year over year.2 Downtown Class A direct vacancy, although up in 2024, remains the lowest in the region at 15.7%.1 Class A office net absorption for the fourth quarter in Downtown Raleigh has absorbed +274,829 square feet of Class A space since Q1 2020.1
PERFORMANCE INDICATOR: CLASS A TOTAL NET ABSORPTION (SF)1
OFFICE MARKET
Class A Office Average Rent PSF2
Class A Office Net Absorption1 $38.50
-52,522 SF
6,424,512 SF Total Office Inventory2 84.3% Class A Office Occupancy Rate1
Class A Delivered Since 20203 Q4 2024
898,412 SF
1JLL 2CBRE
3DRA
4Triangle Business Journal
+274,829 SF CLASS A OFFICE NET ABSORPTION SINCE Q1 2020¹
the resident pool at The Signal apartments in Seaboard Station Credit: Creative Impressions Media
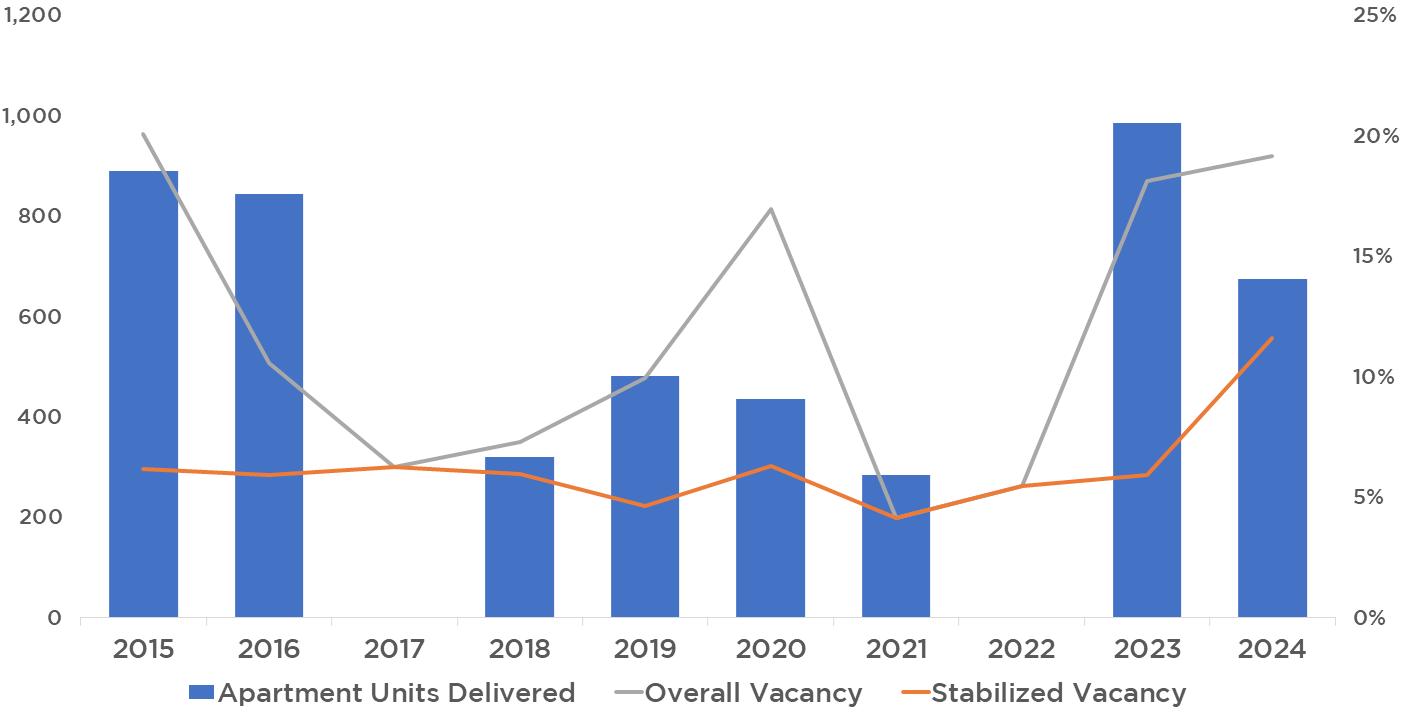
Downtown Raleigh saw 710 residential units delivered in 2024 and currently has 1,772 additional units under construction.2 2025 is poised to add even more, with 1,520 units expected to deliver.2 Another 7,820 units have either been proposed or are in planning.2
Average asking rent per unit for Q4 2024 is $1,767, decreasing 3% year over year.1 Downtown Raleigh’s stabilized apartment occupancy rate is 88.4%, this does not include recently completed developments still in their initial lease up.1 Downtown Raleigh absorbed 477 apartment units through 2024.1
PERFORMANCE INDICATOR: APARTMENT UNITS DELIVERED AND VACANCY1
RESIDENTIAL MARKET
Q4 2024
$1,767 Average Asking Rent per Unit1
Units Delivered in 20242
710
1,772 Units Under Construction2
9,607 units Residential Inventory2
1CoStar 2DRA 88.4% Stabilized Occupancy1
#6 U.S. News August 2024 Raleigh BEST PLACE TO LIVE IN THE U.S.
#5
U.S. News August 2024 Raleigh BEST PLACE FOR QUALITY OF LIFE IN THE U.S.
There were 27 storefront business openings and a net gain of 11 new storefront businesses this quarter.1 Another 22 storefront businesses are announced as coming soon to downtown.1 Five businesses opened along Fayetteville Street with more opening early in Q1 of this year.1
Total visitor visits increased +2.4% year over year for Q4 and were 95.5% of Q4 2019’s total.2 Visits to Fayetteville Street saw the largest increase at +6.5% year over year.2
PERFORMANCE INDICATOR: TOTAL VISITOR VISITS TO DOWNTOWN RALEIGH2
RETAIL MARKET
Q4 2024
Retail SF Under Construction1
56,134
Retail SF Planned or Proposed1
243,507
27 New Storefront Business Openings & Expansions (Q4)1
22 Storefront Business Coming Soon1
#1 LendingTree 2023 Raleigh BEST CITY TO START A BUSINESS 1DRA 2Placer.ai
Q4 2024 VISITS YEAR OVER YEAR2 +2.4% INCREASE
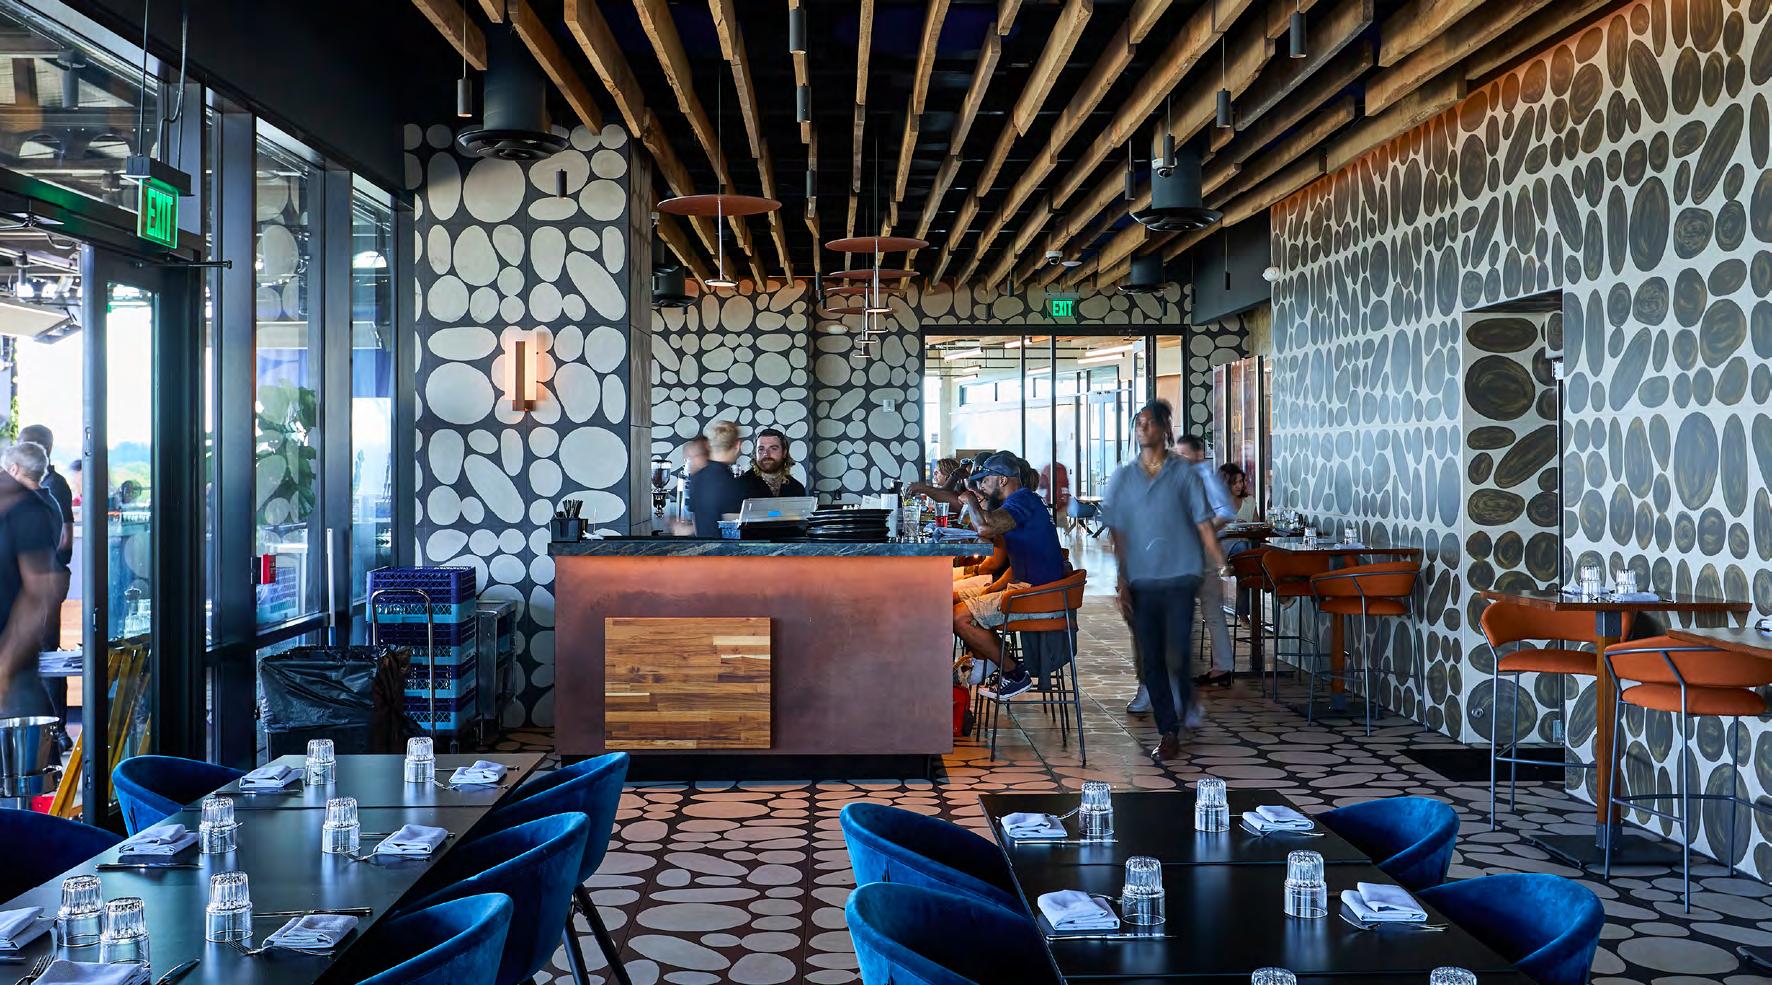
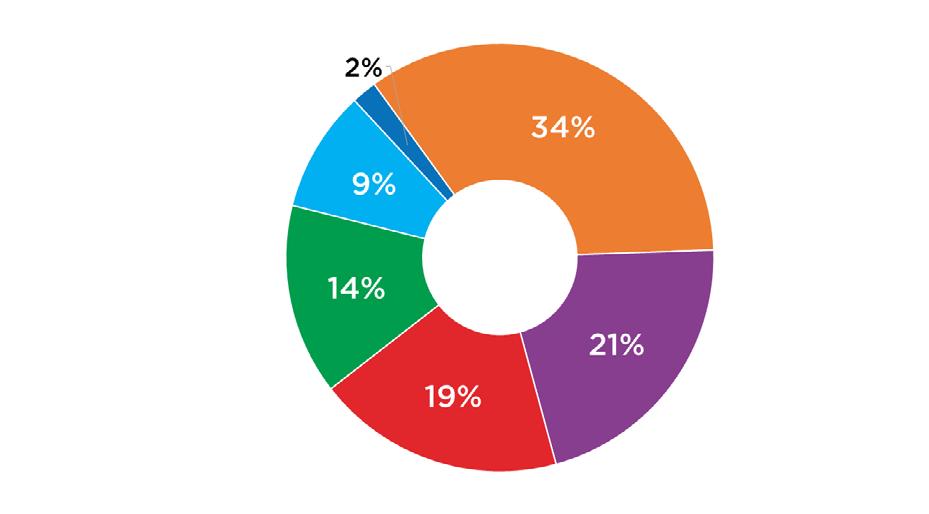
Average monthly food and beverage sales for Q4 in downtown increased by +16.3% over the same period last year. The Q4 monthly average for the Glenwood South District increased by 21.4% year over year, the most of any district, and was 42% higher than in 2019.
FOOD AND BEVERAGE SALES BY DISTRICT IN Q41
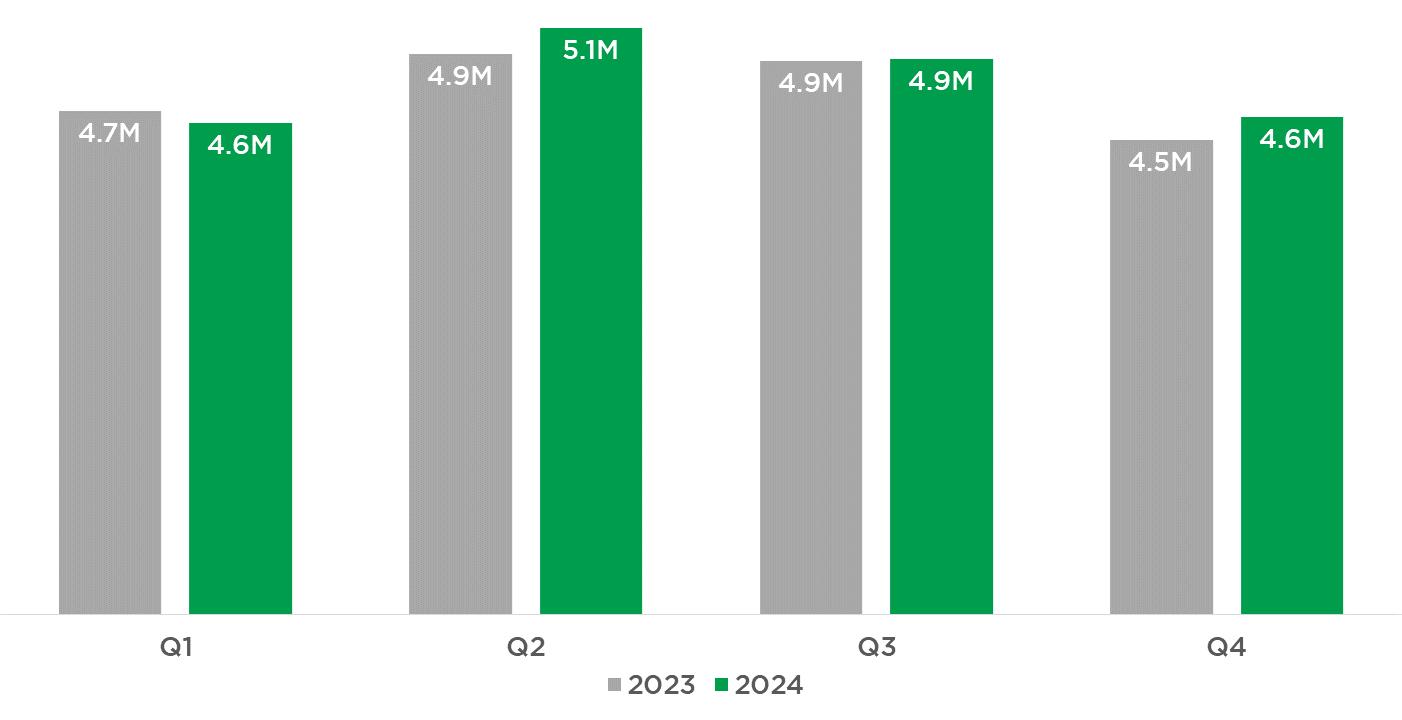
AVERAGE MONTHLY FOOD AND BEVERAGE SALES BY QUARTER1
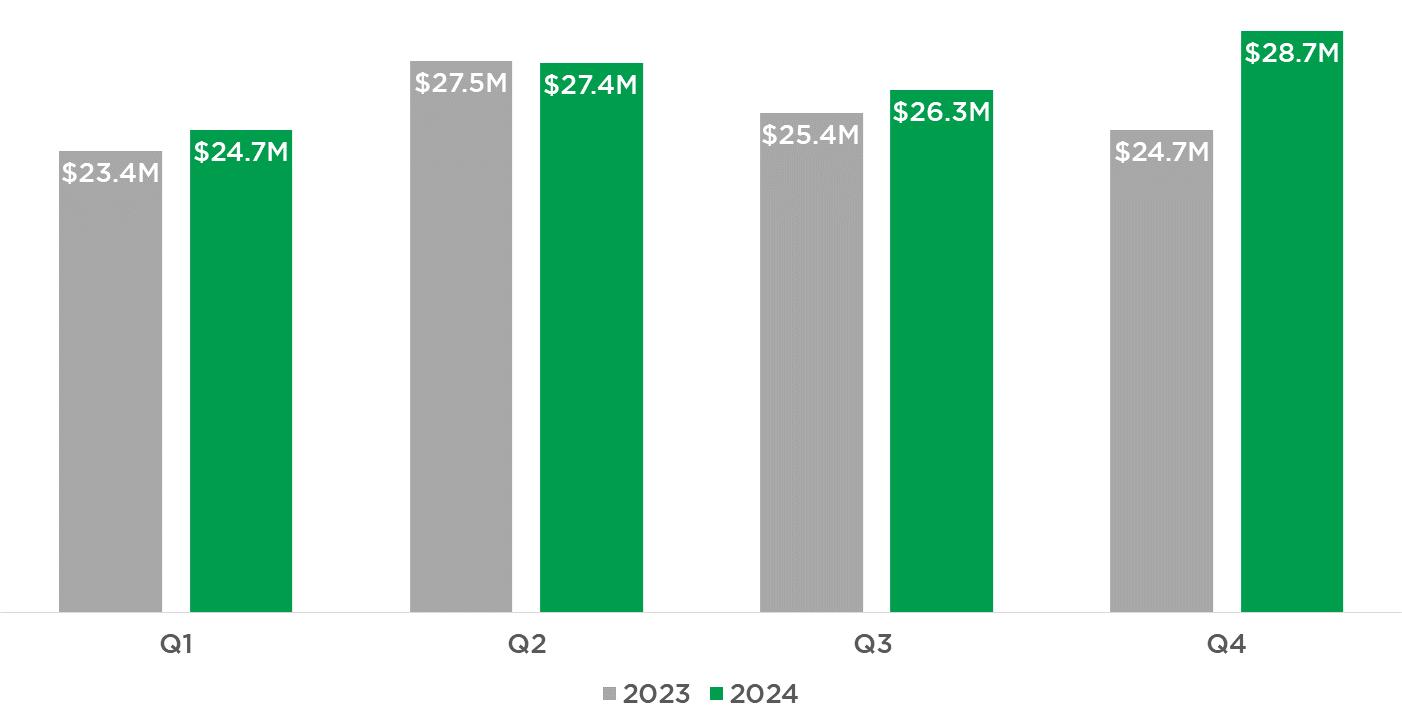
$28.7 MILLION Average Monthly Food & Beverage Sales in Q41* $27.7 Million in Q4 2023
160+ Restaurants & Bars In Downtown With Outdoor Seating2 1Wake County Tax Administration, DRA *Only July & August data available 2DRA 9 Craft Breweries & Distilleries In Downtown2
Q4 2023 TO Q4 2024*1 Seaboard Person District
Q4 2019 TO Q4 2024*1
Looking for retail space?
Visit: downtownraleigh.org/ do-business/space-available


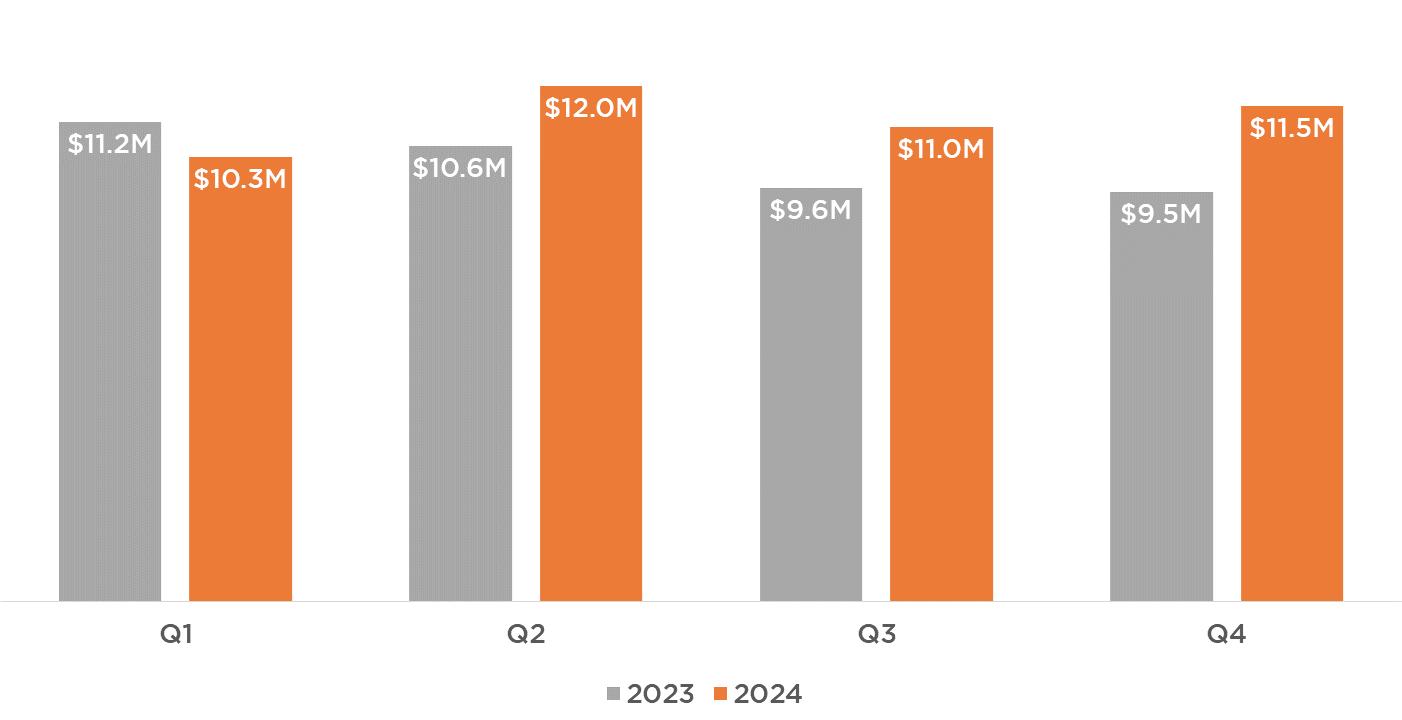
Average monthly hotel room tax revenue increased +20.8% year over year for the two months of October and November, the only two months available. Hotel room tax revenue year to date through November has increased +6.7% over the same period in 2023. Two new hotels delivered in 2024, the dualbrand Tempo by Hilton & Homewood Suites and Hyatt House, adding 410 hotel rooms and increasing the total inventory of hotel rooms in downtown by +25%. There are currently no hotel rooms under construction and 1,840 hotel rooms planned or proposed for downtown.
PERFORMANCE INDICATOR:
DOWNTOWN AVERAGE MONTHLY HOTEL ROOM REVENUE1 Hotel revenue increased +20.8% year over year in Q4 20241
HOTEL + TOURISM MARKET
Q4 2024
1,950 Hotel Room Inventory3
748 New Hotel Rooms Added Since 20203
1.8M Unique Downtown Visitors in Q42
$11.5M Average Monthly Hotel Room Revenue Q41*
1Wake County Tax Administration, DRA 2Placer.ai 3DRA
*Only October & November Data Available
+6.7% INCREASE 2024 YTD OVER 20231
Downtown Raleigh Alliance has updated the Storefront Inventory released in the 2024 State of Downtown. The inventory provides an account of storefront vacancy at the individual storefront level, enabling detailed block level analysis of downtown’s evolving storefront economy.
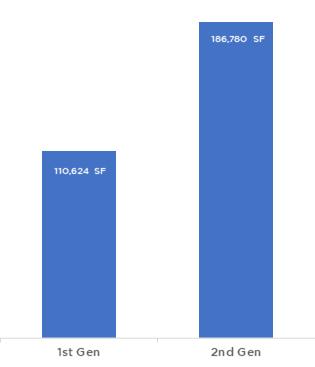
As of Q4 2024, 83.4% of Downtown Raleigh’s 1,789,911 square feet is occupied. Downtown Raleigh has absorbed 42,010 square feet of storefront space since Q2 2024. Seaboard + Person Street saw 37,675 square feet get absorbed, the most of any downtown district, as the recently completed Seaboard Station development continues to lease up. Fayetteville Street also saw significant leasing activity and had positive net absorption. Almost two-thirds, 63%, of downtown’s vacant storefront space is concentrated in 2nd generation space.
The Storefront Inventory will be updated for Q2 2025 and the results will be released in the upcoming State of Downtown 2025 Report.
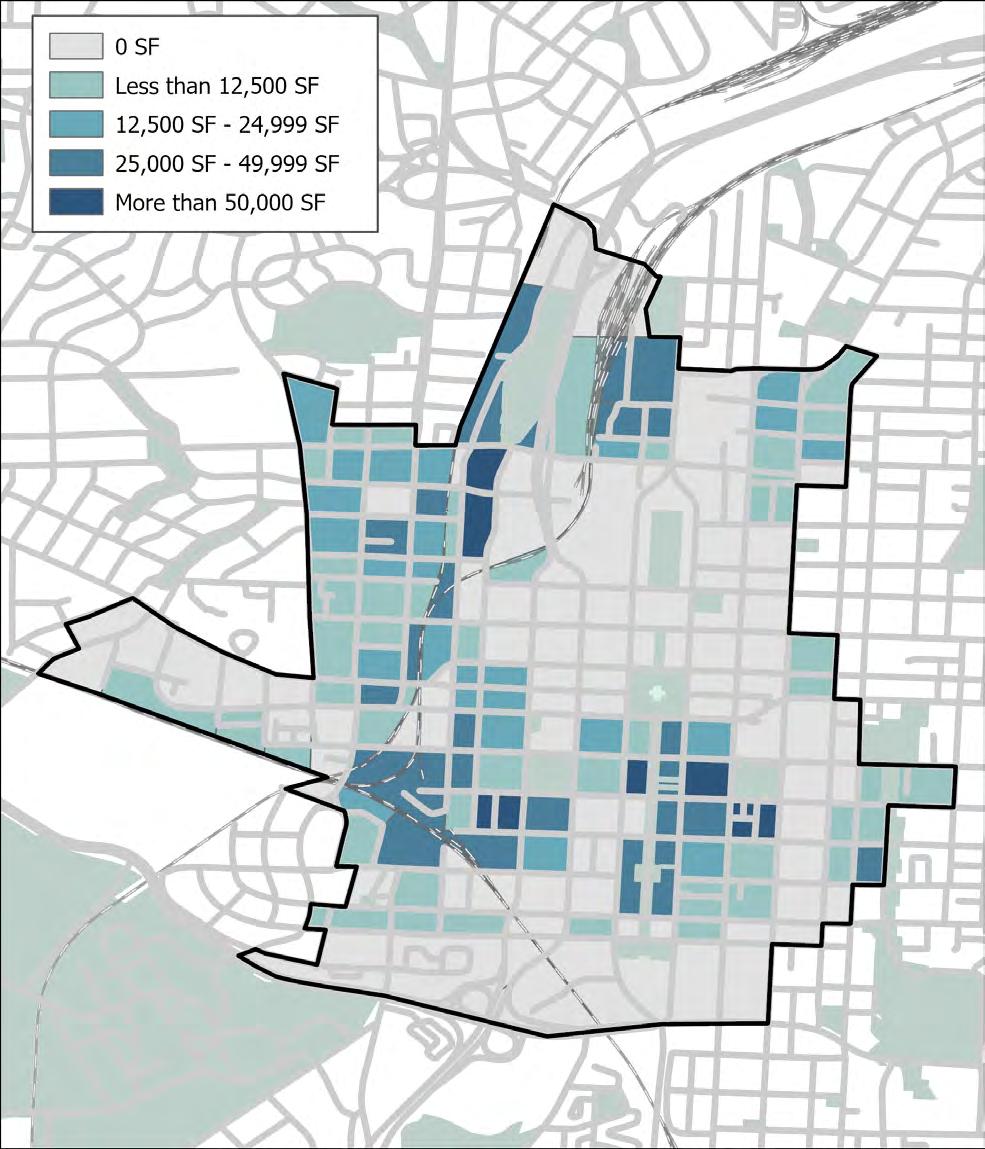
STOREFRONT INVENTORY Q4 2024 RESULTS
13,700+
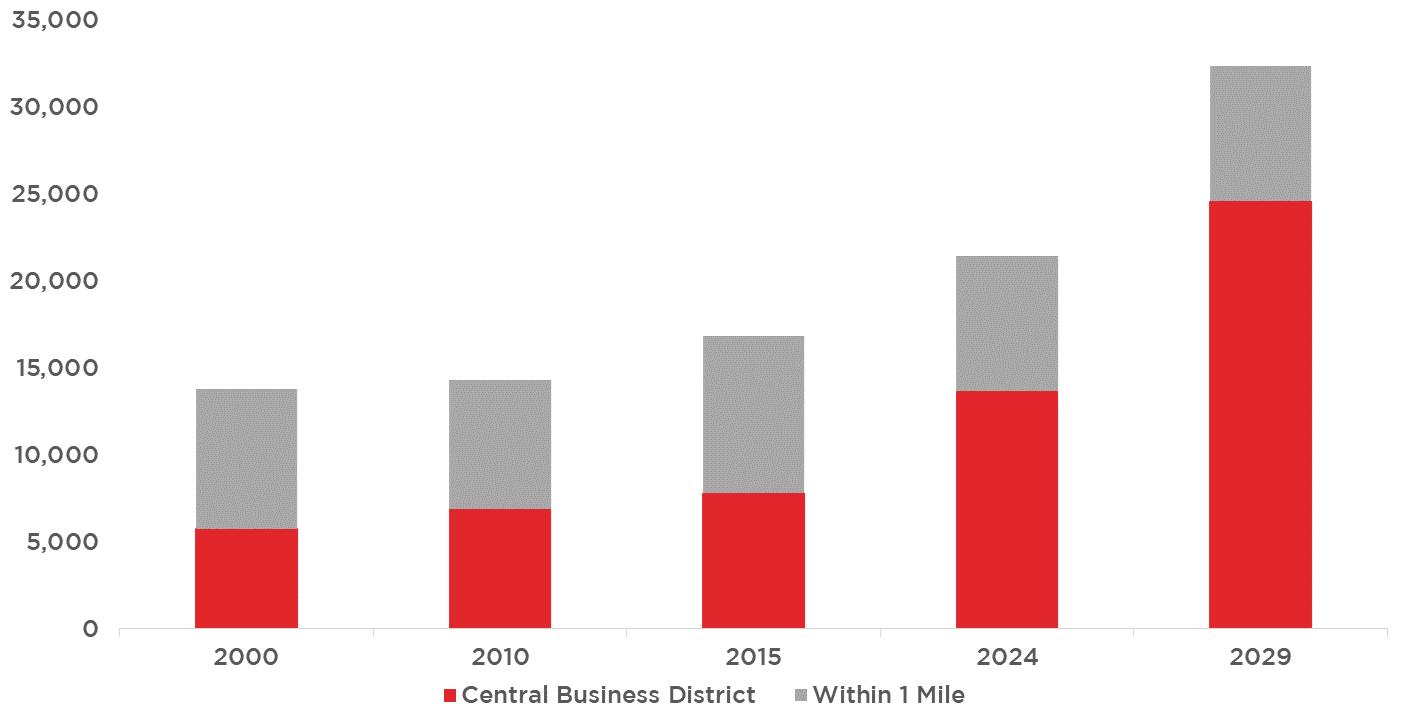
Resident Population1 Employees Within 1 Mile of the State Capitol1
48,500+
19.1M Visitor Visits Per Year2
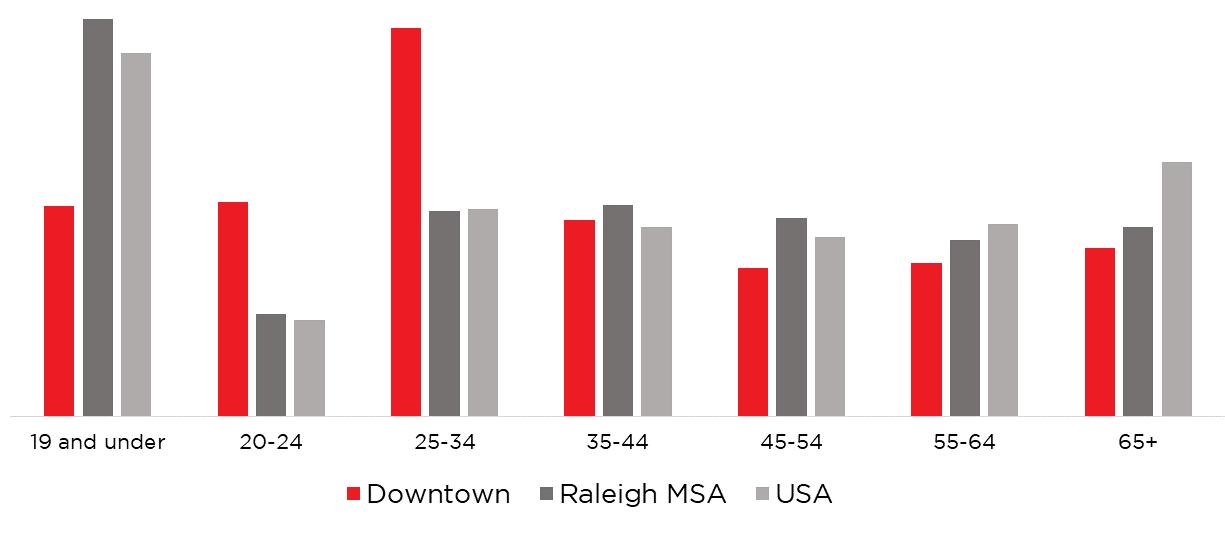
Median Age1 Average Household Income1 Bachelor’s Degree or Higher1 DOWNTOWN POPULATION GROWTH
32.8
149K
71.1%
44.7% Of population between ages 20-341
DRA has a mission of advancing the vitality of Downtown Raleigh for everyone. DRA facilitates this mission through five goals:
1 2 3 4 5
Improve downtown economy through recruitment, pop-ups, financial support, research, marketing & promotions;
Advocate to make downtown a place for everyone that reflects evolving needs and interests of the community and lessons learned from the recent past;
Make downtown an engaging place to live, work, and visit through safe activations that appeal to a wide variety of stakeholders;
Improve and maintain a sense of safety and security in downtown through our Ambassador program, Social Services and work with RPD; and,
Elevate and improve DRA’s internal organization and processes through improved database, project management, communication, financial stewardship, and planning.
For additional information and resources visit: downtownraleigh.org/do-business
CONTACT FOR QUESTIONS:
Gabriel Schumacher Research Manager
Downtown Raleigh Alliance 919.821.6981 // gabrielschumacher@downtownraleigh.org
DOWNTOWN BOUNDARY AND DISTRICT MAP