The Annual Strategic Impact Assessment (ASIA) is a high-level analytical document which reviews the college’s progress in delivering our Strategic Plan. It explicitly assesses the impact the college has made on its learners and the wider economy. The Annual Strategic Impact Assessment subsumes the former self-assessment report, and the College has been using this format since 2014-15.
Our Annual Strategic Impact Assessment 2023-24 format remains much like the previous year. It still aims to show clearly the main strategic outputs that we have achieved for every key client group that we serve. Where possible this is benchmarked against appropriate national comparators, thereby allowing all stakeholders to see how the College has performed in terms of key outputs such as: achievement, diversity, participation, satisfaction and regional skills priorities.
We hope that this format allows stakeholders to see the impact the College has achieved both in terms of our strategic outputs and the work undertaken over the past year. We are incredibly proud of the role the College has played and continues to play in supporting our community. Further information on the College’s performance can be found on the Dudley Dashboard on the college’s website. This is updated throughout the year to keep our stakeholders informed of our ongoing performance. Details of our future plans can also be seen in our Strategic Plan 2024-27, which is also available on our website.
We also recognise that we could not have made our achievements without the incredible support of our community, partners and the employers we serve locally. Dudley College of Technology is proud to be a member of a fantastic community which is working together for the benefit of us all. We thank you, as always, for your support.
1.1 EXECUTIVE SUMMARY - BALANCED SCORECARD
HOW IS THE COLLEGE PERFORMING FOR EACH KEY CLIENT GROUP?
16-18 LEARNERS
The overall performance of this key client group is ‘above expectations’. Due to the continued growth in numbers this group now exceeds expectations in terms of participation rates and financial contribution. This group continues to exceed expectations in diversity of our learners and the alignment of our programmes to regional skills needs. All other measures are currently meeting college expectations. Whilst there are some excellent outcomes in these measures, there are further improvements we wish to achieve.
A-LEVEL LEARNERS
The overall performance of this key client group is ‘above expectations.’ It is particularly pleasing to see our continued trend in high grade performance and the positive destinations our students go on to after completing their studies with us. We will continue to drive for the highest achievement across all groups of A-level students.
ADULT LEARNERS
The overall performance of this key client group is ‘meets expectations’. The group is exceeding expectations in terms of satisfaction and the sheer diversity of learners and provision that we offer. We are pleased to see our collaborative work with West Midlands Combined Authority better equipping local residents with the skills required to contribute towards ambitious growth for the region, but we recognise we must do more to support more people to access training and move forward with successful employment.
APPRENTICESHIPS
The overall performance of this key client group is ‘meets expectations’. This group continues to exceed expectations in terms of regional impact; however, we need to do more around participation, diversity and financial impact. We are aware of some apprentices not completing on time, however, pass rates are high within this provision.
HIGHER SKILLS LEARNERS
The overall performance of this key client group is ‘meets expectations’. Our focus has been around increasing the range of programmes at higher level by offering non-traditional routes to Higher Education, delivered from the Black Country and Marches Institute of Technology (BCM IoT) and in partnership with employers and Universities. We are looking to increase the number of students progressing from feeder programmes to the College’s high-level provision.
HIGH NEEDS LEARNERS
The overall performance of this key client group is ‘meeting expectations’. We are very proud of the diverse student body who achieve at least as well as their peers, as well as the very high satisfaction we have for these programmes. Our focus going forward is to continue to expand opportunities for more high needs learners to transition into the workplace for their benefit and the regions.
2. FULL-TIME LEARNERS AGED
16-18 YEARS
BALANCED SCORECARD
The overall performance of this key client group is ‘above expectations’. Due to the continued growth in numbers this group now exceeds expectations in terms of participation rates and financial contribution. This group continues to exceed expectations in diversity of our learners and the alignment of our programmes to regional skills needs.
All other measures are currently meeting college expectations. Whilst there are some excellent outcomes in these measures, there are further improvements we wish to achieve.
SUMMARY OF OUTPUTS
What key outputs did we achieve?
We continued to maintain high levels of local participation in skills-based learning:
− We experienced growth in enrolments of 16-18 learners compared to the previous year, with 4,877 young people engaging in college programmes against 4,531 in 2022/23.
We successfully engaged learners from diverse communities:
− We saw an increase of 16–18-year-old learners (+2.2%) from ethic minority groups participating in study, totalling 1,824 (37.4%). Notably, our learners are more diverse than the local community where 11.9% of the population are from minority groups.
− Almost a quarter of our students, 1,161 learners (23.8%) reported a learning difficulty or disability.
− Over half, 2,492 learners (51.1%) engaged with us from the lowest bands of deprivation.
We supported high numbers of learners to successfully achieve their chosen programme of study:
− 85% of all 16-18 learners achieved their qualifications which is in line with national rates and an improvement of 3% from the previous year.
All vocational qualifications, at all levels increased in achievement rates demonstrating a 3 year upward trend for our 16-18 provision.
− 96.7% of T Level learners who complete their studies passed their qualification.
We made a significant impact on the local skills gap by upskilling young people:
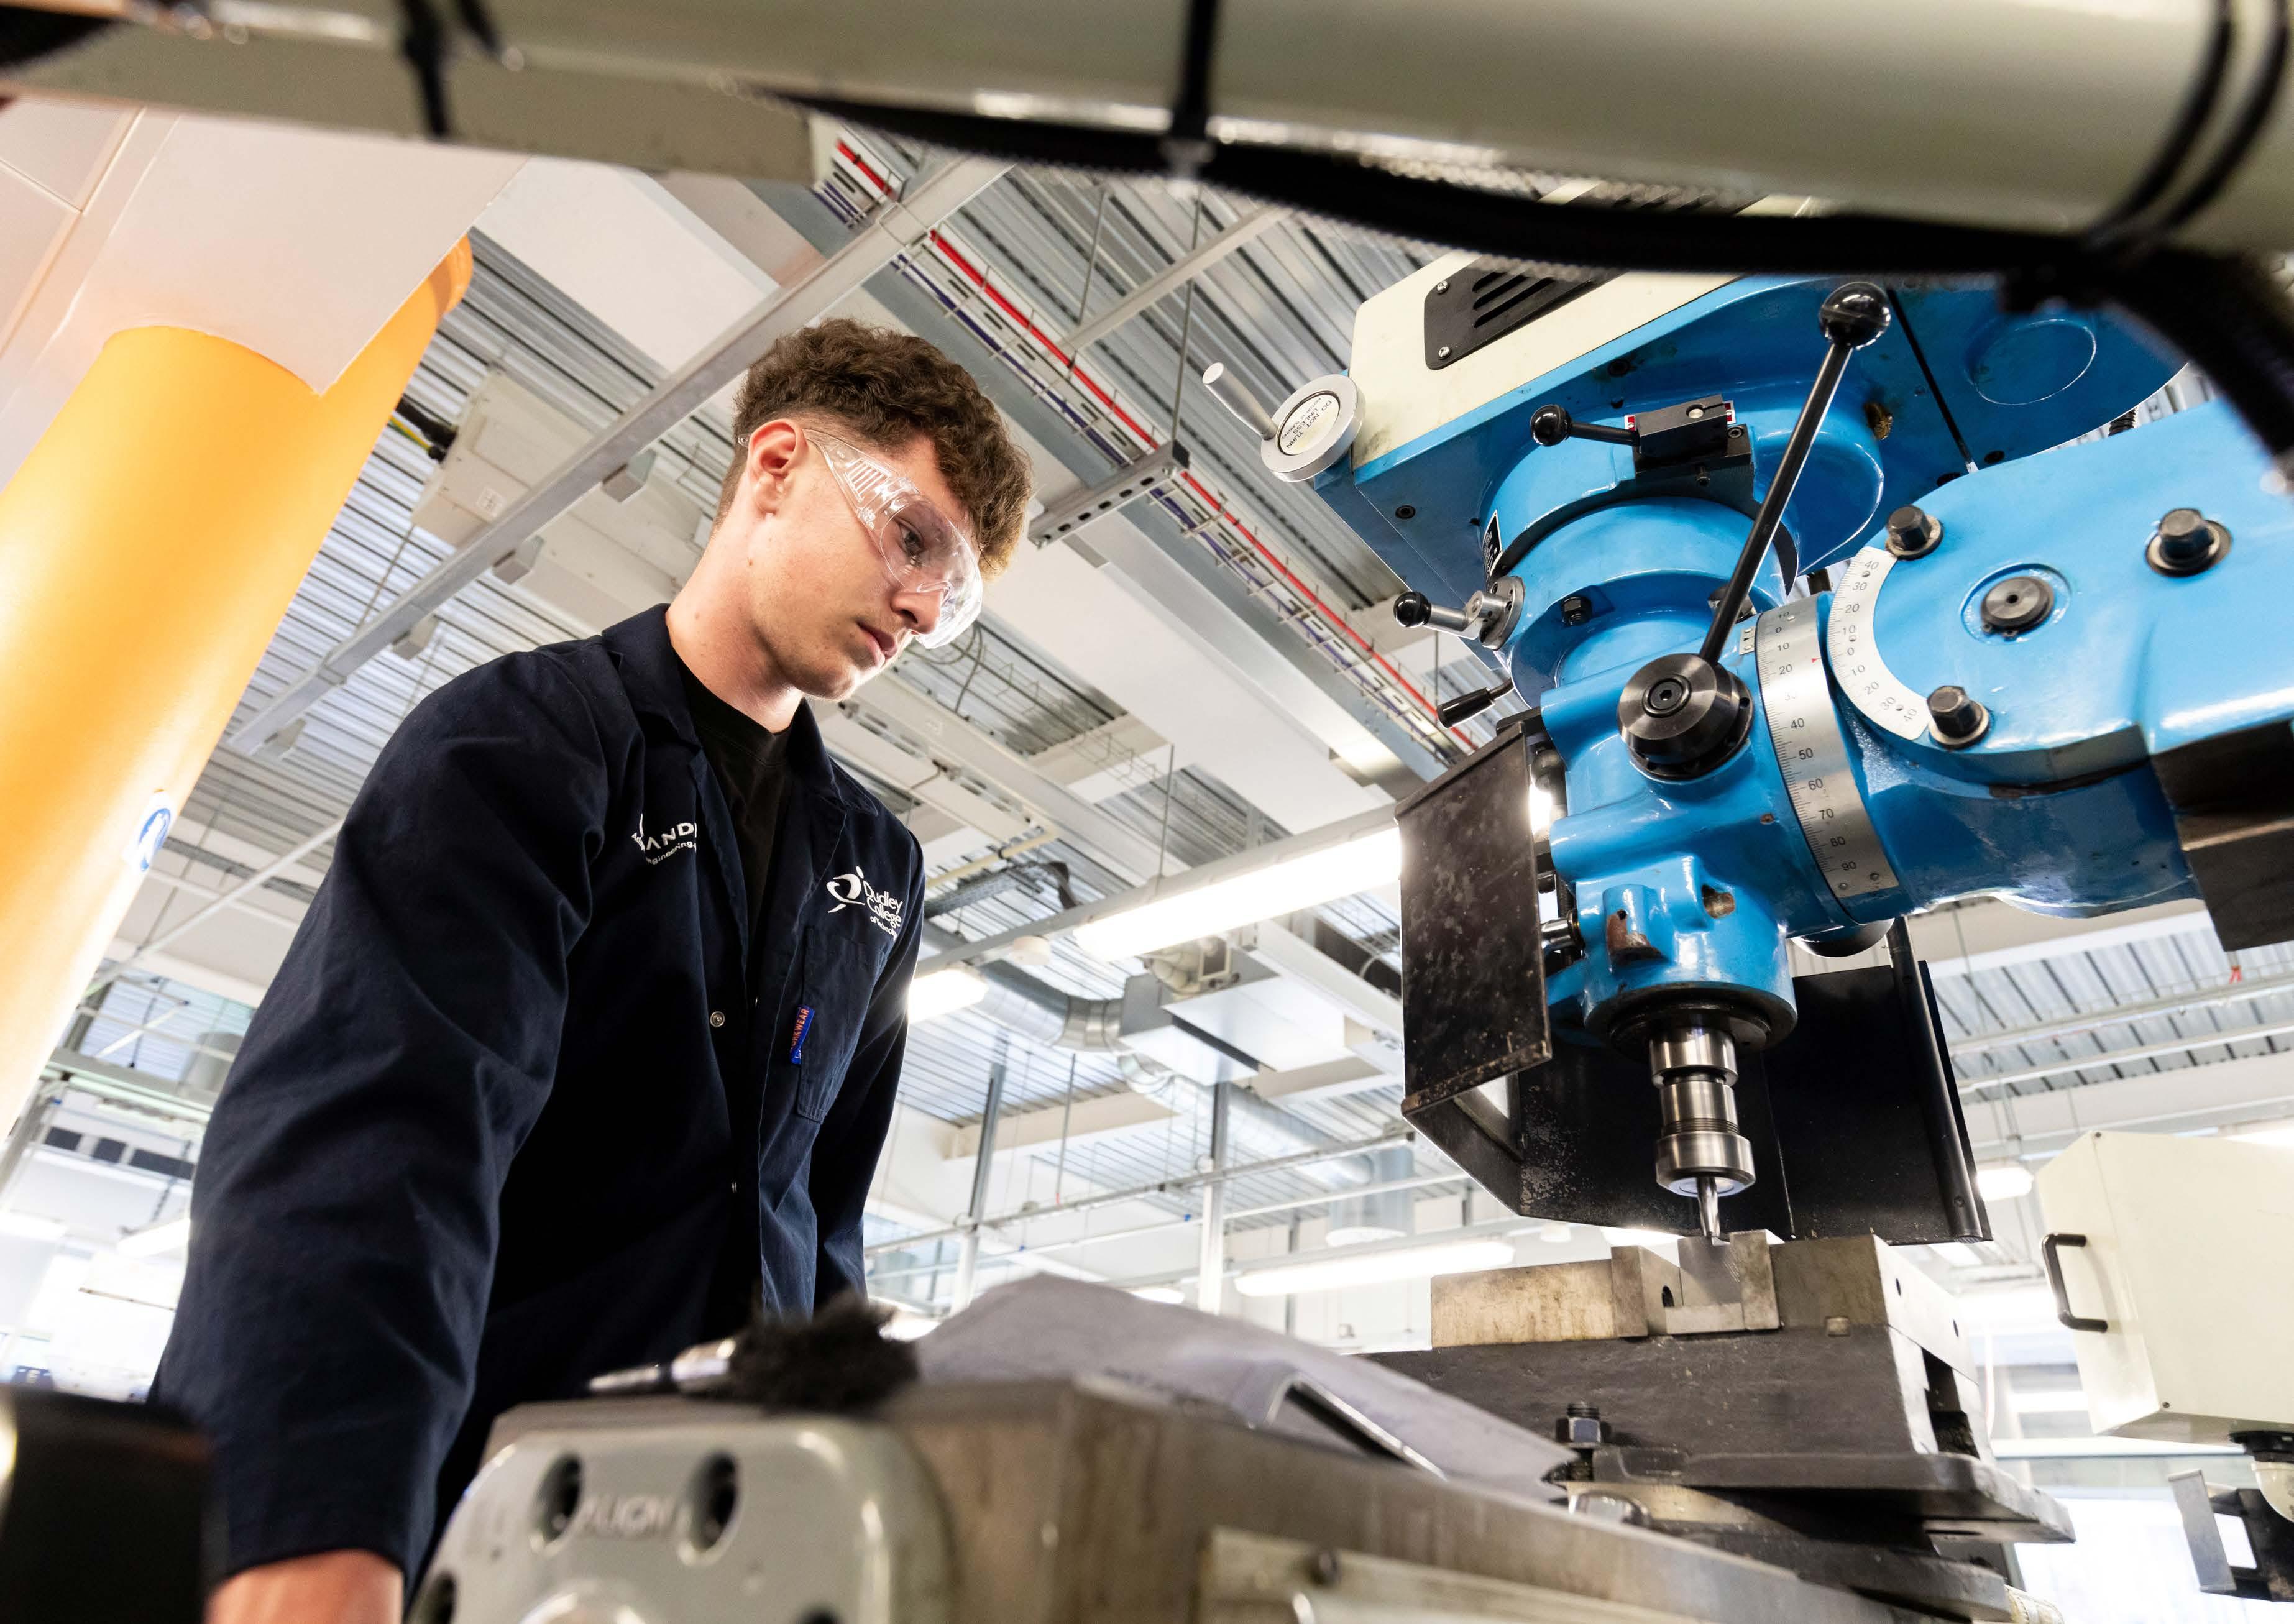
− We continue to see an upward trend in full time learners selecting to study STEM subjects with 3,120 (64%) young people enrolled onto STEM programmes of study, an increase of 4% compared to 22/23.
− 499 (53%) learners completed their Level 2 programme, (those who joined us with less than 5 GCSEs grade C or above from school), progressed immediately to an advanced level skills programme.
We successfully support the vast majority of our learners into positive destinations:
− 93.3% of our learners continued into training, employment or higher education.
We continued to achieve high levels of learner satisfaction against national comparators.
− 92% of our learners’ state that the teaching and learning is good or better and overall, their experience of the college is good.
− 94% of our learners agree that the college has supported them in understanding how to look after their mental health.
− 95% stated that the college has a culture of respect for differences.
What better outputs could we achieve?
– Continue to improve achievement rates on Level 1 and Level 2 programmes of study so they exceed national levels.
– Support more young people on technical training to achieve high grades.
– Improve retention on T Levels in Education and Management
– Close the gap between English and mathematics attendance and vocational attendance.
– Increase the number of young people achieving a 4 or above in GCSE mathematics resits.
– Reduce the gap in achievement rates between male learners and their female peers.
– Improve opportunities for all learners to benefit from meaningful interactions with employers to help them make informed career choices.
The numbers of 16- to 18-year-olds enrolled in 2023/24 increased by 8% to 4,877. Whilst an increase was evidenced at nearly all levels, the largest increase against the previous year, (16%), was seen in learners studying Level 2 programmes. Level 3 programmes continue to make up the highest proportion of learners at 52%.
Continued high numbers of 16-18 learners confirms high levels of confidence in Dudley College of Technology and will continue to support the regional economy as well as our own financial health.
2.1 ENGAGEMENT AND PARTICIPATION RATES CONTINUED
Travel to learn map
The map shows the travel to learn pattern of our learners in 2023/24. Most learners are from Dudley borough, as you would expect, with increasing numbers of learners looking to remain in Dudley to study rather than travel elsewhere. Our highly equipped estate across the Dudley and Brierley Hill Learning Quarters continues to transform the lives of young people aged 16-18 across the wider region.
Wolverhampton
Bilston
West Bromwich
Birmingham
Wednesbury
Stourbridge
Walsall
Brierley Hill
Kingswindford
Kidderminster
Oldbury
Smethwick
Halesowen
Himley
Seisdon
/wombourne
Rowley Regis
Tipton
2.2 IMPACT ON DIVERSITY AND INCLUSION
Gender
Ethnicity
Learning difficulty or disability
Deprivation Band
For learners aged 16-18, there continued to be more male learners in 2023/24 than female, with females achieving marginally better rates than their male counterparts. Achievement rates for both male and female learners have improved compared with the previous year.
We continue to support a diverse cohort of learners within the 16-18 ethnicity profile demonstrating our learners as a group, are more diverse that the local population. 37.4% of our learner are from minority groups who make up 11.9% of the local population.
There has been an increase in achievement rates across all ethnicities in 2023/24 with Mixed heritage and White learners evidencing the largest improvement at +6%. Learners of Asian ethnicity continue to succeed above the college average (+2%). There are no significant differences in achievement between ethnic groups.
1,118 (24%) of the 16-18 learners we support have a learning difficulty or disability. This number has increased by 4% in 2023/24. Learners with difficulties and disabilities achieve at a comparable rate to their peers on core programmes. Learners disclosing a Special Educational Needs Disability achieve at a slightly lower rate on maths and English qualifications. The college continues to review its approach to maths and English, for some of our learners with complex Special Educational Needs and Disabilities, to support their progress in these subjects.
51.1% (2,484) of Dudley College full time learners are in the lowest 2 bands of deprivation. There is no significant difference in achievement rates between our most deprived learners and their peers.
2.3 OUTCOMES FOR LEARNERS
Achievement rates - all programmes excluding English & Mathematics Overall achievement rate (all levels)
College achievement rate
Latest published national achievement rate (2018/19)
2023/24 saw a 2.4% increase in achievement of 16 to 18-year-olds on their technical and vocational programmes putting our leaners in line with national rates.
We continued to increase the number of learners studying T Level qualifications. 96.7% of learners who complete their studies pass their T Level.
2.3 OUTCOMES FOR LEARNERS CONTINUED
- Level 1
- Level 2
Level 1 achievement rate continues to improve and is now 85.5% which is a marginal increase of +3.8% compared to 2022/23 and is very close to national rates.
Level 2 achievement rate have seen an increase in 2023/24 of +2.8% and is now in line with the national levels of 2022/23 at 83%.
Level 3 achievement rate is 84.9% which is an increase of +1.5% and now exceeds current published national rates of 83%.
rate - Level 3
2.3 OUTCOMES FOR LEARNERS CONTINUED
GCSE retake results - three year trend
GCSE English
GCSE Mathematics
The data does not reflect learners who did not achieve or did not attend.
The number of learners retaking English and maths GCSE examinations, increased substantiality in 2023/24, with maths retakes seeing the highest increase in number by over 50%. This meant that more learners improved their GCSE grade; 211 learners improved their English grade and 164 their maths grade.
We also increased the number of learners achieving a grade 4 or above in both GCSE English (184) and maths (115).
2.3 OUTCOMES FOR LEARNERS CONTINUED
Functional Skills SfL achievement rate - all levels
Latest published national achievement rate (2018/19)
The achievement rates for young people, studying Functional Skills English and mathematics qualifications continues to improve in 23/24 (+2.1%). Overall performance is very strong and above national rates by 14.7%.
2.4 LEARNER SATISFACTION
End of year learner satisfaction (QDP survey)
We conduct surveys each year, to understand learners’ satisfaction with their programme of study and the wider college. Their feedback, informs subject area impact assessments and quality improvement plans. The college employs an external agency, QDP, to conduct mid and end year surveys and to benchmark the results against 75 other grade 2 or above general further education colleges.
We are proud of our performance against other providers with an overall 16-18 client’s satisfaction rating which is comparable to the benchmark with no significant gaps in performance. Despite this overall result, we recognise that, a minority of areas performed less well and these will be investigated at course level through our Subject Area Impact Assessments (SAIAs) with targeted actions to address any areas for concern.
2.5 LEARNER DESTINATIONS
All levels
Unemployed/voluntar y/ NEET/other 6.7%
Higher Education 13.1%
Employment 13.6%
Education/training (not HE) 66.6%
We successfully support the vast majority of our learners into positive destinations with 93.3% continuing in training, employment or higher education.
2.5 LEARNER DESTINATIONS
CONTINUED
91.1% of level 1 learners progressed into positive destinations.
91.4% of Level 2 learners progressed into positive destinations.
94.9% of Level 3 learners progressed into positive destinations.
The high rates of Level 1 and Level 2 learners continuing in education and training demonstrate the strength of our programmes in supporting young people to progress.
These courses develop technical skills, build confidence and enhance future career prospects. Seamless progression pathways support individual learners whilst positively contributing to the productivity of the local and regional economy.
2.6 IMPACT ON REGIONAL SKILLS AND THE REGIONAL ECONOMY
STEM in the curriculum - trend analysis 16 to 18 Classroom % STEM
The local economy relies on a workforce with high level skills in STEM subjects (science, technology, engineering and mathematics). The chart shows the percentage of qualifications completed by learners aged 16-18 years that were in STEM related subjects. In 2023/24, 3,120 (64%) of our young people followed STEM programmes of study which is a 3% increase on the previous year. The continued upward trend in numbers of our learners studying STEM, demonstrates our ongoing focus on ensuring we develop curriculum to meet the needs of these valuable sectors.
2.6 IMPACT ON REGIONAL SKILLS AND THE REGIONAL ECONOMY
CONTINUED
Progression to advanced level - trend analysis 16 to 18 Classroom Progression
As detailed in the graph, over half of all the college’s Level 2 learners progressed directly into Level 3 provision. Whilst this remains positive, there is a slight decline from the previous year. The numbers of learners choosing to progress, shows the impact the college is having on the lives of young people and the benefits to the local and regional economy.
3. FULL-TIME A LEVEL LEARNERS AGED
16-18 YEARS
BALANCED SCORECARD
Satisfaction
Destinations
Below
The overall performance of this key client group is ‘above expectations’. It is particularly pleasing to see our continued trend in high grade performance and the positive destinations our students go on to after completing their studies with us. We will continue to drive for the highest achievement across all groups of A-level students.
SUMMARY OF OUTPUTS
What key outputs did we achieve?
We have continued to significantly increase local participation in A level learning:
− We engaged 631 young people in A Levels in 2023/24.
− We have continued the upward trend in increased participation of young people in A Levels since the centre opened, with further growth in 2023/24.
We successfully engaged A level learners from diverse communities:
− 319 (51%) A Level learners were from ethnic minority groups. Our A Level learners are significantly more diverse than the local community where 11.9% of the population are from minority groups.
− 50 (12.8 %) A Level learners reported a learning difficulty or disability.
We supported A level learners to successfully achieve their programme of study:
− Overall achievement rates on A Levels are above national rates and have been for the last three years.
− The number of learners achieving A*-B was 45.2% which is 3% improvement on the previous year.
We made a significant impact on the local skills gap by upskilling young people:
− 421 (66%) A Level learners were studying STEM subjects.
− Overall satisfaction meets national benchmark for Sixth Form colleges.
What better outputs could we achieve?
− Continue to increase the number of learners completing A Levels progressing into higher apprenticeships.
− Reduce the achievement gaps between learners of Asian, Black and Mixed Heritage ethnicity and their white peers.
− Reduce the achievement gap between our most deprived learners and their peers.
− Raise the number of learners achieving high grades on a small number of courses.
− Provide more far-reaching career guidance outside of higher education.
3.1 ENGAGEMENT AND PARTICIPATION RATES
Dudley Sixth has continued its year-on-year growth in student engagement with A Level learning, increasing participation significantly again in 2023/24 to 631 learners. This growth has been influenced by the continued upturn in the 16-18 population of the borough following a number of years of decline in this demographic, but also by the high-quality A Level offer and growing reputation. We have remained committed to our policy of offering more delivery hours per A Level as well as higher levels of support than other providers.
3.1 ENGAGEMENT AND PARTICIPATION RATES CONTINUED
Travel to learn map
The map shows the travel to learn pattern of our A Level learners in 2023/24 is in line with 2022/23. We have continued to be the first choice for many local A Level learners who choose to study at Dudley Sixth rather than travelling elsewhere. We continue to attract learners from the wider region, which demonstrates the confidence young people, and their parents have in Dudley Sixth to provide a positive post-16 experience with high levels of success.
Walsall
Bilston
Wolverhampton
West Bromwich
Oldbur y
Himley
Gospel End
Stourbridge
Brierley Hill
Rowley Regis
Tipton
Wednesbur y Dudley Wombourne
3.2 IMPACT ON DIVERSITY AND INCLUSION
Dudley Sixth continues to support a very diverse student body. 2023/24 continued to see more female learners choose to study A levels than male learners. Males achieved at a marginally higher rate than females (+9.2%), which is in contrast to previous years. This is a result of a marginal drop in performance for females but a significant increase in male performance (going from 82.5% to 91.0%.).
The A Level ethnicity profile shows our learners are more diverse than the local community and in line with the previous year with 51% of our learners from minority groups who make up 11.9% of the local population.
This year has seen a gap in achievement between ethnic groups. We will monitor this as this was not seen in the previous academic year. There will be a focus on the achievement rates of Black learners compared to their peers as this gap has been present in A Levels in three out of the last four years.
Dudley Sixth supports a number of students with learning difficulties or disabilities through a wide range of support mechanisms, with the number of learners declaring a disability/learning difficulty increasing in 2023/24 to 80 learners – 12.8%, compared to 58 – 9.4% in 2021/22. Achievement rates of this group has improved over the last year and is now comparable to their peers.
DUDLEY SIXTH CONTINUES TO SUPPORT A VERY DIVERSE LEARNER BODY.
3.3 OUTCOMES FOR LEARNERS
Overall achievement rate - A Level
College achievement rate
Latest published national achievement rate
As a centre we achieved 73.1% A*-C grades - which compares to a West Midlands JCQ rate of 52%. This is equitable to last year’s results as we see a return to pre-pandemic marking norms.
3.4 LEARNER SATISFACTION
End of year learner satisfaction (QDP survey)
We conduct surveys each year to understand learners’ satisfaction with their programme of study and the wider college. Their feedback informs subject area impact assessments and quality improvement plans. The college employs an external agency, QDP, to conduct mid and end year surveys and to benchmark the results against other “Good” or better colleges.
This key client group shows high percentage levels of satisfaction from learners with every statement in the survey getting above 74%. Learners were particularly happy with:
• I understand the importance of treating everybody which respect - 98% agree.
• The teaching of this subject has been good - 88% agree.
• My study programme meets my needs - 89% agree.
• Overall this is a good sixth form - 81% agree.
3.5 LEARNER DESTINATIONS
A Levels - 2nd years
A Level destination data confirms 97.1% of our learners gain positive destinations with the majority progressing into higher education. This demonstrates the significant impact the Dudley Sixth provision has on the lives of young people within the borough and the wider region: enhancing future career opportunities and benefitting the local economy.
3.6 IMPACT ON REGIONAL SKILLS AND THE REGIONAL ECONOMY
STEM in the curriculum - trend analysis
The local economy relies on a workforce with high level skills and skills in STEM subjects (science, technology, engineering and mathematics). The chart above shows the percentage of qualifications completed by A Level learners that were in STEM related subjects. This shows an increase of 2 % compared to the previous year.
There continues to be a very strong focus on STEM provision across Dudley College of Technology including Dudley Sixth.
We are committed to finding more opportunities for A Level learners to continue to higher education locally so that their skills might benefit the regional economy. Strengthening our links with local universities along with the development of the Health Innovation Centre in Dudley will continue to expand the opportunities for learners in the region.
4. FULL-TIME AND PART-TIME ADULT SKILLS LEARNERS
BALANCED SCORECARD
The overall performance of this key client group is ‘meets expectations’. The group is exceeding expectations in terms of satisfaction and the sheer diversity of learners and provision that we offer. We are pleased to see our collaborative work with West Midlands Combined Authority better equipping local residents with the skills required to contribute towards ambitious growth for the region, but we recognise we must do more to support more people to access training and move forward with successful employment.
SUMMARY OF
OUTPUTS
What key outputs did we achieve?
We engaged local adults in skills based learning:
− We engaged 3,100 adults in skills programmes in 2023/24 which is slightly above the already strong performance in 2022/23.
− We continue to provide an increasingly diverse and innovative curriculum offer, designed to appeal to local adults and their skills needs.
We successfully engaged learners from diverse communities:
− 1,414 learners (45.6%) were from ethnic minority groups. Our learners continue to be more diverse than the local community where 11.9% of the population are from minority groups.
− 412 learners (13.5%) reported a learning difficulty or disability.
We maintained high achievement rates on adult skills programmes:
− Achievement rates for learners on technical and vocational programmes remained consistently high and at national rates.
− There are no significant differences in the success rates of learners from different ethnic backgrounds.
− Female learners achieved at a slightly lower rate than their male peers (-1.9%), but this closes the gap between male and female learners significantly from 2022/23 (-6.4%).
We made a significant impact on the local skills gap by upskilling adults:
− 1,364 (44%) adults were following STEM programmes of study.
− (30%) adult enrolments were in West Midlands Combined Authority priority sectors.
What better outputs could we achieve?
− Close the gap in achievement for those learners on adult programmes who declare a disability, so they are comparable with their peers.
− Continue to grow all adult provision with a particular focus on Level 3.
− Further improve achievement on ESOL and Access to HE programmes.
− Improve positive destinations for adults on Level 1 programmes.
− Improve how we measure the positive impact of ESOL and Adult Functional Skills on learners and the community.
− Increase the number of unemployed adults gaining employment.
4.1 ENGAGEMENT AND PARTICIPATION RATES
Learner engagement trend analysis
Adult Classroom Trend
We maintained strong recruitment onto adult programmes which remains above pre-pandemic numbers.
4.1 ENGAGEMENT AND PARTICIPATION RATES CONTINUED
Travel to learn map
The map shows the travel to learn pattern of our adult learners in 2023/24. 99% of our adults are from Dudley or the neighbouring borough. There is an increasing number of adult learners looking to remain in Dudley to study rather than travel elsewhere.
Walsall
Solihull
Kidderminster
Dudley
Stourbridge Halesowen
Wolverhampton
West Bromwich
Wednesbur y
Smethwick
Wombourne
4.2 IMPACT ON DIVERSITY AND INCLUSION
The college continues to support a very diverse student body. Much the same as 2022/23, more males engaged with learning in 2023/24, however, the split was much closer (50.1% Male/49.9% Female) The ethnicity profile shows our adult learners as a group are increasingly more diverse than the local community. 45.6% of our learners are from minority groups. There is no significant achievement gaps based on ethnicity. When achievements of male and female learners are compared, males achieved at higher rate than females, but the gap was closed compared with previous years (+1.9%).
The college was pleased to support 412 adult learners with a declared learning difficulty or disability in 2023/24, through a wide range of support services. This year there is a significant difference in the achievement rates of adults who declare a disability and those who do not (-8.6%). We will monitor this and ensure appropriate support is in place for those learners.
THE COLLEGE CONTINUES TO SUPPORT A VERY DIVERSE LEARNER BODY.
4.3 OUTCOMES FOR LEARNERS
Achievement rate - all levels (excluding English & mathematics)
Level 1
Overall achievement rates for our adult learners remain relatively stable compared with previous years, Level 1 shows an improvement on 22/23 of 2.4%. There was a dip in Level 2 achievement due to 19+ full-time learners enrolled on to GCSE English and maths resits in error. Level 3 achievement rates have improved again on last year and are now comfortably above the last published national rates.
Level 2
Level 3
4.4 LEARNER SATISFACTION
Year-end learner satisfaction (QDP survey)
We use QDP surveys to gather learner satisfaction. This enables us to benchmark against other good providers. Adults continue to be extremely satisfied with all elements of their programmes when compared with other colleges.
4.5 LEARNER DESTINATIONS
Level 1
Level 3
Level 2
4.5 LEARNER DESTINATIONS
CONTINUED
Destination of unemployed adults
The destination data included in this report relates to leavers in academic year 2022/23. We use J2Research and Purlos to collect adult destination data. The college employs both a Destinations Officer and Adult Support Mentor to enable us to more proactively pursue and support learners who have left us to improve overall outcomes and tracking data.
The destinations of adult learners studying Level 4 programmes demonstrates 89.9% positive destinations, Level 3 increases to 92.1%, Level 2 drops slightly to 86.3% and Entry and Level 1 sits at 78.1.%.
Our Into Employment/SWAP provision has been particularly strong at moving significant numbers of unemployed learners into sustainable jobs – including 42 learners moving into Retail and Hospitality, 24 becoming teaching assistants and 23 security guards and stewarding jobs in the region. As a result, we continue to support around 75% of previously unemployed adults to find a positive destination after completing their programme with us.
4.6 IMPACT ON REGIONAL SKILLS AND THE REGIONAL ECONOMY
BREAKDOWN OF LEARNER TYPE
Our adult education provision can be broadly categorised into three strands:
– STRAND 1: YOUNG ADULTS COMPLETING FULL TIME PROGRAMMES. This provision is for a small group of learners usually aged between 19 and 21 years old who complete their full-time technical education programme alongside fulltime learners aged 16-18 years.
– STRAND 2: PROFESSIONAL AND TECHNICAL UPDATING PROGRAMMES FOR ADULTS. These programmes will help adults develop skills for progression in their careers or for entry into higher education.
– STRAND 3: ESSENTIAL SKILLS PROGRAMMES FOR ADULTS. These programmes are aimed at developing essential skills for adults to support them to progress in work and life.
- The chart shows how our adult learners are split between these three strands. The table demonstrates an encouraging trend in the numbers of adult studying technical and professional programmes from 45% in 21/22 and 46% in 2022/23 stabilising at 46% in 2023/24 demonstrating our continued work to meet local and regional skills needs of adults in the West Midlands Combined Authority.
4.6 IMPACT ON REGIONAL SKILLS AND THE REGIONAL ECONOMY
CONTINUED
HAVING AN IMPACT LOCALLY
The chart below shows the proportion of our adult learners that reside in the Dudley Local Authority, in the neighbouring authorities (Wolverhampton, Birmingham, Sandwell & Walsall) and outside of the region. More than half of our adult learners live in the Dudley borough (56%.) 99% of our adults are from Dudley or the neighbouring borough demonstrating the impact we are having locally.
Adult learners based within region
Adult Classroom % STEM
The local economy relies on a workforce with high level skills and skills in STEM subjects (science, technology, engineering and mathematics).
The chart above shows the percentage of qualifications completed by adult learners that were in STEM related subjects. In 2023/24, 44% of our adults followed STEM programmes of study, slightly down on the previous year but the second highest over a five-year trend.
The overall performance of this key client group is ‘meets expectations’. This group continues to exceed expectations in terms of regional impact; however, we need to do more around participation, diversity and financial impact. We are aware of some apprentices not completing on time, however, pass rates are high within this provision.
SUMMARY OF OUTPUTS
What key outputs did we achieve?
We continue to maintain reasonable levels of participation of apprentices, despite a declining national picture.
− We have still engaged 856 young people in Apprenticeships which is in line with the national picture.
− We have engaged 1,215 adults in in Apprenticeships again in line with the national picture.
We continued to ensure apprentices successfully achieved their Apprenticeship and improve achievement rates.
− Overall achievement rates on Apprenticeships have improved and are at 61.5% which is a significant improvement of 7.8% compared to the previous year.
− We continued the 3 year upward trend in achievement rates that are now above national rates.
− We can see that pass rates for apprentices that remain on programme are very high (98%).
We continued to achieve strong apprentice satisfaction.
− Apprentices’ satisfaction is strong, closely matching or exceeding benchmarks across all categories.
We made an impact on the local skills gap by upskilling young people and adults.
− We continue to see an upward trend of 55% of apprentices following a STEM Apprenticeship, linked to the priority employment sectors in our region.
What better outputs could we achieve?
− Retention and timely achievement on some Apprenticeship pathways, particularly long programmes.
− Employer engagement and on-and-off-the-job training co-ordination on some Apprenticeships.
− The achievement of apprentices whose ethnicity is mixed heritage has improved but needs to improve further.
− Communication and reporting of progress to employers.
5.1 ENGAGEMENT AND PARTICIPATION RATES
Apprentice engagement and trend analysis - all Apprentices
16 to 18
There has been a decline in participation levels for apprentices and this has been seen nationally. The participation for 16-18 apprentices was 856 in 2023/24 and the number of adult apprentices was 1,215 in 2023/24.
In total, some 2,071 individuals undertook Apprenticeship training with the college in 2023/24. The provision is supported by effective engagement with local employers through a variety of activities that is headed up by the dedicated Employer Engagement Team. This also includes dedicated staff that support the Apprenticeship placement services offered by our Employment Hub.
5.1 ENGAGEMENT AND PARTICIPATION RATES CONTINUED
The heat map shows the home location of all apprentices. The majority of 16-18 apprentices following a day release programme and are based locally in the West Midlands Region. The adult apprentices are also based locally however there are pockets of focussed activity in other regions due to specific initiatives with key partner employers, including national NHS Trusts.
5.2 IMPACT ON DIVERSITY AND INCLUSION
In 2024/24 the participation rates between male and female have remained similar, males 70.8% (70%) and females 29% (30%). We continue to work with schools to drive up female engagement in STEM careers, supported by the school liaison team and the Black Country and Marches Institute of Technology
There is a significant difference in achievement between male and female apprentices, with females (69.1%) achieving higher than males (57.3%) by 11.8%. This is linked to the significantly higher numbers of male apprentices on long Apprenticeship programmes with lower retention (building services, engineering, etc) – see achievement analysis in next section.
Our BAME Apprenticeship participation profile is broadly representative of the communities we serve and remains the same as the previous year 12% but lower than other College student cohorts such as classroom-based provision.
We are pleased to see that we are significantly closing the achievement gap previously seen with some ethnicity groups (such as Asian and Black apprentices). We do recognise this work continues however and we would particularly like to realise a further improvement in achievement rates for mixed heritage apprentices (currently -17.7% behind the overall college rate). The college will continue work hard to ensure focused intervention is in place to narrow the gap of achievement for these apprentices.
We were pleased to support 248 apprentices who have declared a learning difficulty or disability in 2023/24, which is in line with the previous year. We deliver support to these apprentices using a dedicated Apprenticeship support team. We have continued to focus on ensuring this support programme meets individual needs.
Apprentices with a declared learning difficulty or disability have seen a 6.9% increase in their achievement rate compared to last year, although we recognise this rate is still -2.6% below the overall college rate. The college will continue to use support systems and additional learning support to close the gap in achievement seen this year.
5.3 OUTCOMES FOR APPRENTICES
Overall achievement rate - all Apprenticeships Intermediate Apprenticeships Higher Apprenticeships
Advanced Apprenticeships
Overall achievement rates for Apprenticeships have increased from the previous year to 61.5% (+7.8%). Achievement rates have improved on advanced and higher Apprenticeships. The biggest improvement has been on the higher-level Apprenticeships which have significantly improved by +19% compared to 2022/23. There has however been a reduction in the achievement rate for intermediate Apprenticeships.
Retention is the biggest factor affecting achievement rates. Most commonly due to changes in employment status. The top three reasons for withdrawal are: ‘Personal: I gained employment/job change’, ‘Loss of job/Unemployed’ and ‘Redundancy (with official employer evidence)’. Even removing these apprentices from data shows the significant impact on achievement (increasing achievement by +15% overall).
For those learners who do remain on programme, their pass rate is very high –remaining at over 98% for the past 4 years.
5.3 OUTCOMES FOR APPRENTICES CONTINUED
AGE GROUP ACHIEVEMENT
Aged 16-18 - all levels
Aged 19-23 - all levels
Aged 24+ - all levels
Analysis by age group shows there has been an improvement at all ages groups. 16-18 shows a 4.8% increase, 19-23 shows a 9.2% increase, however the biggest improvement has been on the, 24+ age group which shows a significant improvement of 10.2%.
5.4 LEARNER AND EMPLOYER SATISFACTION
Apprenticeship End of Year Survey
The satisfaction of apprentices is in line or above benchmark. The college will continue to focus on improving the Apprenticeship
Percentage of employers that selected this a a ‘strength’
5.4 LEARNER AND EMPLOYER SATISFACTION CONTINUED
Percentage of employers that selected this as needs improvement
Communicationwithemployers Reportingon progressofapprenticesNewapprenticesstarted Righttraining attherighttime Trainingfacilities Workingwithsmal l numbersofapprentices
Data is taken from latest published information on Government ‘Find an Apprenticeship’ service. Despite the clear challenges, employers and apprentices remain generally pleased with the service they receive from the College, however there needs to be some focus on the communication and reporting of apprentice progress to employers.
5.5 IMPACT ON REGIONAL SKILLS AND THE REGIONAL ECONOMY
STEM Apprenticeships - trend analysis
The local Black Country and wider West Midlands economy relies on a workforce with high level skills including in STEM subjects (science, technology, engineering, and mathematics). The charts above show the percentage of Apprenticeship standards completed by apprentices in STEM related subjects. 55% off all apprentices followed STEM programmes of study. We are committed to continuing to grow college-delivered and high-value co-delivered STEM Apprenticeship provision, enhanced by the Black Country and Marches Institute of Technology.
6. HIGHER SKILLS LEARNERS
BALANCED SCORECARD
The overall performance of this key client group is ‘meets expectations’. Our focus has been around increasing the range of programmes at higher level by offering non-traditional routes to HE, delivered from the Black Country and Marches Institute of Technology and in partnership with employers and Universities. We are looking to increase the number of students progressing from feeder programmes to the College’s high-level provision.
SUMMARY OF OUTPUTS
What key outputs did we achieve?
We continued to support local participation in higher skills learning:
− We engaged 367 students in higher level classroom based and HNC/D programmes across a range of subjects that support local skills needs.
− Additionally, we also engaged 271 students in Higher Apprenticeships in 2023/24.
− The Black Country and Marches Institute of Technology (BCM IoT) had a successful third year of operation, significantly expanding the range of higherlevel courses available to local communities.
We successfully engaged students from diverse communities:
− 22% of Higher Education (HE) students were from BAME groups. Our HE students are more diverse than the local community where 11.9% of the population are from BAME categories.
− Levels of engagement among female students in areas that are traditionally male dominated, such as manufacturing and construction have remained consistent.
We continued to ensure higher skills students successfully achieved their programme of study and achievement rates remain consistent with previous academic years.
− Pass rates for completing higher level students remain very high at 94%.
− The huge majority (93%) of higher-level students move onto positive destinations (employment or continued education) upon completion of their programme.
We made an impact on the local skills gap and supported WMCA priorities by upskilling adults at a higher-level, enhanced by the opening of the Black Country and Marches Institute of Technology:
− 64% of our higher-level students are studying STEM related programmes (science, technology, engineering & mathematics). and the ongoing work of the Institute of Technology.
What better outputs could we achieve?
− Strengthen retention on a small number of programmes.
− Continue to increase the number of higher-level students able to access provision made available through partnership with local Higher Education Institutions.
− Deliver activity designed to encourage more female learners to pursue higher level training in under-represented areas (notably construction and engineering).
6.1 ENGAGEMENT AND PARTICIPATION RATES
Learner engagement trend analysis
Classroom level L4+ HNC/D Apprenticeship
In 2023/24 we had 367 students undertaking higher level learning through classroom based and HNC/D programmes. The mix and balance of numbers on provision types has changed as we have seen a decline in the numbers on the traditional stand-alone HNC/D programmes; however a steady state number of class-based level 4 and above provision. We have continued the use of West Midlands Combined Authority flexibilities to introduce new courses to add to the suite of our higher-level curriculum offer.
Higher Apprenticeship recruitment has seen a marginal reduction to 271 compared to the previous year to 288 in 2022/23. These students continue to be a strategic priority for the college, and we have plans to further expand our HE Apprenticeship offer, particularly through the ongoing work of the Black Country and Marches Institute of Technology and higher education partners.
The College considers higher skills learners as:
1. HNC/D students – those studying dedicated HE programmes on a full or part-time basis.
2. Classroom based Level 4+ students – adults studying FE provision that is Level 4 or higher – including professional programmes such Teacher Training.
3. Higher Apprenticeships- those studying at Level 4 and above through an Apprenticeship programme.
6.1 ENGAGEMENT AND PARTICIPATION RATES CONTINUED
Travel to learn map
The map shows the travel to learn pattern of our Higher Education students in 2022-23. The majority of students continue to be from Dudley Borough and the wider Black Country area. Increasingly students are looking to remain in locally to study rather than travel elsewhere.
However, it also shows that the college is attracting higher level students from across the wider West Midlands, and we expect that to broaden as the Black Country and Marches Institute of Technology continues to establish itself and as we participate in the Aspire to HE project. We are pleased to see that, as we strengthen our higherlevel offer and build our reputation for quality delivery of learning and skills, we are able to draw students from farther afield, with the Institute of Technology giving us a national reach in some sectors.
6.2 IMPACT ON DIVERSITY
AND INCLUSION
Gender Ethnicity
Males remain the biggest cohort on Higher Education programmes, with this percentage increasing in 2023/24. We continue to encourage more female students to pursue higher technical skills, particularly in areas such as engineering, manufacturing and construction. But more works needs to be done to increase female participation in higher level study.
Their ethnicity profile shows our higher-level students as a group are more diverse than the local community. 22% of our HE students are from BAME groups compared to 11.9% of the local population.
We were pleased to support nearly 14.7% of higher-level students who have a self-declared learning difficulties or disabilities in 2023/24, a slight decrease from 2022/23. We are happy to report that these students achieved at a rate comparable to their peers.
6.3 OUTCOMES FOR LEARNERS
Overall achievement rate for completers (not including Apprenticeships)
The overall achievement rate remains consistent with the previous academic years, with a notable improvement in classroom-based programmes performance by 2%.
HNC
6.4 LEARNER SATISFACTION
End of year Learner satisfaction (QDP survey)
We conduct surveys each year to understand learners’ satisfaction with their programme of study and the wider college. Their feedback informs subject performance reviews and quality improvement plans.
This key client group shows high percentage levels of satisfaction from learners with every statement in the survey getting above 72%. Learners were particularly happy with: • Teaching on my course has been good - 84% agree.
• The feedback I get tells me what I am doing well and where I need to improve - 90%.
• I understand the importance of treating everyone with respect and tolerance - 93%.
• I am aware of what I can do after my course ends - 94%.
The results from this survey represent only 31 learners overall which is a very small cohort of learners, but overall % satisfaction levels remain high.
6.5 IMPACT ON REGIONAL SKILLS AND THE REGIONAL ECONOMY
% Higher Level Students Studying STEM programme
The local economy relies on a workforce with high level education and skills in STEM subjects (science, technology, engineering and mathematics). With ongoing development of the Black Country and Marches Institute of Technology and the related launch of new programmes such as healthcare science, we have seen an increase in enrolments in these subjects. We remain committed to further expanding our higher-level STEM provision through the continued development of the Black Country and Marches Institute of Technology and the opening of Health Innovation Dudley (planned for 2026).
7. HIGH NEEDS LEARNERS
BALANCED SCORECARD
The overall performance of this key client group is ‘meeting expectations’. We are very proud of the diverse student body who achieve at least as well as their peers, as well as the very high satisfaction we have for these programmes. Our focus going forward is to continue to expand opportunities for more high needs learners to transition into the workplace for the benefit of them and the region. Par
SUMMARY OF OUTPUTS
What key outputs did we achieve?
We continue to maintain high levels of participation of high needs Learners – 175 learners were supported through high needs funding in 23/24.
– The college attracts learners from 7 differing local authorities.
We are supporting high needs learners to ensure that they achieve as well as their peers
− Overall achievement rates for learners show that those learners receiving high needs funding achieve in line with their peers, with Level 2 increasing by 5.7% and Level 3 by 14.8%, in 23/24.
− GCSE English and maths achievement for those with high needs significantly increased in 23/24, by 26.2% in English and 21.9% in maths.
− 39.3% of learners receiving high needs funding are studying STEM subjects, a continued increase for three consecutive years.
We successfully engaged high needs learners from diverse communities
− 15.6% of high needs funded learners were from ethnic minority groups in 23/24, with the local population of Dudley being 11.5% from ethnic minorities.
We continue to support high needs learners to progress into the next level of study and into positive destinations
− 75.8% of high need learners remained in education, with 47.3% of these learners progressing to the next level.
We provide a positive experience for young people with High Needs
− Learners receiving high needs funding demonstrate satisfaction significantly above national benchmark for teaching and learning, tests and assessments, safeguarding and wellbeing, my next steps and quality assurance.
What better outputs could we achieve?
− We will continue to restructure Functional Skills and stepping stone English and maths provision, in our discrete provision, to further close the gap in achievement for high needs learners compared to their peers.
− We will work with our Level 1 SEMH learners to improve retention and achievement.
− We will work to increase the percentage of high needs learners moving onto their next level of study and into employment.
High Needs Classroom Trend
7.1 ENGAGEMENT AND PARTICIPATION RATES CONTINUED
High Needs Classroom Trend
Headline numbers as part of overall College cohort
Counts learners once on their highest level of enrolment only
The number of high needs enrolments remains consistent, compared to other years. This confirms the high level of confidence in the local community and from Dudley Metropolitan Borough Council, who commission places with Dudley College of Technology.
7.1 ENGAGEMENT AND PARTICIPATION RATES CONTINUED
The map shows the travel to learn pattern for our High Needs learners in 2023/24. Most learners are from Dudley borough, as would be expected, with learners also travelling from Wolverhampton, Sandwell, Walsall, Birmingham, Staffordshire and Worcestershire. Our highly equipped and specialist estate across the Dudley and Brierley Hill learning quarters continue to provide the resources and support for high needs learners that enables them to achieve, in line with their peers.
Birmingham
Kidderminster
Kinver Wolverley
Alvely
Sutton Coldfield
West Bromwich
Wolverhampton
Stourbridge
Brierley Hill
Quinton
Kingswinford Wombourne
Wor field
Pattingham Albrighton Walsall
Dudley Wednesbur y
7.2 IMPACT ON DIVERSITY AND INCLUSION
For high needs learners there are more male learners than female, however, this reflects the overall male/female split within the wider College. We continue to support a diverse cohort of learners with 15.6% of high needs learners being from minority groups, with the local population of minority ethnic groups being 11.9%. Overall achievement rates across ethnicity and gender shows no significant gaps.
7.3 OUTCOMES FOR LEARNERS
Achievement rates - all programmes excluding English & mathematics
Overall achievement rate (all levels) compared to wider College High needs achievement rate Level 1
needs achievement rate Level 2
Achievement rates for 23/24 show a small percentage drop of 0.8% for high needs learners compared to 22/23, however, there is no significant difference with regards to their peers. Level 1 achievement has decreased by 3.9%, mainly impacted by retention of those with SEMH. There has been an increase in achievement at Level 2 of 5.7% and a significant increase of achievement at Level 3 of 14.8%.
needs achievement rate Level 3
Note – Latest published national rates are only available from 2018-19 due to pandemic.
7.3 OUTCOMES FOR LEARNERS CONTINUED
GCSE & Functional skills English & mathematics achievement rate – all levels
In 2023/24 for GCSE English and maths the achievement rate has significantly increased for our high needs learners, by 26.2% in English and 21.9% in maths. The achievement rates in Functional Skills English and maths for those with high needs remained consistent with 2022/23 results and remains lower than their mainstream counterparts. This is due to learners in our discrete provision for those with more complex needs finding it difficult to sit exams. Work will continue in 2024/25 to ensure the English and maths programmes for learners accessing our discrete provision are tailored to meet their individual needs.
7.4 LEARNER SATISFACTION
High Needs Learner Satisfaction (QDP survey)
We conduct surveys each year to understand learners’ satisfaction with their programme of study and the wider college. Their feedback informs subject impact assessment reviews and quality improvement plans. The college employs an external agency, QDP, to conduct surveys and to benchmark the results against 54 general FE and tertiary colleges. The survey in 2023/24 shows that high needs learners are very satisfied and show that Dudley College is performing significantly above national benchmark for learner satisfaction with high needs learners.
7.5 LEARNER DESTINATIONS
All levels
Unemployed/voluntar y /NEET/other 21.5%
We successfully support many of our high needs’ students into positive destinations, with the majority, 74.5%, going onto further education and training and 1.3% into higher education and 2.7% into work, which is a slight increase on the previous year. Of the remaining 21.5% many go into voluntary work or adult social care, which based on their starting points is a positive destination.
7.6 IMPACT ON REGIONAL SKILLS AND THE REGIONAL ECONOMY
STEM in the curriculum – trend analysis
In 2023/24 the percentage of high needs learners enrolled onto STEM programmes increased by 2%. There has been an increase in this area for three years running. This demonstrates our ongoing focus on ensuring high needs learners access the STEM curriculum, alongside their peers.
7.6 IMPACT ON REGIONAL SKILLS AND THE REGIONAL ECONOMY
CONTINUED
Progression to advanced level – trend analysis
Of the 75.8% of high needs learners whose destination was to into education, 47.3% progressed onto a higher level, 38.5% returned on the same level, however, this would include those returning on the same level but larger size of qualifications e.g. Level 1 Certificate to Level 1 Diploma and 14.3% returned on a lower level, which includes those who changed vocational area and, therefore, needed to build skills before progressing higher.
8. FINANCIAL HEALTH INDICATORS
OVERVIEW OF THE COLLEGE’S FINANCIAL POSITION
The college has invested substantially in its estate
The College continues to invest substantially in its facilities and estate to create sector leading education facilities within the Dudley and Brierley Hill Learning Quarters. Learners and employers are at the heart of this investment which is based on our analysis of skills gaps that will meet the local and regional need.
The College continues to have a strong financial position, and this has enabled us to deliver strong annual operating performances, despite a challenging financial environment.
The College continues to carefully manage its cost base, and this has resulted in a strong EBITDA as a percentage of income of 7.8% (£3.9m). The continued benefits of effective financial management means that EBITDA is in line with the FEC recommended benchmark.
The current ratio is strong and at 1.3 is slightly below the FEC benchmark of 1.4. The College has closely managed cash balances, conserving cash investment for the student experience and this helped to maintain the year-end cash balance and cash days to 55 at the July 2024 year-end, well above the FE Commissioner benchmark of 25. Careful cash management will continue to be a central component in the College’s financial strategy, and we anticipate that cash, and cash days, will remain healthy in 2025.
The college’s financial health as measured by the ESFA continues to gain strength and remains at Good. This has been driven by a positive EBITDA and cash position. Operating performance and improving liquidity should ensure that the college’s financial health grade of ‘Good’ continues in 2024/25.
KEY FINANCIAL STRENGTHS AND AREAS FOR IMPROVEMENT
For many years the college has had a strong and For many years the College has had a strong and sustainable operating performance which has generated sufficient levels of cash from operating activities to service debt obligations and maintain investment in our staff, facilities and strategic projects. Substantial investment in the estate and facilities has increased our capacity to deliver more education and training at a time of demographic growth. As a result, the College has grown student numbers and income. This investment has also ensured a high standard of learning environment that reflects industry standard for our technical education areas. This investment has been achieved through careful borrowing and substantial support from central government and other agencies.
The College continues to review its operational base and consolidate activity to deliver to local and regional priorities. This has reduced the level of operational risk and means that management is able to focus on the quality of teaching and learning and financial stability of its core operations. The College works closely with the West Midlands Combined Authority and has been innovative in meeting regional priorities; this has ensured ongoing opportunities for further income generation. Equally the College is not overly reliant on a single source of income, thereby reducing the financial risk of income fluctuation.
The College has carefully managed its finances, and this has meant that staffing budgets have been met, and non-pay costs are within budget. Combined with increases in income from 2023-24 and an increasing need for more training and upskilling to drive the economy forward, the College has continued to improve its operating performance with an EBITDA of 8% of income by July 2024.
Cash generated from operations, alongside a controlled capital expenditure programme, is ensuring the College meets its longer-term financial objective of growing cash and removing any reliance on existing working capital facilities by 2026, whilst maintaining the milestone of Good financial health. The Corporation agreed a financial strategy in 2024 to retain cash, repay loans, improve the College’s financial health and protect its long-term sustainability. It includes key performance indicators on EBITDA, cash days, borrowing and pay as a percentage of income. At, July 2024 all KPIs were achieved, and loan covenants were comfortably met; this level of performance is expected to continue into 2025.
As a result of the planned investment and subsequent growth in student numbers, the College’s cash balances and short-term liquidity measures, such as the current ratio of current assets compared to current liabilities, are on or above the FEC recommended target. The College has set limited budgets for future capital investment, substantial grants through DfE and Salix have enabled the College to yet again make major improvements to the estate. A joint project with DMBC and the University of Worcester to construct a new Health Innovation Dudley centre is being entirely funded by the Towns Fund. The focus on income generation opportunities, cost control and cashflow management will continue to deliver strong performance in EBITDA and current ratio.
Income from all sources continues to be susceptible from economic uncertainty and the College has put mechanisms in place to monitor recruitment against plans on a real-time basis. This will allow us to quickly respond to variances in income either through generating additional opportunities or to reduce costs.
8.1 OPERATING PERFORMANCE
The education specific EBITDA as a percentage of income is a measure of the underlying operating strength of the College. The higher the percentage measure, the stronger the operational performance. A measure of 8% and above is the recognised benchmark by the FEC.
The investment made by the College in our Dudley and Brierley Hill Learning Quarters has resulted in growth in learner numbers and income. EBITDA is strong through ensuring costs are aligned to recruitment and teaching delivery.
8.2 TOTAL INCOME Total Income
(£m)
The increase in income in 2024 is largely driven through higher levels of ESFA funding for students aged 16-19 and this will continue to grow in 2025, as a result of higher intake in 2024.
8.3 STAFF COSTS AS A PERCENTAGE OF INCOME
The College continues to meet the AoC recommended pay awards for staff, additional funding has been made available in 2024 to fund a cost-of-living increase of 2.5%. Pay costs continue to be tightly controlled however the growth in student numbers and income has required careful investment in new staffing posts to ensure students get the best teaching experience.
The College has also been mindful of the need to retain staff with specialist skills in order to remain flexible and respond to emerging demand in the adult and apprenticeship market. Inevitably this puts pressure on pay budgets and increases the risk of carrying vacancies for skilled staff.
The controls over pay spending will ensure a continued alignment of pay costs with delivery requirements and means that the college remains at or around the FEC benchmark of pay being 65% of turnover.
8.4 ADJUSTED CURRENT RATIO
Projection 2023/24 2020/21 2021/22 2022/23
The current ratio is a measure of current assets compared to current liabilities and is used as an indicator of short-term liquidity. Whilst not a direct measure of cash, the higher the percentage measure, the better a college’s liquidity, which means the more cash, or assets that can be easily converted into cash, a college has got compared to its short-term liabilities. The ESFA ‘good’ benchmark is a current ratio of 1.2, whilst the FEC benchmark is 1.4; the College is between these two points in 2024.
The College has maintained its cash levels due to focused spend on capital projects in 2024, supported by grants from DfE and Salix; the current ratio is stable at 1.3.
Cash management will continue to be important going forward as we balance the College’s liquidity needs against the requirement to repay short term borrowing. We anticipate that the College’s current ratio will continue to be strong over the next few years as we effectively manage costs, targeted capital expenditure and follow our prudent repayment plan of short-term borrowing.
8.5 CASH DAYS
Cash days is the number of days that an organisation can continue to pay its operating expenses given its current level of available cash. The FE Commissioner’s benchmark is for colleges to have sufficient cash to cover 25 cash days.
Strong cash generation from operating activities has helped improve the College’s cash days to remain well above the FE Commissioner’s benchmark. Closely managed cash balances, capital investment and costs, has helped to maintain the yearend cash balance and cash days to 55 on 31 July 2024.
Cash management will continue to be imperative going forwards as we navigate through an economically challenging period. We are confident that cash, and cash days, will be maintained above the FEC target of 25.
8.6 BORROWING AS A PERCENTAGE OF INCOME
Borrowing as a percentage of income (also known as gearing or leverage) is used to measure the proportion of assets invested in a college that are financed by borrowing. It also provides an indicator to the longer-term financial stability of a college, because the higher the level of borrowing, the higher the risk as more cash will have to be set aside to meet debt and interest repayments leaving less cash for everything else. The lower the percentage measure, the better a college’s gearing and its prospects for long term stability. Colleges with a financial health score of Good are likely to have borrowing at 35% of income or less.
In addition to longer term bank loans, the College has a short-term loan with DfE which will be fully repaid by 2026. This has supported the College’s strategy of continuing to reduce reliance on borrowing and as a percentage of income, borrowing has dropped from 31% to 28% in 2024.
8.7 ESFA FINANCIAL HEALTH GRADE
The College’s financial health grade is assessed by scoring the adjusted current ratio, EBITDA as a percentage of adjusted income and borrowing as a percentage of income. The total scores provide an overall financial health grade, based on a banding structure illustrated in the chart.
The strong operating position and cash levels have resulted in a good financial health score.
The College expects to maintain its Good financial health score into 2025.
Further information on the College’s performance can be found on the Dudley dashboard on the College’s website: dudleycol.ac.uk