SUSTAINABILITY AT EVERY PACE YEARS
SUSTAINABILITY REPORT 2022
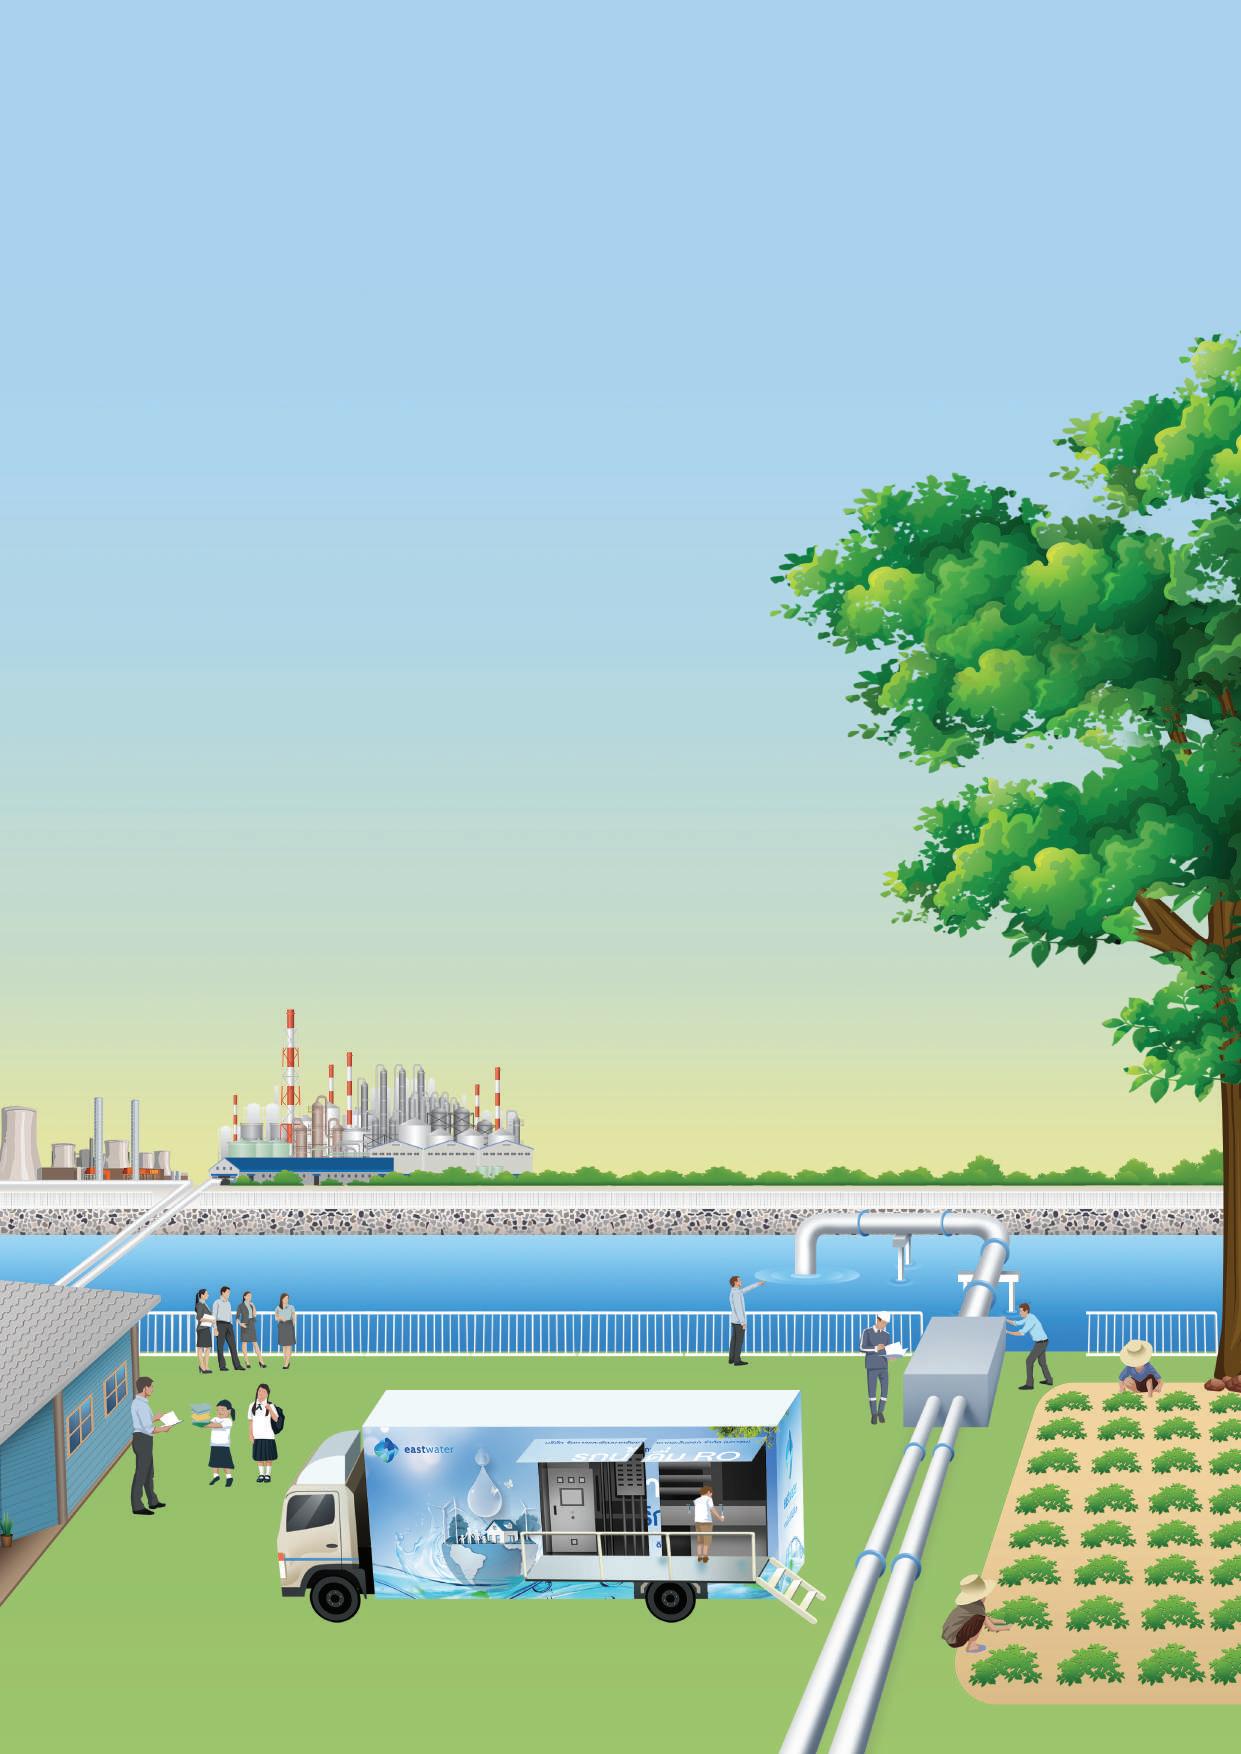
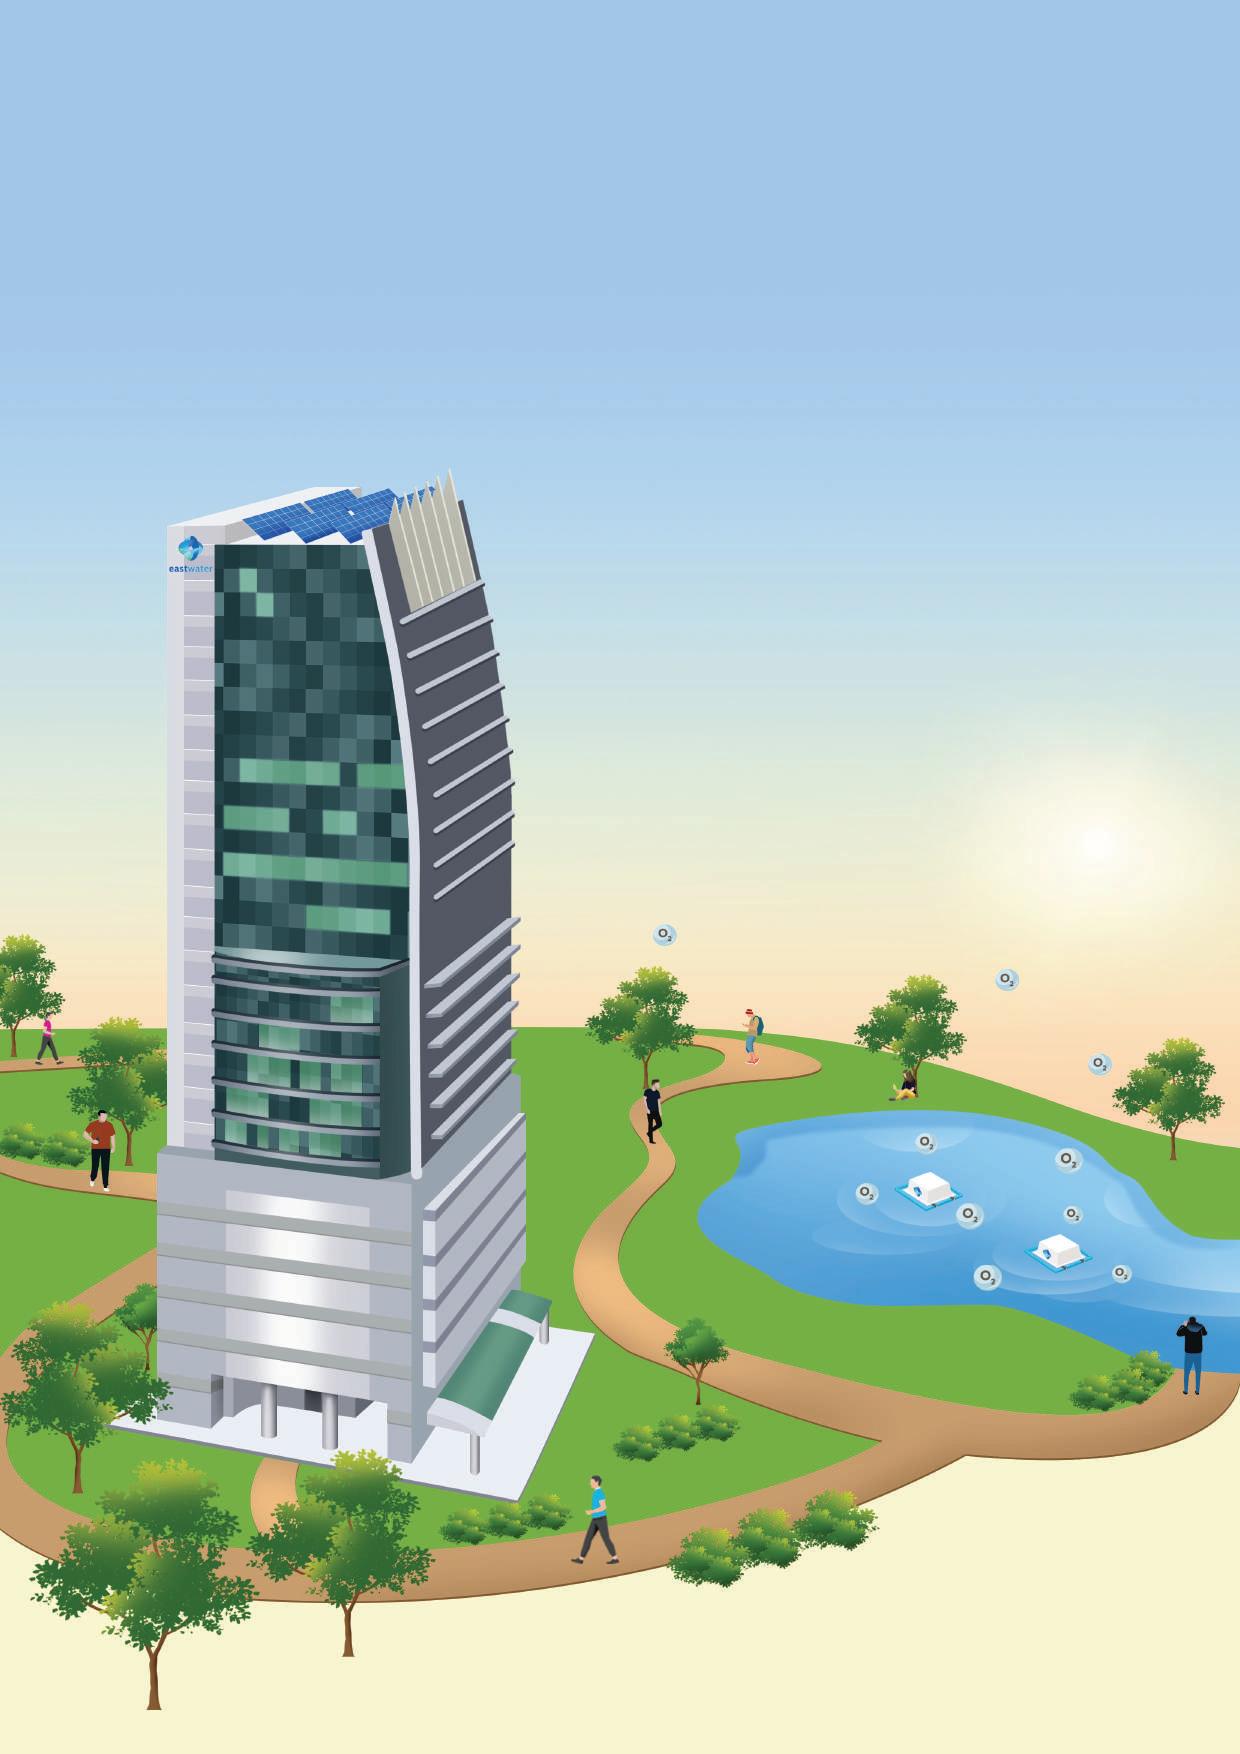
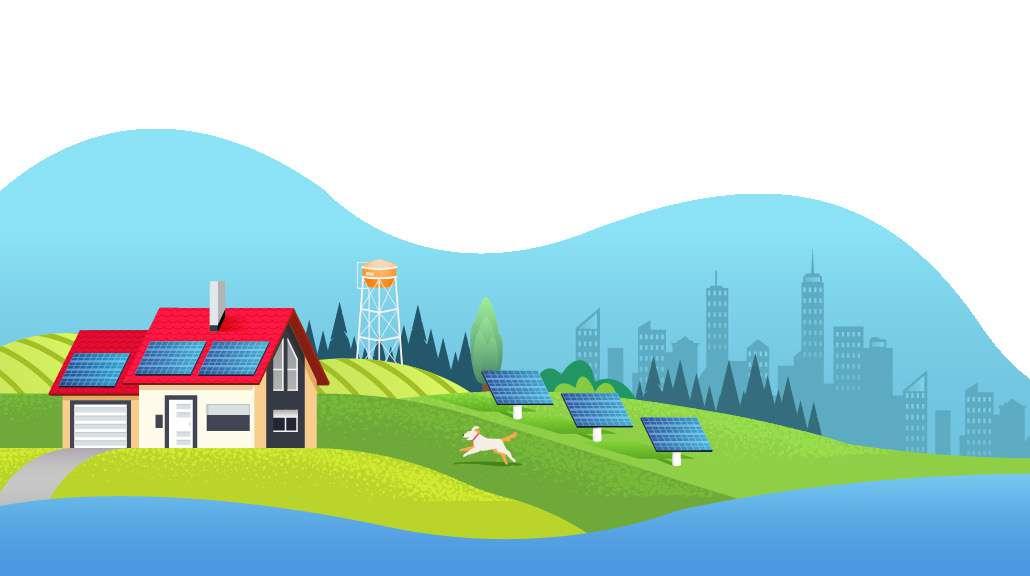
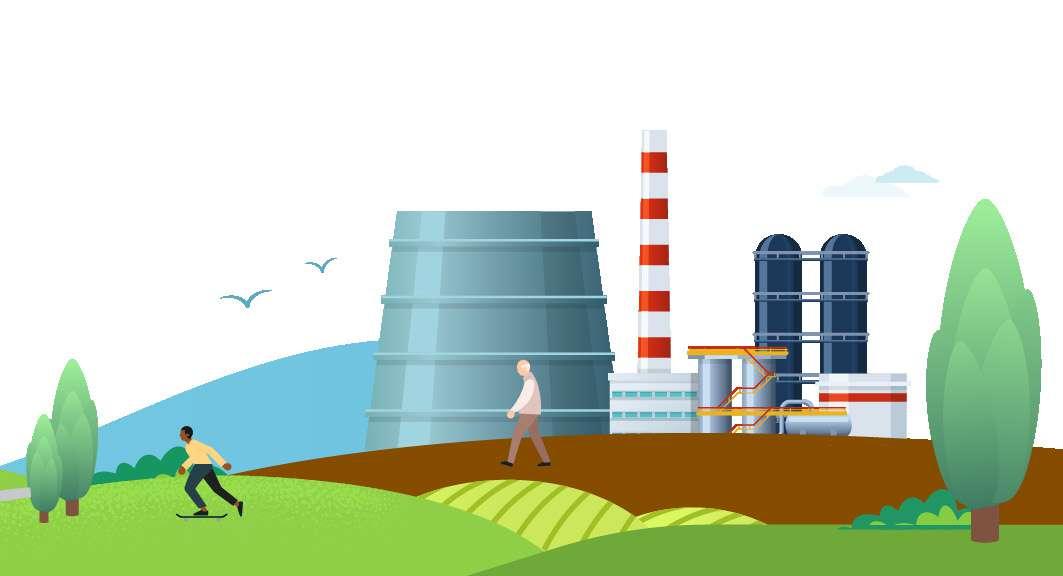
CLEAN SOLAR ENERGY
Installing solar panels to generate renewable energy for use in office buildings, as well as saving electricity costs and reducing carbon dioxide emissions that be pollution to the world.
In 2022,
Amount of recycled waste in East Water Building was 19.01% of total waste of kg. 6,833.50
Electricity consumption per unit of pumped water decreased from 2021 by 8.82% 8.58%
Amount of carbon dioxide emissions decreased from 2021 by
(from the total energy consumption of pumped water per unit of pumped water)
Increase green zone 5 Rai/year, trees/Rai. 400
Absorbs
1 tree absorbs an average of of carbon dioxide. 9-15 kg/year tons of 238-396
carbon dioxide/year
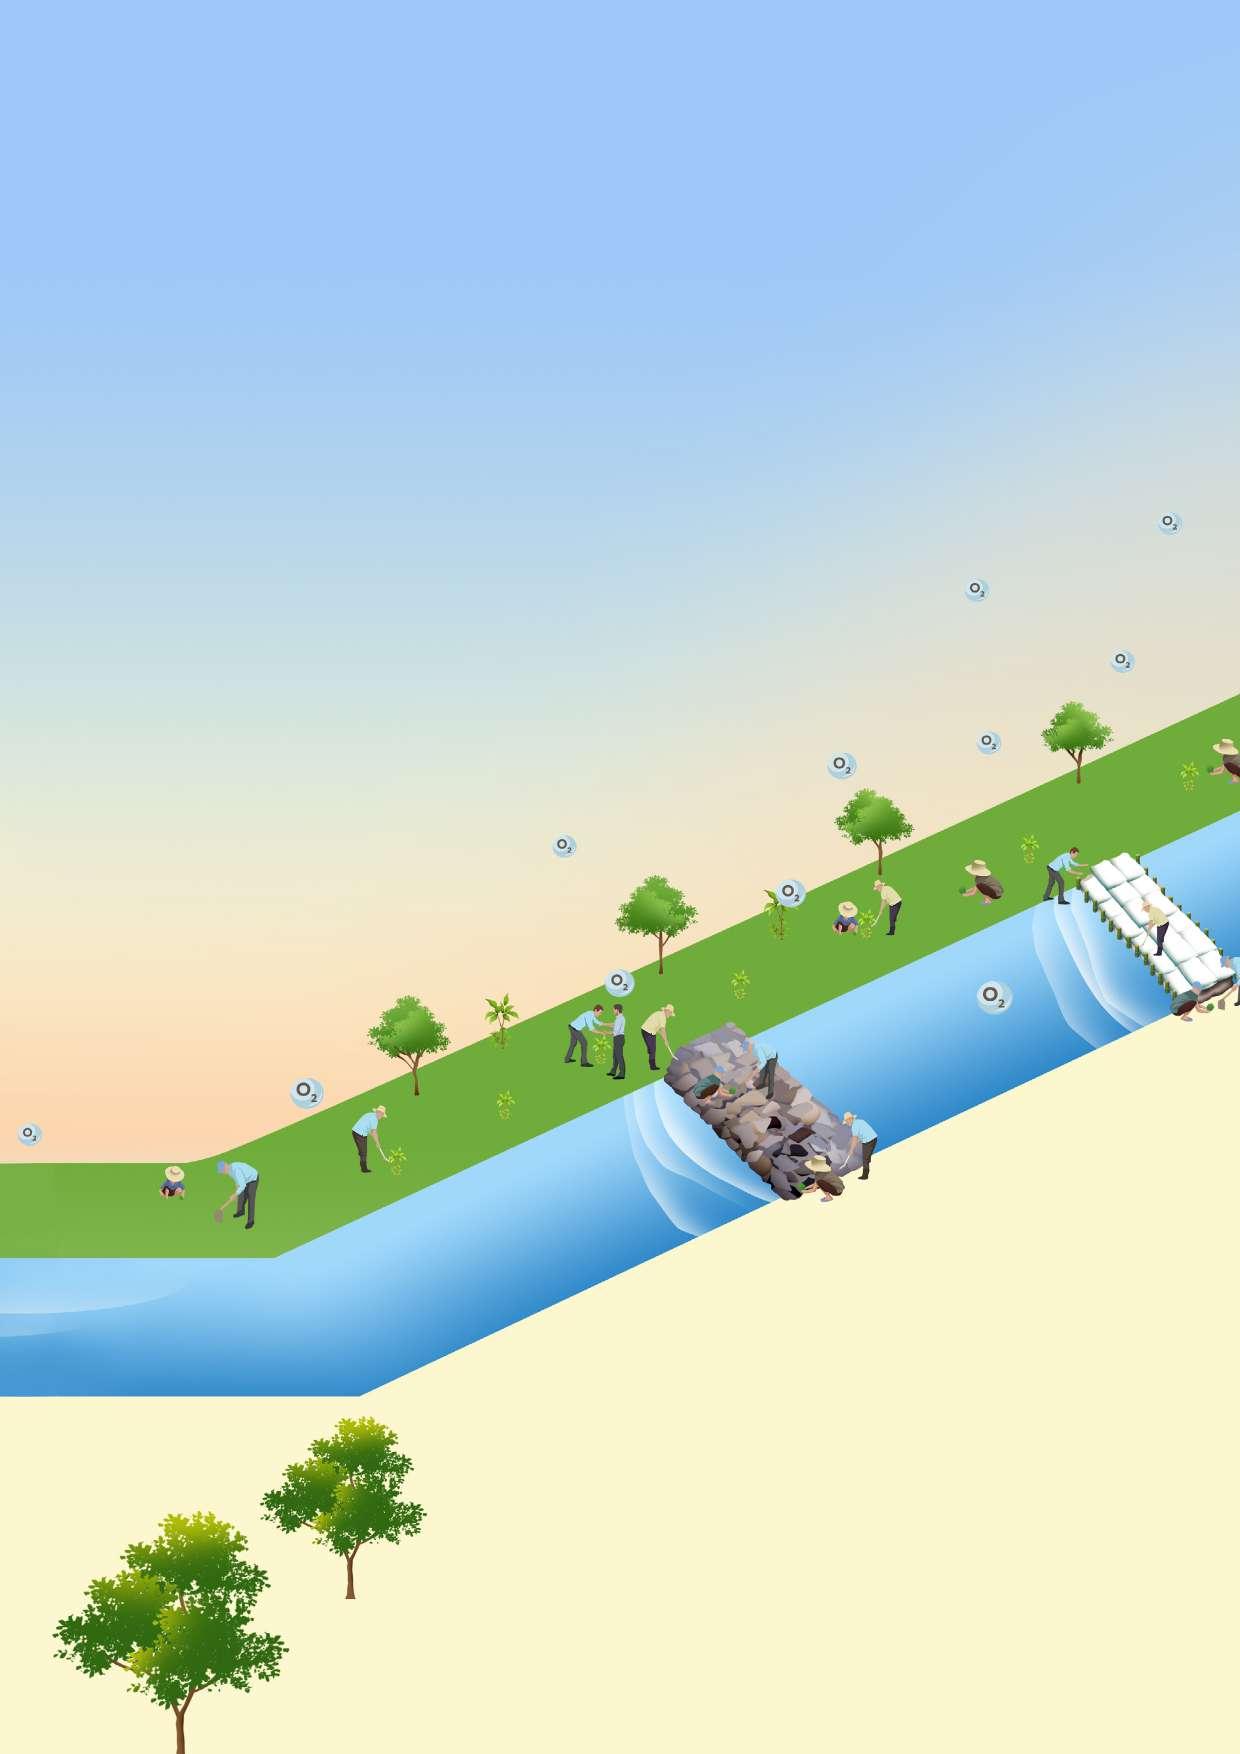
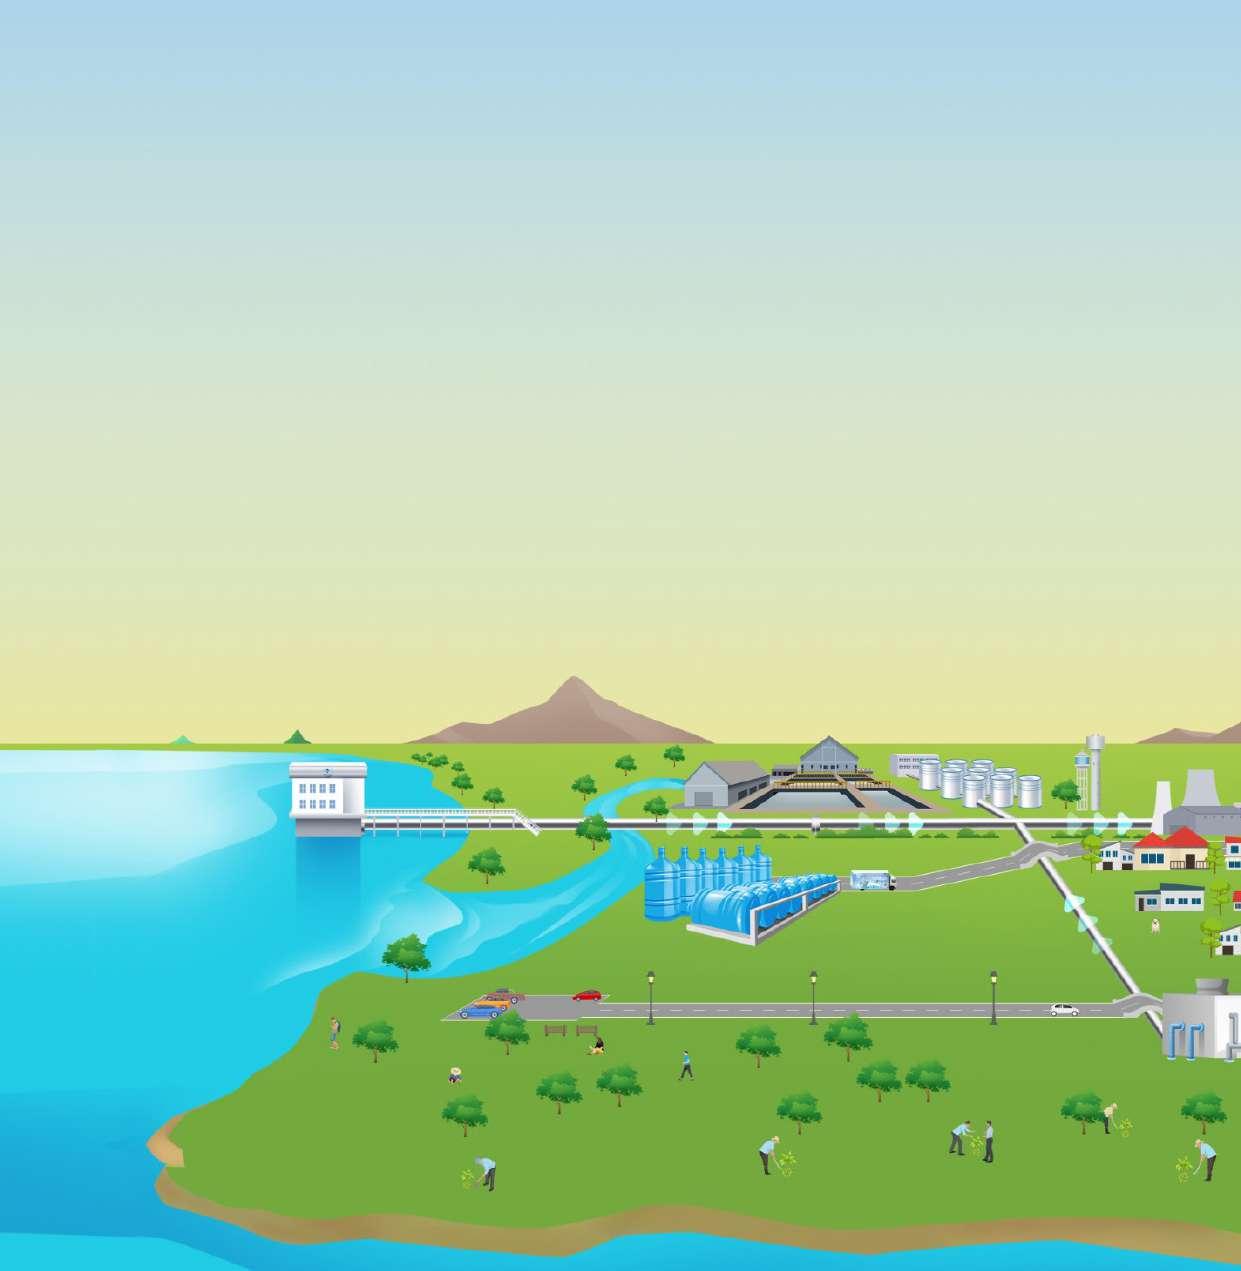
PLANTING UPSTREAM FOREST, taking care of natural reservoir by planting upstream forest that will help to store rainwater for use all year round and absorb carbon dioxide that causes global warming.
VISION
Missions SUSTAINABILITY REPORT 2022 004
To develop the security and maintain stability of water supply in response to the long-term water demand.
To expand investment in water business comprehensively for continuous and sustainable growth both domestically and internationally.
To increase competitive advantages through technologies and innovations
To develop human resources and improve management efficiency.
“TO BE THE LEADER IN ENSURING SECURITY OF THE COUNTRY’S COMPREHENSIVE WATER RESOURCE MANAGEMENT AND DEVELOPMENT THROUGH SMART TECHNOLOGY”
To be socially and environmentally responsible and establish good relationships with all stakeholders in accordance with corporate governance principles. 01 02 03 04 05
CORE VALUES S H A R P Stakeholder Focus Holistic Thinking Adaptability Result Acceleration Proactive and Creative Thinking 4 ENTERING THE DECADE OF PROVIDING SUSTAINABLE TOTAL WATER SOLUTIONS th 005
CONTENTS 08 MESSAGE FROM THE PRESIDENT AND CHIEF EXECUTIVE OFFICER 10 ABOUT EAST WATER 10 EAST WATER GROUP’S BUSINESS STRUCTURE 12 SUSTAINABILITY AT POLICY LEVEL 13 SUSTAINABLE DEVELOPMENT NETWORK MEMBERSHIP 14 SUPPLY CHAIN MANAGEMENT 16 CORPORATE GOVERNANCE STRUCTURE 18 ABOUT THIS REPORT 20 GUIDANCE FOR DETERMINING KEY SUSTAINABILITY ISSUES OF EAST WATER GROUP 27 MATERIAL SUSTAINABILITY TOPICS 28 MATERIAL SUSTAINABILITY TOPIC ASSESSMENT RESULTS 2022 30 ECONOMIC DIMENSION 32 GOOD CORPORATE GOVERNANCE 36 COMPLAINT MANAGEMENT 40 RISK MANAGEMENT 42 SUSTAINABLE SUPPLIER MANAGE 44 SUSTAINABLE BUSINESS GROWTH 47 SERVICE-MINDEDNESS AND PRODUCT QUALITY STANDARDS
WATER
FOR A BETTER TOMORROW SUSTAINABILITY REPORT 2022 006
QUALITY
MANAGEMENT
54 ENVIRONMENTAL DIMENSION 56 CLIMATE CHANGE RESPONSE TOWARDS INTEGRATED WATER MANAGEMENT 62 CARE FOR WATER QUALITY IN WATER SOURCES 63 ENVIRONMENTAL PROJECTS 72 SOCIAL DIMENSION 74 HUMAN RESOURCES MANAGEMENT 77 CARE FOR EMPLOYEES’ WELL-BEING AND PERSONNEL DEVELOPMENT TOWARDS A SUSTAINABLE WATER ORGANIZATIONAL 86 SHARING KNOWLEDGE WITH SOCIETY 88 OCCUPATIONAL SAFETY, HEALTH, AND ENVIRONMENT 96 CONSTRUCTION IMPACT RESPONSIBILITY 98 COMMUNITY SUSTAINABILITY PROJECTS 108 ANNEX 130 GRI CONTENT INDEX 007
MESSAGE FROM THE PRESIDENT AND CHIEF EXECUTIVE OFFICER
(Disclosure 2-22)
With the confidence in the Company’s capability in professional water management, We are ready to step into the 4th decade because we are a part of the country’s economic development

SUSTAINABILITY REPORT 2022 008
For 30 years since its inception in 1992, the Company has been engaged in the raw water management business through large water grid for the consumer and industrial sectors according to the cabinet resolution to be the center for raw water management and support the eastern seaboard development plan to become the country’s main industrial zone. The Company has accumulated experience and expertise in water management which made it possible for the Company to expand its raw water business to total water solution through innovation and modern technology under the design suitable for water users in all sectors, whether raw water business, tap water business, industrial water business, wastewater treatment business and recycled water business to create sustainable economic and social value forever.
In 2022, the Company faced challenges in various aspects including: The Continuation of COVID-19 pandemic from the previous year: Although the pandemic situation has been relieved, the Company still placed importance on employees by adopting technology to support hybrid working mode to create work-life balance. The Company also focused on developing capacity and expertise in the field as well as raising awareness and encouraging employees’ engagement in creating good and efficient work that was effective to the organization society and environment. Moreover, the Company placed importance on other stakeholders by planning the work to respond to their needs and providing various engagement channels for faster and more effective communication.
Climate Change: In a situation of rising global temperatures, disasters have been intensifying every year such as rising sea levels, droughts, flash floods caused by changing rainfall, as well as changes in volume and quality in natural water sources that were affected by climate in many areas.
Therefore, ensuring water security in the eastern region to be sufficient to meet the growing water demand in the future is essential. The Company has therefore invested in the development of additional 139.08 kilometers of water grid system namely Khlong Luang – Chon Buri Water Pipeline, Nong Plalai – Nong Kho –Laem Chabang Water Pipeline, and Map Ta Phut –
Sattahip Water Pipeline to build confidence for water users both for consumer and industrial sectors. The Company continues to develop its capacity to provide efficient water distribution services in the Eastern Economic Corridor and continues to adhere to the mission to integrate raw water pipeline management in the eastern region focusing on unity and stability. This includes maintaining water pipeline system to adequately meet the water demand and can expand the water grid system to achieve maximum benefits in the future. This is what the Company has been committed to for the past 30 years, reinforcing its vision of “To be the leader in ensuring security of the country’s comprehensive water resource management and development through smart technology” along with conducting business with responsibility to the community, society, and environment which is the foundation of transparent management with good governance.
With the dedication of the Board of Directors, executives, and employees on the foundation of sustainability, the Company gained a wide acceptance and trust as a provider of total water solution services. In 2022, the Company was recognized as a company in the Thailand Sustainability Investment (THIS) stock list for the 8th consecutive year. The Company also earned an excellent rating according to the Corporate Governance Report of Thai Listed Companies (CGR) assessment and the Sustainability Disclosure Award. Going forward, the Company is ready to bring its capacity and expertise in comprehensive water management to drive the country towards sustainability by creating permanent water security without compromising the quality of life of people in the community and society.
“With the confidence in the Company’s capability in professional water management over the past 30 years, leading to the stability of water resources and raw water grid system in the eastern region, we are ready to step into the 4th decade because we are a part of the country’s economic development.”
(Mr. Cherdchai Pitiwacharakul) President & CEO
009
ABOUT EAST WATER
East Water – Expert in Total Water Solution Services through Water Grid System (Disclosure 2-1)
Eastern Water Resources Development and Management Public Company Limited (East Water)
Ticker Symbol: EASTW, Registered Capital: 1,663.73 million Baht
Head Office
Eastern Water Resources Development and Management PCL.
East Water Building, 1 Soi Vibhavadi Rangsit 5, Vibhavadi Rangsit Rd., Chom Phon Subdistrict, Chatuchak District, Bangkok 10900 (Thailand)
Universal Utilities PCL. (UU PCL.)
East Water Building, 1 Soi Vibhavadi Rangsit 5, Vibhavadi Rangsit Rd., Chom Phon Subdistrict, Chatuchak District, Bangkok 10900 (Thailand)
EAST WATER GROUP’S BUSINESS STRUCTURE
(Disclosure 201-4)
The Company is mainly engaged in the provision of total water solution services including raw water, tap water, industrial water, wastewater treatment, and recycled water, while UU PCL., the Company’s subsidiary, principally operates the tap water supply business and provides total wastewater management systems with the goal to enable people to have access to tap water thoroughly to enhance quality of life and well-being of the people.
(Details are available in Annual Report 2022 (Form 56-1 One Report 2022) Product and Service information topic in page 36)
SUSTAINABILITY REPORT 2022 010

100% Chachoengsao Water Supply Co., Ltd. Nakornsawan Water Supply Co., Ltd. Bangpakong Water Supply Co., Ltd. Egcom Tara Co., Ltd. 100% 100% 100% 90% Government agencies and state enterprise 744,800,000 shares 44.77% Financial institutions/ funds 107,915,203 shares 6.49% Private agencies 315,154,968 shares 18.94% Retail Investors 495,854,978 shares 29.80% Raw water and Raw water pipelines Industrial water Tap water Wastewater treatment Recycled water Total water solutions business As at latest closing date 30 December 2022 Surface tap water business Wastewater treatment and recycled water business Water system operations and maintenance contracts (O&M) 011
SUSTAINABILITY AT POLICY LEVEL

The Company managed its organizational sustainability across all dimensions including economic, environmental, and social dimensions based on internal and external factors through the Corporate Governance and Sustainable Development Committee. This enabled the Company to be prepared and ready to embrace any changes in a timely manner. The sustainability management structure is divided into 3 levels (Disclosure 2-2, 2-12, 2-13, 2-14, 2-16, 2-23, 2-24) as follows
Corporate Governance and Sustainable Development
Executives and Supervisors
Sustainable development policy framework and guidelines
Sustainability Report Working Group Head
Sustainability Report Working Group (Operational Level)
Sustainability Report Working Group members (comprising members with diverse qualifications)
Determination of polices, indicators, plans, guidelines and tools; follow-up of operating results; and provision of recommendations on operations; approval the reported information that is consistent with the material issues
Preparation of indicators of divisions to be aligned with plans; implementation of sustainable development plans; To monitor and control the impact, and reporting of operating results to Corporate Governance and Sustainable Development
SUSTAINABILITY REPORT 2022 012
The Company’s operations have been focused on the cost-effective use of resources throughout the supply chain business processes along with the management of safety, occupational health, and working environment. In doing so, the Company adopted international requirements and standards as guidelines in its operations to drive sustainability. Such standards included Quality Management Systems Standard (ISO 9001:2015), Environmental Management Systems Standard (ISO 14001:2015), Occupational Health and Safety Management Systems (ISO 45001:2018), World Resource Institute’s Organizational Greenhouse Gas Inventory, and Thailand Greenhouse Gas Management Organization (TGO)’s Standards of Greenhouse Gas Emission Calculation. These standards were key drivers of sustainable development in line with the Company’s sustainable management policy. Details can be found in the Company website. (www.eastwater.com)
SUSTAINABLE DEVELOPMENT NETWORK MEMBERSHIP
(Disclosure 2-28)
013
SUPPLY CHAIN MANAGEMENT
(Disclosure 2-6, 2-29)
In 2022, the Company’s end-to-end business process was as follows:
Good Corporate Governance
(1. Regulatory bodies and government agencies relevant for business operations 2. Board of Directors 3. Executives and employees 4. Customers 5. Suppliers 6. Shareholders and investors 7. Communities and government agencies)
Honest, transparent, and auditable operation is a Company’s Code of Conduct to be complied by all employees as a basis for their operations. There is risk assessment and Business Continuity Management (BCM) & Business Continuity Planning (BCP) on an annual basis.
Organization Management
(1. Board of Directors 2. Executives and employees)
The Company conducts business restructuring to ensure consistency with policies, strategies, and organizational development plan towards sustainable growth. The Board of Directors, executives, and employees drive the operations toward the same direction and organizational goals.
Community Affairs and Corporate Image Management
(1. Regulatory bodies and government agencies relevant for business operations 2. Executives and employees
3. Communities and government agencies 4. Mass media)
In managing water to satisfy business needs, the Company considers the principle of sharing water resources to be sufficient for all sectors. Also, collaborative efforts are made to improve the well-being of the people in the communities and societies along the water grid of 523 km., through the 3 development projects namely the water utility and environment conservation promotion, the community well-being promotion, and the learning promotion.
Contracts and Customer Relations Management

(1. Regulatory bodies and government agencies relevant for business operations 2. Executives and employees 3. Customers 4. Suppliers)
One of the Company’s priorities is to manage contracts with its stakeholders across different groups by observing the principles of good corporate governance and monitoring the operations to ensure compliance with relevant contracts and standards. The Company also constantly improve its operation to achieve greater efficiency to satisfy the needs of its stakeholders as contract parties.
Raw water and Raw water pipelines Business
Recycled Water Business
Tap water Business/Industrial water Business
Drinking water Business
SUSTAINABILITY REPORT 2022 014
Financial Management
(1. Shareholders and investors
2. Financial institutions
3. Executives and employees)
A focus is placed on sound internal controls and regular financial risk management. Annual financial reports are prepared using a database management system based on generally accepted standards and appropriate accounting policy. The reports are certified by an external auditor (Third Party) to ensure correctness and transparency which reflects good maintenance of financial credit ratings and continued confidence.
Analysis and Development of Water Supply Sources and New Businesses
Wastewater Treatment Business

Construction Project Management
(1. Regulatory bodies and government agencies relevant for business operations
2. Executives and employees
5. Communities and government agencies)
3. Customers
4. Suppliers
The Company together with the government and private agencies analyze climate condition and water status in different areas and find way to develop the potential of water supply source to increase water reserve capacity. Total water solution business plan is prepared to respond to global climate change issues and to diversify products to meet customers’ needs for sustainable business operation.
2. Executives and employees
(1. Regulatory bodies and government agencies relevant for business operations
3. Customers 4. Suppliers 5. Communities and government agencies)
Construction is an important process that can affect almost every group of the Company’s stakeholders. Therefore, the Company established a set of standards for working with stakeholders especially partners and communities while placing emphasis on uses of technologies and innovations in project management to enhance operational efficiency and prevent any possible impacts.
Water Pumping System Development Management and Innovation
(1. Regulatory bodies and government agencies relevant for business operations
2. Executives and employees
3. Customers 4. Suppliers 5. Communities and government agencies)
Water pumping system is designed and developed through the adoption of modern water management innovations and technologies to improve speed and accuracy while reducing non-revenue water. Including adoption of modern technologies in designing total water solution system suitable for each user.
015
CORPORATE GOVERNANCE STRUCTURE
(Disclosure 2-9)
The Board of Directors established 5 subcommittees to monitor and supervise the operations closely and to regularly report to the Board of Directors. They consisted of 1) Audit Committee, 2) Investment Committee, 3) Risk Management Committee, 4) Corporate Governance and Sustainable Development Committee, and 5) Nomination and Remuneration Committee. The subcommittees performed duties within the scope of laws, the Company’s objectives and Articles of Association, and resolution of the shareholders’ meetings; and had authority to take any actions within the scope of the Company’s objectives and applicable laws.
The Board of Directors consisted of the members with diversified qualifications in terms of skills, experiences, capabilities, expertise, gender, and age. Details were as shown in the Board Skills Matrix. (Further details are available in Annual Report 2022 (Form 56-1 One Report) The Board of Directors’ Composition topic in page 77
Board
topic
page 92)
and Nomination, Development, and Performance
Evaluation of the
of Directors
in
(Disclosure 2-17)
Strategy and Business Development Office Operations Office Business Supporting Office Finance and Accounting Office Internal Audit Office Corporate Strategy Department Human Resources Department Finance Department Operations & Customer Service Department Business Development Department Business Administration Accounting Department Facility & Maintenance Department Engineering Department Information Technology Department Construction Project Management Department Corporate Communication Department Company Secretary Office Legal Affairs and Corporate Governance Office Audit Committee Investment Committee Risk Management Committee Corporate Governance and Sustainable Development Committee Nomination and Remuneration Committee Board of Directors Eastern Water Resources Development and Management PCL. President and Chief Executive Officer Office of the President & CEO SUSTAINABILITY REPORT 2022 016
The subcommittees with the key role in good corporate governance were: (Disclosure 2-10)
1. The Corporate Governance and Sustainable Development
consisted of 3 independent directors with key duties in 2 areas namely 1) Corporate Governance, 2) Sustainable Development
Details are available in the Corporate Governance and Sustainable Development Committee Charter in the Company’s website (www.eastwater.com).
Reporting directly to the Legal Affairs and Corporate Governance Office, the Corporate Governance Division is responsible for supervising corporate governance work and coordinating with all entities in assessing the compliance with applicable laws, regulations, and rules by using the Law Compliance Checklist. The Corporate Governance Division also communicated good corporate governance practices to all employees and coordinate with the SEC and SET in disclosing all data and information as required by law.
In 2022, the Company reviewed the good corporate governance principles, the business group’s code of conduct, and the internal anti-corruption policy to be updated with the current situation. In addition, the Company has established procedure to prevent repeated violation of the business group’s code of conduct, and remedies in case of human rights violations.
At present, the Company has the Corporate Relations and CSR Division under the Corporate Communication Department responsible for community, social, and environmental activities at the operating sites to ensure sustainable business operations.
2. The Risk Management Committee
consisted of 5 members with details as available in the Risk Management Committee Charter in the Company’s website (www.eastwater.com).
The Company’s Risk Management and Quality System Division, under the Corporate Strategy Department, is responsible for preparing risk management manuals, as well as analyzing and reviewing risk factors and their impacts on the Company’s successful business plan execution. It also proposes the suitable risk management guidelines which form a part of the Company’s risk management plan and monitors the progress of enterprise-wide risk management operations of other departments for regular reporting to the Risk Management Committee. (Details as in the Annual Report 2022 (Form 56-1 One Report 2022) under Risk Management topic in page 48)
3. The Audit Committee
consisted of 3 independent directors with details as available in the Audit Committee Charter in the Company’s website (www.eastwater.com).
017
ABOUT THIS REPORT
(Disclosure
The Sustainability Report 2022 is the 12th in a series of the Company’s annual sustainability report to disclose the corporate sustainability-related performance to reflect the Company’s responsibilities towards its stakeholders in economic aspect and social and environmental aspect as they are significant to the Company’s sustainable development. The contents were categorized based on approaches to manage impact on stakeholders in all core processes of business operations, which are known as the 6 sustainable approaches. This report was developed in accordance with the sustainability reporting framework of the Global Reporting Initiatives (GRI Standards 2021) at the limited assurance level. Information contain herein is for the reporting period of 1 January to 31 December 2022 for publishing in April 2023.
The scope of this report presents business operation information in 2022 covering business operations of Eastern Water Resources Development and Management Public Company Limited on raw water, tap water, industrial water, wastewater treatment, and recycled water, as well as the business operations of Universal Utilities Public Company Limited on surface tap water, wastewater treatment and recycled water, and operation and maintenance of total water solutions in Thailand.
In 2022,
There is an additional report on the Company’s complaint handling process and human rights operation process.
In 2021,
There was a report only on the energy consumption in the raw water pumping system and office buildings.
In 2022,
There is an additional report on fuel consumption of the Company’s vehicles for operations.
1 2 3 SUSTAINABILITY REPORT 2022 018
In 2021,
There was a report only on the Carbon Dioxide emission from the water pumping system and office buildings.
This report contains information with significant changes from 2021 as follows: 2-2, 2-3, 2-4, 2-5)
In 2022, There is an additional report on Carbon Dioxide emission from fuel of the Company’s vehicles for operations.
This Sustainability Report was certified at the Limited Assurance level by a third-party assurance practitioner covering only the Company’s operations, excluding the operations of UU PCL. with expertise in validating and assuring accuracy, completeness, and reliability of information disclosed according to the Global Reporting Initiative (GRI Standard). High-level executives were involved in the selection process in compliance with the Company’s procurement regulations.
Guidance for Determining Report Contents: The Sustainability Report 2022 Working Group consists of representatives from all departments. The working group’s brainstorming meetings were held to jointly review and analyze material sustainability topics; and conclusions were proposed to the President and CEO for consideration and endorsement and for reporting to the Corporate Governance and Sustainable Development Committee for acknowledgement before disclosure thereof in this Sustainability Report.
Channels for Further Enquiries:
Ms. Chatkaew Poomarin, Vice President, Corporate Communication Department Eastern Water Resources Development and Management Public Company Limited East Water Building, 1 Soi Vibhavadi Rangsit 5, Vibhavadi Rangsit Road, Chom Phon Subdistrict, Chatuchak District, Bangkok 10900
Telephone : 02-272-1600
E-mail : pr@eastwater.com
This and previous Sustainability Reports can be downloaded from the Company’s Website (www.eastwater.com)
019
GUIDELINES FOR DETERMINING MATERIAL SUSTAINABILITY TOPICS OF EAST WATER GROUP
Key Stakeholder Involvement (Disclosure 2-29)
The Company analyzed its groups of stakeholders from its work processes and prioritized them based on 2 factors namely stakeholders’ influence on the Company and impacts of the Company’s operations on its stakeholders. Thus, 6 groups of stakeholders were categorized as follows: 1) Customers, 2) Regulatory bodies and government agencies relevant for business operations, 3) Shareholders, investors and financial institutions, 4) Communities and government agencies, 5) Suppliers, and 6) Board of Directors, Executives and Employees. Relevant units responsible for communication channels as well as strategic planning and action plans to respond to specific expectations of key stakeholder groups were as follows:
1.1 Company’s customers
Method of Participation/Frequency
Annually
- Meetings between executives and key customers
- Satisfaction surveys (by external agencies)
- Project progress monitoring
Based on the Company’s projects or each activity or complaint
- Meetings with customers to offer total water solutions and recommendations regarding project development
More than 1 time/year or quarterly
- Satisfaction surveys (by internal units)
- Water meter inspection
- Preventive maintenance of SCADA system
Monthly
- Water War Room Key man meetings
- Customer meetings
- Water quality analysis reports
At any time or throughout the year
- Customer meetings
- Customer complaints
- Communication and public relations via social media platforms such as the Company’s Website, Facebook, SMS, Microsoft Teams, and Line group
- Meetings on special day occasions
- Water situation report
Expectations/Recommendations/Issues for improvement
1. Consistent water pressure control to be stable and sufficient for use
2. Water pumping management technology
3. Problem solving services that meet customers’ objectives
4. Stability of water grid system to have extensive coverage with adequate water sources to meet the demand
5. Water quality that meets the standards specified in the contract
6. Additional channels for disseminating information, speed of information sharing, diversified service offerings and easy access
7. Services that respond to customers’ needs
8. Preparation of sufficient amount of water to meet future demand
Impact on stakeholders
Controlling and stabilizing the water grid affects the business operations of the Company’s customers
SUSTAINABILITY REPORT 2022 020
1. Customer
1. Customer
1.2 Customer (UU PCL.)
Method of Participation/Frequency
Per each service
- After-service satisfaction surveys (by external agencies)
At any time or throughout the year
- Customer complaints
- Communications and public relations via social media platforms such as the Company’s Website, Facebook, SMS, Microsoft Teams, and Line group
- Meetings on special day occasions
Expectations/Recommendations/Issues for improvement
1. Tap water quality
2. Services of company staff and responses to customers’ needs
3. Customer complaints and/or communication channels
4. Occupational health and safety for the stakeholders (employees, suppliers, customers, and communities)
5. Control measures to prevent and reduce negative impacts on communities
Impact on stakeholders
Tap water quality control and responding to customer needs affects the quality of life of Customer (UU PCL.)
021
2. Regulatory bodies and government agencies relevant for business operations
Method of Participation/Frequency
Annually
- Studies on climate forecasts based on different climate models
- Satisfaction survey (by external agencies)
More than 1 time/year or quarterly
- Meetings with government agencies and water users
- Relations activities
Monthly
- Water War Room keyman meetings
- Meetings with government agencies
At any time or throughout the year
- Studies and compliance with requirements, rules, regulations, and laws
- Communications and public relations via social media platforms such as the Company’s Website, Facebook, Line@, and Line group
- Meetings on special day occasions
Expectations/Recommendations/Issues for improvement
1. Publicizing information to create understanding for the local community
2. Cost management with administrative risks; introducing innovations to increase stability, reduce water footprint, reduce cost, resulting in long-term balanced of water demand

3. Sourcing of additional water sources for backup purpose to support economic growth and ensure sufficient water for all sectors
4. Human resources and technological developments
5. Budget allocation for social and environmental care and continuous implementation of community well-being improvement projects
Impact on stakeholders
The integration of water demands between the Company and government agencies affects the management of sufficient water for all sectors
SUSTAINABILITY REPORT 2022 022
3. Shareholders, investors, and financial institutions
Method of Participation/Frequency
Annually
- Annual General Meeting of shareholders (AGM)
- Satisfaction surveys (by external agencies)
More than 1 time/year or quarterly
- Management Discussion and Analysis sessions
- Site visit activities
- Bank relationship building activities
At any time or throughout the year
- Activities to communicate corporate performance to investors/shareholders such as Roadshow, Company visits, Conference calls, etc.
- Q&A sessions via telephone and E-mail
Expectations/Recommendations/Issues for improvement
1. Clarity of corporate vision and missions leading to the goals
2. Sustainable business growth, business expansion plan, and new investment projects
3. Construction project progress and total water solutions
4. Cost management and profit of the company
5. Innovation or technology in water pumping management
6. Measures to deal with risks affecting business
Impact on stakeholders
Sustainable business growth and business expansion plans including controlling environmental impacts such as energy consumption, greenhouse gas emissions, water resource usage, etc., affect the investment decisions of the shareholders, investors, and financial institutions

023
4. Communities and local government agencies
Method of Participation/Frequency
Annually
- Satisfaction surveys (by external agencies)
Based on the Company’s projects or each activity or complaint
- Public relations activities for projects
- Follow-up meetings on community-related issues and solutions
- CSR activity assessments
More than 1 time/year or quarterly
- Meetings with government agencies and groups of water users
Monthly
- Life quality and environmental improvement activities for communities
At any time or throughout the year
- Studies and compliance with requirements, rules, regulations, and laws
- Communications and public relations via social media platforms such as the Company’s Website, Facebook, Line@, and Line group
- Meetings on special day occasions
Expectations/Recommendations/Issues for improvement
1. Development and management of water resources to be sufficient
2. Taking care of communities, continuous organizing communities well-being improvements projects
3. Publicizing corporate news and information regularly with usefulness
4. Attention to water quality
5. Speed of service including corrections of problems and complaints
6. Business operations that do not impact communities and environment

7. Budget allocation for social and environmental care and continuous implementation of community well-being improvement projects
Impact on stakeholders
Efficient water management, preparation of community well-being improvement projects, and complaint management affect the community well-being
SUSTAINABILITY REPORT 2022 024
5. Suppliers
Method of Participation/Frequency
Annually
- Relations activities
- Satisfaction surveys (by external agencies)
Per each service or each price enquiry/tender or one time at first contract signing
- Clarification meetings for scope of work worth 1 million Baht up
- Anti-corruption policies
- Declaration of intent to fight corruption
- Supplier code of conduct for sustainable business development
- Policy on safety, occupational health, and working environment
- Notification of personal data processing
At any time or throughout the year
- Communications and public relations via social media platforms such as the Company’s Website and Line group
- Registration of new suppliers
Expectations/Recommendations/Issues for improvement
1. More convenient and faster procurement and acceptance procedure
2. Requirement for continuous organization of relations activities through meetings, seminars, or trainings
3. Information on the Company’s workplan and future projects
4. Information on procurement methods and assessment of suppliers’ quality of products and service
Impact on stakeholders
Information on the Company’s future project plans, and convenient and fast procurement and acceptance procedures affect the operation planning of suppliers
6. Board of Directors, executives, and employees
6.1 Board of Directors
More
of Participation/Frequency
Method
than
time/year or quarterly
Site visit activities
- Board of Directors’ meetings
1
-
Monthly
Good corporate governance
Complaint management 3. Systematic risk management 4. Sustainable business growth
Sustainable supplier management
Quality of products and services
Measures to tackle climate change and water data management
Changes in water quality in water sources
Environmental projects
Human rights and fair employment of labors
Personnel care and development towards national water organization
Safety, occupational health, and working environment
Standards for supervision of construction projects for the community
Community well-being improvement projects
Expectations/Recommendations/Issues for improvement 1.
2.
5.
6.
7.
8.
9.
10.
11.
12.
13.
14.
025
6. Board of Directors, executives, and employees
6.2 Company’s Executives and employees
Method of Participation/Frequency
Annually
- Satisfaction and employee engagement surveys (by external agencies)
More than 1 time/year or quarterly
- Meetings with 2 Workplace Welfare Committees
- CEO meet employee activities
- Relations activities
Monthly - Management meetings
- Meeting with 2 committees on Safety, Occupational Health, and Working Environment
At any time or throughout the year
- Receipt of employee complaints
- Guidelines for Personal Data Protection of Employees and Job Applicants
6.3 Subsidiaries’ executives and employees
Method of Participation/ Frequency
Annually
- Satisfaction and employee engagement surveys (by external agencies)
More than 1 time/year or quarterly
- Meetings with 1 Workplace Welfare Committees
Monthly
- Management meetings
- Meeting with 1 committee on Safety, Occupational Health, and Working Environment
At any time or throughout the year
- Receipt of employee complaints
Expectations/Recommendations/Issues for improvement
1. Work process with clear procedure, fast, and flexible
2. Career advancement and opportunities
3. Collaborative corporate culture
4. Quality of life and safety
5. Corporate stability
Impact on stakeholders
Human Resources Management affects the quality of life in terms of occupational health and safety of the Company’s executives and employees
Expectations/Recommendations/Issues for improvement
1. Compensation and achievement recognition systems
2. Talent retention
3. Personnel development system and knowledge resources
4. Healthcare and safety for employees
Impact on stakeholders
Human Resources Management affects the quality of life in terms of occupational health and safety of the Company’s executives and employees of UU PCL.
SUSTAINABILITY REPORT 2022 026
MATERIAL SUSTAINABILITY TOPICS
The Company identified material sustainability topics based on internal and external factors. Internal factors included corporate governance principles adopted in its operations, policies, strategies, targets, and business plans. External factors included national and global interests and trends, complaints, as well as requirements, expectations, and recommendations of relevant stakeholders. Then, the Company prioritized material sustainability topics by categorizing material topics according to the corporate governance principles into 3 dimensions namely economic, social, and environmental dimension based on the following processes:
Collection of Material Sustainability Information and Issues
• Internal Information (policies, strategies, targets, business plans, and risk management plans) To identify key issues through the brainstorming of ideas from executives via workshops, preparation of strategies, and risk management plans with possible short-and long-term impacts on organizational sustainability.
• External Information (national or global trends and interests) To review national or global trends and interests in alignment with the Sustainable Development Goals (SDGs) and expectations of stakeholders through formal and informal surveys such as meetings, seminars, interviews, or dialogues as well as opinion and satisfaction surveys with each group of stakeholders.
Prioritization
After the material sustainability topics were identified based on the internal and external factors, the ratings and priorities were given according to 2 criteria. Then, those topics were specified in the Materiality Matrix which was divided into 2 axes.
• Horizontal axis: significant impact on economic, social, and environmental dimensions consider the severity level and likelihood of impact, both economic, social and environmental dimensions, business risks, legal requirements, as well as interest from stakeholder groups.
• Vertical axis: important issues that stakeholders pay attention to, including economic dimension, social dimension, and environmental dimension, as well as issues affecting both positive and negative decisions of stakeholder groups that may affect the Company.
Review of Report Contents
The material topics obtained from the analysis by the Sustainability Development Working Group of the East Water Group were proposed to the high-level executives for consideration and endorsement. Those topics were also endorsed by the Corporate Governance and Sustainability Development Committee to determine the content covering 3 dimensions namely economic, social, and environmental dimensions.
1 2 3 027
MATERIAL SUSTAINABILITY TOPIC ASSESSMENT RESULTS 2022
1.
1.1 Good corporate governance
1.2 Complaint management
1.3 Systematic risk management
1.4 Sustainable supplier management
1.5 Sustainable business growth
1.6 Quality of products and services
2.1 Measures to tackle climate change
2.2 Changes in water quality in water sources
2.3 Environmental projects
3.1 Human rights and human resources management
3.2 Personnel care and development towards national water organization
3.3 Safety, occupational health, and working environment
3.4 Standards for supervision of construction projects for the community
3.5 Community well-being improvement projects
Remark : Topic 1.1 covered 3 dimensions (economic, social, and environmental)
Materiality Matrix
Significant impact on economic, social, and environmental dimensions
 Economic Dimension
2. Environmental Dimension
3. Social Dimension
Economic Dimension
2. Environmental Dimension
3. Social Dimension
Material
Considered by Stakeholders 6 5 4 2 3 1 1 2 3 4 5 6 3.3 1.6 3.4 1.1 1.4 2.2 1.5 2.3 3.1 1.2 3.2 3.5 1.3 2.1 SUSTAINABILITY REPORT 2022 028
Topics
Materiality Matrix
Summary of 14 topics and 27 indicators
Material Topics considered by the Company/Stakeholders
1. Good Corporate Governance
2. Complaint management
3. Systematic risk management
4. Sustainable supplier management
5. Sustainable business growth
6. Quality of products and services
1. Measures to tackle climate change
2. Changes in water quality in water sources
3. Environmental projects
1. Human Rights and Human Resource Management
2. Personnel care and development towards sustainable water organization
3. Safety, occupational health, and working environment
4. Standards for supervision of construction projects for the community
5. Community well-being improvement projects
1. Good Corporate Governance principles
2. Complaint management
3. Systematic risk management
4. Sustainable supplier management
5. Sustainable business growth
6. Service-mindedness and product quality standards
1. Climate Change Response towards Integrated Water Management
2. Care for water quality in water sources
3. Environmental projects
1. Human Resources Management
2. Quality of life care and personnel development towards sustainable water organization
3. Knowledge sharing to society
4. Safety, occupational health, and working environment
5. Responsibilities for construction impacts
6. Community sustainability projects
General Disclosures (2-23)
Anti-Corruption (205-1, 205-2, 205-3)
Economic Performance (201-1)
General Disclosures (2-29)
Customer Health and Safety (416-1, 416-2)
Economic Performance (201-2)
Energy (302-3) Emissions (305-2)
Water and Effluents (303-1, 303-3, 303-5)
General Disclosures (2-23)
Employment (401-1)
Training And Education (404-1, 404-2, 404-3)
General Disclosures (2-25, 2-29, 2-30)
Occupational Health And Safety (403-1, 403-5, 403-9)
Local Communities (413-2)
Economic Performance (201-1, 201-3)
Indirect Economic Impacts (203-1)
Topic Group Economic Dimension Environmental Dimension Social Dimension
Customers
financial
local government
of
for business
EWG Sustainability Aspects GRI Standard Title Alignment with SDGs
Suppliers Shareholders, investors, and
institutions Communities and
agencies Board
Directors, executives, and employees Regulatory bodies and government agencies relevant
operations
Group of Stakeholders
6.1, 6.4, 6.5, 12.2, 12.3, 12.5, 13, 15.3 2.1, 2.4, 4.3, 4.4, 4.5, 5.1, 6.3, 6.6, 8.5, 8.9, 15.1, 15.2
6.3, 9.1, 9.4 12.5, 12.7, 16.5 029
ECONOMIC DIMENSION
Operational targets of Eastern Water Resources Development and Management Public Company Limited only, not include UU PCL.
Targets for 2022
Good Corporate Governance
The Company to receive CGR assessment at an
Excellent level.
The Company to continue to be in the list of THSI.
Business Growth and Quality of Products and
Services
The Company to maintain ISO 9001:2015, ISO 14001:2015 certified and to receive ISO 45001:2018 certified.
Stakeholders’ Satisfaction
to be more than
85.86%
Total net profit for 2022 compares with budget for 2022 to be higher than 5.00%.
Increase the capability of the trunk transmission main system
Aiming to develop the trunk transmission main system to accommodate an increase water demand in the eastern region and create economic stability for the country
SUSTAINABILITY REPORT 2022 030
Performance results for 2022
Good Corporate Governance
The Company was on of 170 listed companies listed in the
Thailand Sustainability Investment (THSI)
list from the SET for the 8th consecutive year.
The Company received honorary Sustainability Disclosure Award from Thaipat Institute.
Business Growth and Quality of Products
and Services (Disclosure 201-1, 201-3, 201-4, 203-1)
The Company has been certified with ISO 9001:2015, ISO 14001:2015, and ISO 45001:2018 standards
90.07%
The Company received the Outstanding Award for Sustainable Role Model Organization in the Thai Capital Market for from the Securities and Exchange Commission.
Supporting the Disabilities 2022
The Company received an Excellent rating
96.00%
from the Thai Institute of Directors (IOD)’s 2022 Corporate Governance Report of Thai Listed Companies (CGR).
Collective Action Against Corruption
The Company was 1 of 28 companies that passed the renewal of certification from the for 2021-2024 (2nd time).
The Company received a
100% score
Remarks :
from the Thai Investors Association’s quality assessment of the 2022 Annual General Meeting of Shareholders.
Revenue of 4,366,636,116 Baht1
(Sales and Service Revenue of 97.62%, Other revenue 2.38%)
Net Profit 712,812,498 Baht
Income tax to the government 189,312,273 Baht2
Increased deductible expenses 1,467,356 Baht
Community development investment
18,546,992 Baht
Operating expenses 547,546,229 Baht
Interim dividends to shareholders
0.12 Baht3
2 Refer to income tax of East Water Group for 2022
Wages and welfare for employees of the East Water Group
388,269,943 Baht
1 Consolidated financial statements of East Water Group (Detail in Annual Report 2022 (Form 56-1 One Report) Financial Statements and Separate Financial Statements topic in page 110)

3 In 2022, Interim dividends for the performance for the first half of the year was paid according to the resolution of the Board of Directors at its meeting No. 9/2022 dated 29 August 2022 at the rate of 0.12 Baht per share. The Board of Directors will submit to the Annual General Meeting of Shareholders for 2023 to approve payment of dividends for performance of July-December 2022 on 20 April 2023.
Targets for 2023
Good Corporate Governance
The Company to maintain ISO 9001:2015, ISO 14001:2015 and ISO 45001:2018 certified.
The Company to receive CGR assessment at an The Company to continue to be in the list of THSI.
Excellent level.
Business Growth and Quality of Products and Services
Total net profit for 2023 compares with budget for 2023 to be higher than 5.00%.
Stakeholders’
Stakeholders’ satisfaction score of satisfaction
85.00%
to be more than
031
GOOD CORPORATE GOVERNANCE
(Disclosure 205-2)
The Board of Directors formulated the Good Corporate Governance (CG) policy in writing in 2003, and the Company later revised the CG policy according to the Office of the Securities and Exchange Commission (SEC)’s 2017 Corporate Governance Code for Listed Companies. The Corporate Governance and Sustainable Development Committee was assigned by the Board of Directors to screen and review this group-wide CG policy and practice on an annual basis to ensure compliance with changing laws, regulations, and rules as well as recommendations by applicable institutions and international practices before submission thereof to the Board of Directors for consideration and approval.
The Company complied with its CG Code which contains 8 principles (Further details in Annual Report 2022 (Form 56-1 One Report) Good Corporate Governance topic in page 70). The East Water Group’s CG Code and Code of Conduct were published in electronic forms via the Company’s website at www.eastwater.com and Internal Web to facilitate convenience of searching. The relevant documents were also distributed to the Board of Directors and all employees for acknowledgement.
Good Corporate Governance and Anti-Corruption Promotion Activities for 2022
(Disclosure 2-17)
In 2022, the Company conducted a number of activities and enabled the access to internal and external seminars to promote the good corporate governance and anti-corruption principle for the executives and employees of the East Water Group as follows:
21 Feb. 22 23 Mar. 22 20 Apr. 22 21 Apr. 22 22 Apr. 22 6 May 22 12 May 22 Corruption Risk and Control Workshop (CRC) Online Personal Data Protection Act-Compliance (Executive Level) Labor Laws that Employers and Employees Must Know Road to Certify Final Preparation for ‘PDPA’ e-Auditing & Automation New Auditing Civil Law and Criminal Law in Labor Law 1 1 0 0 0 0 1 1 0 1 2 3 1 0 2 1 1 2 3 1 1 1 0 0 0 0 0 1 0 0 0 1 1 0 0 1 1 1 1 2 1 0 0 0 0 0 0 0 0 2 1 1 2 3 1 1 0 0 0 0 0 0 0 0 0 0 0 0 0 0 2 1 1 2 3 1 1 0 0 0 0 0 0 0 0.54 0.27 0.27 0.54 0.81 0.27 0.27 Date Course/Activity Company’s participants Subsidiaries’ participants Total participants * Percent of all employees (%) Executive (Person) Superior (Person) Operating (Person) Central (Person) Northern (Person) Eastern (People) Western (Person) Permanent employee Contract employee Employee level Region Type of employment
SUSTAINABILITY REPORT 2022 032
19 May 22 31 May 22 8-9 Jun. 22 20 Jun. 22 22 Jun. 22 1 Jul.30 Sep. 22 4 Jul.31 Aug. 22 7-8 Jul. 22 20-21 Jul. 22 3-4 Aug. 22 10 Aug. 22 15 Sep. 22 1-30 Nov. 22 4 Nov. 22 Discipline and Punishment Management Human Rights Risk Assessment HR How to Manage PDPA (Learning by Doing) Principles and Roles of Comprehensive Human Rights Audit for Executives New Normal Management of Wage, Remuneration, and Benefits Human Rights Knowledge (Course in accordance with the Company’s business policy) Company Secretary Professional Development Program Interesting Supreme Court Ruling on Personnel Management Fraud Risk Management Framework Labor Cases and Good Management Lessons Learned on Personal Data Protection Act B.E. 2562 for HR Labor Laws for Human Resource Department Regulations of the Federation of Accounting Professions on Professional Ethics (E-Learning) Hot Issues in Law and Labor Cases 2022 2 39 1 13 5 136 1 2 1 1 2 0 1 1 0 0 0 0 0 0 0 0 0 0 0 2 0 0 2 39 1 13 5 136 1 2 1 1 2 2 1 1 0 1 0 13 0 10 0 0 0 0 0 0 1 1 0 28 0 0 2 17 1 1 0 0 0 0 0 0 2 10 1 0 3 109 0 1 1 1 2 2 0 0 0 0 0 0 0 1 0 0 0 0 0 0 0 0 2 30 1 10 5 80 1 2 1 1 2 2 1 1 0 9 0 3 0 55 0 0 0 0 0 0 0 0 0 0 0 0 0 0 0 0 0 0 0 0 0 0 2 39 1 12 5 135 1 2 1 1 2 2 1 1 0 0 0 1 0 1 0 0 0 0 0 0 0 0 0.54 10.48 0.27 3.49 1.34 36.56 0.27 0.54 0.27 0.27 0.54 0.54 0.27 0.27 Date Course/Activity Company’s participants Subsidiaries’ participants Total participants * Percent of all employees (%) Executive (Person) Superior (Person) Operating (Person) Central (Person) Northern (Person) Eastern (People) Western (Person) Permanent employee Contract employee Employee level Region Type of employment 033
To ensure that all the employees had knowledge and understanding regarding the East Water Group’s code of conduct and the anti-corruption policy, the Company has organized online training and tests to measure the level of knowledge and understanding of all employees and to improve communication and raise awareness of their duties in working ethically and transparently leading to sustainable business operations.
In addition, the Company has measures in place to protect the complainant or those who cooperate or assist in the investigation with good faith. The Company may consider the merits of the employee who gives the whistleblowing beneficial to the Company’s operations. When there is any clues or complaints through various channels, the collector and executor will submit the matter to the Secretary of the Audit Committee. If the complaint is an anonymous card and does not specify clear information, the Company may consider it as deemed appropriate. If there is a basis, an investigation and disciplinary committee will be appointed. If found guilty, disciplinary action will be taken in accordance with work rules. Legal action will be taken in case of violation of laws.
In 2022, the Company received reports of complaints and whistleblowing or finding of any corruption or violation of rights or committing an unlawful act or violation of the East Water Group code of conduct or lack of good internal control which could be summarized as follows: (Disclosure 205-3)


1-30 Dec. 22 21 Dec. 22 29 Dec. 22 Code of Conduct and Anti-Corruption Labor Law for Superior Research Ethics in Human 230 0 0 142 46 1 372 46 1 27 7 0 53 13 1 287 26 0 1 0 0 195 22 1 170 20 0 6 0 0 370 46 1 2 0 0 100 12.37 0.27 Remark : *Total number of East Water Group’s employees was 372 people, divided into 230 Company’s employees and 142 Subsidiaries’ employees.
Date Course/Activity Company’s participants Subsidiaries’ participants Total participants * Percent of all employees (%) Executive (Person) Superior (Person) Operating (Person) Central (Person) Northern (Person) Eastern (People) Western (Person) Permanent employee Contract employee Employee level Region Type of employment Test : East Water Group code of conduct Test : Anti - Corruption Target: 100% Target: 100% Number of participating employees (Person) : 372 Number of participating employees (Person) : 372 Qualifying Percentage : 100 Qualifying Percentage : 100 Violation of human rights and labor Corruption Violation of the code of conduct for procurement 2022 (Issue) : 2 Percentage : 28.57 2022 (Issue) : 2 Percentage : 28.57 2022 (Issue) : 3 Percentage : 42.86 Violation of East Water Group code of conduct 7 Issue Total Matter examined and found to be guilty Consideration completed 2022 (Issue) : 5 2022 (Issue) : 0 Percentage : 71.43 Percentage : 0 Under consideration at the end of 2022 at the end of 2022 2022 (Issue) : 2 Percentage : 28.57 SUSTAINABILITY REPORT 2022 034
As the end of 2022, the investigation and disciplinary committee has considered 7 issues and found that 5 issues had no basis for complaint. Other 2 issues were under consideration. (Further details in Annual report 2022 (Form 56-1 One Report) Whistleblowing topic in page 99)
However, the Company has procedures in place to prevent repeated violation of the East Water Group code of conduct as follows
• Communicate knowledge of group-wide code of conduct through E-mail and official Line group,
• Conduct group-wide code of conduct training to employees
• Tested employees’ knowledge and understanding
Review the policies and practices of good corporate governance, internal anti-corruption, and employees’ code of conduct to be up to date at least once a year, by comparing with laws, international practices, and leading companies as well as recommendations of institutions. In case of amendments, it will be submitted to the Corporate Governance and Sustainable Development Committee for screening before submitting to the Board of Directors for approval.
The Internal Audit Office adopts CAC’s anti-corruption self-assessment form to audit the work processes of all departments such as procurement, construction, permit applications, accounting, and finance, etc., to ensure compliance with such measures.
• Study and analyze the results of test of employees’ knowledge and understanding to improve communication and raise awareness as well as to improve the group-wide code of conduct.
• Study and analyze complaints and issues detected by the Internal Audit Office to determine the case and lead to the establishment of measures or actions to prevent recurrence, as well as to further develop and improve the group-wide code of conduct.
2. Monitor and Audit by the Company’s Internal Audit Office
4. Develop and Improve the group-wide code of conduct
1. Communicate and raise awareness among employees
035
3. Study and Analysis
COMPLAINT MANAGEMENT
(Disclosure 2-16, 2-25, 2-26)
The Company values the feedback of stakeholders throughout its supply chain. It has put in place complaint handling process for its stakeholder by establishing a unit responsible for handling various complaints received from various channels as well as to have systematic complaint handling mechanism to reduce business risk. This is to demonstrate the Company’s commitment to corporate social responsibility, transparent business operations, and promotion of good relationships with its stakeholders. The Company also applied the lesson learned to drive business operations towards sustainable organizational development.
Complaint Channels
Key Stakeholders
1. The Company’s website: www.eastwater.com
2. The Company’s internal web: The system for receiving suggestions, whistleblowing, and complaints.
3. E-mails: Audit Committee : AC_EW@eastwater.com President & CEO : CEO@eastwater.com Company Secretary : Whistleblowing@eastwater.com
4. Regular mails: Eastern Water Resources Development and Management Pcl. East Water Building, 25th Floor, 1 Soi Vibhavadi Rangsit 5, Vibhavadi Rangsit Road, Chom Phon Subdistrict, Chatuchak District, Bangkok 10900
5. Line Official Account (Eastwater CSR)
6. The Company’s Facebook page: (@eastwfanpage)
group
Remarks :
* Further details available under Measures to prevent customer complaints (raw water) in page 50
** Further details available under Measures to prevent cusomter complaints (tap water) in page 53
*** Further details availabe in Annual Report 2022 (Form 56-1 One Report) under Whistleblowing topic in page 99
Subsidiaries’ customers Shareholders and investors Suppliers Board of Directors, executives, and employees Communities and local government agencies Company’s customers Regulatory bodies and government agencies relevant for business operations
Complaint Channels
Number of complaints Number of complaints that have been resolved Number of pending complaints Measures to prevent recurrence (completed) Measures to prevent recurrence (ongoing) 1* 1 0 1 0 20,246** 20,246 0 1 0 0 0 0 0 0 0 0 0 0 0 0 0 0 0 0 0 0 0 0 0 7*** 5 2 1 0
7. Line
8. Hotline or Call Center 9. Comment Boxes in Bangkok and Rayong Offices 10. Meetings or relations activities
SUSTAINABILITY REPORT 2022 036
The Company’s Customers (raw
Subsidiaries’ Customers (tap water)
Complaint Handling Process Request additional information
water)
Complainant The water users file complaint via different channels Account Executive (AE) The relevant office or system opens a job in the UMW APP Resolve the complaint The assigned team gets back to the water user Keep complaint log - Complaint details - Contact information Assess the resul The technician team conducts repairs and solves the problem Not Pass Pass Prepare a summary report The technician team closes a job in the UMW APP A summary report is prepared The report is sent to the management for acknowledgement Report to the management The external agency conducts an afterservice customer satisfaction survey 037
The Company’s
Projects


Construction
Report the results Complaint filing channels - E-mail - Website - Social Media - Mail/letter Follow up the action progress at the office’s meeting Not Pass Overdue Monitor the progress of the corrective and remedial actions Make a copy to a relevant Chief Officer Collect Data Provide summary reports - Monthly report (executive) - Annual report to the CGSD Committee Complainant Record a complaint Relevant function Discussion meeting with the contractors Take actions Inspect/ follow-up Pass Report to a relevant party Collect data/seek solutions to prevent a repeated mistake Provide the Construction Management Department’s monthly summary report SUSTAINABILITY REPORT 2022 038
Human Rights
Report back to the complainant within 3 days from the date of receipt of the complaint.
The complainant submits a complaint.
Channels
1. The Company’s website www.eastwater.com
2. Internal Web
3. E-mail
- Audit Committee: AC_EWeastwater.com
Complaint recipients initially analyze and screen complaints.
Coordinate with the department responsible for taking care of the stakeholder groups and notify the management.
The unit responsible for stakeholder groups considers complaints.
Note : The duration depends on the complaints of the stakeholder groups.
Result
- President & CEO: CEO@eastwater.com
- Company Secretary: Whistleblowing@eastwater.com

4. Post mail
5. Line Official Account (Eastwater CSR)
6. The Company’s Facebook page
7. Hotline or Call Center
8. Comment box in Bangkok and Rayong Office
9. Meeting or relations activities
Consider compensation for damages
Consider remedies as appropriate
Stakeholder groups
Shareholders
Investors / Financial Institute
Raw water/ total water solution customers
Communities
Government agencies
Suppliers / tenants
Employees
- Notify the complainant of the result of consideration, including compensation for damages/remedies as appropriate
- Submit a summary report to the executives for their acknowledgment.
- Submit a summary report to the secretary of the Audit Committee and secretary of the Corporate Governance and Sustainable Development Committee to report to the Audit Committee and the Corporate Governance and Sustainable Development Committee for acknowledgement.
Remark : Human rights complaints such as complaints about labor rights, community rights, suppliers’ rights, shareholders’ rights, investors’ rights, financial institutions’ rights, customers’ rights, complaints about natural resources and the environment, etc.
Guilty Not guilty
039
SYSTEMATIC RISK MANAGEMENT
Enterprise risk management (ERM) is a policy to manage and supervise an organization to achieve efficiency. ERM enables analyzing and anticipating potential events or risks from internal and external factors that may arise. Thus operational priorities, preventive and corrective measures, and management guidelines can be identified to improve efficiency of decision-making process, hence better operating results and mitigated chances or consequences of such risks. Moreover, opportunities amid crises are assessed for the Company’s sustainable growth. The Company determines risk management strategies and systems that are aligned with the quality management system standards. In doing so, the Company is required to understand its context, objectives, as well as shareholders’ expectations for assessing risks and business opportunities.
As part of the ERM practice, the Company developed its Business Continuity Management (BCM) by laying down a holistic management system covering crisis management plan, crisis communication plan, and business continuity plan connecting all agencies across the organization.
Risk Management Structure
Risk management structure involves the creation of a control project based on consideration of relationships between different resources, work processes, and internal management procedure. The scope, duties and responsibilities are defined as follows:
Risk Management Committee (RMC) Management Team
Risk Management and Quality System Division, Corporate Strategy Department Risk coordinators of all departments
Internal Audit Office
SUSTAINABILITY REPORT 2022 040
Board of Directors
Risk Management Committee
• To formulate and review a corporate risk management policy in all aspects one a year to ensure alignment with the corporate objectives, main goals, and strategies.
• To supervise and support risk management as part of a corporate culture.
• To regularly monitor and assess the impact and likelihood of identified risks in order to prioritize and manage such risks appropriately.
Management Team
• To promote and monitor risk management to ensure efficiency and suitability.
• To consider, endorse, and approve risk management plans.
• To consider risk management results and suggest guidelines for improvement.
Risk Management and Quality System Division, Corporate Strategy Department
• To provide a standardized risk management system and process throughout the organization.
• To implement the risk management process and comply with risk control measures
• To report and monitor results of key risk management plan implementation to the management for consideration
• To communicate and advise on risk management and provide suggestions regarding procedure and method of risk management to enable well-informed decision-making regarding risk management and an understanding about the necessities and scope of work; and to support exchange of data between relevant parties for a common understanding of concepts, principles, and practices for efficient risk analysis and management.
Risk Owners and All Employees
• To provide relevant data support to the Risk Management Working Group
• To cooperate in the implementation of the risk management plan
• To participate in determining risk management methods and its implementation
• To manage risk items within desirable level and scope while providing risk assessments and reviews at appropriate intervals and as necessary
• To analyze the progress of the action plan implementation
• To comply with the guidelines of the internal control system in the relevant tasks
The Company required risk identification to cover 6 types of risks, namely 1. Strategic Risk, 2. Operational Risk, 3. Financial Risk, 4. Compliance Risk, 5. Environmental, Social, and Community Risk, and 6. Information Technology Risk. In 2022, the Company specified risk factors and risk management guidelines in Annual Report 2022 (56-1 One Report) (Further details are available in Annual Report 2022 (56-1 One Report) under Risk Management topic in page 48 and Internal Control topic in page 101 (Disclosure 205-1)
041
SUSTAINABLE SUPPLIER MANAGEMENT
The East Water Group supply chain supplier management guidelines were implemented with a focus on the suppliers’ capacity building to share sustainable growth with the East Water Group. The Company was committed to its procurement regulations and practices and the supplier code of conduct while taking into consideration sustainability issues. This was to express the East Water Group’s determination to sustainability, to provide a norm for the group-wide procurement process, and to strengthen relationships with the suppliers. The Company held several activities to promote the engagement with its suppliers every year.
The East Water Group attaches great importance to choosing the right supplier with the commitment that was in line with the principles of responsible operations. This is to ensure that the Group purchases responsible products and services while encouraging suppliers and business partners to uphold and comply with our commitment to fundamental rights. For the treatment of employees, there shall be no forced labor and child labor, no involvement in human trafficking, and provide good working conditions with a focus on safety and occupational health. They shall also manage pollution risk and environmental impacts. We believe that these principles are fundamental to gaining social acceptance which impacts sustainability. They are tools to drive action through participation and transparency.
EWG Supplier & Tenant Day 2022
The East Water Group is committed to raising awareness of human rights policy to create understanding of human rights for suppliers, tenants, and all employees of the Group, and preventing human rights violations of all stakeholders from their business operations throughout the supply chain. The EWG Supplier & Tenant Day was held under the theme of “ESG: Business and Human Rights in Supply Chains” covered international standards in respect of human rights, guidelines for preventing human rights violation, and human rights risk assessment. Mr. Anantachai Yoonprathom, a lecturer from SBDI have shared knowledge and answered the queries. A total of 106 people from suppliers, tenants, and employees participated through Virtual Conference system.
(Disclosure 205-2) Procurement Regulations Procurement Practices Supplier Code of Conduct
SUSTAINABILITY REPORT 2022 042
Respect for human rights
Respecting human rights is an opportunity to change everyone’s lives.
Confiscated passport

Exploitation
Water pollution
Forced labor
Sexism
Child labor
Health and safety
Freedom of expression
Excessive use of force
Underpaid wages
Assault
Discrimination
Involvement and accepting differences
Human dignity
Freedom of movement and travel
Personal data breach
Unsafe working conditions
Freedom of association

Privacy
Child rights
Fair wages
Community involvement
Mutual respect
Fair trial process
Delegation of decision building potential
Gender equality

043
SUSTAINABLE BUSINESS GROWTH
(Disclosure 203-2)
The COVID-19 pandemic caused the disruption in the industrial production chain. This was an important impetus for entrepreneurs to diversify their production bases in many countries that were close to the production site, thus reducing the complexity and distance of the production site closer to the country of the entrepreneur. As a result, the global value chain tends to be shorter and more dispersed. Based on the forecast of the nature of the global value chain, over the next 5 years, the Thai industrial sector will become more involved in the global value chain, and most of them will remain in the downstream industries due to their higher competitiveness, whether food and beverage industry, and computer and electronics industry. In addition, the government has a policy to promote and push the eastern seaboard area to be an advanced industrial production center to enhance the competitiveness of the Thai industrial sector through the establishment of the Eastern Economic Corridor (EEC)
China’s announcement of Zero-COVID measures has caused some customers to postpone business expansion plans and delay the start of commercial water intake with the Company, including importing machinery for production. As a result, projects are delayed. However, there are still some customers who are still expanding their business due to the demand of certain types of products both domestically and internationally, such as electronic components, automotive, and food, etc. As a result of these impacts,
the Company’s business operations slowed down slightly compared to the Company’s original forecast.
The fluctuation of raw material and energy prices from the energy price crisis was another factor that affect the cost of energy such as oil and natural gas. This has affected the cost of electricity generation in the country. In the second half of 2022, the government increased the price of electricity in the industrial sector. At the beginning of 2023, it affected the overall cost of the entire industry and affected the Company’s cost which was the main cost of the business.
From the economic impact on the industrial sector, the Company has sought ways to work with its suppliers so that they could continue to operate their business together such as modification of agreements and joint action plans, study of technology to reduce the production cost, etc., to support growth during economic volatility.
At present, the Company is committed to providing a comprehensive total water business service to efficiently utilize limited resources; reduce energy consumption, non-revenue water, and administrative cost; and be environmentally friendly, which has been providing services to customers for more than 5 years.
The Company expects that the implementation of this project will add water source to the Eastern Economic Corridor (EEC) which is the main area to drive the economy in the industrial sector of Thailand.
In 2022, the Company began providing industrial water services in Chachoengsao and Rayong area with the total maximum production capacity of 104,000 cubic meter per day.
4,051,351.85
31,830.35
Industrial Water Business Chachoengsao Rayong Volume of influent to the production system (cubic meter) *Commercial water supply commenced on
of effluent (cubic meter)
of water loss (cubic meter) *Water from cleaning the system will be recycled. Volume of influent to the production system (cubic meter) Volume of effluent (cubic meter) Volume of water loss (cubic meter) *Water from cleaning the system will be recycled. 540,026.80 538,227.80 1,799.00
1 June 2022 Volume
Volume
4,083,182.20
SUSTAINABILITY REPORT 2022 044
Wastewater Treatment and Recycled Water Business
(Disclosure 303-2, 303-3, 303-4, 303-5:2018, 306-1)
In respect of the wastewater treatment and recycled water business, the East Water Group will choose wastewater treatment and water recycling methods that are suitable for the characteristics of the water entering the system. The treated water quality will be in accordance with the standards stipulated in the contract and the standards for controlling sewerage from industrial and industrial estates according to the notification of the Ministry of Science, Technology, and Environment.
In 2022, the East Water Group operated in 3 areas. In Rayong province, wastewater treatment is carried out by Sequencing Batch Reactor process, with 240,520.00 cubic meters of wastewater entering the system per year. The treated water is stored in the polishing pond, which is not released into the public water sources. In the other 2 areas, treated wastewater is reused in other appropriate industrial activities. Details are as follows:
* Calculate water intake from the efficiency of the wastewater treatment system (water loss in the system 1.22%)
Wastewater Treatment Process Influent from Factory Effluent Collecting Sump Grit Chamber EQ Tank Pond SBR Tank Aeration Pond Chemical Adjust Sludge Drain to Collection Tank Influent from Factory Recycle Static Mixer Clarifier Tank Filter Process Treated Water Tank Chemical Mixing Sludge Drain to Lagoon SBR Treatment System Clarified/Sand Filter Treatment System Ratchaburi Ayutthaya Volume of wastewater influent (cubic meter) Volume of effluent for recycling (cubic meter)
water sent back to the factory for use Water loss (cubic meter) Volume
(cubic meter)
*Recycled
of wastewater influent
Volume of effluent for recycling (cubic meter) * Recycled water sent back to the factory for use Volume of water loss (cubic meter) 141,500.00 125,396.00 16,104.00 815,297.86 805,327.00 9,970.86 045
Projection
of Water Demand categorized by service groupz
Remark : This information is the customer’s future water demand projection, which may change according to the customer’s investment plan
Projection of water demand for tap water and industrial water, and volume of wastewater treatment and recycled water categorized by area
Proportion of water demand for wastewater treatment, and recycled water by area (between 2023-2027)
Remark : This information is the customer’s future water demand projection, which may change according to the customer’s investment plan
Projection of income growth from total water solution business
Remark : This is a projection of future operating results, which may change according to the customers’ water usage plan
35.00 25.00 500.00 15.00 300.00 5.00 100.00 30.00 600.00 Water Volume (Million Cubic Meter) Million Baht 20.00 400.00 10.00 200.00 0.00 0.00 2022 4.97 15.48 31.53 32.99 33.78 0.77 1.50 3.84 3.83 4.02 2023 2024 2025 2026 2027 Tap water/ Industrial water Wastewater treatment/ Recycled water 33.78 4.02 Rayong area Pluak Daeng – Bo Win area Chachoengsao area Outside eastern region Year (AD) Year (AD)
Industrial water
area (between 2023-2027)
Proportion of water demand for tap water, and
by
17% 27% 23% 73% 60% 2022 2023 2024 2025 2026 2027 78.42 239.65 492.22 513.97 526.77 526.77 SUSTAINABILITY REPORT 2022 046
SERVICE-MINDEDNESS AND PRODUCT QUALITY STANDARDS
Raw Water Business Segment Service areas, customer groups, and distribution channels of raw water
The Company is the largest entrepreneur engaged in the development of water pipeline system and the distribution and sale of raw water to the water users in the industrial and consumer sectors in the eastern seaboard area. Its strengths include the water grid and pumping systems connecting major water sources in the eastern region that are complete, modern, efficient, and covered 3 eastern seaboard provinces namely Rayong, Chon Buri, and Chachoengsao. Moreover, it is sustainable to deliver water sufficiently to meet the demands of local entrepreneurs at present and in the future.
In 2022, the Company’s raw water sales volume amounted to 263.69 million cubic meters, including 0.06 million cubic meters of partial raw water sale in December 2021, totaling of 263.75 million cubic meters. (Based on 2022 raw water usage bill). By considering the proportion of purchase, the overall volume decreased by 11.49% compared to the previous year. The decline in sales was due to the high rainfall in 2022, allowing some water users to store large quantity of rainwater. This included the impact of COVID-19 pandemic on the industrial sector that is still recovering but not the same as original production level, and the tourism sector which despite the trend of rising, is still below pre-pandemic level. Based on the Company’s analysis, the direction and trend of raw water service business in the eastern seaboard area in the future still has growth opportunity due to the main factor of industrial expansion in the area. Furthermore, the government has a policy to promote and transform the area in the 3 provinces namely Rayong, Chon Buri, and Chachoengsao to be an advanced industrial hub for Thailand’s industrial sector’s enhanced competitiveness through an establishment of an Eastern Economic Corridor (EEC). As for its competitiveness, the Company is considered a well-established market player with the wealth of investments, secure water sources, and comprehensive water grid system covering the area as mentioned above.
In 2022, the overall proportion of raw water distribution by service area was as follows:
54% 17% 15% 5% 9% Proportion of raw water distribution by service area Map Ta Phut area Ban Chang and Sattahip area Chachoengsao area Pluak Daeng - Bo Win area Chon Buri area 54.00% 9.00% 5.00% 15.00% 17.00%
047
In running its business, the Company realized the importance of its customers’ expectation. In addition to conducting a field survey of customer satisfaction and listening to complaints, the Company also organized customer meetings annually to exchange ideas and opinions which was beneficial for service improvement, and to create understanding and confidence to customer continuously.
In 2022, the Company held meetings with its key customers as follows:
Activity Target Group
• Existing Customers
• Customers in industrial estate (End Users)
Project Objectives/Details
1. To introduce the Company to water users especially new customers or water users who are interested in visiting the Company to study and have insight in overall picture of Company such as pumping, services, water management, future project investment, and various risk prevention measures.
2. To use cultural occasions to build good relationships to show care and consideration for water users, affecting emotional values and collective actions.

3. To express gratitude through a form of social gatherings according to the priority of water users and to have a festive opportunity to communicate information that was important issues according to the agenda, such as clarifying investments or
Outcome Summary
1. Welcoming 3 groups of delegates from government agencies
2. Visiting on New Year Festival, Chinese New Year Festival, Songkran Festival, Mid-Autumn Festival.
3. Running activities at Thab Ma raw water pond for SCCG group employees; Walking, running, and tree planting activities of WHA group; 30 Years of East Water activities: returning the green forest and sustainable youth development; “Where do you love East Water? Bring the pen to circle it” activities; “EW Virtual Run” activities; Bowling activities for 2022 among water users with an average overall satisfaction score of 93.40%.
1. Company Visit
2. Festival/ Occasion events
3. Entertain & Lifestyle activities
SUSTAINABILITY REPORT 2022 048
Customer Satisfaction Management (Disclosure 416-1)
The Company continued to live up to its corporate values of service-mindedness and keeping customer satisfaction scores at required levels through constantly improving customer services and listening to complaints and the voice of customers via various channels including telephones, E-mail, the Company’s website, sit visits on important occasions, and annual satisfaction surveys. The Company gathered all the feedback for analysis and consideration at the meetings of the Operation & Customer Service Department as well as the management meetings in order to design plans to continuously improve services to meet specific needs of each customer group.
1. Focus on water resource management and quality of service; Future expansion of water pipelines
2. Excellent service with service-mindedness; Pricing improvement for enhanced competitiveness
3. Relations activities between business entities and customers
1. The Company managed water sources, both main and reserve water sources, to cover water demand of customers, in both normal and extreme cases; including investment project to develop water sources to increase amount of water in the system such as Khlong Luang – Chon Buri raw water pipeline construction project, project to improve efficiency of pipeline from RayongChon Buri area, and Map Ta Phut – Sattahip pipeline construction project to increase capacity of water distribution from Map Ta Phut area to Sattahip area which increase from 29 million cubic meter per year to 79 million cubic meter per year.
2. The Company was aware of the impact on water users both in terms of maintaining stability of the distribution to be continual and enough to meet demand, including determination of suitable selling price to reflect cost and not be a burden to users. At present, the raw water tariff the Company determines and collects from users in each sector is the price rate that directly reflects the investment cost of the project to enhance the efficiency of distribution including the cost of pumping management to distribute water to users continually and sufficient for their demand throughout the past period. However, in the past year, the Company considered maintaining the water tariff and postponed the use of water tariff adjustment formula for 2 years to relief the burden and reduce impact on users and entrepreneurs due to the current economic situation where costs have increased with a major cause from war, Russia-Ukraine conflicts, and COVID-19 pandemic. There was improvement of installation model to be expansion of service area to reduce investment burden and maintenance cost of water pipeline system for customers.
3. The Company organized relations activities between business entities and customers to continuously build relationship with customers, such as “Where do you love East Water? Bring the pen to circle it” activities; “EW Virtual Run” activities; Running activities at Thab Ma raw water pond for SCCG group employees; Walking, running, and tree planting activities of WHA group; 30 Years of East Water activities: returning the green forest and sustainable youth development; Bowling activities for 2022; Bowling competition activities to build relationships with operational customers, both industrial estate customers and consumer groups.
Expectations and recommendations (2021 customer satisfaction survey)
results for 2022 049
Performance
(For further details regarding the satisfaction level for each topic for 2020-2022, please refer to Annex in page 108)
According to the 2022 customer satisfaction survey, the overall satisfaction level increased by 0.04 point or 0.88% compared to the previous year. It was found that “service provision topic” had the highest average satisfaction, followed by “Water distribution and control room service topic”, from which the topic resulted in the higher score. The Company and related parties are highly aware of maintaining the satisfaction level and focusing on improving the service to increase and maintain the level of satisfaction continuously. In 2023, the Company has a project to increase communication channels through Line OA to increase the ability to communicate with the desired target group more clearly and quickly.
1. To improve water quality
2. To update information quicker/ notify information quicker such as details, water management, water quality, water situation.
3. To improve the delayed maintenance time
1. Currently the Company collects water quality samples from the point of origin before distributing water to respond to users’ expectation. There is an improvement by collecting more water quality samples at points along the pipeline for quality control. If there is a change in water quality, the customer can be notified so that the system can be adjusted in time.
2. Line OA is a project to increase communication channels to build relationships between customers with the goal of increasing the ability to communicate more clearly and quickly with the desired target group.
3. The Company will collect statistical data for pipe repair as well as evaluate and plan repairs to manage time to repair and restore the system without affecting the customers’ water intake.
Complaint Preventive Measures (Raw Water) (Disclosure 416-2)
In 2022, the Company received one complaint from customer regarding the decrease in the amount of raw water received without warning. This resulted in the risk of insufficient water production. From this incident, the Company quickly took corrective action and was ready to distribute water normally on the day of the incident. The Company also set up corrective and preventive measures to inform water users as follows:
1. In case there is a change in water source, or it is expected that any action will affect the delivery of water, the Company will send a written notice at least 7 days in advance.
2. In case of urgent need or emergency that affects water distribution, the Company will notify via SMS or Line OA group.
5.00 4.00 3.00 2.00 0.00 1.00 3.99 4.50 4.54 Overall Customer Satisfaction Score: 2020-2022 2020 2021 2022
Expectations and recommendations (2022 customer satisfaction survey)
Year (AD) SUSTAINABILITY REPORT 2022 050
Operational Plan for 2023
Total Water Solution Business Segment (Industrial water, wastewater treatment, and recycled water) (Disclosure 416-1)
From the vision of the Company to be the leader in ensuring security of the country’s comprehensive water resource management and development through smart technology to continuously support the country’s economic growth, the Company has developed from the water source to wastewater management to meet the quality required by law before releasing to natural water sources, including the development of recycled water system to maximize the water use with optimum benefit.
For more than 5 years, the Company has provided services to 7 customers with total water solution service. They are total water solution business segment who trusted the Company to take care of, whether it is receiving of industrial water, wastewater treatment, to recycling water to reuse water in the customers’ industrial processes.
According to the 2022 satisfaction survey results, the overall service of total water solution business segment was satisfied with an average score of 4.57 points, an increase of 0.06 % from 2021. Compared to 2020 which was the first year that the Company has officially started the total water solution business with the average score of 3.30 points, it was found that the satisfaction increased by 39.00% as shown in the picture.
According to the 2022 satisfaction survey, it was found that customers of total water solution segment were most satisfied with information provided by the Company, whether it was the convenience of contacting the Company through various channels, including the Company’s website (www.eastwater.com), E-mail, telephone, or Line to exchange information and contact for inquiries quickly and easily.
(For further details regarding the satisfaction level for each topic for 2020-2022, please refer to Annex in page 109)
In terms of survey of expectation from total water solution, it was found that 57.14 % of the sample group who assessed satisfaction from the Company’s service at “Better than expected” level with 3 areas that received the same score namely service quality for water distribution and control room which the Company has notified the customers in advance when there was abnormality with the total water solution system which might affect customers’ water intake; East Water’s service staff who provided service with speed and enthusiasm in providing service and helping customers to the best of their abilities; and responding to the customers’ demand with the view that East Water paid attention and placed importance on customers’ demand.
(2022 customer satisfaction survey) Operational Plan for
1. To organize activities to strengthen relationships to get more familiar with each other.
2. To meet and discuss future available services
3. To increase industrial water service
4. To improve overall response to customers’ demand.
1. To increase activities to strengthen relationships among total water solution segment such as to have a meeting to discuss and follow up joint operational issues continuously in order to develop processes and provide total water solution to respond to the demand of each customer group thoroughly with customized service.
2. To jointly create operational process for long-term sustainability.
Expectations and recommendations
Overall Satisfaction Score for 2020-2022 5.00 4.00 3.00 2.00 0.00 1.00 2020 2021 2022 3.30 4.51 4.57 Year (AD) 051
2023
Tap Water Business Segment (Disclosure 416-1)

The subsidiaries designed tap water production system appropriate to different locations. Designs and construction plans were based on levels of water demand and raw water quality so as to choose appropriate tap water production systems and ensure that tap water products met specific quality standards as follows:
Conventional Water Treatment Plant


Mobile Plant Advanced Water Treatment Plant with Ultra-Filtration (UF) and Reverse Osmosis (RO) filters using Membrane technology in tap water filtering process

 Hua Ro
Lakchai Muangyang
Rayong
Bang Pakong Bo Win
Chachoengsao
Ratchaburi Nakhon Sawan Sattahip
Nong Kham Chon Buri
Bo Win Sattahip
Hua Ro
Lakchai Muangyang
Rayong
Bang Pakong Bo Win
Chachoengsao
Ratchaburi Nakhon Sawan Sattahip
Nong Kham Chon Buri
Bo Win Sattahip
1 2 3
Water Quality Control of Thai Industrial Standards (TIS)
Table: Summary of Tap Water Production System in Waterworks entities
SUSTAINABILITY REPORT 2022 052
Provincial Waterworks Authority Water Quality Standard
According to the annual tap water user satisfaction survey, another issue that captured attention of the tap water users was the quality of tap water, especially in terms of cleanliness, clarity, and sedimentation. This was because turbidity and clarity of tap water were physical characteristics easily observed by the water users. Therefore, the subsidiaries adopted a management approach to handle risks of substandard water quality which was divided into 2 parts as follows:
• Production System – The employee controlling the production system would monitor turbidity value of raw water consistently and use an automated chemical dispenser device. In the case of a high turbidity value of raw water due to a high-water season or a dry season where a turbidity value the exceed a standard level that could be handled by the production system, the controller would decrease the production capacity such that the turbidity value met the specified quality criteria.
• Water Distribution Pipeline System – To maintain consistent quality of water in the pipeline according to standard requirements, the Company planned removing sediments according to scheduled times or upon detection of a high value of turbidity probably caused by pipeline repair works or sediments deposited inside the pipeline. Also, the Company developed an automated water release system by installing as many sediment release points as possible in the water distribution pipeline system in order to better control turbidity values of tap water in the pipeline.
As quality of services was one of the top priorities of the subsidiaries, a third-party agency was hired to conduct customer satisfaction surveys with tap water users on an annual basis. The opinion and recommendations gathered from the tap water users were used as guidelines for further improvement of the quality of services in all aspects to achieve greater efficiency.
Overall Satisfaction Score for 2020-2022
According to the 2022 customer satisfaction survey, the satisfaction level went up compared to that of 2021. The average satisfaction level of the past 3 years was 4.69. The subsidiaries realized the importance of maintaining the satisfaction level and were committed to constantly improving data provision services
(Please refer to the details of the satisfaction level for each aspect for 2020-2022 in Annex in page 109)
Complaint Preventive Measures (Tap Water) (Disclosure 416-2)
In 2022, the complaint handling for tap water business segment has been improved and provided services to tap water users in total of 20,246 transactions where all of them have been completely resolved according to the UU Service Level Agreement (UU SLA) to ensure customers’ maximum satisfaction.
Complaints about broken pipes and pipe leaks have been several times. The road construction resulted in drilling in the area along the water pipeline. The subsidiaries have assigned the operating area to coordinate with the supervisor and contractor to notify the water pipe line to reduce the impact from the road expansion construction, and regularly coordinate with the construction foreman in the area near the water distribution pipeline.
5.00 4.00 3.00 2.00 0.00 1.00 2022 4.73 2021 4.71 2020 4.62 Year (AD) 053
SUSTAINABILITY REPORT 2022 054
ENVIRONMENTAL DIMENSION
Operational targets of Eastern Water Resources Development and Management Public Company Limited only, not include UU PCL.
Targets for 2022
Water % NRW
Non-Revenue Water (NRW) control:
less than 2.50
Reduce raw water cost
by more than 2.00% compared to 2021 budget
Comply with regulations, rules and environmental laws related to business operation Control
emissions in various fields to meet the standards
Cultivate awareness, separate waste before disposal
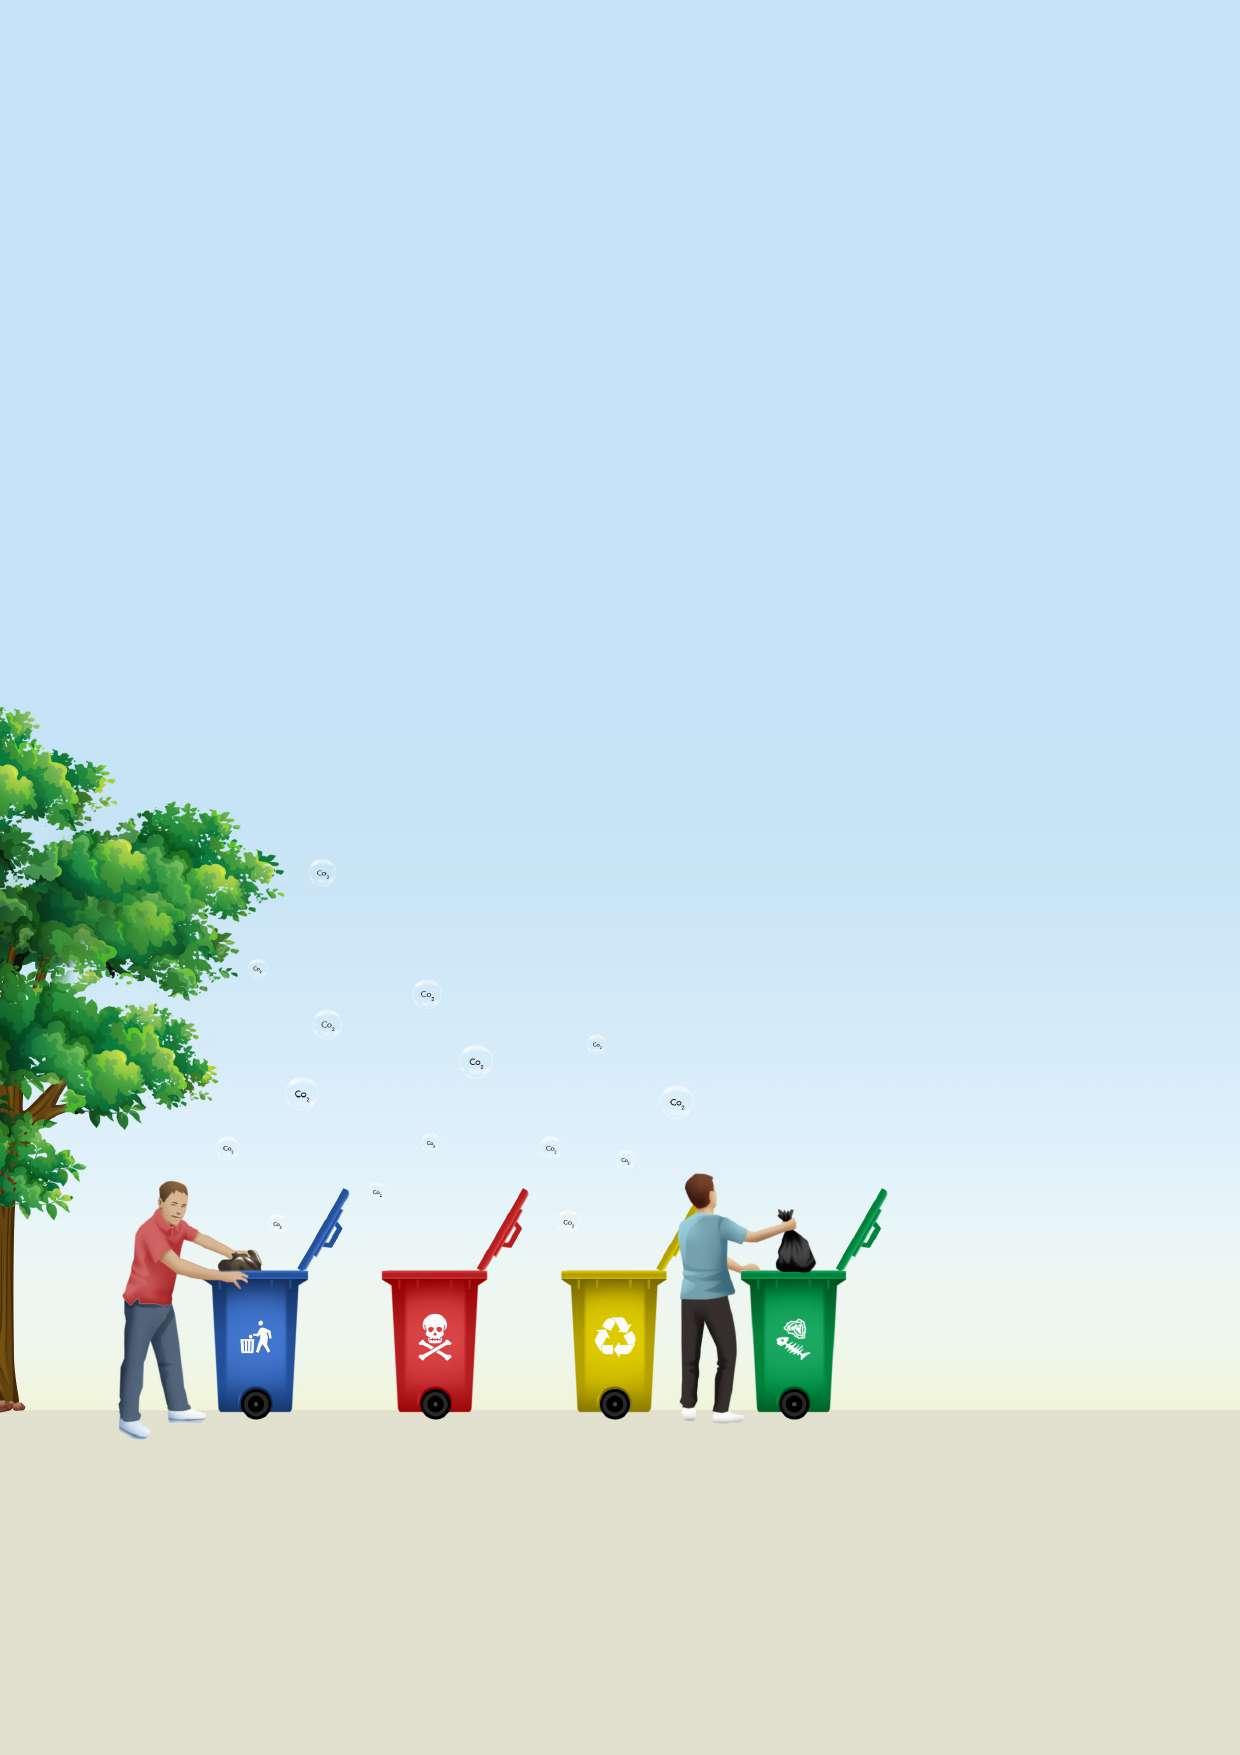
Be a part in reducing greenhouse gases every day. Eliminate the main causes of global warming, separate waste properly aspect Energy aspect
Other aspects (General waste, hazardous waste, air pollution, natural resource)
Performance results for 2022
Water aspect
NRW Control:
%NRW equals 1.69
Energy aspect
Other aspects (General waste, hazardous waste, air pollution, natural resource)
Amount of recycled waste
in East Water building was
6,833.50
kg,
representing 19.01% of total waste.
Water aspect
per unit of pumped water was
0.41
Electrical energy KWh/m3,
8.82% decrease from 2021
Targets for 2023
Reduce %NRW to be
less than 2.50
Amount of recycled water inside East Water Building at
10.00%
of the total amount of the Company’s central water consumption (In 2022, the amount of recycled water inside East Water Building was 868 cubic meters, representing 5.35 % of the amount of the Company’s central water consumption.
Energy aspect
Reduce the amount of electrical energy
per unit of pumped water, compared to the past 3-year average (Average base of 2020-2022 was 0.45 kWh/m3)
Amount of carbon dioxide emissions was 206.02 tonCO2eq/million cubic meters,
from the total energy consumption of pumped water per unit of pumped water
8.58% decrease from 2021
Increased in green area
(calculating green area of 400 trees/Rai)
and help absorb carbon dioxide about Rai per year tons/year
238 – 396
(One tree can absorb carbon dioxide on average 9-15 kg/year)
General waste, hazardous waste
Amount of recycled waste at East Water Building at
of total waste
10.00%
Other aspects (Air pollution, natural resource)
Reduce amount of carbon dioxide emissions
from total energy of pumped water per unit of pumped water, compared to the past 3-year average (Average base of 2020-2022 was 224.42 tonCO2eq/million cubic meters)
Comply with regulations, rules and environmental laws related to business operation
Control emissions in various fields to meet the
standards
NRW
Control
055
CLIMATE CHANGE RESPONSE TOWARDS INTEGRATED WATER MANAGEMENT
In 2022, the Company had a number of measures to respond to climate change through ensuring the stability of its water grid system to build confidence in water management and provide sufficient water supplies to all sectors.
Creation of Stability of Water Grid System
In creating stability of its water grid to ensure sufficient water supplies in the long run, the Company has invested in development of additional water grid of 139.08 kilometers namely Khlong Luang – Chon Buri water pipeline, Nong Plalai – Nong Kho – Laem Chabang water pipeline, and Map Ta Phut – Sattahip water pipeline to build confidence to water users both in consumer sector and industrial sector in the eastern region to be sufficient to an increase water demand in the future, based on monitoring of levels of rainfall, water flows into reservoirs, water volume in reservoirs, and weather forecast including atmospheric pressure values, effects of wind directions in the Pacific Ocean on El Niño and La Niña, and precipitation levels (Using International Research Institute for Climate and Society (IRI) model)
(Disclosure 201-2, 303-1:2018 )
New climate database covering 1991-2021 was used to analyze the locations for the Company’s water distribution services, customers’ water usage need projections, and the capability of the pipeline and the pumping and distribution system. The Company considered a 20-year plan to create the stability of its water grid so as to address the risk of droughts in the eastern region. The plan consisted of the following 3 parts.
• Raising the capability of water supply sources
• Developing the raw water pipeline network system (Water Grid)
• Collaboration with relevant agencies and producing weather forecasts
I. Raising the capability of water supply sources: The Company established short-, medium-, and long-term development plans for its water supply sources to ensure the stability of its raw water sources and build customers confidence in the next 20 years. Adjustments were made to the previous year’s water source development plans to keep up with the current situation and to ensure that water users would not be affected. Details of the plans are as shown below.
800 700 600 Water Volume (Million Cubic Meter) 500 400 300 200 100 2022 2023 2024 2025 2026 2027 2028 2029 2030 2031 2032 2033 2034 2036 2038 2040 2035 2037 2039 2041 2042 0 1) Khlong Sapan Phase 1 (25 Million Cubic Meter) 417 592 531 346 2) Khlong Luang (20 Million Cubic Meter) 3) Pump back, Lahan Rai Temple (10 Million Cubic
Diagram: Water supply source development plans and water demand forecasts over the next 20 years
Meter)
4) Sand pond at the end of Khlong Luang Phase 1 (10 Million Cubic Meter)
5) Phan Thong water diversion (FG. Khlong Nam Kem) Phase 1 (10 Million Cubic Meter)
10) Khlong Sapan Phase 2 via Prasae -Nong Kho - Bang Phra (25 Million Cubic Meter)
11) Wang Tanod via Prasae - Nong Kho - Bang Phra (25 Million Cubic Meter)
6) Khlong yai – Nong Plalai water diversion (10 Million Cubic Meter)
7) Sand pond at the end of Khlong Luang Phase 1 (25 Million Cubic Meter)
8) Phan Thong water diversion (FG. Khlong Nam Kem) Phase 2 (10 Million Cubic Meter)
Demand (Base Case) Safty Factor 25% Supply low water year Supply average water year Year (AD) SUSTAINABILITY REPORT 2022 056
9) Increasing water pump efficiency Dok Sai 2 (15 Million Cubic Meter)
II. Developing the raw water pipeline network system (Water Grid): The Company continuously enhanced the capability of its water grid. In 2022, the Company’s achieved the progress of its operations as follows:
(1) Construction of the Khlong Luang Reservoir – Chon Buri Raw Water Pipeline
To accommodate the water demand in Chon Buri and Pluak Daeng – Bo Win areas and to address possible water shortages in the future. The pipeline has the transmission capacity of around 52 million cubic meters per year. In 2021, permission to use the area for the construction of water pipeline along Road 331 was completed, remaining in the Royal Irrigation Department area which is under consideration of the Treasury Department. Currently, the pipeline is under construction and is expected to be completed in 2023.
(2) Improvement of the efficiency of the water pipeline system from Rayong – Chon Buri area
To raise capability of water distribution system from Rayong area to Chon Buri area, which has combined the work of the project to improve the efficiency of the water pipeline system from Rayong – Chon Buri area and the project to expand the water distribution area of private companies in this project. The water distribution capacity has been increased from original pumping capacity of 78 million cubic meters per year to 206 million cubic meters to accommodate water
Joint Water Management
demand in Chon Buri area and Pluak Daeng – Bo Win area in the future. Currently, the construction is underway and expected to be completed in 2023.
(3) Construction of Map Ta Phut – Sattahip water pipeline system
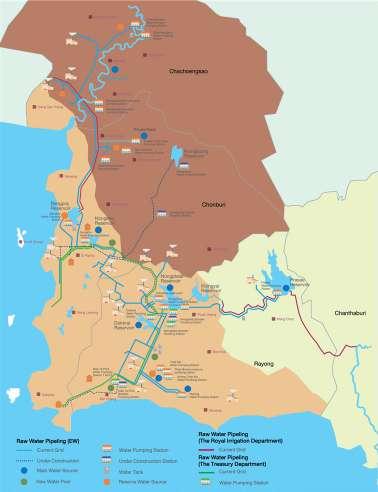
To increase water distribution capacity from the Map Ta Phut area to Sattahip area by increasing the water distribution from the original average pumping capacity of 29 million cubic meters per year to 79 million cubic meters. This was to accommodate water demand of current customers. The project also included the expansion of production capacity of Sattahip Waterworks and new customers in the future in Sattahip area. Currently it is under construction and expected to be completed in 2023.
III. Collaboration and weather forecast: To ensure that the Company’s water management plan was appropriate and in line with the current situation, the Company collaborate closely with relevant agencies such as the Royal Irrigation Department, Provincial Waterworks Authority, Industrial Estate Authority of Thailand, Working Group of the Eastern Water Operation Center (Keyman Water War Room), Office of the National Water Resource (ONWR), Water and Environment Institute for Sustainability, Office of the Eastern Special Development Zone, Meteorological Department, Department of Royal Rainmaking and Agricultural Aviation, etc.
Source: Overall Water risk : www.wri.org/our- work/project/aqueduct/
The water sources under the Company’s management are surface water pumped from various sources which can be divided into 2 types according to usage: main and reserve water sources, details as follows:
Main water source refers to water sources allocated by the Royal Irrigation Department including Nong Kho, Dok Krai, Nong Plalai, Prasae, and Bang Phra reservoirs. This includes other sources of water that can be pumped out for use each year where the water supply comes from seasonal runoff water at sources like the Bang Pakong and Rayong rivers, Khlong Thab Ma and private water sources.
Reserve water source refers to water sources that provide backup support for the main water sources. The water must be reserved beforehand for use when there are low water levels in the main sources or water shortage. These are Samnakbok, Chachoengsao, and Thab Ma raw water ponds.
Overall Water Risk Low (0-2) Low-Medium (1-2) Medium-High (2-3) High (3-4) Extremely High (4-5) 057
Table:
The water sources allocated by the Royal Irrigation Department (RID) from November through October of the following year. Each year, the RID through relevant projects would inform the non-agricultural water users (consumer and industrial sectors) about the permitted water quotas for that year. The allocated amounts were based on the water levels in the reservoirs at the beginning of the dry season (November), the minimum water levels stored, the plans to supply water to the agricultural sector, and the amounts of water released to maintain the ecosystem. During each water allocation year, volumes of water consumption would be monitored to allocate water quotas that matched the levels of water flow into the reservoir within the limits in the written permits for water uses from water sources.
In 2022, the Company pumped water from the Bang Pakong River according to criteria in the MOU between the Company and the water users dated 3 September 2021. The requirement was that the water flow in the Bang Pakong River at the Khlong Kuen pump station must be in the same direction for three consecutive days. On the following day, the Company must invite a working group to verify the water flow before the start of the pumping. The pumping shall be halted when water salinity in the Bang Pakong River at the Chachoengsao Irrigation Office exceeded 1g/liter. During the past year, the Company pumped water from July 2022 to December 2022 for distribution mainly to consumer and industrial sectors in Chachoengsao with part of it being diverted to the Bang Phra reservoir Samnak Bok reserved pond as reserved supply for water users in Chachoengsao and Chon Buri area in the dry season 2023.
1. Prasae Reservoir 2. Nong Plalai Reservoir* 3. Dok Krai Reservoir 4. Bang Phra Reservoir 5. Nong Kho Reservoir 6. Bang Pakong River (Water Stress) 7. Khlong Thab Ma, Rayong River 8. Private Water Sources (Water Stress) 9. Rainwater from Samnak Bok Pond (Water Stress) Total 110.00 120.00 116.00 8.00 16.70 50.00 0 12.00 0 432.70 11.94 141.73 82.78 7.30 6.93 7.29 9.29 8.21 0.23 275.70 11.94 141.73 82.78 7.30 6.93 7.29 9.29 8.21 0.23 275.70 0 0 0 0 0 0 0 0 0 0 Surface Water Allocated water (per written permit) 103 million liters Pumped water For 2022 103 million liters Total soluble solid (≤ 1,000 mg/liter) 103 million liters Total soluble solid (> 1,000 mg/liter) 103 million liters Remark : *
in Rayong area, i.e.
total water
Volumes of water from main water sources used by the Company in 2022 (Disclosure 303-3:2018, 303-5:2018)
The volume of water pumped from the Nong Plalai Reservoir exceeded the permitted limit since it was the management of the amount of overall water allowed
the
used of Dok Krai Reservoir and Nong Plalai Reservoir does not exceed 236 million cubic meters/year (103 million liters = million cubic meters) (Further details of the table showing volumes of water from main water sources used by the Company in2021-2022 are in the Annex in page 110)
SUSTAINABILITY REPORT 2022 058
Water Management in 2022
Although at the beginning of the year the amount of water in the reservoirs in Chon Buri and Rayong area was normal, the Company still accelerated the pumping and diversion of water from Nong Plalai reservoir in Rayong province to Chon Buri province and kept reserves of water deposits in the Chon Buri area. This was to reduce the risk of water management during the drought and to increase stability of water pumping and distribution in Chon Buri area by pumping water from the Bang Pakong River to deposit to the full capacity of the Bang Phra reservoir.
In conclusion, the total water volume pumped by the Company for water management in 2022 was at 275.70 million cubic meters, a decrease of 11.35% from 2021. This was due to the large amount of water situation causing customers who had their own water source to choose to use their own water source as the main source. In addition, some of the factory customers in the industrial estates were still affected by COVID-19 pandemic, causing them unable to fully increase production capacity.
Overall Water Consumption by Service Area
Most customers in these areas were in the industrial sector and represented more than 84.23%, while customers in the consumer sector represented 15.70%. The water came from the three major reservoirs in Rayong i.e., Dok Krai, Nong Plalai, and Prasae, and the Company’s reserved water source i.e., Thab Ma raw water pond.
Most customers in these areas were consumer sector and represented more than 50.31%, while customers in the industrial sector represented 49.69%. These areas were the country’s new strategic line. However, according to the geographical condition, there were only two large water reservoirs, i.e., Nong Kho and Bang Phra, leading to the need to the raw water pumped and diverted from the Nong Plalai and Prasae reservoirs in Rayong through the Company’s water grid.
Most customer in the area were the consumer sector and represented more than 89.89%, while customers in the industrial sector represented 10.11%, with the Bang Pakong River as the main source of water. However, as Chachoengsao faced saltwater intrusion, some areas suffered from freshwater shortages in the dry season. To ensure year-round water supply, raw water must be purchased from private water sources in the dry season, while in the rainy season, water must be pumped from the Bang Pakong river and kept in the Bang Phra reservoir for use in the dry season.
Maptaphut, Ban Chang, and Sattahip
Chachoengsao
Chon Buri and Pluak Daeng – Bo Win
84.23% Industrial sector 10.11% Industrial sector 49.69% Industrial sector 15.70% Consumer sector 89.89% Consumer sector 50.31% Consumer sector 059
Tap Water Consumption at the Company
The East Water Group placed importance on the use of water within its operating areas, whether it is an office building, a water pumping station, and staff residence through campaigns to encourage employees to use water sparingly and appreciate its value. In 2022, the East Water Group’s tap water usage averaged 1,681.42 cubic meters per month. The main sources of water were from the Metropolitan Waterworks Authority (MWA) and the Provincial Waterworks Authority (PWA). Details of water consumption by geographical location are as follows:
East Water Buidling1
Operation Office2
Remarks :
1 Refers to water usage in the Head Office (18th and 22nd-26th floor) and all common area of 16,215.00 cubic meters. In addition, East Water Building has used recycled water from the building wastewater treatment in the volume of 868.00 cubic meters.
2 Refers to the water usage at Rayong Operations Center, Laem Chabang Office, and Thab Ma Office. The water meter at Chachoengsao Office was shared with Chachoengsao Head Tank and other offices in the area.
3 Refers to water usage at the nine pump stations supplied by PWA. The Company produced tap water at the eight pump stations by using raw water considered as NRW. These pump stations were Nong Kho Station, Prasae Station 2, Nong Plalai Station 1-3, Nong Plalai Pressure Boosting Station, Hub Bon Water Storage Station, and Bang Pakong Station. The remaining 6 stations did not have tap water supply.
4 Refers to water usage at Executive Residence at Rayong Operations Center and Staff Residence at Thab Ma Raw Water Pond. The residence at Chachoengsao Head Tank shared the water meter with Chachoengsao Head Tank. For other residences, the Company produced tap water by using raw water considered as NRW.
5 The amount of wastewater discharged from houses and buildings will be approximately 80.00% (reference from the manual of community wastewater and wastewater treatment system, Pollution Control Department, Ministry of Science, Technology and Environment)
Staff Residence4
Supplier:
Water Supplier:
Water Supplier:
Water Supplier: PWA Average Water Usage Amount (cubic meter/month) Average Water Usage Amount (cubic meter/month) Average Water Usage Amount (cubic meter/month) Average Water Usage Amount (cubic meter/month) Average Water Usage Amount (cubic meter/month) Total Water Usage Amount (cubic meter) (Disclosure 303-3:2018) Total Water Usage Amount (cubic meter) (Disclosure 303-3:2018) Total Water Usage Amount (cubic meter) (Disclosure 303-3:2018) Total Water Usage Amount (cubic meter) (Disclosure 303-3:2018) Total Water Usage Amount (cubic meter) (Disclosure 303-3:2018) Water Usage Amount (cubic meter) (Disclosure 303-5:2018) Water Usage Amount (cubic meter) (Disclosure 303-5:2018) Water Usage Amount (cubic meter) (Disclosure 303-5:2018) Water Usage Amount (cubic meter) (Disclosure 303-5:2018) Water Usage Amount (cubic meter) (Disclosure 303-5:2018) 1,351.25 33.08 271.92 25.17 1,681.42 Effluent Amount (cubic meter)5 (Disclosure 303-4:2018) 12,972.00 Effluent Amount (cubic meter)5 (Disclosure 303-4:2018) 317.60 Effluent Amount (cubic meter)5 (Disclosure 303-4:2018) 2,610.40 Effluent Amount (cubic meter)5 (Disclosure 303-4:2018) 241.60 Effluent Amount (cubic meter)5 (Disclosure 303-4:2018) 16,141.60 16,215.00 397.00 3,263.00 302.00 20,177.00 3,243.00 79.40 652.60 60.40 4,035.40 23 Water Pump Station3 Total SUSTAINABILITY REPORT 2022 060
Water
MWA
PWA
PWA
WATER PUMPING AND DISTRIBUTION MANAGEMENT EFFICIENCY ENHANCEMENT (SMART WATER) PROJECT
At present, the SMART WATER project has implementations in various areas which can be summarized as follows:
1. Software for controlling pressure in pipes; software for pump and water source control (AQUIS) for simulating hydraulics, calculating Pressure Optimization, Flow Optimization, and Reservoir Optimization offline which can calculate the pressure, flow rate and pump usage in the existing pipe system.
2. Electrical efficiency tracking system and power quality meter (Power Monitoring Expert - PME) which can show power consumption, power quality in individual pump in each pumping station and display information of each power station.
52,825
3. Asset Management System (AMS) for water pumping system with a database created in the system and develop process (Inventory) along with Mobile Application System for opening and closing various repair cases.
4. The Command Control Center (CCC) which has developed preliminary visualization and is prepared to link the system. It is still in the development stage and waiting for basic information to be completed.
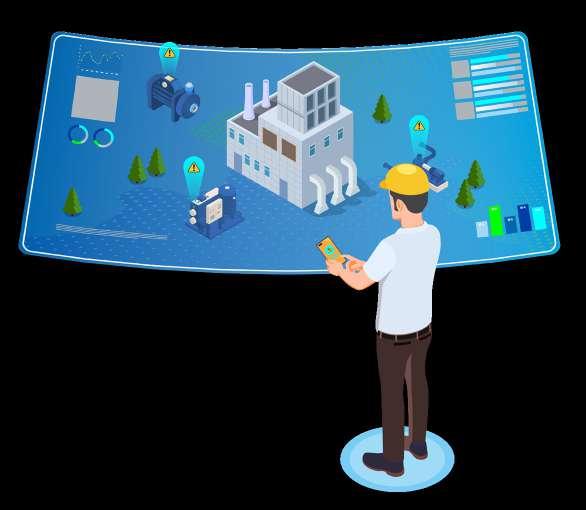
Carbon Footprint (Energy Power) Energy Usage by Province Energy Usage Recent Power Quality CBEMA - ITIC Event (Month to Date) Energy Usage by Plant CO 2 Emission [kgCO2e]
220,000 200,000 180,000 160,000 140,000 120,000 100,000 80,000 60,000 40,000 20,000 0 Energy (KWh) 100% 01 02 03 04 05 06 07 08 09 10 11 12 13 14 15 16 17 18 19 20 21 22 23 24 25 26 27 28 Last month This month Duration (s) 0.0001 0.001 0.01 0.1 1 10 100 500 400 300 200 100 Magnitude (% Nominal)
60.3% 36.6% 3.1% Rayong Khlong Kuen Dok Krai Nong Kho Nong Plalai Bang Phra Map Ta Phut Samnak Bok Prasae Bang Pakong Rayong Chon Buri Chachoengsao 061
CARE FOR WATER QUALITY IN WATER SOURCES
(Disclosure 303-1:2018)
The Company operates business related to water resources; hence, it places importance on the efficient use of water resources and consider the quality of water in various water sources, which is the heart of the quality of the Company’s products and services. The Company also focuses on the potential impact on the livelihoods of living creatures in that water source from pumping and delivering water through the Company’s raw water pipeline. The Company therefore follows up and monitors to ensure that its business operations will not affect the environment. The Company compares the results of water quality testing in various water sources with raw water quality data for the past 6 years in order to monitor the trend of changes in water quality in various water sources.
Based on the monitoring and follow-up on the water quality, it was found that the Pollution Control Department’s Water Quality Index (WQI) of the majority of the reservoirs was on average at fair to good rating as follows
The Company has 2 types of water quality monitoring processes as follows:
1. Water quality monitoring by external agencies: 13 major and reserve water sources of the Company were monitored. The physical and chemical properties of the water were measured monthly. The results were further analyzed to identify trends, causes, and factors concerned. Relevant reports were produced and submitted to relevant agencies and the customers through the Customer Relations Division.
2. Water quality monitoring through online tools at 20 spots: Water quality changes were monitored by the Company using the Supervisory Control and Data Acquisition (SCADA) system. Reports of the water quality results were sent to the customers once per day.
In addition to water quality monitoring in water sources, the Company has coordinated with customers to monitor water quality from the source and the destination sent to each customer to increase service efficiency and speed in improving water quality for customers. Customer can prepare to improve water quality before entering the production system.
80 70 60 75 65 55 50 2017 2018 2019 2020 2021 2022 Good Good Good Good Good Good Good Good Good Good Good Good Fair Fair Fair Fair Fair Fair Fair Fair Fair Fair Fair Fair Fair Fair Fair Fair Fair Fair Good Good Fair Fair Fair Poor
Year (AD) SUSTAINABILITY REPORT 2022 062
Water Quality Index of main reservoirs
Dok
Krai Reservoir Nong Plalai Reservoir Bang Phra Reservoir Nong Kho Reservoir Prasae Reservoir Khlong Yai Reservoir
ENVIRONMENTAL PROJECTS
(Disclosure 302-3, 305-2)
Non-Revenue Water Control
The rapidly changing world climate has caused people to pay more attention to sustainable development. Water is another resource that is crucial to the sustainable development of global community. Such sustainability involves ensuring that there are sufficient resources for present and future generations. Therefore, the United Nations has announced a global action plan for the years 2018-2028 called “Water for Sustainable Development”, with a combination of water resources management to achieve economical, social, and environmental objectives. But the water shortage problem is increasing day by day and the water supply is not enough for the consumer, agricultural, and industrial sectors. One of the major obstacles to water sustainability is non-revenue water management.
Non-revenue water (NRW) is water that does not generate income in the system, causing losses both from energy consumption from pumping and water resources during pumping before reaching the customers. The Company as the leader in the country’s comprehensive water resource management, especially management and development of water resources in the eastern region which is industrial center and Eastern Economic Corridor (EEC), has realized and always seen importance of this point. This can be seen from the approach to formulate policy for non-revenue water control to be at 2.50% of the pumped water for direct distribution into the system. Not only studying and evaluating the capability of water management, but the Company also focuses on studying new and modern technologies that are suitable for the Company’s pumping system.
In 2022, the Company has developed a package software for controlling pressure in the pipe which can calculate pressure value, flow rate, and pump usage in the existing pipeline system, which enables the Company to control non-revenue water in the pipeline to be at 1.69% of the amount of the water pumped for direct distribution into the system. (Higher than 2021 due to the Company developing additional water grid to accommodate water demand of customers in operating area.)
The formula to calculate non-revenue water (NRW) is as follows:
(Vol.of pumped water (directly pumped into the sysem) –Vol.of distributed water to customers - Vol.of stored water)
% NRW = x 100
Vol.of pumped water (directly pumped into the system)
Targets (For 2023-2024) Non-revenue water (NRW) not over 2.50% 3.43% 2.69% 2.44% 1.94% 2.23% 2.90% 3.50% 3.28% 3.00% 1.69% 2.93% 1.41% 4.00% 3.50% 3.00% 2.50% 2.00% 1.50% 1.00% 0.50% 0.00% 2011 2013 2016 2019 2012 2015 2018 2014 2017 2020 2021 2022 600 500 400 300 200 100 0 % NRW Pipeline length (km.) Non Revenue Water Year (AD) 063
Table: Volume of pumped water in 2022
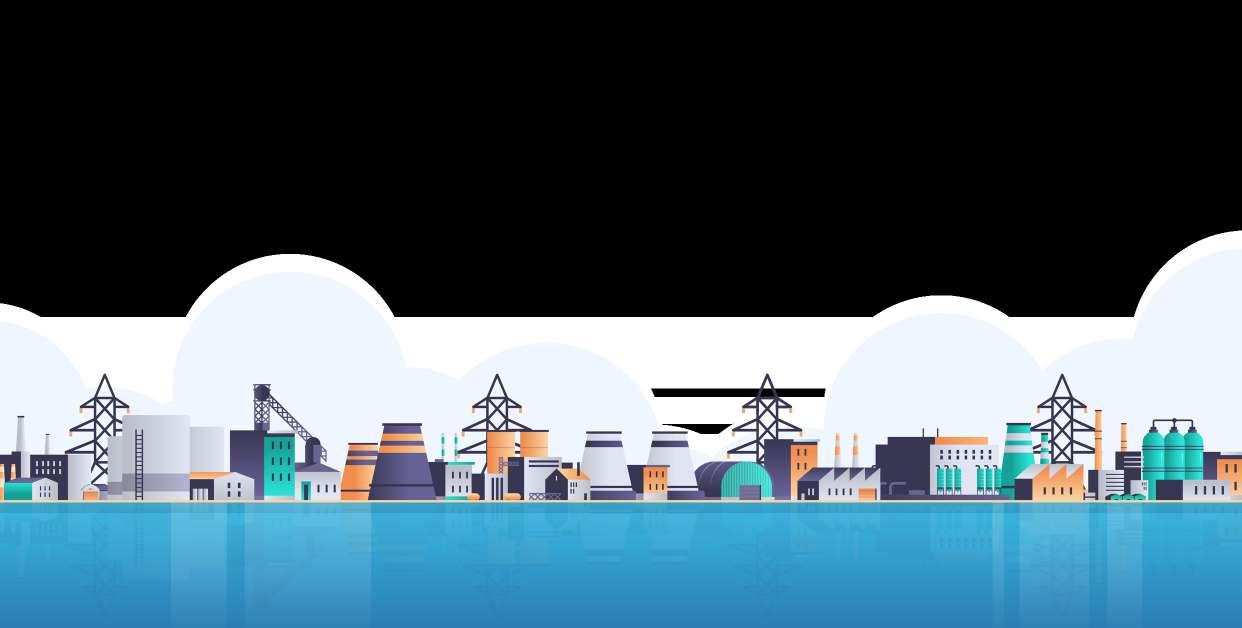
January February March April May June July August September October November December Total 25,820,124 23,357,748 26,651,193 24,808,467 24,687,276 23,627,192 23,158,402 24,865,569 23,271,272 23,348,982 21,478,844 19,790,753 284,865,822 25,539,852 22,478,343 25,237,589 24,270,644 24,173,219 23,666,527 22,850,688 20,974,705 18,387,874 18,840,894 18,042,159 19,229,872 263,692,366 0 62,596 937,666 0 78,618 0 26,689 3,395,960 4,478,013 4,237,752 3,138,229 0 16,355,523 280,272 816,809 475,938 537,823 435,439 -39,335 281,025 494,904 405,385 270,336 298,456 560,881 *4,817,933 1.09% 3.50% 1.79% 2.17% 1.76% -0.17% 1.21% 1.99% 1.74% 1.16% 1.39% 2.83% 1.69% Month Volume of pumped water (directly pumped into the system) (103 Liters) Volume of distributed water to customers (103 Liters) Volume of stored water (103 Liters) Volume of non-revenue water (103 Liters) % NRW (of the water directly pumped to the system) Remark : * Non-revenue water = Volume of water (directly pumped into the system) – volume of water distributed to the customers – volume of stored water SUSTAINABILITY REPORT 2022 064
Electricity Consumption and Energy Conservation Measures
(Disclosure 302-1, 302-2, 305-2)
Electricity is a key driver of the water pumping and distribution system. It is also a main cost of the Company. Electricity consumption is directly correlated with the volume of water pumped through the Company’s Water Grid of 523 km. covering 20 pump stations and 66 power sub-stations and metering stations. Hence, the Company is committed to ensuring the reliability of its pumping and distribution system by setting a goal of no disruptions to the water distribution from the main water grid. Nevertheless, according to the Company’s requirements, there is an eight-hour interval for stopping the water distribution for maintenance purposes. However, for machines or equipment with critical duties (Class A), there is no time interval for stopping the operations.
20 pump stations
Khlong Kuen Reserve Pond Pump Station
Bang Pakong Pump Station
Samnak Bok Pump Station
Bang Phra Pump Station
Maptaphut Pump Station
Nong Plalai Pump Station 2
Prasae Pump Station
Thab Ma Reserve Pond Pump Station
Khlong Thab Ma Pump Station
Chachoengsao Pump Station
Bang Pakong Low Pressure Pump Station
Samnak Bok Pressure Boosting Station
Nong Kho Pumpt Station
Dok Krai Pump Station
Nong Plalai Pump Station 1
Nong Plalai Pump Station 3
Nong Plalai Pressure Boosting Station
Thab Ma Low Pressure Pump Station
Rayong River Pump Station
Realizing the importance of efficient energy consumption, the Company continued to implement energy conservation projects for its water pumping and distribution system and office buildings to save energy and improve energy consumption efficiency organization-wide through the Energy Management Working Group. This not only helped manage costs and expenses for the organization, but also served to reduce the “global warming” problem. The energy conservation efforts covered the following operating sites.
1. 13 pump stations registered as controlled factories: Nong Plalai Pump Station (1-3), Dok Krai Pump Station, Nong Plalai Pressure Boosting Station, Bang Pakong Pump Station, Chachoengsao Pump Station, Bang Phra Pump Station, Maptaphut Pump Station, Samnak Bok Pressure Boosting Station, Prasae Pumping Station, Nong Kho Pump Station, Thab Ma Pump Station, Khlong Thab Ma Pump Station, and Rayong Pump Station.
2. One controlled building:
The building refers to the head office. In this regard, each year’s energy conservation target will be set up based on previous year’s energy conservation performance evaluation results. The new target shall be further reduction in the energy consumption at organizational, production or service, and device levels. The factors to be considered shall include levels of energy loss realized and improvement possibilities.
3. 66 power sub-stations.
4. Tap water production station of subsidiaries of 11 entities.
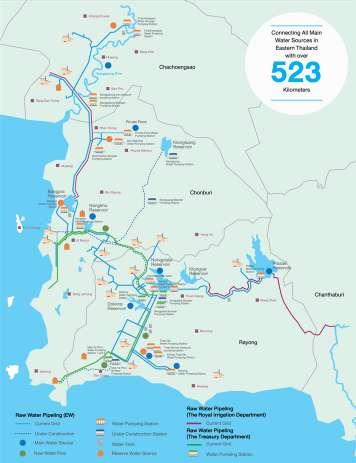
065
Summary of Operations of Energy Consumption Efficiency Enhancement Projects in 2022 (Disclosure
302-4, 305-2, 305-5)
Electricity-Saving Measures for 2022
Head Office
1. Installing Variable Speed Drive (VSD) at a 350 TR water cooler
2. Adjusting the temperature (Set Point) of the water cooler to be suitable for use
3. Reducing the variable speed drive (VSD) of the CHP cold water pump from 50 Hz down to 46 Hz.
Operating sites
Nong Plalai Pressure Boosting Station, Dok Krai Pump Station, Nong Plalai Pump Stations (1-3), Chachoengsao Pump Station, Bang Pakong Pump Station, Prasae Pump Station, Nong Kho Pump Station, Thab Ma Pump Station, Khlong Thab Ma Pump Station, and Rayong River Pump Station. Three stations exempted from energy saving measures required by law were Bang Phra Pump Station, Samnak Bok Pressure Boosting Station, and Maptaphut Pump Station.
Based on energy-saving measures in 2022, all of the facilities achieved a total reduction in CO2 emissions 100.93 tons.
The calculation was based on Emission factor = 0.4999 kg-CO2eq/kWh by the Thailand Greenhouse Gas Management Organization (TGO)’s Emission Factors. http://thaicarbonlabel.tgo.or.th/admin/uploadfiles/emission/ts_578cd2cb78.pdf
Total 1. Maintenance of air-conditioners Total 499,619.78 381,607.86 74,544.10 955,771.74 1,112,335.11 1,112,335.11 381,607.86 370,159.62 35,469.30 787,236.78 1,078,965.06 1,078,965.06 118,011.92 11,448.24 39,074.80 168,534.96 33,370.05 33,370.05 Premises Projects Before Improvement (kWh/y) After Improvement (kWh/y) Electricity saving (kWh/y) CO 2 emissions (kg-CO2eq) CO 2 emissions (kg-CO2eq) Reduction in CO 2 emissions 84,250.62 kg-CO2eq Reduction in CO 2 emissions 16,681.69 kg-CO2eq 477,790.29 556,056.32 393,539.67 539,374.63
SUSTAINABILITY REPORT 2022 066
As for subsidiaries, energy-saving measures have been implemented in 11 areas. (Head Office, Bang Pakong Water Supply, Chachoengsao Water Supply, Nakhonsawan Water Supply, Egcom Tara, Rayong Waterworks, Sattahip Waterworks, Bo Win Waterworks, Hua Ro Waterworks, Chonburi Waterworks, and Nong Kham Waterworks) for 5 projects enabled energy-saving of 2,043,879.62 kWh/y, and can reduce CO2 emissions of 1,021,735.42 kg-CO2eq or 1,021.74 tons.
(The calculation was based on Emission factor = 0.4999 kg-CO2eq/kWh by the Thailand Greenhouse Gas Management Organization (TGO)’s Emission Factors http://thaicarbonlabel.tgo.or.th/admin/uploadfiles/emission/ts_578cd2cb78.pdf)
Measures of Solar Energy as an Alternative to Electricity for 2020-2022
The East Water Group has used solar energy to replace electrical energy for the operations in the head office areas, Bang Pakong River Pump Station, and Pang Puay Water Production Station, Ratchaburi Waterworks as follows:
Hence, in 2022 the East Water Group had no CO 2 emissions totaling of 164.70 tons.
Hence, in 2022 the East Water Group had no CO2 emissions totaling of 164.70 tons. (The calculation was based on Emission factor = 0.4999 kg-CO2eq/ kWh by the Thailand Greenhouse Gas Management Organization (TGO)’s Emission Factors http://thaicarbonlabel.tgo.or.th/admin/uploadfiles/emission/ ts_578cd2cb78.pdf)
The Company’s Energy Consumption in 2022 (kWh)
The Company has continuously formulated an energy conservation and innovation development plan in 2023 as follows:
1. Installing Variable Speed Drive (VSD) water coolers, size 175 TR and 350 TR, 9th floor, East Water Building.
2. Maintenance of water coolers 1-4 by cleaning the Condenser.
3. Maintenance of Split Type air-conditioners.
The goal is to reduce energy consumption by 3.00% per year.
Head Office
Waterworks (UU PCL.) SOLAR ROOFTOP SYSTEM (kWh/y) SOLAR ROOFTOP SYSTEM (kWh/y) SOLAR ROOFTOP SYSTEM (kWh/y) Operation Period Operation Period Operation Period 2020 (May – Dec.) 32,178.40 2020 (Jan. – Dec.) 553,280.00 2020 (Oct. – Dec.) 17,541.00 2021 (Jan. – Dec.) 11,893.70 2021 (Jan. – Dec.) 544,789.27 2021 (Jan. – Dec.) 26,601.00 2022 (Jan. – Dec.) 26,955.00 2022 (Jan. – Dec.) 302,503.86 2022 (Jan. – Dec.) 0
Pang Puay Water Production Station,Ratchaburi
358,046.11 0.29% 1,617,372.00 1.30% 748,422.48 0.60%
97.81% Pump station Power sub-station Head Office Car
Bang Pakong River Pump Station
121,874,834.29
067
The Company’s Energy Consumption Proportions in 2022 (kWh)
In summary, the Company’s electricity and fuel consumption in 2022 from 3 main sources i.e. electricity, diesel fuel, and solar energy accounted for 124,598,674.88 kWh. The calculation was based on 1) electricity consumption in pump station 121,874,834.29 kWh (In 2022, there was no fossil energy consumption) 2) East Water Building Head Office 1,617,372.00 kWh 3) Sub-stations along the pipeline 358,046.11 kWh, and 4) Company’s car 74,186.88 liters, equivalent to 2,950,412.26 mega Joules or 748,422.48 kWh. The Company’s electricity and fuel consumption decreased from 2021 of 37,680,325.03 kWh or a decrease of 23.22 % of energy consumption 2021. This was due to the large amount of rainfall in 2022 causing customers who had their own water source to choose to use their own water source as the main source, compared to 2021. But when compared to energy consumption in pumping and delivering water per unit of water, the energy consumption was 0.41 kWh/cubic meter. The energy consumption per unit of water is approximately 8.82% less than 2021 due to the Company’s pumping operations more efficiently including energy saving measures. (Disclosure 302-3,
Year (AD) Year (AD)
302-5) 26,955.00 0.02% 748,422.48 0.60% PEA electricity energy Solar energy Diesel fuel energy 123,823,297.40 99.38% The Company’s Electricity and Fuel Consumption 2020-2022 (kWh) 2020 2021 2022 155,512,161.03 124,598,674.88 Electricity used per total water pumped (kWh/cubic meter) 2020 2021 2022 0.48 0.45 0.41
Remark : * The Company plans to assess significant indirect greenhouse gas emission in scope 3 and collect data for sustainability report
Amount of direct greenhouse gas emission scope 1 (ton-CO2eq) Amount of indirect greenhouse gas emission scope 2 (ton-CO2eq) Amount of indirect greenhouse gas emission scope 3 (ton-CO2eq) 857.20 73,707.20 *The Company has not yet collected any information 350.39 80,452.38 203.32 61,899.27 Amount of greenhouse gas emission 2020 2021 2022 Table: The Company’s greenhouse gas emissions (Disclosure 305-1, 305-2, 305-3) 162,278,999.91 SUSTAINABILITY REPORT 2022 068
Remark : This was calculated from the energy consumed at pump stations compared to entire system water pumped.
2023.
Comparison chart of the Company’s greenhouse gas emissions 2020-2022 (Excluding the reduction in emissions from solar energy)
Comparison chart of the Company’s greenhouse gas emission per volume of water pumped in the entire system for 2020-2022
(Disclosure 305-4)
In 2022, the subsidiaries consumed energy from 2 sources namely electricity and solar energy accounted for 38,857,655.97 kWh, an increase of 11,307.55 kWh from 2021 or 0.29% of energy consumed in 2021. This was due to the overall improvement of the pressure management to be more efficient to maintain consistent pressure level in the pipeline by installing additional water pumps in parallel with the management to increase the capacity of the water supply pump.
Volume of GHG emissions in the water pumping system per total water pumped average 3 years (2020-2022) equals 224.42 tonCO2eq per million cubic meters.
Year (AD) Year (AD)
Electricity Emission Factor **Formula for calculating GHG emissions Diesel Fuel Emission Factor = 0.4999
= Activity Data (kWh) X Emission Factor = 2.7406
kg - CO2eq/kWh
kg - CO2eq/liter
This calculation was based on Thailand Greenhouse Gas Management Organization (TGO)’s Emission Factor (www.tgo.or.th)
Remark : In 2021-2022, the Company used car’s fuel energy to additionally calculate greenhouse gas emissions.
PEA electricity energy Solar energy
2020 2021 2022 74,564.41 80,802.77 62,102.58 2020 2021 2022 240.61 225.36 206.02 38,285,152.11 99% 302,503.86 1%
(ton CO2eq)
GHG emissioin
pumped (ton CO2eq per million cubic meters) 069
The Company’s Greenhouse Gas Emission
The Subsidiaries’ Energy Consumption Proportions in 2022 (kWh)
Volume of
in water pumping system per total water
The Subsidiaries’ Energy Consumption 2020-2022 (kWh)
In 2022, the subsidiaries consumed solar energy, as an alternative to electricity, of 302,503.86 kWh, hence the reduction in CO 2 emissions of 151.22 tons. The Subsidiaries’ electricity power consumption equivalent to the release of CO 2 of 19,138.75 tons, hence the increase in CO2 emissions of 0.93% from 2021.
The Company’s GHG Emissions (ton CO2eq)
**The formula for calculating GHG emissions
Electricity Emission Factor = Activity Data (kWh) X Emission Factor = 0.4999 kg - CO2eq/kWh
This calculation was based on Thailand Greenhouse Gas Management Organization (TGO)’s Emission Factor (www.tgo.or.th)
39,400,000.00 39,200,000.00 39,000,000.00 38,800,000.00 38,600,000.00 38,400,000.00 38,200,000.00 38,000,000.00 19,400.00 19,300.00 19,200.00 19,100.00 19,000.00 18,900.00 18,800.00 18,700.00 2020 39,204,806.80 2020 19,321.90 2021 38,476,348.42 2021 18,961.99 2022 38,811,785.58 2022 19,138.75
Year (AD) Year (AD) SUSTAINABILITY REPORT 2022 070
Waste Management
(Disclosure 306-2, 306-3, 306-4, 306-5)
In 2022, the Company joined the “Vibhavadi Zero Waste” project hosted by the Office of the Securities and Exchange Commission (SEC) for the third consecutive year. The project was aimed at building the executives and employees’ awareness and support for optimizing waste management at the East Water Building. This year, at the East Water Building, efforts were ramped up to manage and sort infectious waste for proper disposal at permitted agencies. Also, communications activities were conducted to promote the employees’ collaboration in and awareness of waste sorting. Records of waste volumes of all sorts were kept for calculating the reduced amounts of GHS emissions each month as follows:
Head Office
Remark : Information as at 3 December 2022.
Operating areas 2022 2021 2022 2021 2022 2021 28,727.80 20,138.20 250.00 230.00 2022 2021 2022 2021 4,501.50 3,639.50 2,332.00 1,432.50 131.20 80.70 Amount (Kg per year) 2022 2021 2022 2021 2022 2021 1,063.10 960.60 0 18.00 2022 2021 2022 2021 223.00 112.40 447.50 294.82 0 0 Amount (Kg per year) General Hazardous Recycled Organic Infectious General Hazardous Recycled Organic Infectious 2022 2021 2022 2021 22,875.92 15,125.09 1,084.15 665.97 Reduced GHG emission (KgCO2eq per year) 071
SOCIAL DIMENSION
Operational targets of Eastern Water Resources Development and Management Public Company Limited only, not include UU PCL.
Targets for 2022
Safety Employee
No accident
that affects the employee’s leave or absent (LTIFR = 0)
No complaints about human rights and employment
Community
Community satisfaction
be higher than past 3 years
average
87.40%
14
Employee satisfaction
be higher than past 3 years average
79.10%
prototype schools with canteen wastewater treatment system
To improve and repair the community water supply system to provide access to clean water
To have communities
for

No complaints from communities affected by the Company’s operations that resulted in the Company’s cessation of operations.
Conserve water resources in the Eastern Region Manage water resources efficiently without compromising well-being of community and the society
SUSTAINABILITY REPORT 2022 072
073
Performance
results of 2022
LTIFR of employee = East Water Building received
0.75
Safety Employee
523 km. 0.45
Platinum Award Silver Award
East Water Building received in BSA Building Safety Awards 2022 from the Building Inspectors Association in “Building with Sustainability
75.00% Employee satisfaction score
Community
Deliver clean water
communities LTIFR of contractors and Outsourced workers LTIFR of employee, contractor and Outsourced workers = (person/million working hours)
amounting to 382,381 liters
to the community for consumption (service vehicle for drinking water, cup water, bottled water)
with community satisfaction score at 92.40% for consumption and agricultural through the water tube amounting to 3,580 cubic meter and through 15 raw water distribution points to village tap water amounting to 1,758,169.60 cubic meters.
14 prototype schools
of treated water and 833,439 liters of recycled water.
to provide access to clean water
improved and repaired the community water supply system benefiting
households.
There were no complaints from communities affected by the Company’s operations that resulted in the Company’s cessation of operations.
Targets for 2023 Community compare with 2022 (person/million working hours)
more than
(Lost Time Injury Frequency Rate) No disputes/judgements/prosecutions/ complaints on labor issues. At least 2 people with working in the establishment. resolved at 100% LTIFR
Stakeholder groups decrease 0.50%
85.00% satisfaction score
Community access to raw water sources
Number of human rights complaints disabilities
15
in areas
No complaints about human rights and employment
at Employee
Management” for high/ big building from Thailand Facility Management Association averaged 75.83%
corporate engagement
Took care of communities along the water grid of in 23 districts, 41 municipalities, 52 sub-district administrations 2.21
with canteen wastewater treatment system resulting in 1,280,240 liters
Safety Employee
for 9 1,883 (decreased from the previous year) (person/million working hours) (person/million working hours)
HUMAN RESOURCE MANAGEMENT
Under the rapidly changing world situation, the Company has prepared with personnel development to support upcoming changes. Its focus was on the capacity building in line with its core values of “SHARP” and “embedding” and “ingraining a mindset and behaviors to an organization’s DNA” among its employees at all levels. This was accomplished through the EWG’s internal communication process, promotion of the meanings of corporate core values, and a range of activities to advocate a code of conduct following such value. Examples of the efforts included holding a SHARP activity through Team Synergy, developing a set of questions aligned with the corporate core values for new hire interviews, incorporating the corporate core values in performance evaluation, and using performance evaluation results to determine personnel development plan.
In 2022, the EWG has used SHARP’s Draft Behavior Block that has been jointly analyzed corporate core behavior (SHARP) with executives in the previous year to communicate corporate core values. It also prepared a video material in a format that was easy to understand to communicate with employees before the start of various employees’ relations activities which emphasized the ongoing corporate core values.
From all those activities, one key important factor was their leadership leading by example as a role mode. To demonstrate a set of behaviors clearly and broadly, it was necessary to create leaders as influencers, initiators, and role models as this would motivate and encourage the employees to take actions according to a set of model behaviors. Also, there should be activity planning and formal and informal communications as a key driving force of the organization-wide implementation, as well as behavioral performance measurement and evaluation for further analysis of results and process improvement.
In response to the “SHARP” corporate core values, the EWG adjusted its human resources management process in the following aspects.
Human Resources Management Process Adjustment
1. Performance Management System
The Company’s Performance Management System (PMS) manual was created as guidance for communications with the employees and supervisors. The Company’s performance management can be divided into 2 parts as follows:
1. Key Performance Indicator (KPIs) shall be used for assessing outcomes of operations compared to specific targets and providing action plan updates and achievements
2. Competencies shall be used for measuring employees’ work practices, behavior, capabilities, skills, and knowledge essential to the performance of duties against expectations in their current positions.
Summary of Performance Evaluation Results for 2022 (Disclosure
Remark : Excluding employees in probationary periods. The percentage of the total employees being subject to key performance indicators (KPIs) and performance evaluations were as follows: Executives Supervisors Operating employees 8.98% Female 46.94% 13.06% 77.96% Male 53.06% SUSTAINABILITY REPORT 2022 074
404-3)
2. Human Capital Management (HCM) system
In 2021, the Company has modernized its information technology for HR management system which the employees can use this new system through mobile application which accommodate hybrid working. It helped employees to work faster and more conveniently and strengthen the implementation of “SHARP” core values.
Human Capital Management
In 2022, it was used to assess the working competency in 360-degree format (evaluation from supervisors, subordinates, and colleagues) of manager group and above. This will provide a more dimension of work competency assessment from many perspectives, which evaluates core and managerial competency.
3. Human Rights Operations
The Company conducts water resource management business along with improving the quality of life of stakeholders throughout the supply chain for sustainable growth. The Company has determined to be a Good Corporate Citizen, an organization that grows and conducts business in accordance with good corporate governance principles, including giving importance to protect the interests as well as giving importance to the practice of respecting human rights of stakeholders along with considering the operations that do not cause any impact on society and environment. An overview of the process can be shown as follows:
Update Personal Info Course Registration Claim PVD 50 Tawi Testimonial Letter Time In/Out Time Shift Change Leave OT Pay Slip Performance Course Requisition Submit Course Evaluation Submit Course Effectiveness Integration with human rights impact management measures Determine measures to control and prevent impacts Communication and report on human rights operations
of Human Rights Management
Announcement of policy
Cultivation within organization
Rights Risk and Impact Assessment
Assessment Scoping
Human Rights Risk Assessment
and verifying the effectiveness of impact management measures
complaints for remedial action 075
Manifestation
1.
2.
Human
1.
2.
Monitoring
Handling
Human Rights Operations Roadmap
Cultivate and educate employees in the Company to understand human rights Review
Complaint channels for each group of stakeholders
In 2022, human rights training was organized as follows:


Plan, make a remedial plan, and implement the plan including mitigation and remedial measures
Monitor and follow up operation to comply with the guidelines
In 2022, EWG has hired 4 people with disabilities to receive equal working opportunities in performing work according to knowledge and ability with suitable salary payment and welfare received. There was also capacity development to increase the working capability for people with disabilities according to their positions.
4. Personal Data Protection

Identify human right risks relevant to stakeholders and assess human rights risk issues
Promote and educate stakeholders about human rights
Understanding Human Rights Online Course for all employees to study and test their understanding of human rights, in which 94.00% of employees passed the test criteria of 70.00%.
In 2022, the Personal Data Protection Act began to come into force, where the Company continue to focus on the protection of personal data. The Company has prepared the details of the personal data protection guidelines for employees, job applicants, and suppliers, which was available in its website for studies by relevant parties before further action. For example, the job applicants can learn about a kind of data to be stored by the Company and grant their consent to the Company so that it can store or edit the applicants’ data or documents as needed. In all circumstances when leaving the Company, the employee shall keep the information, news, and customers’ data or personal data obtained as part of the functional duties confidential without disclosing them to any irrelevant parties after the end of employment.
Human
Rights Policy
Principles and Roles of Comprehensive Human Rights Audit for Executive Course for executives. Human Rights Risk Assessment Course
Announce Human Rights Policy 2021
Remark : * The number exceeded the number required by law Section 33 Hiring persons with disabilities Section 34 Remitting contributions to the Fund for Empowerment of Persons with Disabilities Section 35 Concessions for places to sell goods and services 3* 0 0 3* 0 0 3* 0 0 3* 0 0 Number of People with Disabilities supported 2019 2021 2020 2022 The Company
Section 33 Hiring persons with disabilities Section 34 Remitting contributions to the Fund for Empowerment of Persons with Disabilities Section 35 Concessions for places to sell goods and services 1 1 0 0 1 0 0 1 0 0 1 0 Number of People with Disabilities supported 2019 2021 2020 2022 UU PCL. Report results to the Corporate Governance and Sustainable Development Committee and disclose complaints about human rights in the sustainability report 2022 2023 at The target is
participate 80.00%
SUSTAINABILITY REPORT 2022 076
for employees to
Executives Supervisors and those involved
CARE FOR EMPLOYEES’ WELL-BEING AND PERSONNEL DEVELOPMENT TOWARDS A SUSTAINABLE WATER ORGANIZATION
(Disclosure 404-2)
1. Personnel Capacity Development
In 2022, personnel development was focused on continuous operations according to human resource development policy towards high performance organization and learning organization based on EWG CORE Value (S-H-A-R-P), including adjusting the learning style to be able to develop continuously in a timely manner aligned with business strategy and current global situation. It also focused on treating employees appropriately and equally for sustainable growth. The major developments were as follows:
1.1 Training & Development Program
As employees are valuable resources and important to the sustainable growth of the organization, the Company has designed a variety of development in the form of training, seminars, coaching, mentoring, including practical training covering the entire employee’s lifecycle, starting from the first day until the last day of being an employee. It was divided into 3 main phases namely the beginning of learning, development and growth, and retirement preparation, in order to create a good employee experience.
In the development of the Company’s personnel competency, it consists of 3 competencies and groups of courses to enhance other skills as follows
1) Development of Core Competency (S-H-A-R-P)
It is a basic compulsory course focusing on developing knowledge, skills, and characteristics that all employee in the organization must have according to the Core Competency to strengthen the corporate core values.
2) Development of Managerial Competency (D-E-V-2C)
It focuses on developing knowledge, enhancing managemnet skills, developing leadership skills necessary for the executive and supervisor level to be a driving force to support business strategies to achieve goals. This also includes preparation for personnel with capabitlity to be ready to grow up in higer level.
3) Development of Functional Competency
It focuses on development of human capacity as standard according to the function in order to achieve the set goals and support clear and concrete career growth. The supervisor will analyze the strengths and weaknesses of employees based on their performance in the past year to enhance to operation & service excellence.
4) Elective Course
This is to encourage employees to develop both now and in the future, including employees in the group that are close to retirement as a preparation before retirement.
Summary of annual training & development (Disclosure 404-1)
Total number of traning hours of all employeesis hours/person/year hours/person/year hours/person/year Executive level average supervisor level average Operating level average 20.28 54.43 49.09 Male employees average hours per person/year hours/person/year 56.31 female employees average 37.59 hours representing an average training hours of 47.60 hours/person/year. 10,948.71 077
• Problem Solving & Decision Making
Employees can work to achieve results according to principle of corporate core value [ S-H-A-R-P ]
Level 1 Satisfaction and knowledge assessment
• Result of satisfaction assessment for all course at 87% score, higher from previous year
• Unlock your Power
• One on One Executive Coaching
• Powerful Communication for Leader
High-potential and leadership employee can succeed in key role by using individual competency assessment (Psychological Assessment) together with individual coaching to unlock and awaken power to achieve strong leadership through comprehensive development in Performance Coaching, People Skill, and Inner Self
• Result of knowledge assessement from training at 100% score.
Level 2 Assess performance changes of employees after training
To measure behaviors that reflects competency in each area , and supervisor will use the evaluation results to prepare individual development plan (IDP) suitably.
• Human Resource Management
• Tax and Accounting Management
• Financial and investment analysis
• Community Management
• Project and Construction Management
• Basic Maintenance Work, Engineering
• Utilities Systems
• Sustainable Development
• Energy Conservation
• Corporate Governance
• Knowledge Management Program
• IT System
• Risk Management
• SHE & Environment
• ISO System [ 9001:2015, 14001:2015, 45001:2018]
Employees have expertise in their professions.
In 2022, methods for monitoring and evaluating the application of knowledge after training for 3-6 months have been added including guidance from supervisors and reporting concrete results in a total of 12 major courses such as Coaching HR for Non HR, Problem Solving and Decision Making, SUSE Linux and Enterprise Server, etc.
The Company grows sustainably according to international standards
Level 3 Evaluate achievement based on KPIs It will be used in consideration of annual wages and remuneration of employees as an opportunity of employees to receive advice and exchange experiences with supervisors for development in the following year.
1. Core Course
2. Managerial Course
3. Functional Course
4. Elective Course
1 6 64 41 0.89 5.36 57.14 36.61 Course Course Type Benefits Development achievement in 2022 Number of courses % In 2022, the investment for personnel development with a total amount 3.64 million Baht (average 15,826 Baht/person/year) Development and Training expenses in the amount of 2.03 million Baht (Average 8,826 Baht/person/year) Organization knowledge management expenses in the amount of 1.61 million Baht (Average 7,000 Baht/person/year) 1 2 divided into SUSTAINABILITY REPORT 2022 078
Training Throughout the Employee Life-Cycle in 2022
Onboarding for New Employee
The Company provided orientation course for new employee in fully online format so that all new employees can learn by themselves and take Pre-Post Test as a learning assessment. The course has been reviewed and improve regularly every year. The course covers the basic knowledge of the organization for new employees to be aware of important policies, understand culture, practices, and various performance standards of the Company, and be able to apply it correctly. In 2022, a basic knowledge course for new employees has been established in 5 main parts, namely:
In 2022, all new employees have been trained and assessd the required criteria.
Cultivating Basic Knowledge of Sustainable Growth with International Standards
To ensure that the organization management has standardized, transparent, fair, and auditable operations, the Company has cultivated basic knowledge of sustainable development, good corporate governance, as well as quality, environmental, occupational health and safety management systems to all employees by cooperating with relevant agencies to prepare training plan including:
Courses on quality systems and environmental management
In 2022, the Company was certified International Standard Quality Management System from Bureau Veritas Certification (Thailand) Co., Ltd. The Company also continued to promote education to employees to improve work processes with important courses such as Laws and Operations Related to Fuel, Environmental Law and Pollution Management, Central Air Conditioning System Management, Greenhouse Gas Reduction Management and Calculation of Carbon Footprint, etc.
Sustainability Courses (Disclosure 2-24)
Courses on quality systems and environmental management % of Total Employees 99.57 Executive Level Supervisor Level Operating Level Total Male 19 (person) Male 97 (person) Female 8 (person) Female 13 (person) Female 85 (person) Employees 229 (person) Training Hours 24.30 Hours Training Hours 222.40 Hours Training Hours 2,807.28 Hours Training Hours 3,053.98 Hours Male 7 (person) 1
Sustainability Courses Training Hours 21.00 Hours Training Hours 221.53 Hours Training Hours 275.28 Hours Training Hours 517.81 Hours Male 19 (person) Male 92 (person) Female 8 (person) Female 13 (person) Female 83 (person) Employees 223 (person) Male 8 (person) Safety for New Employee Course (As required by law) Fundmental Knowledge in Total Water Solution Business Course Courses according to the Company’s policies and regulations Internal Information System Usage and IT Security Awareness Course Introduction to 3 ISO Standards Course
2 Executive Level Supervisor Level Operating Level Total % of
Total Employees 96.96
079
Important courses in 2022 included the SET course on business management for sustainable development (S01-S04 in the form of training and workshops), the GRI Standard Update 2021 (Productivity GURU), Human Rights Knowledge, Human Rights Risk Assessment, and Comprehensive Human Rights Audit Role for Executive Course. The trainings were organized to educate employees at all levels both at management and operational levels in order to raise the organization’s sustainability operations as well as being a part to enhance the sustainable development of the Thai capital market and the country.
Good Corporate Governance Courses
In 2022,the Company has prepared an E-learning with quizzes for all employees to learn by themselves and take quizzes to review their knowledge, realize the importance, and evaluate knowledge and understanding of the entire company’s employees. The important training courses and seminars included Code of Conduct and Anti-Corruption, and Corruption Risk and Control Workshop (CRC), etc.
Safety, Occupational Health, and Energy Conservation Courses
In 2022, the Company still focused on safety operations as one of the common KPIs for all employees. The target was set to have operation without accidents that cause lost time. Therefore, there were activities to promote knowledge and understanding in terms of safety, occupational health, and energy conservation through various activities throughout the year, such as training, seminars, workshops, and Safety Talks activities, etc.
As the Company placed importance on personnel capacity development, resulting in employees having the opportunity to grow in their careers. From the statistics in 2018-2022, it was found that the employees were promoted of level/position within the company at least 10% per year, which was considered personnel development to have opportunity to grow and progress in their career (Disclosure 404-3) as follows:
2018 2019 2020 2021 2022 Good Corporate Governance Courses Male 10 (person) Male 19 (person) Male 79 (person) Female 8 (person) Female 14 (person) Female 100 (person) Employees 230 (person) Training Hours 17.30 Hours Training Hours 85.30 Hours Training Hours 127.20 Hours Training Hours 229.80 Hours Safety, Occupational Health, and Energy Conservation Courses Executive Level Supervisor Level Operating Level Total Male 2 (person) Male 18 (person) Male 81 (person) Female 2 (person) Female 13 (person) Female 55 (person) Employees 171 (person) Training Hours 19.00 Hours Training Hours 509.00 Hours Training Hours 1,612.00 Hours Training Hours 2,140.00 Hours Total Employees 221 (Person) Promote of Level/ Position 12.67% Total Employees 229 (Person) Promote of Level/ Position 13.97% Total Employees 236 (Person) Promote of Level/ Position 11.02% Total Employees 249 (Person) Promote of Level/ Position 11.24% Total Employees 230 (Person) Promote of Level/ Position 13.04% % of Total Employees % of Total Employees 100 74.35 3 Executive Level Supervisor Level Operating Level Total
4 SUSTAINABILITY REPORT 2022 080
Preparation for Retirement from the Organization
(Disclosure 404-2)
For the group of employees who were close to retirement in 2022, the Company provided development programs to prepare for life after retirement. Four training courses have been organzied namely Tax Knowledge, Social Security Benefit Knowledge, Knowledge on Opening Online Market to Earn Money to Solve Loneliness, and Applied Art Training in Designing Cloth Bags and Mouse Pad with STENCIL technique. The result of satisfaction survey was 86.00%.
1.2 Knowledge Management
The Company continued to focus on systematic knowledge management of the organization, as well as creation of motivation and participation in the exchange of knowledge and working experience among employees at all levels for more efficient and effective operations and ready to lead to further development as corporate innovation.
In 2022, the Company has defined the success of its knowledge management projects as one of the corporate KPIs and common KPIs with a score of 5 (full score) for both indicators.
In addition, for the implementation of knowledge management in 2022, it continued to follow the learning cycle (EW KM Journey) which was divided into 3 projects as follows:
Project 1 : EW Knowledge Camp Project
The operation was divided into 3 parts namely
Part 1) Training on Principles and Tools
Part 2) Coaching and Group Action
Part 3) Pitching Presentation to develop presentation skills
Level 1 Systematic Knowledge Management
(KM) Class 3
To promote employees’ knowledge and understanding on how to develop and gather knowledge
There were 16 projects on KM with various forms of explicit knowledge such as One Point Lesson, One Point Knowledge, and operation manual, etc. which have been collected in the Company’s water library systematically for further usage and enhancement.
Level 2 KM for Productivity Improvement (PI) Class 2
To improve work processes for efficiency and effectiveness
There were 16 projects on PI which can answered the organization result dimension which can be divided into 5 areas as follows:
1. Productivity: 15 projects
2. Quality: 4 projects
3. Cost: 4 projects
4. Time Delivery: 12 projects
5. Risk: 1 project
Goal
081
Topic
Operating Results
To be a learning center and a new electronic knowledge source for the orgaization that collects information, knowledge from both outside and within the organization to be convenient to use to unlock various limitations of endless learning.
The development of water library has been completed and it was in the process of system testing in the first phase, with collection of knowledge topics and stored into categories in the knowledge repository totaling 43 categories, 229 topics.
• To open space for employees to share knowledge or present their works and freely exchange knowledge/experience.
• To encourage employee to participate in the collection and create knowledge from direct experience in work.
• To collect and store knowledge in the water library system.
Reducing Steps in Considering Water Usage Fees
Benefits received :
1. There were KM Creators not less than 5.00% which was higher than the target.
2. There were more than 20 clips of new knowledge into the Water Library system which was more than the target.
3. 100% of employees have accessed to the Water Library system
• Faster customer service resulting in increased customer satisfaction
• Create a good image of the organization in terms of reliability, professionalism, reducing work steps and duration in considering water usage fees
Improving Energy Efficiency of Chilled Water System
Benefits received :
• The energy used in the Chiller System is reduced by approximately 11,000 kWh/month
• Energy cost were reduced by about 600,000 Baht/Year
In 2022, the satisfaction score of the knowledge management project and improvement of work process was 80.00%. The employees participated in the project had opinion that it was beneficial to the organization at 82.00%, and beneficial to themselves at 80.00%.
1.3 Promoting a Culture of Learning and Self-Improvement through Digital Learning
The COVID-19 pandemic crisis leaded to new model of learning opportunity in the organization. In 2022, the Company has adjusted the learning approach that focus on self development and learning by developing an online learning system (Digital Learning/E-Learning WebPortal) for employees to have more channels and learning
Development of Water Library (Water Library)
Activities to promote and stimulate the use of the Company’s water library
Topic Topic Goal Goal Operating
Operating
Results
Results
Project 2: KM WEB Portal System Development Project
Project 3 : KM Creators Project #Just Want to Tell Year 1
Outstanding Achievements
SUSTAINABILITY REPORT 2022 082
of the Year 2022
styles in addition to just learning in the classroom. The employees would be able to learn continuously without time and location constraints, and can also review the lesson content or training materials at any time which respond to the new world. There was a Q&A board to exchange knowledge and opinion within the Company. The design and development also considered data security and easy to use.
In 2022, there were a total of 23 online lessons in the system with 32 knowledge clips. The result of learning and training adjustments reflected positive feedback. Employees received convenience in learning, save time and travel expense, and increase knowledge and understanding of the use of technology even better. The results of the satisfaction survey of such project, the speakers, trainees, and users assessed the score of more than 80.00%.
2. Employee Welfare Management and Supervision
Employees are the key driving force of the Company in propelling its business to be robust and sustainable. How far the Company can move forward depends upon the ability of the employees to drive innovations.
2.1 Hybrid working
From the COVID-19 pandemic since 2020, the Company has allowed employees to work from anywhere (Flexible Workplace) to create a modern corporate culture to cope with rapidly changing situation as well as to respond to diverse work behaviors of employees and still achived efficient work result.
In 2022, the COVID-19 pandemic situation tended to decrease. The Company has therefore changed the working style to by a Hybrid working in which each department can consider the work style to suit the nature of work. The Company has introduced modern technology to support the working to create a work-life balance enabling employee to create efficient and effective work for the organization, society, and environment on the basis of trust, focusing on results of work.
2.2 Workplace Welfare Committee (Disclosure
2-30)
The East Water Group organized an election of workplace welfare committee according to the Labor Protection Act B.E. 2541 (1998). Currently the East Water Group has three welfare committees as follows:
• The two welfare committees of the Company:
The welfare committee at the Head Office and the welfare committee at the Rayong Operation Center with a total of 10 committee members, representing 4.40% of the total employees.
• The welfare committee of a UU PCL. comprises 8 members, representing 5.63% of the total employees.
The Company’s welfare committee (Head Office)
The Company’s welfare committee (Rayong Operation Center)
UU PCL.’s welfare committee
By level of employees By level of employees By level of employees Operating 4 Operating 5 Operating 6 Central 5 Central 0 Central 5 Male 0 Male 3 Male 5 Female 5 Female 2 Female 3 Supervisory 1 Supervisory 0 Supervisory 2 Eastern 0 Eastern 5 Eastern 3 083
2.3 Gathering Opinions Through Various Channels for Further Improvement in 2022
Recognizing of the importance of building relationships, motivations, and employee engagement, the Company has gathered recommendations and expectations through the meeting of welfare committee and various engagement channels as well as employee satisfaction survey for 2022 as follows:
Welfare Scheme (Disclosure 401-2)
The Company has improved the welfare scheme to support the work of employees or reduce the expense burden of employees, allowing them to focus fully on their works as follows:
• Improvement of Flexible Welfare
According to the recommendations of the workplace welfare committee as well as diversity of the employees of the EWG in terms of age, gender, status, etc., the Company has improved several types of welfare to be in line with current social conditions. This included the determination of age of children who will receive welfare benefit, revision of criteria for reimbursement of recreational welfare, and acceptance of gender diversity (LGBTQ), which this group of employees can take leave and welfare related to marriage, etc.
• Welfare for Retired Employees (Disclosure 401-2, 404-2)
In 2022, there were 2 employees who have reached the retirement age of 60. The Company therefore organized activities to express gratitude for working with the Company. The Company also coordinated with the hospital to allow the retired employees to get a health check-up according to the health check-up program at reasonable price to reduce their expense burden.
Improvement of Employee Activity Plan
The Company has improved the employee activity plan to focus on communication with employees to understand the status and direction of the Company’s future operation through communication channels and relationship building activities within the Company.
2.4 Employee Healthcare Under the COVID-19 Pandemic Situation
In 2022, the Company additionally implemented the following healthcare measure for its employees
• The Company continued work from home policy to reduce the risk of spreading the virus.
• The Company provided face masks, alcohol gel, COVID-19 Antigen Test Kit (ATK) for employees and arranged for ATK test before employees participating in activities to reduce the spread of the virus.
• For employees safety, the Company has sprayed disinfectant and ozone in the workplace every times when it was found that employees were infected with COVID-19 in each area to reduce risks in the workplace.
In 2022, the number of employees infected with COVID-19 were as follows:
Employees infected with COVID-19 Male 58 person Female 57 person Head Office 73 person Operating areas 42 person Head Office 31.74 Operating areas 18.26 In 2022 In 2022 % Male 25.22 Female 24.78 % Total 115 persons % 50.00 Total 115 persons % 50.00 Remark : Total number of the employees 230 people SUSTAINABILITY REPORT 2022 084
3. Employee Satisfaction and Engagement Survey Results
From the operations in 2022, the Company has continuously conducted employee satisfaction and engagement surveys on an annual basis with the objective of using the results as information for considering the improvement of policies or work plans related to employee. The Company has changed the way of study by adjusting relationship with attitudes in various dimensions into 6 dimensions namely People, Opportunity, Pay & Benefit, Work environment, Quality of life, and Communication, including increasing resolution of Engagement Scale resulting in a change in the score value. In 2022, the employee satisfaction score was at 75.00% and employee engagement score was at 75.83%, a decrease from the average for the past 3 years.
However, the decrease score was due to the change in the assessment method (Methodology) and increase the resolution of the Engagement Scale which allowed the Company to clearly identify engagement issues which would lead to improvement. In addition, during the year 2022, there were factors that might affect employees’ feelings. Nevertheless, there were also several dimensions with increased scores, such as Quality of Life dimension, in terms of focusing on the health of employees in the workplace and fully understanding and paying attention to employee problems, and Work Environment dimension, in terms of assignment of the scope of authority suitable for the job position and clear explanation to employ about the scope of work responsibilities, etc.
The Company developed action plans for 2023 basd on comments from the employee satisfaction and engagement survey results in 2022 as follows:
Improving the employee activity plan

to focus on communicating to employees to understand the status and direction of the Company’s current and future operations, etc.
Communication to create understanding through activities
The Company has increased the frequency of communication from senior management so that employees clearly understand various situations of the Company. There was a CEO Townhall activity twice a year (Head Office and Operating area)
Satisfaction Engagement 75.00 75.83 79.10 84.37
2022 Past 3 years average 1 2 3
Employee Satisfaction and Engagement Survey in 2022
085
Improving the Company’s work processes to have a clear, fast and flexible process.
SHARING KNOWLEDGE WITH SOCIETY
Student Internship Program
The Company launched a project for students to gain on-the-job training experience so they can build up their capabilities. The number of participants can be summarized as follows:
The number of interns from 2020-2022
The Company also arranged for mentors to provide coaching throughout the internship period. There were also accident and life insurance policies, and daily allowance for interns as stipulated by laws. For use as reference, in 2022, the Company conducted a satisfaction survey of the interns, and the average satisfaction score is 94.00%. The feedback from the interns can be summarized as follows:
The interns received internship facilities
The interns were assigned tasks that match their field of study, well taken of by mentors; and provided with advice. The work location and atmosphere were appropriate for internship, and there were convenience and coordination during internship 96.00%
Communications and Relations Activities
Relations Activities
The interns gained useful knowledge and experience with clear work plans.
The interns viewed that the Company was safe for internship
The Company communicated its business outlook, business directions, policy guidelines, and business goals of each year to its employees to create a mutual understanding, coordination, and solidarity. This had a positive impact on the business group’s performance efficiency and effectiveness. However, due to the COVID-19 outbreak, the Company’s communication activities were conducted virtually. The video clips were prepared to communicate goals and performance of the business group, and shared to employees for understanding and motivation, leading to the collaboration to perform duties to achieve the organization’s goals.
The Company’s CEO townhall meeting was done to communicate organizational goals from executives to employee for mutual understanding, and teamwork under the “Team Synergy EW: Building Team Power (1+1 must be more than 2)” activity was organized. The employees attended the activities accounted for 80.00% of all employees. The satisfaction score of the activities were 75.00%.
98.00%
92.00%
90.00% Bachelor’s Degree 2020 : 4 (person) 2021 : 6 (person) 2022 : 8 (person) 2020 : 4 (person) 2021 : 0 (person) 2022 : 5 (person) 2020 : 8 (person) 2021 : 6 (person) 2022 : 13 (person) Diploma Total (person) SUSTAINABILITY REPORT 2022 086
Activities to make merit for the 30th Anniversary of East Water
in a new format where the Company invited monks to preach via online system. It was organized together with CG Day activities to promote sustainable development and good corporate governance by promoting CG knowledge to employees. The EWG has therefore organized an event under the name “Show & Grow For EWG Sustainable Future” on 12 October 2022. The activities included communications, online games, and sharing of KM knowledge by inviting Dr. Wit Sittivaekin as a speaker. The EWG employees attended the activities accounted for 85.00% of all employees. The satisfaction score of the activities were 85.00%.
Various clubs
Sports Day event
As COVID-19 pandemic remained, the Sports Day event 2022 was held in a new normal way for the 2nd consecutive year under the title “EWG Virtual Run To 2023: Continuing the Stream of Merit with Sweat”. The Company has allocated money for merit by donating money according to the total distance run by the employees of EWG (The rate of 1 Baht per Kilometer) to Thailand School for the Blind. The EWG employees participated in the activity accounted for 70.00% of all employees with the total distance of 21,027 Kilometers. The satisfaction score of the activity was 89.00%.
Various clubs were set up to promote employees’ sports, health, and recreational activities as well as to build good relationships between them. In 2022, there were 5 clubs and EWG employees were members accounted for 36.00% of all employees. Each club had their own activities an publicized their activities to all of the employees.
Activities to listen to opinions and answer questions from employees
by senior executives were held. They were arranged in the form of lunch between senior executives and employees of each functional line to listen to their opinions and build good relationships between management and all levels of employees. The activities were called “Friendly Noon with CEO” which have been organized 5 times for all functions.
The New Year’s party was held with the objectives of giving executives and employees of EWG to meet and build good relationships with each other and help to create collaboration in the work. It was also an opportunity to thank employees and give rewards for their works throughout the year. The EWG employees participated at 81% of all employees. The satisfaction score from organizing the activities was 86.00%.
087
SAFETY, OCCUPATIONAL HEALTH, AND WORKING ENVIRONMENT
(Disclosure 403-1, 403-2, 403-7, 403-8, 403-9, 403-10:2018)
The EW Group placed importance on safety, occupational health, and working environment management with the goal of “zero workplace accident”. In addition to carrying out operations according to law, it also adopted relevant standards to create a safe working environment and enhance quality of life of its employees, suppliers, and contractors. Furthermore, the EWG developed and announced its regulations and manual regarding occupational health, safety, and working environment management as well as other relevant documents. This was to comply with the ISO 45001:2015 for occupational health and safety management standard system.
In 2022, the Work Instruction document was revised by adding flow diagram to be convenience for the usage, and the performance record document was improved to be in line with nature of actual operation and be in line with relevant laws.
Statistics of the Company’s Workplace Safety (employees, contractors, and outsourced workers) for 2022
: LTIFR) = (Number of lost time injury X 1,000,000)/Number of hours worked by gender
Lost Day Injury Rate: LDIR) = (Number of lost workdays X 1,000,000)/ Number of hours worked by gender Injury Rate: IR) = (Total injuries X 1,000,000)/Number of hours worked by gender
(Table of summary of total accidents of the employees, contractors, and outsourced worker for 2022 is shown in Annex in page 122)
2020 2021 2022 0 13.33 11.05 0 0 Injury Rate : IR (Time/million working hours) Injury Frequency Rate : IFR (Time/million working hours) Lost Time Injury Frequency Rate : LTIFR (Person/million working hours) Rate of fatalities as a result of work-related injury (Person/million working hours) Lost Day Injury Rate : LDIR (Day/million working hours) Remarks : Lost time Injury Frequency Rate
2,646.46 Total 0.39 Total 0.75 Total 0.39 Total 0.39 Total 11.63 Total 0 Total 0.38 Total 0.38 Total 2,256.09 Total 0.38 Total 0.75 Total 0.75 Total 9.34 Total 0 Total 0.75 2020 2020 2020 2020 2021 2021 2021 2021 2022 2022 2022 2022 0 0 0 0 0 0 0 0 0 0 0 0 0 0 0.44 0.44 0.44 0.88 0.44 0.44 0.44 0.88 0.88 0.88 SUSTAINABILITY REPORT 2022 088
From 2022 operations, there were 2 lost time accidents as follows:
• The Company’s employee got a moderate injury (recordable work-related injuries) for 1 person due to the driver drove and hit the truck, as a result he got injured and took 23 days off from work due to the accident. The Company setup an investigation Committee to analyze the cause and preventive measures to prevent recurrence. There were measures for employees to assess their physical readiness before starting work, and if not ready, notify the supervisor. The work was also publicized for employees to acknowledge and aware of work safety.
In addition, the Company organized training on defensive driving to assess driving efficiency, correct driving training, and to change existing attitudes to be a driver who can drive in a defensive manner and change the behavior of the driver to be safe. Leading to a reduction in potential land accidents.
• The Company’s contractors and outsourced workers got a moderate injury (recordable work-related injuries) for 1 person because the contractor had an electric shock accident while checking the energy value before annual maintenance of refrigeration system. As a result, the injury took 2 days off from work in the event of an accident. From the accident above, consulting firm, supervisor, and contractor set up an investigation committee to analyze and identify cause and preventive measures to prevent recurrence. There were public relations measures to raise awareness about work safety among contractors.
For the subsidiaries, there was no accident to employees, contractors, and outsourced workers. Table of summary of total accidents of the employees, contractors, and outsourced workers of subsidiaries for 2022 is shown in Annex in page 126)
In 2022, the EWG had 3 Working Groups (Committee) on Safety, Occupational Health, and Working Environment i.e. Working Group of the Head Office, Working Group of the Operating Area, and Working Group of Subsidiaries, to thoroughly oversee the operations in the respective areas under responsibilities. They hold meeting every month and consist of members as follows: (Disclosure 403-4 : 2018)
Chairman Members representing the employer at supervisory level
Members representing the employees
Workplace safety officer at professional level (serving as member and secretary)
Roles and responsibilities of the three working groups cover:
Occupational Health Management
Working Environment
Fire Prevention and Suppression
Working with Machines
Confined Space
Electrical Safety
Employee Health Examination
Workplace Welfare
Safe Weight Limit
Work-Related Injuries and Illnesses
Smoke-Free Area
Building Control
Construction Site Safety
Operating Area UU PCL.
Head Office
089
Safety Activities (Disclosure 403-3, 403-6, 403-7, 403-10:2018)
The Company undertook a series of safety activities as follows:
1. Annual Health Examination for 2022:
Results of the assessment to identify threats to health and assess the health risks of employees, contractors, and outsourced workers can be summarized as follows:
1.1 Employees: It was found that there are threats to health such as light, noise, UV rays, blue light, chemicals, working posture with computer, psychosocial, biological (communicable diseases), heat, dust, and security threats, etc. In addition, the Company has organized additional health examination programs according to risk factors such as hearing test, visual inspection, etc. In 2022, the Company’s employees did not find the incidence of occupational diseases.
1.2 Contractors and Outsourced workers : The Company required that its contractors and outsourced workers have an annual health check to monitor chronic communicable diseases, diabetes, high blood pressure, abnormal blood lipid, that may affect cardiovascular disease, as well as monitoring abnormalities from work such as vision loss, hearing loss from loud noise, etc. Especially working in hazardous areas, contractors and outsourced workers who enter the area must have health check-up results in accordance with law and strictly follow it. In 2022, contractors and outsourced workers of the Company did not find the incidence of occupational diseases.
2. Safety Communications:
A monthly journal on safety, health, and environment (SHE News) was distributed to the employees to share news and information as well as create awareness of safety, good health, and environmental care.
3. Safety Training:
A training plan on safety, occupational health, and working environment was established for each target group of employees. There were 13 training courses facilitated in the past year (Disclosure 403-5: 2018) for example:
Safety, Occupational Health, and Working Environment Course for General and New Employees for 2022
EWG employees
The training was facilitated all year long (when new hires were employed)
Total participants: 14 persons
Format: e–Learning through HCM
The training was held 3 times (1 time/quarter) when new hires were employed
Total participants: 16 persons
Format: Online internal training
Courses for Safety Officers at Managerial and Supervisory Levels for 2022
EWG employees (managerial and supervisory levels)
There were 8 trainings held (when new hires were employed/as per the corporate criteria)
Total participants: 13 persons
Format: Online external training
There was 1 meeting held (when new hires were employed/ got an appointment)
Total participant: 1 person
Format: Online external training
Courses on Workplace Safety, Occupational Health, and Working Environment (SHE) Committee
• Members representing the employer at supervisory level
• Members representing the employees
• The SHE committee members
There were 3 trainings held (when there were new appointees)
Total participants: 9 persons
Format: Online external training
There were 4 trainings (when there were new appointees)
Total participants: 4 persons
Format: Online external training
Training Course Target Group Company’s Performance Subsidiaries’ Performance SUSTAINABILITY REPORT 2022 090
Training Course Target Group
Courses on Basic Fire Fighting and Fire Evacuation Drill for 2022
Courses on Work Safety Procedures for Chemicals Handling for 2022
Courses on Hazardous Incident Control and Response for Hazardous Emergencies
Behavior-Based Safety Course
Company’s Performance Subsidiaries’ Performance
Clean & Safe Workplace Course
EWG employees
There was one training held
Total participants: 38 persons
Format: On site internal training
There was one training
Total participants: 3 persons
Format: On site internal training -
Employees whose work duties were related to chemicals handling
Employees whose work duties were related to chemicals handling
EWG employees (managerial and supervisory levels)
EWG employees (Committee for 5 Sor Activities)
The training was held twice
Total Participants: 33 persons
Format: On site internal training
The training was held 3 times
Total participants: 122 persons
Format: Online internal training
The training was held once
Total participants 22 persons
The training was held once
Total participants: 26 persons
Format: On site internal training-
Courses on Safety in Working with Electricity and Helping People Suffering from Electrical Hazards
Courses for Crane Operator, Signal provider to Crane Operator, Material Holder, or Crane Controller
Review of Crane Work Course
Employees whose work duties were related to electricity handling
Employees whose work duties were related to crane handling
Employees who have passed the Course for Crane Operator, Signal Provider to Crane Operator, Material Holder or Crane Controller for 2 years
Courses for Authorizer, Supervisor, Assistant, and Operator in Confined Space
Confined Space Permission Course
Employees whose work duties were related to confined space
Employees whose work duties were related to permission to work confined space
Format: Online internal training--
The training was held once
Total participants: 15 persons
Format: On site internal training
The training was held once
Total participants: 18 persons
Format: On site internal training
The training was held once
Total participants: 14 persons
Format: On site internal training
The training was held once
Total participants: 9 persons
Format: On site external training
The training was held once
Total participants: 2 persons
Format: On site external training
091
4. Health Promotion and Office Syndrome Prevention
The EWG held a project to promote health and prevent office syndrome symptoms for the 3rd consecutive year with the view to prevent work hazards among workers such as neck-shoulder-head pain. The pain symptoms were caused by improper postures or long hours of sitting in front of computer screens without changing positions. The project activities include the following:
• Physical massage activities to relieve office syndrome symptoms
• Discussion activity “Bodily pain, is it…ERGONOMIC OFFICE SYNDROME?”
5. Safety Month Event
The EWG hosted an online Safety Month Event to promote work safety awareness to comply with social distancing requirements during the COVID-19 pandemic. The goals and objectives were to instill awareness of work safety in employees to know how to work safely and can prevent dangers and accidents correctly. It was also to create unity within the organization and to create a happy working atmosphere, Happy Work Place, and employees who pay attention to safety will have good health. It was also to convey the executives’ intention to place importance on work safety to employees. There were 3 activities namely:
1. Organizing exhibitions to disseminate safety knowledge including Fire, Safety at Work in Confined Space, Safety Signs, Safety in Chemical Usage, Personal Protective Equipment, Hazard Prevention and Rescuing People from Electric Shock, Ergonomics, Safety in Working with Machines.
2. Activities to answer questions on basic knowledge of safety, occupational health, and environment through Yammer, Line, E-mail และ Poster
3. Safety & Health Talk Activity on the topic of “Taking Care of Physical and Mental Health, Emotional Manipulation Under All Types of Changing Situations” by lecturer Dr. Porama Muthitaporn, an expert in psychology and Ms. Sunisa Sukbunsang.
From organizing those activities, the employees have reviewed their knowledge and understanding of safety, occupational health, and environment. It also encouraged executives and employees at all levels to realize the importance of workplace safety and focus on reducing workplace accidents. It promotes better health while employees work happily and reduce work stress.
6. Accident Predictive Technique activity
focused on creating safety behaviors for employees leading to the creation and improvement of the organization’s safety culture. The activity was organized with employees in the Company’s operating areas to create employee participation. In the work of each day, regular inspections were planned, starting from the operational method, machine conditions, chemicals, and work-related environment as well as the operator. There was a system to follow up and take corrective action in a timely manner, making employees aware about safety including identifying unsafe behaviors leading to preventive measures before accidents occur.
In 2022, the goals and KPIs have been determined. Executives and all employees of the operation function must participate in such activity on an ongoing basis. According to the assessment, it was found that 90.82% of employees in the operation function were continuously involved in the activities and achieved the set goals, with 9.18% of employees in the operational function failed to meet the set goals.
Technology and machine Environment Chemical People
SUSTAINABILITY REPORT 2022 092
7. Behavior-Based Safety (BBS) Cultivation Project
The Company places importance on and promotes the organization to have a culture of safety. Therefore, it has organized to have a Behavior-Based Safety (BBS) activity project to provide employees with knowledge in the principles of safety behaviors creation, communication and motivation techniques to create safety behavior, observation techniques to prevent recurrence of unsafe behavior, and its efficient implementation. The executives focus on the organization to have a safety culture that arises from the safety attitude and good awareness of the employees in the organization, which is the principle of good safety behavior. The activities were divided into 2 parts:
1. Training on Behavior-Based Safety (BBS) was organized for executive and supervisory levels.
2. Activity to search for hazard and risk in workplace was organized for employees working at the Head Office (East Water Building) by requiring employees to report events or take pictures of situations that may cause accidents within the East Water Building such as Unsafe Act, Unsafe Condition, Accident, Incident, and Near miss. The objective was to detect danger in the workplace and to prevent potential dangers.
8. Workplace Safety Audit
8.1 Measurement of light: The Company inspected the lighting in the workplace once as follows:
Based on the inspection of lighting in the workplace, the Company has setup remedial plan, which would be implanted in 2023.
8.2 Working equipment: The Company has checked the working equipment everyday including Motor, Pump, Accessory Pump, Valve system, Electrical system, Fire Alarm system, Control SCADA/Instrument, flowmeter, online water quality meter, etc. It was found that they are in normal condition and ready to use.
8.3 Fire protection equipment: The Company has arranged for the provision of fire protection equipment by supplying hand-held fire extinguishers, installing a fire alarm system, preparing fire escape routes, installing hand-held fire extinguishers, along with regularly inspecting all kinds of safety equipment as categorized below:
1. Inspection form of hand-held fire extinguisher (FM_Por_400-017)
2. Inspection form for portable gas detector (FM_Por_400-018)
3. Inspection form for emergency lights and fire escape signs (FM_Por_400-020)
4. Inspection form for manual fire alarm device (FM_Por_400-031)
5. Inspection form for automatic fire extinguishing equipment (FM_Por_400-032)
8.4 Personal protective equipment: The Company provided employees with personal protective equipment (PPE) that meets standards. Before receiving the equipment, the Company requires the employees to study details of the use of PPE and how to take care of it such as safety shoes, safety hat, earmuffs, safety glasses, and leather gloves.
Head Office Chachoengsao Chon Buri Rayong Spotting-on Inspection Area Inspection Daytime Daytime Passed Standard (point) Passed Standard (point) Passed Standard (point) Passed Standard (point) Not Passed Standard (point) Not Passed Standard (point) Not Passed Standard (point) Not Passed Standard (point) 218 19 24 103 114 15 13 52 N/A 14 15 89 N/A 15 11 49 15 6 1 8 41 0 4 4 N/A 11 10 22 N/A 0 6 7 Nighttime Nighttime
093
8.5 Leakage of hazardous substances: Chemical used by the Company is only Sodium Hypochlorite. The Company has established a chemical storage area in accordance with Ministerial Regulations prescribing standards for management and operation of safety, occupational health, and working environment regarding hazardous chemicals B.E. 2556 (2013). The Company has inspected storage area for leakage chemicals monthly. There is a report of a list of hazardous chemicals with details of the safety information of hazardous chemicals (Sor Or.), a report of measurement and analysis of the concentration of hazardous chemicals in the atmosphere of the workplace and the hazardous chemicals storage area (Sor Or.3), and declaration form of producers, importers, exporters, or persons in possession of hazardous substances under the responsibility of the Department of Industrial Works (Wor Or. Or Kor 7) as required by law.
(Disclosure 305-6)
In 2022, no chemical spills were found, and a contractor was hired to inspect airborne emissions to confirm that, in addition to physical inspection, there was no leakage (airborne) that could not be physically detected. There is also an annual chemical spill rehearsal with relevant parties. (Disclosure 306-3
Emergency Response Process in Case of a Chemical Spill

Employees who witnessed a chemical spill shout to notify their nearby colleagues and took action to notify section head and safety officials.
Section head inspects the incident area
Assigned person blocks off the incident area
The equipment preparation team prepares equipment for the storage of chemical spills and personal safety equipment. The chemical handling team wears personal safety equipment and follows chemical spill handling procedures.
Search for accident victims
Under control
Namely
Pollution Control Department Tel. 1650
Department of Labor Protection and Welfare Area 9 Tel. 02-513-7922
Department of Environment and Sanitation Chatuchak District Office Tel. 02-513-9947
Bangkok Fire and Rescue Department Tel. 199
Notify the HR department for first aid and take to the hospital.
Report to supervisors by hierarchy
Section Head
Division Head
Section Head
Division Head Safety Officer
Professional Level Meeting to make summary report
Report to supervisors by hierarchy
Safety officer professional level/ HR Department notify government agencies requesting for help
Safety officer professional level/Division Head
Blockage to prevent chemical leak to neighbouring communities
Section Head report to Division Head Coordinate safety officer professional level and notify public relations Out of control
SUSTAINABILITY REPORT 2022 094
Emergency Management
The Company placed emergency management as one of its priorities. To prepare for any incidents and mitigate any potential impact on the Company’s employees and properties, the Company tool relevant actions in 2022 as follows:
1. Preparing a Business Continuity Management (BCM) manual and a Business Continuity Plan (BCP); and testing the BCP at the Head Office and operation control.
The Company tested the completeness of the BCP as well as the knowledge and understanding of functional duties and responsibilities. The Company ensured the readiness of its information system and operating systems, alternate workplace, and the communications between the employees working from home, internal units, and external agencies.
2. The Company’s annual firefighting and evacuation drills were divided into 2 areas as follows:
Head Office area, East Water Building
The drills were divided into 2 sessions i.e., firefighting and evacuation drill at night and during business hours.
All operating areas (Rayong, Chon Buri, and Chachoengsao)
These were to prepare for evacuation practice, fire protection system testing in case of an incident, with government agencies, fire stations, police stations, hospitals, training agencies, and neighboring buildings cooperated and supported the drills, in which the objectives of the drills were accomplished.
3. The Company’s annual chemical spill emergency drills were conducted to prepare for hazardous chemical or fuel spill operations, as well as waste management in accordance with the Ministerial Regulations.
095
CONSTRUCTION IMPACT RESPONSIBILITY
(Disclosure 305-7, 413-1, 413-2)
The construction projects complied with the guidelines for project management efficiency improvement regarding air pollution prevention and construction environmental impact mitigation. The standards for acceptance of the road restoration works along the raw water pipeline were met. The representatives of the land owner agencies that permitted the construction projects also joined the inspection and certification of work. The Company held meetings with contractors and representatives of the land owner agencies to notify them about the onsite construction operations. In the case of any impact, the Company would jointly identify problem, root causes, and solutions to the problems as well as closely monitor progress updates on a weekly basis.
The construction projects were located inside and outside of the Company’s area, such as the Government sector areas and laying of pipeline through the communities’ areas. The construction process would commence subject to authorities’ approval and communities’ endorsement to prevent any impacts on the communities and the environment. The Company strictly controls its operations in accordance with the work control and safety standards of relevant departments. In 2022, the Company carried out 4 construction projects as follows:
1. The project to enhance efficiency of water distribution at the Nong Plalai-Nong Kho Pump Station 2
To enhance efficiency of the water distribution to water users in Chon Buri and Rayong.
1.1 The construction of a 10-km pipeline from the Highway 3191, Khao Noi Intersection, Ta Sit Subdistrict, Pluak Daeng District, Rayong to Hemaraj Eastern Seaboard Industrial Estate 3, Nong Sua Chang Subdistrict, Nong Yai District, Chon Buri.
1.2 The construction of a raw water floating pump station in the Nong Plalai reservoir at the Nong Plalai Operation Office.
2. The construction project for the raw water pipeline Khlong Luang reservoir –Chon Buri
To add an additional water supply source in the service area of the Company with the capacity of not less than 20 million cubic meters per year as part of the support for the government policy on the Eastern Economic Corridor (EEC).
2.1 The construction of a floating pump station in the Khlong Luang Rachalothorn reservoir at a government agency’s site.
2.2 The construction of a pressure booster station and an elevated water tank in the Company’s site.
2.3 The construction of a water pipeline with a diameter of 1,200 mm and a length of 45-20 km. in the areas of government agencies and local communities along the roads under responsibility of the government agencies concerned.
No complaint No complaint The work was completed. The work was completed. The work is expected to complete in February 2023. Project Objective Details Complaint Duration SUSTAINABILITY REPORT 2022 096
3.
To provide utility services within the area of the EECa U-Tapao International Airport, Rayong
3.1 The construction of tap water production system
3.2 The construction of tap water reserve tank with a capacity of 30,000 cubic meters
3.3 The construction of wastewater treatment system
3.4 The construction of electrical and control systems
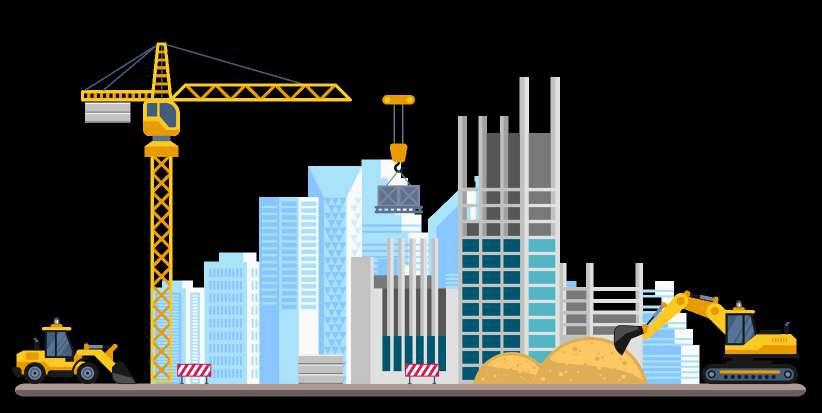
The work is expected to complete in November 2023.
To support the water demand in Pluak Daeng area, Rayong, and Bo Win and Laem Chabang area, Chon Buri, including current and new customers in the future
4.1 The construction of raw water pipeline with diameters of 1,600 mm., 1,400 mm., 1,200 mm., 900 mm. and 500 mm., with a total length of approximately 65 km.
4.2 The construction of Pressure Boosting station
4.3 The construction of electrical and control systems
4.4 The construction of Head Tank
The work is expected to complete in mid of 2023.
The work is expected to complete at the end of 2023.
The project to provide total water solution service to U-Tapao International Airport area.
4. The construction project for Nong Plalai – Nong KhoLaem Chabang pipeline
No
No
No
complaint
complaint
complaint
Duration 097
Project Objective Details Complaint
COMMUNITY SUSTAINABILITY PROJECTS
(Disclosure 203-1, 413-1)
The Company conducted sustainability activities to support the communities’ quality of life, access to clean water, and sufficient water supplies for consumption and agriculture based on shared water management with all sectors. Examples included community relations activities, spaces for sharing the Company’s new construction projects, meetings with water users, and satisfaction surveys of communities and government authorities on an annual basis. These activities helped the Company to understand the communities’ wants or expectations which would be inputs used for strategic planning and project improvement on an ongoing basis. Also, the Company developed Line@ and Facebook Page “East Water CSR” channels to help speed up communications and build a mutual understanding with the communities, which helped fix or relieve difficulties of the communities efficiently.
Project targets
• To increase green zones of upstream forest by 25% of the community forest.
• To integrate water management to be sufficient for all sectors.
Community relations Activities
• Natural Resource and Water Resource Restoration
Upstream
Water Utility and Environmental Conservation Promotion Projects
Midstream
• To reduce water pollution problems that affect water quality in public water sources by increasing the Dissolved Oxygen (DO) value of wastewater before entering the public water to be more than 4.0 mg/liter.
Satisfaction surveys
Companygovernment agencycommunity partnership
Spaces for sharing new construction projects
Execution of community well-being improvement projects and support for public activities
Learning Promotion Projects
• To promote youth learning at the vocational level to develop water management innovations, amounting to 4 projects per year.
• To create an agricultural learning center according to the sufficiency economy philosophy
• the students with disabilities who passed the computer training shall be successfully hired by business organizations.
Meetings with water users, communities, and government agencies
Well-being Promotion Projects
• To create mutual understanding and build good relationships between the Company, government agencies, and communities.
Community satisfaction score of 2022
Downstream
• East Water Conservation Network
• Community tap water system production control and maintenance (integrated with the Fix it Center project)
• CSR activities for communities along the raw water pipeline
• Water for Communities
• Wastewater treatment systems in pilot school canteens
Vocational level
General Public
People with disabilities
• Water-air aerator prototype
• The East Water Sufficiency Economy Learning Center in Khlong Kuen District
• Computer training program for students with disabilities
• Vocational trainings (reducing expenses and increasing income according to the sufficiency economy philosophy)
• Supporting public activities
• Annual Buddhist robe offering ceremonies
• Friendship football matches
92.40% equals
SUSTAINABILITY REPORT 2022 098
To attain the goals of managing sufficient water supplies for all sectors, improving the well-being of the communities for sustainable development, and building engagement with the communities, there were three main life quality improvement projects as follows:
1. Water Utility and Environmental Conservation Promotion Projects
2. Learning Promotion Projects
3. Well-being Promotion Projects
Benefit from Project Implementation
Company Community and Environment
The Company has been accepted by the communities, affecting the amount of water allocated by the government.
• The Company had business growth towards creating value with the communities.
There was water quality monitoring in raw water sources, which were the Company’s source of water supply.
There was a reduction of amount of wastewater from school canteen that will affect the water quality in the Company’s raw water sources, by educating about wastewater treatment and recycled water to pilot schools. Treated water could be reused at 40.00% of all wastewaters.
Upstream forests became fertile with more green zones; additional trees were grown at 25% of the community forest; and a balance in an ecosystem was preserved. Those favorably affected the hydrological cycle, leading to sufficient water supplies for all sectors, and appropriate water allocation to the Company.
• The Company together with schools and communities, monitored and kept tracks of water quality in different water sources providing raw water supplies for the Company. East Water conservation youth network was built with scholarships granted to 120 students per year.
• Integrated water management between the Company, government agencies, water users, and communities led to appropriate water allocation and sufficient supplies for the stakeholders, hence reduction in water shortages for all sectors.
Communities could access clean water for consumption at 9 communities per year (1,883 household).
Communities have access to raw water sources to produce tap water for 15 villages.
• The youth at vocational level learned professional repairs skills for the tap water systems of 9 village communities per year.
• Seven pilot schools implemented canteen wastewater treatment systems. The goal is to increase the number of pilot schools from 7 to 14.
Water pollution affecting water quality in public water sources was reduced through increasing the dissolved oxygen (DO) value in the released water to more than 4.0 mg/liter.
• The youth, educational institutes, and nearby communities appreciated the value of water resources and optimized water usage for cost saving and increase in agricultural productivity through watering trees with treated water.
Knowledge regarding water management innovation.
• Company’s area was utilized and the Company was accepted by local communities.
The Company developed innovations on water management and community support through 4 projects per year, and improved well-being of 4 communities per year.
• The youth at vocational level in four institutes were equipped with professional skills in creating water innovations with 20 scholarships granted per year.
The Company joined hands with government sectors and communities in establishing a sufficiency economy learning center to disseminate knowledge about agricultural farming according to the sufficiency economy philosophy and use of the Company’s land for the benefit of nearby communities.
• The Company together with the Office of the Nonformal and Information Education in Chachoengsao offered computer training courses for students with disabilities. Hence, more than 10% of the participants were hired by business enterprises.
The Company had more access and understanding of the context and needs of the community resulting in cooperation in developing projects to improve the communities’ well-being.
Communities’ well-being in terms of sports, religion, culture and Thai traditional, and environment were promoted.
Year (AD) 2020 2021 2022 87.20 89.40 92.40
099
Community and government agency satisfaction scores towards the company’s Corporate Social Responsibility (CSR) activities in 2020-2022
Water Utility and Environmental Conservation Promotion Projects
The Company realized the importance of the environment and the community well-being improvement. It received continued support from communities and government agencies in holding activities. There were three areas of activities: upstream, midstream, and downstream as follows:
The Company placed importance on the preservation of natural resources and environment in the area surrounding the reservoir and natural water sources in Chachoengsao, Chon Buri, and Rayong, as well as upstream forests that were five provinces bordering forest in the eastern region, therefore the Company advanced its collaboration in preserving upstream forest areas, keeping forest ecosystems fertile, and maintaining a balance of a hydrological cycle, as well as monitoring changes in water quality in different water sources of Chachoengsao, Chonburi, and Rayong. There were 2 projects in collaboration with local communities as follows:
1. Natural Resource and Water Resource Restoration
Targets
• To distribute 20,000 seedlings per year
• To increase green zones in the five provinces bordering community forest in the eastern region by growing additional trees at 25% of the community forest annually.
• To absorb carbon dioxide
• To maintain the balance of the ecosystem and preserve aquatic animals in the mangrove forest of the Bang Pakong River.
Implementation Period 2011 - Present
Implementation in 2022
The Company cooperated with network of the five provinces bordering community forest in the eastern region to maintain community forest, i.e. Ban Khlong Yai Thai community forest, Khun Song Subdistrict, Kaeng Hang Maeo District, Chanthaburi, by organizing activities such as making survey route around community forest, creating a forest fire line, taking care of the forest, as well as organizing activities to plant additional forests with 1,950 trees, increasing green area by more than 5 Rai (green area is calculated from 400 trees/Rai), and giving away 20,000 seedlings/year. The Company also cooperated with government agencies and local communities organized tree planting activities in other activities totaling 4,500 trees. This resulted in the absorption of 238-396 tons of carbon dioxide per year (one tree absorbs 9-15 kg of carbon dioxide per year on average)
Support SDG Goals 13.3, 15.1, 15.2


2. East Water Conservation Network
Targets
• To develop 120 young leaders annually under East Water Conservation Network
Implementation Period 2014 - Present
Implementation in 2022
• The Company granted scholarships to 120 youths
• The Company granted water quality inspection funds to organize water quality monitoring and inspection activities at 6 locations (canals and rivers in Ban Pho District, Chachoengsao, canals and rivers in Pluak Daeng District, Rayong, Dok Krai Reservoir, Non Plalai Reservoir, Khlong Yai Reservoir, Prasae Reservoir) enabling the communities to be aware of changes in water quality each year to prepare a plan for protection and restoration of natural resources and water sources.
Support SDG Goals 4.4, 6.3, 6.6
Upstream
SUSTAINABILITY REPORT 2022 100
The Company is committed to promoting and improving the well-being, in terms of water utilities, of communities along the Company’s raw water pipeline. This has been done through a variety of wellbeing development projects as appropriate and needs of communities in each area. The objective was to allow communities along the Company’s raw water pipeline to have access to clean water sources for consumption and agricultural equally. In addition, the Company has partnered with the communities, government agencies and water users along its raw water pipelines to enter MOUs to better the well-being of such communities This reflected the Company’s capability on water management and corporate social responsibility. There were 3 projects in collaboration with relevant agencies as follows:
1. Community tap water system production control and maintenance (integrated with the Fix it Center project)
Targets
• 9 communities had access to clean water source for consumption
• Communities gained knowledge on sustainable community waterworks management
Implementation Period 2018 - Present
Implementation in 2022
The Company cooperated with the vocational institutes of the eastern region to organize a project to control the production and maintenance of the community water supply system and integrated with the Fix it Centre project under the supervision of educational institutions consisting of Na Yai Am Vocational College, Chanthaburi Technical College, Trat Technical College, Ban Khai Technical College, Rayong Technical College, Maptaphut Technical College, Soi Dao Vocational College, Pattaya Technical College, Sattahip Technical College. This enabled 9 communities in Kaeng Hang Maeo District, Chanthaburi, and Phanat Nikhom District, Chon Buri with a population of 1,883 households to have access to clean water sources for consumption. The Company also organized practical training project “Sustainable Community Waterworks Management” at the Public Hall, Khao Wongkot Subdistrict Administrative Organization, Khao Wongkot Subdistrict, Kaeng Hang Meo District, Chanthaburi. There were 24 people from communities in Kaeng Hang Maeo District attended the training.
2. CSR activities for communities along the raw water pipeline
Targets
• To open 15 community water distribution points covering more than 4,000 households to help and alleviate suffering from the drought situation in the area.
• To provide budget support to help communities along the raw water pipeline to have access to clean water sources for consumption and agriculture.
• To have no objection to the amount of raw water allocated by the government
Implementation Period 2015 - Present
Implementation in 2022
1. The Company supported water for consumption to communities along the pipeline during drought situation by installing 15 raw water distribution points to the village waterworks amounting to 1,758,169.60 cubic meters.
2. The Company supported projects to improve communities’ well-being in terms of water utilities, society, and environment, to communities along the raw water pipeline connecting Prasae Reservoir – Khlong Yai Reservoir, Prasae – Nong Plalai, and communities around the Bang Pakong River, Chachoengsao as follows:
2.1 CCTV installation project at Pump Stations of Prasae Water Transmission and Maintenance Project, Chum Saeng Subdistrict, Wang Chan District, Rayong.
2.2 Contracting service project for the control of the right hand side pump station controller, Chum Saeng Subdistrict, Wang Chan District, Rayong.
2.3 Weir and canal repair project, Plong Ta Iam Subdistrict, Wang Chan District, Rayong.
2.4 Food project for volleyball athletes at Wang Chan Witthaya School, Chum Saeng Subdistrict, Wang Chan District, Rayong.
2.5 Project requesting budget support “Wang Chan people do not leave each other“ Chum Saeng Subdistrict, Wang Chan District, Rayong.
2.6 Dam repair project in the pump plant area, zone 2, section 3, Moo 5, Wang Chan Subdistrict, Wang Chan District, Rayong.
2.7 Pipeline repair project, zone 2, section 2, Plong Ta Iam Subdistrict, Wang Chan District, Rayong
Support SDG Goals 4.4, 6.3, 6.4, 6.6
SDG Goals 4.4, 6.3, 6.4, 6.6
Support
Midstream 101
SUSTAINABILITY REPORT 2022 102
3. Water for Communities
Targets
• To support community activities by providing clean water for consumption
• To relieve community difficulties from local droughts
Implementation Period 2000 – Present
Implementation in 2022
Down stream
1. Wastewater treatment systems in pilot school canteens
Targets
Supported SDG Goals

1. The Company supported drinking water for communities and government agencies to organize public activities in the amount of 382,381 liters.
6.3, 6.4, 6.6 Supported
• To have 14 pilot schools at diamond level (2 schools per education area) within 2023
• The dissolved oxygen (DO) in the treated water shall be higher than 4.0 mg/liter.
• To school shall be able to reuse the treated water from their canteen at 40% of wastewater.

• The school shall integrate wastewater treatment system knowledge as part of more than three core subjects.
Implementation Period 2014 - Present
Implementation in 2022
2. The Company supported 3,580,000 liters of water for consumption and agriculture through its water tubes to alleviate suffering during the drought situation. SDG Goals 2.1, 4.4, 6.3, 6.6
The Company has foreseen the water pollution caused by the discharge of wastewater from each sector into natural water sources. Thus, as a key driver of water allocation to different sectors, the Company joined hands with 7 Primary Educational Service Area Offices in Chachoengsao, Chon Buri, and Rayong in carrying out the canteen wastewater treatment project on pilot schools to raise awareness among the youth and nearby communities on maintenance of water sources, preservation of water resources, and optimization of water usage.
The Company cooperated with 7 Primary Educational Service Area Offices in Chachoengsao, Chon Buri, and Rayong in providing knowledge about the school canteen wastewater treatment and granting funds to further develop innovations to manage wastewater. As a result, in 2022 the number of pilot schools with a diamond level school canteen wastewater treatment system increased from 7 to 14. Such activities have improved the quality of treated water. The dissolved oxygen (DO) value was more than 4.0 mg/liter, for 1,280,240 liters of water can be reused in the amount of 833,439 liters. Treated water could be used in various school activities such as watering the plants, bio-fermented water, multi-purpose floor cleaning solution, ingredients in production of paving stones, etc., accounted for 65.10% of the effluent from canteen. In addition, fat waste from wastewater treatment system can also be processed into mosquito repellant candles, soap for washing, and compost. Moreover, the schools have transferred knowledge within the school through teaching subjects in more than 3 core subjects, and transferred knowledge to the outside and communities around the school through the publicity of information and knowledge on the school’s website, meetings, seminars, networking, and field trips, etc.
2. Learning Promotion Projects
The Company was committed to the promotion of education and capacity building of younger generations and the communities so that they could have professional skills required for their occupations. Trainings and curriculum were developed for the youth and communities through three main projects as follows:
1. The Community Innovation and Maintenance of Water-air Aerator
Targets
• To ensure that 4 water-air aerator prototypes installed for the communities can work efficiently.
• To have 4 community innovation projects.
• To improve well-being and environment for 4 communities

Implementation Period 2014 - Present
Implementation in 2022
1. Chachoengsao Technical College built and installed aerators for water circulation using solar energy at the raw water supply pond for village waterworks at Moo 5, Sib Ed Sok Subdistrict, Ban Pho District, Chachoengsao.
2. Pattaya Technical college built and installed water and air aerators using solar energy at the Municipal Health Park, Non Plalai Subdistrict,Bang Lamung District, Chon Buri
3. Ban Khai Technical College built and installed a mini smart farm BK Tech at Wat Ang Kaew, Nong La Lok Subdistrict, Ban Khai District Rayong,
4. Rayong Technical College built and installed water treatment bicycles at the public canal in Sri Muang Park, Noen Phra Subdistrict, Mueang District, Rayong.
2. The East Water Sufficiency Economy Learning Center in Khlong Kuen District
Targets
• To maintain one sufficiency economy learning center with the application of water science to water management for improved agricultural productivity according to the sufficiency economy philosophy; and to support the center as a tourist spot unique to the district.
• To have more than 100 visitors/year
Implementation Period 2012 - Present
Implementation in 2022
The Sufficiency Economy Learning Center in Khlong Kuen District managed the area according to the King’s science Khok Nong Na Model with following activities.:
1. Activities to nourish the soil after the harvest season have been organized; round 1 during January – April, which is the dry season, round 2 after the harvest season, during November – December of every year.

2. Activities to grow short-lived crops to generate income such as galangal, lemongrass, vegetable, basil, sweet basil, eggplant, etc. have been organized.
3. Activities to grow long-lived plant such as coconuts, mangos and bananas as the main trees that generate regular income for the learning center have been organized. Currently the learning center has 100 coconut trees and 50 mango trees and banana at the ridge area.
4. Rice planting activities have been organized, which the learning center can do rice farming twice a year, in the paddy season from July – October, and the off-season from November to January.
5. Study tour activities have been organized for government and private agencies to visit and study and participated activities in the learning center for 475 person.
Supported SDG Goals 4.4, 6.3, 6.6 Supported SDG Goals 2.1, 2.4, 4.4, 6.3, 6.6, 8.9 103
3. Computer training program for students with disabilities
Targets
Supported SDG Goals 4.5
• To provide students with disabilities with computer literacy and the ability to use computers with the success rate of 100% of the total participants.
• 10% of the training participants of each class shall be successfully hired by business organizations.
Implementation Period 2012 - Present
Implementation in 2022
1. There were 127 students with disabilities participating in the training. All of them successfully gained computer literacy and the ability to use computers.
2. The Company has followed up with students with disabilities who have passed training in 2021, 4 of them were able to work in the workplace, and 37 had private occupations (19 merchant/private occupation, 2 mechanics, and 12 farmers.
3. Well-being Promotion Projects
Based on its community management strategies and community outreach, the Company held a series of relations activities with communities and government agencies as a way to build a mutual understanding with the communities. The Company also listened to the comments, news and information of the communities for further improving its business processes or adjusting its CSR activities for the communities’ better well-being in the future.
1. Vocational trainings (reducing expenses and increasing income according to the sufficiency economy philosophy) Implementation in 2022
Implementation in 2022
• Total of 32 trainings were facilitated in Chachoengsao, Chon Buri, and Rayong with 1,250 participants.
• Facebook live vocational training via East Water CSR Facebook page was organized for 8 times with 196 participants.
3. Annual Buddhist robe offering ceremonies
Implementation in 2022
1. Khao Bang Phra Temple, Bang Phra Subdistrict, Si Racha District, Chon Buri
2. Ban Kluay Temple, Khlong Kuen Subdistrict, Khlong Kuen District, Chachoengsao.
2. Friendship football matches 2022
Implementation in 2022
Friendship football matches were organized 6 times in:
1. Bang Pakong District and Khlong Kuen District, Chachoengsao.
2. Sri Racha District, Chon Buri
3. Pluak Daeng District, Ban Chang District, and Mueang District, Rayong
4. Supporting budget for public activities
Implementation in 2022
1. A donation budget was allocated to help flood victims
2. A budget is allocated to support reparing of the building of Ban Plong Ta Iam Subdistrict Health Promoting Hospital
3. The Company supported the organizing of music festivals and seafood festival, Ban Phe – Koh Samed.
4. The Company supported local tradition activities.
5. The Company supported education, sports, and religion.
SUSTAINABILITY REPORT 2022 104
30 Years of East Water
Returning fertility to the forest, bringing smiles to everyone at Ban Nong Muang Community, Wang Chan District, Rayong.
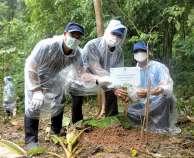
From the past to present, it has been more than 5 years that the Company has collaborated with the network of the five provinces bordering community forest in the eastern region and Ban Nong Muang community organized a project to maintain and restore Ban Nong Muang Community Forest with participation in accordance with “Pracha Rath” approach. The objectives were to create humidity, fertility, and maintain balance of the upstream forest ecosystem in order to balance the water cycle, as well as jointly passing on the concept of water resource conservation for endless water utilization.”
In 2022, on the occasion of the 30th anniversary, the Company organized the “30 Years of East Water, Returning the Green Forest and Sustainable Youth Development” activities with the Company’s stakeholders visiting the area to do activities to increase Ban Nong Muang Community Forest. The activities emphasized on building model communities from upstream to downstream towards cooperation to improve the community’s well-being and environment sustainably. It also cultivated awareness among youths about the preservation of water sources through activities such as upstream forest planning, weir making activities, donating fish species to water sources, rope climbing bases climbing activities, repairing and painting of playgrounds activities, and painting school buildings and walkway activity, etc.
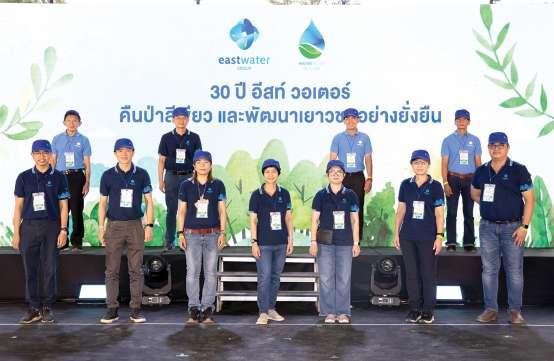
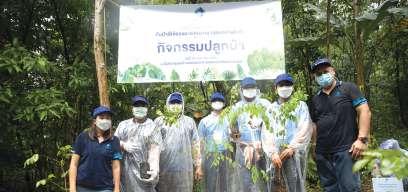
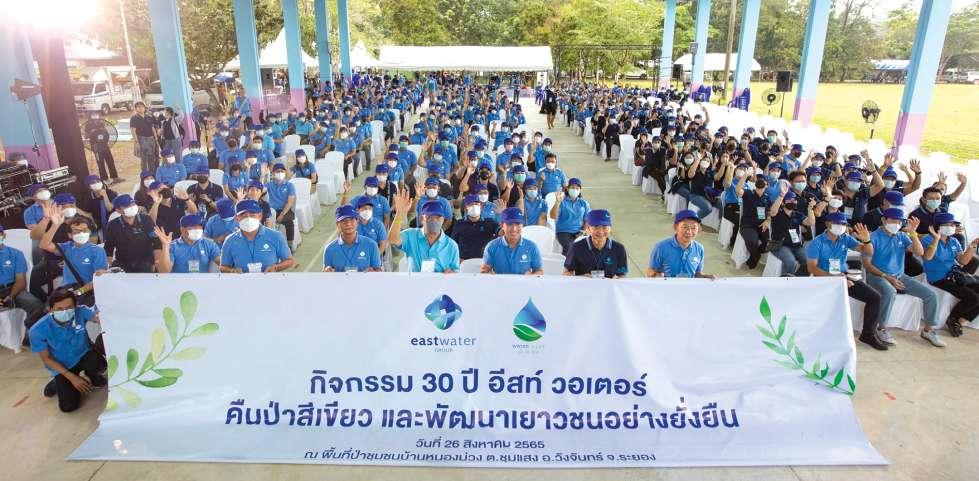
105
Social and Environment Activities of UU PCL.
UU PCL. have given importance to business operations along with social responsibility and local communities. In 2022, the COVID-19 situation has subsided, but the UU PCL. still considered safety and carried out various activities under the safety measures announced by the government. The activities were divided into 4 areas as follows:
1. Education Program: This was part of the “Water Loss Inspectors” with a focus on building the youth’s awareness about the environmental conservation and promoting students and learners’ knowledge about water and environment through class and outside class activities. The students and learners would learn from hands-on practices and gained awareness about water and environmental conservation. Water supply entities in the areas were ready to be a local water learning center. This helped build up good relationships between EWG and the communities. In 2022, there were activities in collaboration with different local schools as follows:
Lom School, Mueang District, Ratchaburi
Wat
Ban Sattahip School, Sattahip District, Chon Buri Province
Wat Maha Wanaram School (Wat Makham Tia), Mueang District, Phitsanulok
Ban Bo Win School (Likhit Rat Bamrung), Bo Win District, Chon Buri
Wat Subannaram School, Mueang District, Nakhon Sawan
Wat Noen Phra School, Mueang District, Rayong
2. Community Support Program: This was part of the “Rak Tuk Yot Lot Nam Soon Sia (Saving All Drops of Water to Reduce Water Loss) project where a team of professional and experienced technicians from the UU PCL. helped renovate tap water system to be in a ready-to-use condition. In 2022, the UU PCL. have extended the scope of operations to cover other government agencies apart from schools. The activities were held with different local agencies as follows:
Ban Tha Kham Tang Trong Chit 10 School, Bang Pakong District, Chachoengsao
Wat Phra Non School, Mueang District, Nakhon Sawan
Ban Khai Police Station, Rayong

Tao Than Subdistrict Health Promoting Hospital, Tao Than Subdistrict, Sattahip District, Chon Buri
 Wat Pratunam Tha Khai School, Mueang District, Chachoengsao
Wat Phai
Bangwua Sermwit School, Bang Pakong District, Chachoensao
Wat Pratunam Tha Khai School, Mueang District, Chachoengsao
Wat Phai
Bangwua Sermwit School, Bang Pakong District, Chachoensao
SUSTAINABILITY REPORT 2022 106
3. Environmental Program: There were many dimensions of activities with the aim to reducing global warming, increasing green zones in communities and residential areas, restoring a balance in nature and environment, raising awareness and a sense of appreciation and protection of natural resources, and promoting natural conservation. In 2022, despite the COVID-19 pandemic, the UU PCL. still implemented activities in line with the situation as follows:
Improvement and Development Project of Somdet Phra Srinagarindra Park, Mueang District, Rayong.
Conservation, Development, and Increase of Green Space Promotion Project, Office of Natural Resources at Ban Bueng Ton Chan School, Ban Khai District, Rayong.
4. Charitable Program: This was under the guidelines for supporting public activities of UU PCL. under the specified budget framework to be completely correct and in accordance with the regulations of the UU PCL. and the principles of good corporate governance.
In addition, the UU PCL. have encouraged executives and employees to volunteer in carrying out activities that are of public benefit, encouraging them to do good deeds and create a good sense of social and community responsibility. The UU PCL. had organized activities such as providing opportunity for employees to participate in the donations and provide assistance to the underprivileged or victims, and participating in the distribution of drinking water in various important government activities, etc.
UU Sang Pa Rak Ton Nam (Buiding and Conserving Upgstream Forest) Project for 2022 at Pluak Daeng District, Rayong.
107
Comparison of satisfaction level of raw water customers (direct) in each aspect for 2020-2022
Comparison of satisfaction level of raw water customers (indirect) in each aspect for 2020-2022
5.0 4.5 4.0 3.5 3.0 2.5 2.0 1.5 1.0 0.5 0
ANNEX
2020 2021 2022
2020 2021 2022 Water distribution service Water grid management quality News and information service 3.50 4.22 4.13 3.41 4.33 4.50 3.66 3.11 3.06 Water distribution service Repairs and maintenance service Service provision News and information service Response to customer needs 3.99 4.26 4.31 4.20 3.99 4.48 4.64 4.64 4.62 4.54 4.47 4.72 4.53 3.51 5.0 4.5 4.0 3.5 3.0 2.5 2.0 1.5 1.0 0.5 0 4.57 SUSTAINABILITY REPORT 2022 108
Comparison of satisfaction level of total water solution customers in each aspect for 2020-2022
Comparison of satisfaction level of tap water customers in each aspect for 2020-2022
Overall satisfaction Tap water quality and distribution Communication and complaint handling Support, and repairs and maintenance Metering and bill payment
5.0 4.5 4.0 3.5 3.0 2.5 2.0 1.5 1.0 0.5 0
2020 2021 2022 3.50 3.57 3.30 2.70 3.25 4.45 4.63 4.70 4.50 4.25 4.29 4.43 4.43 4.57 4.43 5.0 4.5 4.0 3.5 3.0 2.5 2.0 1.5 1.0 0.5 0 Water distribution service Repairs and maintenance service Service provision News and information service Response to customer needs 4.62 4.56 4.56 4.82 4.71 4.66 4.67 4.64 4.86 4.73 4.64 4.73 4.70 4.85
2020 2021 2022 4.51 109
Table of Main Water Sources Utilized by the Company in 2021 - 2022
(Disclosure 303-1, 303-3, 303-5:2018)
Volume of Water
Rayong areas
• To supply water to plantation areas in Prasae project
• To prevent saltwater intrusion
• To prevent floods in Klang District, Rayong
• To reserve raw water for eastern seaboard industrial estate
• Volume of water flow into the reservoir was 203.46 million cubic meters.
(Source: Prasae Water Distribution and Maintenance project)
• To supply water to plantation areas in the Ban Khai Irrigation project
• To prevent floods in Rayong
• To supply water for consumption and industrial purposes with a future plan to supply water to Sattahip areas for industrial area expansion projects
• To serve as fish breeding grounds and areas for tourism and recreation
• Volume of water flow into the reservoir was 279.62 million cubic meters
• To supply water to plantation areas in the Baan Kai Irrigation project
• To prevent floods in Rayong
• To supply water for consumption and industrial purposes
• To serve as fish breeding grounds and areas for tourism and recreation
• Volume of water flow into the reservoir was 129.54 million cubic meters.
(Source: Royal Irrigation Department)
• To manage water supplies to prevent droughts and floods
• To pump water to Thab Ma pond for reserve purposes
• To support agriculture in 8,500 Rai of land
• To supply water for consumption and industrial purposes
• To serve as fish breeding grounds and areas for tourism and recreation
• Volume of water flow into the reservoir was 55.40 million cubic meters.
(Source: Royal Irrigation Department)
• To supply water to current creeks for agriculture in 7,500 Rai of land
• To supply water for consumption and industrial purposes
• To serve as fish breeding grounds and areas for tourism and recreation
• Volume of water flow into the reservoir was 30.46 million cubic meters.
(Source: Royal Irrigation Department)
• To maintain ecosystems
• To deter the intrusion of saltwater
Source: https://www.wri.org /our-work/project/aqueduct/
• To serve as a water source for consumption, agricultural, and industrial purposes
• Average volume of natural water for the whole year was 3,344 million cubic meters.
(Source: Large Scale Project Office, Royal Irrigation Department)
8.
Sources: https://www.wri.org /our-work/project/aqueduct/
1. Prasae Reservoir
2. Nong Plalai Reservoir
3. Dok Krai Reservoir
4. Khlong Thab Ma, Rayong River
Chon Buri areas
5. Bang Phra Reservoir
6. Nong Kho Reservoir Chachoengsao areas
7. Bang Pakong River (Water Stress)
Private water sources (Water Stress)
103 million liters 248.00 163.75 79.41 12 117.0 21.40-
9. Rainwater from Samnak Bok Pond Total
Surface water Storage Capacity Importance of Water Sources to Local Communities
SUSTAINABILITY REPORT 2022 110
103 million liters is equal to one million cubic meters.
During 2021-2022, the Company used water from Prasae-Khlong Yai pipeline of 9.07 million cubic meters and from Prasae-Nong Plalai pipeline of 2.66 million cubic meters.
During 2021-2022, the volume of water pumped from the Nong Plalai Reservoir exceeded the permitted limit since it was the management of the amount of overall water allowed in Rayong area, i.e., the total water used of Dok Krai Reservoir and Nong Plalai Reservoir did not exceed 236 million cubic meters.
The permitted water volume of 116 million cubic meters was more than the reservoir storage capacity as the water volume flow into the reservoir during the year was included.
The Company obtained a written permit for water consumption from Bang Phra reservoir for 8.00 million cubic meters. The Company also used water deposited in Bang Pakong River.
The Company had water pumping operations only in the rainy season according to criteria as mutually agreed upon by water users and Chachoengsao provincial authorities. A portion of water was diverted to Bang Phra reservoir for use during the dry season for Chachoengsao and Chonburi areas. In 2022, the Company pumped water from Bang Pakong River for distribution to Chachoengsao, and reserved the remaining water totaling 5.67 million cubic meters in Bang Phra reservoir.
The Company distributed water of 8.21 million cubic meters from private water sources to the areas in Chachoengsao and Chon Buri in the drought season in 2022.
This portion accounted for 3.78% of the total water in the Samnak Bok pond and was calculated based on a monthly average rainfall level x water surface area (Source: Average water rainfall levels from the Meteorological Department).
103 million liters 110 120.00 116.00 0 8.00 16.70 27.00 12.00 0 397.70 103 million liters 23.55 155.04 78.94 16.41 0 11.41 17.95 7.48 0.23 311.01 103 million liters 11.94 141.73 82.78 9.29 7.30 6.93 7.29 8.21 0.23 275.70 103 million liters 11.94 141.73 82.78 9.29 7.30 6.93 7.29 8.21 0.23 275.70 103million liters 0 0 0 0 0 0 0 0 0 0
Volume of Water under Management Allocated Water (as per Permit) Pumped Water 2021 Pumped Water 2022 Remarks Total Dissolved Solids (≤ 1,000 mg/liter) Total Dissolved Solids (> 1,000 mg/liter) 111
Table of Water Volumes in Water Sources Used by Subsidiaries for Tap Water Production in 2022
(Disclosure 303-3:2018)
Chachoengsao, Bang Pakong, Chon Buri, Rayong, Bo Win, Sattahip, Lakchai Muangyang, Nakhon Sawan
Water volume used for tap water production
Water volume used for tap water production; TDS≤1,000 mg/l
Water volume used for tap water production; TDS>1,000 mg/l
Volume of Tap water distributed from the production system
Volume of non-revenue water in the production system
Nong Kham, Ratchaburi, Hua Ro
Water volume used for tap water production
Water volume used for tap water production; TDS≤1,000 mg/l
Water volume used for tap water production; TDS>1,000 mg/l
Volume of Tap water distributed from the production system
Volume of non-revenue water in the production system
Remarks :
• The Rayong Waterworks used TS value of raw water instead of TDS value
• The Chonburi Waterworks did not check/measure TDS value. They used surface water value instead. This entity was in the same area as the Bo Win Waterworks with the TDS value of raw water not exceeding 1,000 ppm. Thus, it was considered that, based on qualities of raw water, the raw water in Chonburi came from the same source as that in Bo Win. Their TDS value should not exceed 1,000 ppm.
• The Hua Ro Waterworks did not check/measure TDS value. They used surface water value instead. This entity was in the same area as the Nakhon Sawan Waterworks with the TDS value of raw water not exceeding 1,000 ppm. Thus, it was considered that, based on qualities of raw water, the raw water in Hua Ro came from the same source as that in Nakhon Sawan. Their TDS value should not exceed 1,000 ppm.
• For Ratchaburi Waterworks, there was a problem of incorrect meter readings of raw water. Later on, the problem was fixed. Relevant values were calibrated and reset, and normal operations resumed.
Contract Parties The Subsidiaries Surface Water Surface Water 97,302,045.00 92,131,122.00 5,170,923.00 94,489,290.50 2,812,754.50 13,541,378.00 13,541,378.00 0 13,537,085.00 4,293.00
Water Provider Type of Water Source Water Volume (cubic meter)
Entity Description
Raw
Waterworks
SUSTAINABILITY REPORT 2022 112
Company’s Employee Information
(Disclosure 2-7:2021, 405-1)
Employee means a person who is employed by the Company as a permanent and contract employee. No temporary employee, daily employee, and part-time employee are hired
229 228 1 117 112 20 10 10 33 13 20 176 94 82 36 173 20 150 79 236 232 4 124 112 21 11 10 33 15 18 182 98 84 34 179 23 144 92 249 245 4 133 116 22 12 10 32 15 17 195 106 89 38 182 29 144 105 230 227 3 123 107 18 10 8 34 20 14 178 93 85 25 175 30 130 100 100 99.56 0.44 51.09 48.91 8.73 4.37 4.37 14.41 5.68 8.73 76.86 41.05 35.81 15.72 75.55 8.73 65.50 34.50 100 98.31 1.69 52.54 47.46 8.90 4.66 4.24 13.98 6.36 7.63 77.12 41.53 35.59 14.41 75.85 9.75 61.02 38.98 100 98.39 1.61 53.41 46.59 8.84 4.82 4.02 12.85 6.02 6.83 78.31 42.57 35.74 15.26 73.09 11.65 57.83 42.17 100 98.70 1.30 53.48 46.52 7.83 4.35 3.48 14.78 8.70 6.09 77.39 40.43 36.96 10.87 76.09 13.04 56.52 43.48 Details 2019 Number (person) Number (person) Number (person) Number (person) % % % % 2020 2021 2022
Total employees By type of employment Permanent employees Contract employees By gender • Male • Female By position level Executive • Male • Female Supervisory • Male • Female Operational • Male • Female By age Less than 30 years Between 30-50 years More than 50 years By region Central (Bangkok) Eastern (Chachoengsao, Chon Buri, Rayong) 113
Employment Rates of New Hires
Employee Attrition Rates
(Disclosure
401-1)
(Disclosure 401-1) Details Employment rates of new hires By gender • Male • Female By age Less than 30 years Between 30-50 years More than 50 years By region Central (Bangkok) Eastern (Rayong, Chon Buri, Chachoengsao) Employee attrition rate By gender • Male • Female By age Less than 30 years Between 30-50 years More than 50 years By region Central (Bangkok) Eastern (Rayong, Chon Buri, Chachoengsao) 23 17 6 10 13 0 13 10 15 7 8 2 10 3 10 5 20 12 8 5 13 2 5 15 13 5 8 2 7 4 13 2 31 25 6 18 12 1 13 18 18 14 4 3 13 2 11 2 15 10 5 2 10 3 10 5 34 20 14 8 19 7 22 12 10.04 7.42 2.62 4.37 5.68 0 5.68 4.37 6.55 3.06 3.49 0.87 4.37 1.31 4.52 2.26 8.47 5.08 3.39 2.12 5.51 0.85 2.12 6.36 5.51 2.12 3.39 0.85 2.97 1.69 5.68 0.87 12.45 10.04 2.41 7.23 4.82 0.40 5.22 7.23 7.23 5.62 1.61 1.20 5.22 0.80 4.66 0.85 6.52 4.35 2.17 0.87 4.35 1.30 4.35 2.17 14.78 8.70 6.09 3.48 8.26 3.04 9.57 5.22 2019 Number (person) Number (person) Number (person) Number (person) % % % % 2020 2021 2022 Details 2019 Number (person) Number (person) Number (person) Number (person) % % % % 2020 2021 2022 SUSTAINABILITY REPORT 2022 114
Maternity Leave Rates
Remark : * Employees returning to work after taking maternity leave
number of employees returning to work after taking maternity leave
** Total number of employees returning to work after taking maternity leave and worked with the Company for 12 months
Total number of employees returning to work for 12 months after taking maternity leave Total number of employees returning to work after taking maternity leave
Employee Remuneration Proportion (Female : Male)
Eastern (Rayong, Chon Buri, Chachoengsao)
(Disclosure
401-3)
(Disclosure
Employees
Employees
Total
107 4 4 4 N/A N/A N/A N/A N/A N/A N/A N/A N/A N/A N/A N/A N/A N/A N/A N/A N/A N/A N/A N/A N/A N/A N/A N/A 100 3.74 100 100 1.00 1.00 1.00 1.00 1.00 1.00 1.00 1.00 0.79 1.05 0.69 0.73 0.90 1.00 1.52 0.24
405-2) Total number of entitled employees
taking maternity leave
returning to work after taking maternity leave*
number of employees returning to work after taking maternity leave and worked with the Company for 12 months**
Number of employees returning to work Rate of Return = x 100
Total
= x 100
By age Less than 30 years Between 30-50 years More than 50 years By position level Executive Supervisory Operation By region Central (Bangkok)
Total
number of employees due to return to work after taking maternity leave
N/A N/A N/A N/A N/A N/A N/A N/A N/A N/A N/A N/A N/A N/A N/A N/A N/A N/A N/A N/A N/A N/A N/A N/A N/A N/A N/A N/A N/A N/A N/A N/A N/A N/A N/A N/A N/A N/A N/A N/A N/A N/A N/A N/A N/A N/A N/A N/A Details 2019 Number (person) Number (person) Number (person) Number (person) % % % % 2020 2021 2022 Details Number (person) Number (person) Number (person) Number (person) % % % % 2019 2020 2021 2022 115
Company’s Outsourced Worker Information
(Disclosure 2-8:2021)
Outsourced worker means a person who the Company employs through contract party by the type of employment contract.
Total outsourced workers
Labor contractor
Central (Bangkok)
Eastern (Rayong, Chon Buri, Chachoengsao)
Maid
Central (Bangkok)
Eastern (Rayong, Chon Buri, Chachoengsao)
Gardener
Central (Bangkok)
Eastern (Rayong, Chon Buri, Chachoengsao)
Security guard
Central (Bangkok)
Eastern (Rayong, Chon Buri, Chachoengsao)
Building management
Central (Bangkok)
Project contractors
Industrial Water Production Project, Amata City Industrial Estate
Nong Kho 2 Pipeline Project
U-Tapao Project
Raw Water Pipeline Khlong Luang – Chon Buri
Construction Project
Samnak Bok Pond improvement
Year 2022 Contract Type Female Male Total
Yearly contract Yearly contract 2-year contract 2-year contract 2-year contract Yearly contract 2-year contract Yearly contract 2-year contract Project contract Project contract Project contract Project contract Project contract 22 43 21 17 1 40 28 70 15 15 4 90 57 37 8 39 0 0 1 19 23 70 11 15 4 90 57 37 14 4 21 17 0 21 5 0 4 0 0 0 0 0
SUSTAINABILITY REPORT 2022 116
Subsidiaries’ Employee Information
(Disclosure 2-7:2021, 405-1)
Subsidiaries’ employee means a person who is employed by the Company as a permanent and contract employee. No temporary employee, daily employee, and part-time employee are hired.
Details Number (Person) Number (Person) Number (Person) Number (Person) Number (Person) Number (Person) % % % % % % Tap Water Business Tap Water Business Tap Water Business Wastewater Treatment and Recycled Water Business Wastewater Treatment and Recycled Water Business Wastewater Treatment and Recycled Water Business 2020 2021 2022 142 142 0 89 53 9 5 4 20 12 8 113 72 41 27 103 12 65 7 69 1 100 100 0 62.68 37.32 6.34 3.52 2.82 14.08 8.45 5.63 79.58 50.70 28.87 19.01 72.54 8.45 45.78 4.93 48.59 0.70 0 0 0 0 0 0 0 0 0 0 0 0 0 0 0 0 0 0 0 0 0 140 139 1 85 55 8 4 4 21 12 9 111 69 42 21 108 11 65 7 68 0 1 1 0 1 0 0 0 0 0 0 0 1 1 0 0 1 0 0 0 1 0 141 141 0 86 55 9 5 4 20 11 9 112 70 42 20 110 11 65 5 71 0 1 1 0 1 0 0 0 0 0 0 0 1 1 0 0 1 0 0 1 0 0 0 0 0 0 0 0 0 0 0 0 0 0 0 0 0 0 0 0 0 0 0 99.29 98.58 0.71 60.28 39.01 5.67 2.84 2.84 14.89 8.51 6.38 78.72 48.94 29.79 14.89 76.60 7.80 46.10 4.96 48.23 0 0.71 0.71 0 0.71 0 0 0 0 0 0 0 0.71 0.71 0 0 0.71 0.00 0 0 0.71 0 99.30 99.30 0 60.56 38.73 6.34 3.52 2.82 14.08 7.75 6.34 78.87 49.30 29.58 14.08 77.46 7.75 45.77 3.52 50.00 0 0.70 0.70 0 0.70 0 0 0 0 0 0 0 0.70 0.70 0 0 0.70 0 0 0.70 0 0 Total subsidiaries’ employee By type of employment Permanent employees Contract employees By gender Male Female By position level Executive Male Female Supervisory Male Female Operational Male Female By age Less than 30 years Between 30-50 years More than 50 years By region Central (Bangkok, Nakhon Sawan, Ayutthaya, Phitsanulok) Western (Ratchaburi) Eastern (Chachoengsao, Chon Buri, Rayong) Southern (Surat Thani) 117
Subsidiaries’ Employment Rates of New Hires
Employment rates of new hires By gender Male Female By age Less than 30 years Between 30-50 years More than 50 years By region Central (Bangkok, Nakhon Sawan, Ayutthaya, Phitsanulok) Western (Ratchaburi) Eastern (Rayong, Chon Buri, Chachoengsao) Southern (Surat Thani) 15 9 6 7 8 0 7 0 8 0 10.56 6.34 4.22 4.93 5.63 0 4.93 0 5.63 0 0 0 0 0 0 0 0 0 0 0 0 0 0 0 0 0 0 0 0 0 13 11 2 10 3 0 6 0 7 0 0 0 0 0 0 0 0 0 0 0 0 0 0 0 0 0 0 0 0 0 7.80 5.67 2.13 4.26 3.55 0 4.26 0 3.55 0 0 0 0 0 0 0 0 0 0 0 9.15 7.75 1.41 7.04 2.11 0 4.23 0 4.93 0 0 0 0 0 0 0 0 0 0 0 11 8 3 6 5 0 6 0 5 0 Details Number (Person) Number (Person) Number (Person) Number (Person) Number (Person) Number (Person) % % % % % % Tap Water Business Tap Water Business Tap Water Business Wastewater Treatment and Recycled Water Business Wastewater Treatment and Recycled Water Business Wastewater Treatment and Recycled Water Business 2020 2021 2022 SUSTAINABILITY REPORT 2022 118
(Disclosure 401-1)
Subsidiaries’ Employee Attrition Rates
(Disclosure 401-1) Employee attrition rate By gender Male Female By age Less than 30 years Between 30-50 years More than 50 years By region Central (Bangkok, Nakhon Sawan, Ayutthaya, Phitsanulok) Western (Ratchaburi) Eastern (Rayong, Chon Buri, Chachoengsao) Southern (Surat Thani) 23 19 4 9 12 2 10 0 5 8 16.19 13.38 2.81 6.34 8.45 1.40 7.04 0 3.52 5.63 0 0 0 0 0 0 0 0 0 0 0 0 0 0 0 0 0 0 0 0 12 10 2 4 6 2 6 0 6 0 0 0 0 0 0 0 0 0 0 0 0 0 0 0 0 0 0 0 0 0 7.80 7.09 0.71 3.55 3.55 0.71 4.96 0 2.84 0 0 0 0 0 0 0 0 0 0 0 8.45 7.04 1.41 2.82 4.23 1.41 4.23 0 4.23 0 0 0 0 0 0 0 0 0 0 0 11 10 1 5 5 1 7 0 4 0 Details Number (Person) Number (Person) Number (Person) Number (Person) Number (Person) Number (Person) % % % % % % Tap Water Business Tap Water Business Tap Water Business Wastewater Treatment and Recycled Water Business Wastewater Treatment and Recycled Water Business Wastewater Treatment and Recycled Water Business 2020 2021 2022 119
Subsidiaries’ Maternity Leave Rates (Disclosure
401-3:2016)
number of entitled employees
taking maternity leave
Employees returning to work after taking maternity leave*
Total number of employees returning to work after taking maternity leave and worked with the Company for 12 months**
Remark : * Employees returning to work after taking maternity leave
Number of employees returning to work
Total number of employees returning to work after taking maternity leave
= x 100
** Total number of employees returning to work after taking maternity leave and worked with the Company for 12 months
Rate of Return
Total number of employees due to return to work after taking maternity leave = x 100
Total number of employees returning to work for 12 months after taking maternity leave Total number of employees returning to work after taking maternity leave
Subsidiaries’ Employee Remuneration Proportion (Female : Male) (Disclosure
405-2:2016)
By age
Less than 30 years
Between 30-50 years
More than 50 years
By position level
Executive
Supervisory
Operational By region
Central (Bangkok, Nakhon Sawan, Ayutthaya, Phitsanulok)
Western (Ratchaburi)
Eastern (Rayong, Chon Buri, Chachoengsao)
Details Female Female Female Female Male Male Male Male Ratio 1 1 1 1 1 1 1 1 1 N/A N/A N/A N/A N/A N/A N/A N/A N/A N/A N/A N/A N/A N/A N/A N/A N/A N/A N/A N/A N/A N/A N/A N/A N/A N/A N/A N/A N/A N/A N/A N/A N/A N/A N/A N/A N/A N/A N/A N/A N/A N/A N/A N/A N/A N/A N/A N/A N/A N/A N/A N/A N/A N/A 0.89 0.92 0.38 0.96 0.85 0.96 0.96 0.84 1.26
Details 2019 Number (Person) Number (Person) Number (Person) Number (Person) % % % % 2020 2021 2022 2019 2020 2021 2022
Total
Employees
54 2 2 2 N/A N/A N/A N/A N/A N/A N/A N/A N/A N/A N/A N/A N/A N/A N/A N/A N/A N/A N/A N/A N/A N/A N/A N/A 100 1.41 100 100
SUSTAINABILITY REPORT 2022 120
Subsidiaries’ Outsourced Worker Information
(Disclosure 2-8:2021)
Outsourced worker means a person who the subsidiaries employ through contract party by the type of employment contract.
Labor contractor
Central (Bangkok, Nakhon Sawan, Ayutthaya, Phitsanulok)
Western (Ratchaburi)
Eastern (Rayong, Chon Buri, Chachoengsao)
Maid
Central (Nakhon Sawan, Phitsanulok)
Western (Ratchaburi)
Eastern(Rayong, Chon Buri, Chachoengsao)
Gardener
Central (Nakhon Sawan)
Security guard
Central (Nakhon Sawan)
Western (Ratchaburi)
Eastern (Rayong, Chon Buri, Chachoengsao)
Project contractors
Factory cleaning Chachoengsao
Factory cleaning Bang Pakong
Factory cleaning Rayong
Factory cleaning Sattahip
General workers Ratchaburi
Year 2022 Contract Type Female Male Total
Yearly contract Yearly contract Yearly contract 2-year contract 2-year contract 2-year contract 2-year contract Yearly contract Yearly contract Yearly contract 2-year contract 2-year contract 2-year contract Yearly contract Yearly contract 26 19 156 2 3 9 1 4 8 38 5 5 4 2 2 22 18 138 0 0 0 1 4 8 38 5 5 4 2 2 4 1 18 2 3 9 0 0 0 0 0 0 0 0 0
Total outsourced workers
121
Total Accidents-Company’s Employees (Disclosure 403-8, 403-9, 403-10:2018)
Total sick leave hours by type
• First Aids (person/year)
• Recordable work-related injuries (person/year)
• High-consequence (person/year)
• The number of fatalities as a result of work-related injury (person/year)
Total leave days taken by injured employees (day/year)
Injury Rate: IR (time/one million working hours)
Injury Frequency Rate: IFR (time/one million working hours)
Lost Time Injury Frequency Rate: LTIFR (person/one million working hours)
Rate of fatalities as a result of work-related injury (person/one million working hours)
Lost Day Injury Rate: LDIR (day/one million working hours)
Head Office (hour)
Operating area (hour)
Total (hour)
General sick leave (hour)
Work accident-related sick leave (hour)
Work disease-related sick leave (hour)
Absentee Rate (AR) calculated from sick leave taken by employees only
Number of work-related diseases
Head Office
Operating area
Occupational Disease Rate: ODR (person/one million working hours)
55 62 117 13,365 15,066 28,431 100,167.00 119,581.00 219,748.00 1 1 0 1 0 0 26 4.55 4.55 4.55 0 118.32 2,178.48 2,223.52 4,402.00 4,194.00 208.00 0 2.04 1.84 0 0 95 17 112 23,085 4,131 27,216 170,702.00 33,280.00 203,982.00 0 0 0 0 0 0 0 0 0 0 0 0 4,414.48 431.52 4,846.00 4,846.00 0 0 2.39 1.31 0 0 150 79 229 36,450 19,197 55,647 270,869.00 152,861.00 423,730.00 1 1 0 1 0 0 26 2.36 2.36 2.36 0 61.36 6,592.96 2,655.04 9,248.00 9,040.00 208.00 0 2.26 1.73 0 0 Scope of Reporting 2019 Male Female Total Number of employees Total normal working days of employees Total working hours of employees Number of incidents with injured employees Number of incidents with injured employees to the point of losing work (including death) Number of injured employees by degrees of severity Accident rates Total sick leave hours by location
Operating area
Total (person) Head Office (day) Operating area (day) Total (day) Head Office (hour) Operating area (hour) Total (hour) Total
Total
Head Office (person)
(person)
(time/year)
(time/year)
SUSTAINABILITY REPORT 2022 122
53 71 124 12,879 17,253 30,132 100,095.00 141,472.47 241,567.47 0 0 0 0 0 0 0 0 0 0 0 0 1,151.63 1,627.50 2,779.13 2,779.13 0 0 1.12 1.18 0 0 51 82 133 12,291 19,762 32,053 95,350.00 160,034.04 255,384.04 1 0 1 0 0 0 0 3.92 0 0 0 0 363.13 2,341.19 2,704.32 2,707.32 0 0 0.37 1.48 0 0 48 75 123 11,568 18,075 29,643 86,009.62 163,317.84 249,327.46 1 1 0 1 0 0 23 4.01 4.01 4.01 0 92.25 1,730.00 2,810.00 4,540.00 4,356.00 184.00 0 1.87 1.94 0 0 91 21 112 22,113 5,103 27,216 173,632.00 35,792.87 209,424.87 0 0 0 0 0 0 0 0 0 0 0 0 3,196.38 321.44 3,517.82 3,517.82 0 0 1.81 0.79 0 0 93 23 116 22,413 5,543 27,956 170,038.00 41,213.24 211,251.24 0 0 0 0 0 0 0 0 0 0 0 0 1,509.81 408.50 1,918.31 1,918.31 0 0 0.84 0.92 0 0 82 25 107 19,762 6,025 25,787 159,558.46 43,815.87 203,374.33 0 0 0 0 0 0 0 0 0 0 0 0 3,680.50 897.00 4,577.50 4,577.50 0 0 2.33 1.86 0 0 144 92 236 34,992 22,356 57,348 273,727.00 177,265.34 450,992.34 0 0 0 0 0 0 0 0 0 0 0 0 4,348.01 1,948.94 6,296.95 6,296.95 0 0 1.55 1.09 0 0 144 105 249 34,704 25,305 60,009 265,388.00 201,247.28 466,635.28 1 0 1 0 0 0 0 2.14 0 0 0 0 1,872.94 2,749.69 4,622.63 4,625.63 0 0 0.67 1.36 0 0 130 100 230 31,330 24,100 55,430 245,568.08 207,133.71 452,701.79 1 1 0 1 0 0 23 2.21 2.21 2.21 0 50.81 5,410.50 3,707.00 9,117.50 8,933.50 184.00 0 2.16 1.92 0 0 Company’s Employees 2020 Male Male Male Female Female Female Total Total Total 2021 2022 123
Number and Severity Levels of Accidents – Company’s Contractors and Outsourced Workers
• First Aids (person/year)
• Recordable work-related injuries (person/year)
• High-consequence (person/year)
• The number of fatalities as a result of work-related injury (person/year)
Total leave days taken by injured employees (day/year)
Injury Rate: IR (time/one million working hours)
Injury Frequency Rate: IFR (time/one million working hours)
Lost Time Injury Frequency Rate: LTIFR (person/one million working hours)
Rate of fatalities as a result of work-related injury (person/one million working hours)
Lost Day Injury Rate: LDIR (day/one million working hours)
140,388.00 959,687.00 1,100,075.00 0 0 0 0 0 0 0 0 0 0 0 0 0 0 0 0 80,262.00 41,468.00 121,730.00 0 0 0 0 0 0 0 0 0 0 0 0 0 0 0 0 220,650.00 1,001,155.00 1,221,805.00 0 0 0 0 0 0 0 0 0 0 0 0 0 0 0 0 Scope of Reporting Male Female Total 2019 Number of
hours of employees Number of incidents
employees Number
(including
Number of
of severity Accident rates Head Office (hour) Operating area construction project (hour) Total (hour/year) Head Office (time/year) Operating area construction project (time/year) Total (time/year) Head Office (time/year) Operating
project (time/year) Total (time/year)
working
with injured
of incidents with injured employees to the point of losing work
death)
injured employees by degrees
area construction
SUSTAINABILITY REPORT 2022 124
140,548.00 1,868,395.49 2,008,943.49 0 1 1 0 1 1 0 1 0 0 30 0.50 0.50 0.50 0 14.93 133,092.00 1,878,700.42 2,011,792.42 0 1 1 0 1 1 0 0 0 1 6,000 0.50 0.50 0.50 0.50 2,982.42 158,055.04 1,855,738.25 2,013,793.29 1 0 1 1 0 1 0 1 0 0 2 0.50 0.50 0.50 0 0.99 80,072.00 39,572.00 119,644.00 0 0 0 0 0 0 0 0 0 0 0 0 0 0 0 0 89,934.00 91,101.08 181,035.08 0 0 0 0 0 0 0 0 0 0 0 0 0 0 0 0 117,538.50 93,314.58 210,853.08 0 0 0 0 0 0 0 0 0 0 0 0 0 0 0 0 220,620.00 1,907,967.49 2,128,587.49 0 1 1 0 1 1 0 1 0 0 30 0.47 0.47 0.47 0 14.09 223,026.00 1,969,801.50 2,192,827.50 0 1 1 0 1 1 0 0 0 1 6,000 0.46 0.46 0.46 0.46 2,736.19 275,593.54 1,949,052.83 2,224,646.37 1 0 1 1 0 1 0 1 0 0 2 0.45 0.45 0.45 0 0.90 Male Male Male Female Female Female Total Total Total 2020 2021 2022 Company’s Contractors and Outsourced Workers 125
Total Accidents-Subsidiaries’ Employees
Scope of Reporting
Number of employees
Head Office (person)
Operating area (person)
Total (person)
Total normal working days of employees
Head Office (day)
Operating area (day)
Total (day)
Total working hours of employees
Head Office (hour)
Operating area (hour)
Total (hour)
Number of incidents with injured employees
Number of incidents with injured employees to the point of losing work (including death)
Number of injured employees by degrees of severity
Total (time/year)
Total (time/year)
• First Aids (person/year)
• Recordable work-related injuries (person/year)
• High-consequence (person/year)
• The number of fatalities as a result of work-related injury (person/year)
Total leave days taken by injured employees (day/year)
Accident rates
Injury Rate: IR (time/one million working hours)
Injury Frequency Rate: IFR (time/one million working hours)
Lost Time Injury Frequency Rate: LTIFR (person/one million working hours)
Rate of fatalities as a result of work-related injury (person/one million working hours)
Lost Day Injury Rate: LDIR (day/one million working hours)
Total sick leave hours by location
Head Office (hour)
Operating area (hour)
Total (hour)
Total sick leave hours by type
Injury Rate: IR (time/one million working hours)
Injury Frequency Rate: IFR (time/one million working hours)
Lost Time Injury Frequency Rate: LTIFR (person/one million working hours)
Absentee Rate (AR) calculated from sick leave taken by employees only
Number of work-related diseases
Rate of fatalities as a result of work-related injury (person/one million working hours)
Lost Day Injury Rate: LDIR (day/one million working hours)
Occupational Disease Rate: ODR (person/one million working hours)
SUSTAINABILITY REPORT 2022 126
25 61 86 6,025 14,701 20,726 46,742.70 118,780.30 165,523.00 0 0 0 0 0 0 0 0 0 0 0 0 1,481.00 72.00 1,553.00 1,553.00 0 0 3.07 0.06 0 0 24 62 86 5,784 14,942 20,726 45,611.70 115,555.21 161,166.91 0 0 0 0 0 0 0 0 0 0 0 0 857.30 2,813.10 3,670.40 3,670.40 0 0 1.85 2.35 0 0 30 25 55 7,230 6,025 13,255 52,691.40 42,668.78 95,360.18 1 0 0 1 0 0 0 10.49 0 0 0 0 929.00 0 929.00 929.00 0 0 1.61 0 0 0 30 25 55 7,230 6,025 13,255 55,241.60 45,925.70 101,167.30 0 0 0 0 0 0 0 0 0 0 0 0 1,166.20 1,711.80 2,878.00 2,878.00 0 0 2.02 3.55 0 0 55 86 141 13,255 20,726 33,981 99,434.10 161,449.08 260,883.18 1 0 0 1 0 0 0 3.83 0 0 0 0 2,410.00 72.00 2,482.00 2,482.00 0 0 2.27 0.04 0 0 54 87 141 13,014 20,967 33,981 100,853.30 161,480.91 262,334.21 0 0 0 0 0 0 0 0 0 0 0 0 2,023.50 4,524.90 6,548.40 6,548.40 0 0 1.94 2.70 0 0 Male Male Female Female Total Total 2021 Subsidiaries’ Employees 2022 127
Number and Severity Levels of Accidents – Subsidiaries’ Contractors and Outsourced Workers
Scope of Reporting
Number of working hours of employees
Head Office (hour)
Operating area construction project (hour)
Total (hour/year)
Number of incidents with injured employees
Number of incidents with injured employees to the point of losing work (including death)
Number of injured employees by degrees of severity
Head Office (time/year)
Operating area construction project (time/year)
Total (time/year)
Total (time/year)
• First Aids (person/year)
• Recordable work-related injuries (person/year)
• High-consequence (person/year)
• The number of fatalities as a result of work-related injury (person/year)
Total leave days taken by injured employees (day/year)
Accident rates
Injury Rate: IR (time/one million working hours)
Injury Frequency Rate: IFR (time/one million working hours)
Lost Time Injury Frequency Rate: LTIFR (person/one million working hours)
Rate of fatalities as a result of work-related injury (person/one million working hours)
Lost Day Injury Rate: LDIR (day/one million working hours)
SUSTAINABILITY REPORT 2022 128
2,605.50 467,013.99 469,619.49 0 1 1 0 0 1 0 0 1 2.13 0 2.13 0 2.13 990.50 457,077.10 458,067.60 0 0 0 0 0 0 0 0 0 0 0 0 0 0 3,368.00 41,448.00 44,816.00 0 0 0 0 0 0 0 0 0 0 0 0 0 0 2,961.50 41,249.70 44,211.20 0 0 0 0 0 0 0 0 0 0 0 0 0 0 5,973.50 508,461.99 514,435.49 0 1 1 1 0 1 0 0 1 1.94 1.94 1.94 0 1.94 3,952.00 498,326.80 502,278.80 0 0 0 0 0 0 0 0 0 0 0 0 0 0 Male Male Female Female Total Total 2021 Subsidiaries’ contractors and outsourced workers 2022 129
GRI CONTENT INDEX
Governance structure and composition
Nomination and selection of the highest governance body
Chair of the highest governance body
Role of the highest governance body in overseeing the management of impacts
Delegation of responsibility for managing impacts
Role of the highest governance body in sustainability reporting
Conflicts of interest
Communication of critical concerns
Collective knowledge of the highest governance body
Evaluation of the performance of the highest governance body Remuneration policies
Process to determine remuneration
Annual total compensation ratio
AR Page number SR GRI Standard Disclosure GRI 1 : Foundation 2021 General Disclosures The organization and its reporting practices Activities and workers Governance 2-1 2-2 2-3 2-4 2-5 10 12, 18 18 18 18 14 113, 117 116, 121 2-6 2-7 2-8 Organizational details Entities included in the organization’s sustainability reporting Reporting period, frequency and contact point Restatements of information External assurance GRI Disclosures 2021 Activities, value chain and other business relationships Employees Workers who are not employees Reporting Scope Omission Note External Assurance 16 17 12 12 12 12, 36 16, 32 77 77 77 80 98,104, 107 94 87 85 87 2-9 2-10 2-11 2-12 2-13 2-14 2-15 2-16 2-17 2-18 2-19 2-20 2-21
SUSTAINABILITY REPORT 2022 130
Financial implications and other risks and opportunities due to climate change
Defined benefit plan obligations and other retirement plans Financial assistance received from government
Process to determine material topics List of material topics Management of material topics
AR Page number SR GRI Standard Disclosure Strategy, policies and practices Stakeholder engagement ECONOMIC PERFORMANCE 2-22 2-23 2-24 2-25 2-26 2-27 2-28 8 12 12, 79 36 36 13 2-29 2-30 14, 20 83 3-1 3-2 3-3 201-1 201-2 201-3 201-4 29 31 56 31 10, 31 GRI Disclosures 2021 GRI 3 Material Topics 2021 GRI 201 Economic Performance 2016 Statement on sustainable development strategy Policy commitments Embedding policy commitments Processes to remediate negative impacts
and raising concerns
Membership associations
Collective bargaining agreements
Mechanisms for seeking advice
Compliance with laws and regulations
Income and operating expenses of the East Water Group (EWG). Approach to stakeholder engagement
Process to determine material topics List of material topics Management of material topics Direct economic value generated and distributed
Reporting Scope Omission Note External Assurance INDIRECT ECONOMIC IMPACTS 3-1 3-2 3-3 203-1 203-2 29 31, 98 44 GRI 3 Material Topics 2021 GRI 203 Indirect Economic Impacts 2016
Public activities for the benefit of society, communities and the environment that are related to the Company’s business operations.
Infrastructure investments and services
Significant indirect economic impacts Material Topics GRI 200 Economic Standard Series 14 10, 69 58 87, 89 57-60 100-105 131
supported
Process to determine material topics
List of material topics
Management of material topics
Operations assessed for risks related to corruption
Communication and training about anti-corruption policies and procedures
The East Water Group’s Permanent employees and contracted employees as the policy takers, and the Group’s suppliers as it is an important issue that more than one stakeholer groups are interested in.
Confirmed incidents of corruption and actions taken
Process to determine material topics
List of material topics
Management of material topics
Energy consumption within the organization
Energy consumption outside of the organization
Energy intensity
Reduction of energy consumption
The operating areas in 3 provinces i.e., Rayong, Chon Buri, and Chachoengsao because the Company’s core processes cover those areas, including the use of electricity in the Head Office (East Water Building).
Reductions in energy requirements of products and services
Process to determine material topics
List of material topics
Management of material topics
Direct (Scope 1) GHG emissions
Energy indirect (Scope 2) GHG emissions
Report only the operations in the EWG’s operating areas.
Requested for exemption from checking information of subsidiaries.
AR Page number SR GRI Standard Disclosure Reporting Scope Omission Note External Assurance ANTI-CORRUPTION ENERGY WATER 3-1 3-2 3-3 302-1 302-2 302-3 302-4 302-5 29 65 65 63, 68 66 68 3-1 3-2 3-3 303-1 303-2 29 56, 62, 110 45
GRI 3 Material Topics 2021 GRI 3 Material Topics 2021 GRI 3 Material Topics 2021 GRI 303 Water 2018 GRI 205 Anti-Corruption 2016 GRI 302 Energy 2016 Material Topics GRI 300 Environmental Standard Series 3-1 3-2 3-3 205-1 205-2 205-3 29 41 32, 42 34 32-39, 44 56, 66-70 56-62 SUSTAINABILITY REPORT 2022 132
Water consumption
Wastewater treatment business (29) Raw water business (40,89,91) Office building, Pump Station, Staff residence (42)
Report only for Office building, Pump Station, Staff residence, and Wastewater treatment business
Report only for Office building, Pump Station, Staff residence, and Wastewater treatment business
Process to determine material topics
List of material topics
Management of material topics
Direct (Scope 1) GHG emissions
Energy indirect (Scope 2) GHG emissions
Other indirect (Scope 3) GHG emissions
Report only the operating areas and include electricity energy usage of the EWG Head Office (East Water Building)
Requested for exemption of numeric data set due to data collection
GHG emissions intensity
Reduction of GHG emissions
Emissions of ozone-depleting substances (ODS)
Nitrogen oxides (NOX), sulfur oxides (SO X), and other significant air emissions
The Company has no operations with emissions of Nitrogen oxides (NOX), Sulfur oxides (SO X )
type
disposal
AR Page number SR GRI Standard Disclosure Reporting Scope Omission Note External Assurance EMISSIONS 303-3 303-4 303-5 45, 58, 60, 110, 112 45, 60 45, 58, 60, 120 3-1 3-2 3-3 305-1 305-2 305-3 305-4 305-5 305-6 305-7 29 68 63, 65-66, 6869 66 94 -
withdrawal
discharge
Water
Water
GRI 303 Water 2018 GRI 3 Material Topics 2021 GRI 305 Emissions 2016
EMISSIONS AND WASTE 3-1 3-2 3-3 306-1 306-2 306-3 306-4 306-5 29 45 71 71, 94 71 71
Process to determine material topics List of material topics Management of material topics Water discharge by quality and destination
GRI 3 Material Topics 2021 GRI 306 Effluents and Waste 2016 45, 56, 71 63-68, 94, 96 133
Waste by
and
method Significant spills Transport of hazardous waste Water bodies affected by water discharges and/or runof
SUSTAINABILITY REPORT 2022 134
Process to determine material topics List of material topics Management of material topics
New employee hires and employee turnover
Benefits provided to full-time employees that are not provided to temporary or part-time employees Parental leave
Process to determine material topics
List of material topics
Management of material topics
Occupational health and safety management system
Hazard identification, risk assessment, and incident investigation
Occupational health services
Worker participation, consultation, and communication on occupational health and safety
Worker training on occupational health and safety Promotion of worker health Prevention and mitigation of occupational health and safety impacts directly linked by business relationships Workers covered by an occupational health
Report of EWG’s employees
Report of the Company’s employees
Report of EWG’s employees
Requested for exempting all numeric data set of of absentee rate of subcontractor because they are not essential to the business operation. 74-77, 83-87 74, 88-95
AR Page number SR GRI Standard Disclosure Material Topics GRI 400 Social Standard Series EMPLOYMENT OCCUPATIONAL
AND
3-1 3-2 3-3 401-1 401-2 401-3 29 114, 118-119 84 115, 120 3-1 3-2 3-3 403-1 403-2 403-3 403-4 403-5 403-6 403-7 403-8 403-9 403-10 29 88 88 90 89 90 90 88, 90 88, 122 88, 122 88, 90, 122
HEALTH
SAFETY
Work-related
Work-related ill health GRI 3 Material Topics 2021 GRI 401 EMPLOYMENT 2016 GRI 3 Material Topics 2021 GRI 403 Occupational-health-and-safety 2018
and safety management system
injuries
Permanent and contracted employees including subcontractor employees only for the projects with procurement contracts. Reporting Scope Omission Note External Assurance 89
Process to determine material topics
List of material topics
Management of material topics
Average hours of training per year per employee
Programs for upgrading employee skills and transition assistance programs
Percentage of employees receiving regular performance and career development reviews
Process to determine material topics
List of material topics
Management of material topics
Operations with local community engagement, impact assessments, and development programs
Operations with significant actual and potential negative impacts on local communities
Process to determine material topics
List of material topics
Management of material topics
Assessment of the health and safety impacts of product and service categories
Incidents of non-compliance concerning the health and safety impacts of products and services
Operations in the Company’s construction projects.
AR Page number SR GRI Standard Disclosure Material Topics GRI 400 Social Standard Series TRAINING AND EDUCATION LOCAL COMMUNITIES
HEALTH AND SAFETY 3-1 3-2 3-3 404-1 404-2 404-3 29 77 77, 81, 84 74, 80 3-1 3-2 3-3 413-1 413-2 29 96, 98 96 3-1 3-2 3-3 416-1 416-2 29 49, 51-52 50, 53
CUSTOMER
Report of only the Company’s Employees
GRI 3 Material Topics 2021 GRI 3 Material Topics 2021 GRI 3 Material Topics 2021 GRI 404 Training and Education 2016 GRI 413 Local Communities 2016 GRI 416 Local Communities 2016 Reporting Scope Omission Note External Assurance 74-86 96-105 47-53 135
LRQA Independent Assurance Statement
Relating to Eastern Water Resources Development and Management Public Company Limited’s Sustainability Report for the calendar year 2022 (1st January 2022 – 31st December 2022)
This Assurance Statement has been prepared for Eastern Water Resources Development and Management Public Company Limited in accordance with our contract but is intended for the readers of this Report.
Terms of engagement
LRQA Limited was commissioned by Eastern Water Resources Development and Management Public Company Limited (EW) to provide independent assurance on its Sustainability Report FY 2022 for the period from 1st January 2022 to 31st December 2022 (“the report”) against the assurance criteria below to a limited level of assurance and at the materiality of the professional judgement of the verifier using LRQA’s verification procedure. LRQA’s verification procedure is based on current best practice, is in accordance with ISAE3000 (revised) and uses the following principles of - inclusivity, materiality, responsiveness, impact and reliability.
Our assurance engagement covered EW's operations and activities in Thailand only and specifically the following requirements:
Confirming that the report is in accordance with the GRI Standard (2021)1
Evaluating the reliability of data and information for only the selected environmental and social indicators listed below:
- GRI 302-3: Energy Intensity
- GRI 303-3: Water withdrawal
- GRI 305-2: Energy indirect GHG emissions (Scope 2)2
- GRI 403-9 Work-related injuries (absenteeism rate only)
Our assurance engagement excluded the data and information of EW’s operations besides the defined sustainability reporting boundary, as well as suppliers, contractors and any third parties mentioned in the report.
LRQA’s responsibility is only to EW. LRQA disclaims any liability or responsibility to others as explained in the end footnote. EW’s responsibility is for collecting, aggregating, analysing and presenting all the data and information within the report and for maintaining effective internal controls over the systems from which the report is derived. Ultimately, the report has been approved by, and remains the responsibility of EW.
LRQA’s Opinion

Based on LRQA’s approach, the direct and indirect GHG emissions data in the report are materially correct and nothing has come to our attention that would cause us to believe that EW has not:
Met the requirements above
Disclosed reliable performance data and information as no errors or omissions were detected. The opinion expressed is formed on the basis of a limited level of assurance and at the materiality of the professional judgement of the verifier.
Note: The extent of evidence-gathering for a limited assurance engagement is less than for a reasonable assurance engagement. Limited assurance engagements focus on aggregated data rather than physically checking source data at sites. Consequently, the level of assurance obtained in a limited assurance engagement is substantially lower than the assurance that would have been obtained had a reasonable assurance engagement been performed.
LRQA’s approach
LRQA’s assurance engagements are carried out using our verification procedure. The following tasks though were undertaken as part of the evidence gathering process for this assurance engagement:
Assessing EW’s approach to stakeholder engagement to confirm that issues raised by stakeholders were captured correctly. We did this through interviews with external stakeholders and reviewing documents and associated records.
------------------------------------------------------------------------------1 https://www.globalreporting.org 2 GHG quantification is subject to inherent
SUSTAINABILITY REPORT 2022 136
uncertainty.
Reviewing EW’s process for identifying and determining material issues to confirm that the right issues were included in their report. We also tested the filters used in determining material issues to evaluate whether EW makes informed business decisions that may create opportunities that contribute towards sustainable development.
Auditing EW’s data management systems to confirm that there were no significant errors, omissions or mis-statements in the report. We did this by reviewing the effectiveness of data handling procedures, instructions, and systems, including those for internal verification. We also spoke with those key people responsible for compiling the data and drafting the report.
Sampling of evidence during remote verification to confirm reliability of performance data and information for only the selected indicators.
Observations
Further observations and findings, made during the assurance engagement, are:
Stakeholder inclusivity: We are not aware of any key stakeholder groups that have been excluded from EW’s stakeholder engagement process. EW has open dialogue with all its stakeholders, though the frequency of engagement with trade unions would benefit from more regular scheduling.
Materiality: We are not aware of any material issues concerning EW’s sustainability performance that have been excluded from the report. It should be noted that EW has established extensive criteria for determining which issue/aspect is material and that these criteria are not biased to the company’s management.
Responsiveness: EW has established and implemented processes for responding to the concerns of various stakeholder groups especially in relation to water loss management program as defined in the company objective and target for water resource management program.
Impact: EW should further address key quantitative impacts regarding GHG scope 3 in future reports. Also, future reports should consider significant GHG impacts within the Corporate Value Chain.
Reliability: Data management systems are properly defined for the selected environmental indicators. However, we believe that data verification of EW’s future reports should extend the boundary of GHG emissions and water disclosure to all business units.
LRQA’s standards, competence and independence
LRQA ensures the selection of appropriately qualified individuals based on their qualifications, training and experience. The outcome of all verification and certification assessments is then internally reviewed by senior management to ensure that the approach applied is rigorous and transparent.
This verification is the only works undertaken by LRQA for Eastern Water Resources Development and Management Public Company Limited and as such does not compromise our independence or impartiality.
Dated: 29th March 2023
LRQA Lead Verifier
On behalf of LRQA (Thailand) Ltd.
No.9, G Tower Grand Rama 9, FL. 30, Room H14, Rama 9 Rd., HuayKwang, Bangkok, 10310
LRQA reference: BGK00000832
LRQA Group limited its affiliates included LRQA (Thailand) Limited and subsidiaries, and their respective officers, employees or agents are, individually and collectively, referred to in this clause as 'LRQA'. LRQA Group limited assumes no responsibility and shall not be liable to any person for any loss, damage or expense caused by reliance on the information or advice in this document or howsoever provided, unless that person has signed a contract with the relevant LRQA entity for the provision of this information or advice and in that case any responsibility or liability is exclusively on the terms and conditions set out in that contract. The English version of this Assurance Statement is the only valid version. LRQA Group limited assumes no responsibility for versions translated into other languages. This Assurance Statement is only valid when published with the Report to which it refers. It may only be reproduced in its entirety.
Copyright © LRQA Group limited 2023.
137
EASTERN WATER RESOURCES DEVELOPMENT AND MANAGEMENT PCL.

EAST WATER BUILDING 1 VIBHAVADI RANGSIT 5, VIBHAVADI RANGSIT ROAD, JOMPHOL, JATUJAK, BANGKOK 10900
TEL +66 2272 1600 FAX +66 2272 1601-3
eastwater www.eastwater.com