Pearson is the world’s learning company, with presence across 70 countries worldwide. Our unique insights and world-class expertise comes from a long history of working closely with renowned teachers, authors and thought leaders, as a result of which, we have emerged as the preferred choice for millions of teachers and learners across the world.
We believe learning opens up opportunities, creates fulfilling careers and hence better lives. We hence collaborate with the best of minds to deliver you class-leading products, spread across the Higher Education and K12 spectrum.
Superior learning experience and improved outcomes are at the heart of everything we do. This product is the result of one such effort.
Your feedback plays a critical role in the evolution of our products and you can contact us –reachus@pearson.com. We look forward to it.
This page is intentionally left blank
All In-House Artworks by: DiacriTech for Pearson India Education Services Pvt. Ltd
This title carries certain photographs which are the part of Dr. (Mrs.) Seema Mehra Parihar’s private collection, and are not to be circulated outside of this title. All copyrights to these are vested in Dr. (Mrs.) Seema Mehra Parihar, and these have been used with her permission.
Published by Pearson India Education Services Pvt. Ltd, CIN: U72200TN2005PTC057128.
No part of this eBook may be used or reproduced in any manner whatsoever without the publisher’s prior written consent.
This eBook may or may not include all assets that were part of the print version. The publisher reserves the right to remove any material in this eBook at any time.
ISBN 978-93-534-3375-8
eISBN:
Head Office: 15th Floor, Tower-B, World Trade Tower, Plot No. 1, Block-C, Sector-16, Noida 201 301,Uttar Pradesh, India.
Registered Office: 4th Floor, Software Block, Elnet Software City, TS -140, Block 2 & 9, Rajiv Gandhi Salai, Taramani, Chennai 600 113, Tamil Nadu, India. Fax: 080-30461003, Phone: 080 -30461060 www.in.pearson.com, Email: companysecretary india@pearson.com
This page is intentionally left blank
Preface xi
Preface to the Indian Edition xiii
About Seema Mehra Parihar xiv
Acknowledgement xv
1 The Solar System:
Positions and Time 1.1
Introduction 1.2
The Solar System 1.2
Shape of the Earth 1.4
Phases of the Moon 1.6
The Sun as an Input into the Earth’s System 1.6
Position and Time 1.8
The position of a place on the earth’s surface 1.8
Rotation and Time 1.10
2 Plate Tectonics:
The Earth’s Structure and Landforms 2.1
Introduction 2.2
Structure of the Earth 2.2
Isostasy 2.4
Collision of Plates 2.11
Plate Boundary 2.12 Rocks 2.17
Classification of rocks 2.17
A Global Pattern Through Plate Tectonics 2.20
Rock system in Great Britain 2.22
Rock system in India 2.23 Vulcanicity and Landforms 2.28
Distribution of Volcanoes and Volcanic Activity 2.29
Volcanic features formed in the crust 2.33
Volcanic features formed on the surface 2.34
Vent eruptions and the types of volcanoes 2.34
Craters and calderas 2.35
Composite cones or stratovolcanoes 2.37
Fissure eçruptions and the landforms they produce 2.38
Other forms of volcanic activity 2.40
Is a Volcanic Landscape Hostile? 2.40
Major Landforms 2.42
Earthquakes 2.43
Faults 2.49
Joints 2.53
Folds 2.53
Earth Movements Behind Landforms 2.55
Major Landforms 2.55
Mountains 2.56
Rift valley 2.63
Plateaus and related landforms 2.64
Plains and related landforms 2.66
3 Weathering of Slopes 3.1
Introduction 3.2
Denudation and Weathering 3.2
Types of Weathering 3.3
Geomorphic Cycles of Slope
Development 3.11
Rejuvenated and Polycyclic Landforms 3.13
Mass Wasting and Slope Processes 3.14
Types of Slope Movement 3.15
Concave Slope 3.18
Other Types of Slope Movement 3.21
Vegetation Protects the Slopes 3.21
4 Water on the Surface 4.1
Introduction 4.2
Global Water and the Atmosphere 4.3
River Basin Drainage—an
Open System 4.5
Dynamics of Water Supply 4.7
Supply and demand 4.7
Human Impact on Drainage Basins 4.8
Water storage 4.8
Irrigation 4.12
Flooding 4.18
River system 4.20
Stream system 4.21
River Transport 4.24
River erosion 4.24
River deposition 4.25
Development of a River Valley 4.26
Long profile 4.26
Adjustment to erosion and deposition 4.27
Grade 4.27
Influence of gradient 4.27
River valley characteristics—processes and landforms 4.28
Drainage patterns 4.38
Water conservation 4.49
5 Underground Water and Limestone Features 5.1
Introduction 5.2
Sources of Groundwater 5.2
Wells and Artesian Basins 5.4
Karst Cycle of Erosion 5.9
Limestone Landforms 5.11
6 Glacial Processes 6.1
Introduction 6.2
Regional Distribution of Glaciers 6.3
Accumulation of ice and the snow line 6.3
Classification of glaciers 6.5
Glacial System 6.6
Glacial movement 6.7
Surface features and moraines 6.7
Glacial processes 6.8
Landforms Produced by Glacial Erosion 6.9
Landforms Produced by Glacial Deposition 6.14
Boulder clay deposits 6.15
Ice-Dammed Lakes and Overflows 6.17
Examples of Glaciated Landscapes 6.19
Economic Value of Glaciated Landscapes 6.25
Glacial landforms of specific value 6.25
Melting Permafrost 6.26
7 Desert Processes 7.1
Introduction 7.2
Desert Locations 7.3
Action of Winds in a Desert 7.8
Features produced by wind erosion 7.13
Features produced by wind deposition 7.15
Features produced by water in desert regions 7.18
Are Deserts Expanding? 7.20
8 Coastal Processes 8.1
Introduction 8.2 Coasts 8.2
Terms related to Coastal Geography 8.3
Formation of waves 8.3
The nature of waves 8.4
Types of waves 8.5
Wave Erosion 8.9
Landforms produced by wave erosion 8.9
Materials Transported by Waves 8.16
Landforms Produced by Wave
Deposition 8.17
Beach 8.17
Spit 8.18
Coastal Dunes 8.25
Changing Sea Levels 8.26
9 The Oceans 9.1
Introduction 9.2
Oceanic Zones 9.3
Ocean Current 9.4
Ocean currents and winds 9.5
Coral Reefs 9.7
Major reef types 9.8
Nature of Tides 9.10
Tidal influences 9.11
Energy from the Oceans 9.13
Natural Hazards of Oceans 9.13
Beneficial Influences of the Oceans 9.16
10 Atmosphere:
Temperature 10.1
Introduction 10.2
Structure of Atmosphere 10.2
Troposphere 10.3
Atmospheric System 10.3
Heating of Atmosphere 10.4
Heating of the Earth 10.7
Latitude 10.7
Altitude 10.8
Nature of the surface 10.8
Distance from the sea 10.8
Winds 10.9
Cloud cover and humidity 10.9
Aspect 10.10
Length of day 10.11
Ocean currents 10.11
Temperature Changes within the
Atmosphere 10.14
Measurement of temperature 10.15
Maximum thermometer 10.15
Minimum thermometer 10.16
Six’s thermometer 10.17
How Temperature is Shown on a Map? 10.18
World Distribution of Temperature 10.20
11 Atmosphere: Pressure
and Wind 11.1
Introduction 11.2
Origin of pressure 11.2
Influence of altitude on pressure 11.2
Influence of temperature on pressure 11.3
Influence of rotation on pressure 11.3
Actual pressure systems 11.5
Measurement of Air Pressure 11.7
Mercury barometer 11.7
Aneroid barometer 11.7
Barograph 11.7
How Pressure is Shown on a Map? 11.9
Winds 11.9
The origin of winds 11.9
Measurement of wind direction and velocity 11.10
How winds and wind velocity are shown on a map? 11.11
Planetary Winds 11.13
Monsoon winds of the Asian region 11.17
Local Winds 11.18
Land and sea breezes 11.19
Descending winds 11.19
Valley breeze and mountain breeze 11.20
Convection winds 11.21
Depression winds 11.21
Air Masses and Fronts 11.23
Depression 11.26
Development of a depression 11.26
Weather associated with a depression 11.27
Weather and depressions 11.28
Tropical Cyclone 11.31
Development of a tropical cyclone 11.33
Weather associated with a tropical cyclone 11.34
Tornado 11.35
Anti-cyclone 11.38
Weather maps and anti-cyclones 11.38
12 Atmosphere: Water 12.1
Introduction 12.2
Humidity 12.2
Measurement of humidity 12.2
Condensation 12.5
Types of condensation 12.5
Clouds 12.7
High clouds 12.8
Middle clouds 12.8
Low clouds 12.9
Clouds of great vertical extent 12.10
Formation of clouds 12.10
Precipitation 12.12
Types of precipitation 12.13
How air is cooled 12.15
Types of Rain 12.16
Convection rain 12.16
Depression or cyclonic or frontal rain 12.17
Relief or orographic rain 12.17
Thunderstorms 12.17
Measurement of Rainfall 12.19
How Rain is Shown on a Map 12.19
World Patterns for Rainfall
Distribution 12.22
Global pattern for May to October 12.23
Global pattern for November – April 2.23
Seasonal Distribution of Rainfall 12.25
Seasonal Rainfall and Type of Rainfall 12.26
Annual Global Rainfall 12.27
13 The Weather Station and Weather Maps
13.1
Introduction 13.2
Weather Station 13.2
Stevenson Screen 13.2
Visibility 13.4
Recording Weather 13.5
Gathering Information 13.7
NASA and Weather Information 13.9
National Remote Sensing Centre (NRSC) and Atmospheric
Observations 13.11
14 Climate, Weather, and Natural Environment
14.1
Introduction 14.2
Weather and Climate 14.2
Factors Affecting Climate and Climatic Types 14.2
Fairly uniform climates 14.3
Seasonal climates 14.7
Continentality 14.9
Ecosystem 14.11
Linkages and interactions in an ecosystem 14.12
Adaptation in plants 14.15
Influence of temperature and water on plants 14.15
Main Types of Vegetation 14.16
Tropical rainforest 14.19
Soil 14.20
The formation of soil 14.20
Water movement in the soil 14.21
Soil profile 14.21
Destruction of tropical rainforests 14.24
Soil productivity 14.25
Soil Erosion 14.25
By water 14.26
By wind 14.28
Soil Conservation 14.28
Types of soil conservation 14.28
Photo credit PC.1
Index I.1
Preface
The physical environment has enormous variety and is of great complexity. It is forever changing and to understand the nature and causes of the changes, it is necessary to study the individual components involved. The processes operating in the many systems of the environment produce changes. An examination of the systems and of the interactions among their component processes results in a clearer understanding of both the diversity and the unity that characterize the physical environment.
This book examines the systems and their processes, the landforms associated with these, and the relationships between living organisms and the inorganic environment within specific natural ecosystems. Every attempt is made to focus attention on all the main components of the physical environment as well as on the associated inter-relationships. Whenever possible, a wide range of landforms from within the framework of the British environment are examined.
Whilst the main concern of this book is a study of the physical environment, where appropriate, mention is made of the effects of human activities on the environment. Although these activities have been going on for a very long time, it is only in the last five decades that the changes have reached a global dimension. The most widespread of these are air and water pollution and it is important that proper attention be given to these, especially in respect of the adverse direct and indirect affects they have on vast numbers of plant and animal species which threaten the delicate balance of many natural ecosystems.
The text is extensively illustrated with diagrams and photographs, which are numbered on a chapter basis for easy reference.
Varied exercises and a set of key facts are given at the end of all chapters.
R B Bunnett 1987
This page is intentionally left blank
Preface to the Indian Edition
‘Light precedes every transition. Whether at the end of a tunnel, through a crack in the door or the flash of an idea, it is always there, heralding a new beginning’
— Teresa Tsalaky
Physical Geography in Diagrams by R. B. Bunnett was first published in 1965. The fourth edition of this book came in 1988 (ISBN: 9780582225077). When Pearson India, editorial team asked me to adapt the 4th edition for Indian students, I felt overwhelmed. I am being entrusted to bring this wonderful book into life again! I feel privileged for being given a chance to work on this book. It took me more than a year to make certain changes. While I was working on them, I realized how much effort had gone into the original version of the book to make it a most established title in this subject!. This annotated version retains all the distinctive features of the original edition. Consequently, it should be read as an updated edition to the original work and in no way should be interpreted as a completely new book in itself. I am associated with teaching profile for nearly 30 years, and can claim with confidence that this adaptation work will not only help students but faculties who are teaching Geography, for various levels of students, too will find this book extremely useful in their day to day lesson plans. Even students who have not studied Geography earlier can find this book extremely engaging for their further reading or for competitive readiness.
The core objective of this title is to explain geographical principles and concepts through illustrations and engage students in the learning process of the physical aspects of geography through several line diagrams, 3D/2D artwork, field-based (i.e., real-life) photographs, and locations of features marked on satellite imageries as it is.
With all said that, after using this book for classroom resources, it convinced me that some parts of the content need to be reworked and data should be updated as per the latest developments in today’s World. In last 30 years, there were no substantial changes in the content of this book, so it was a necessity to take this book forward for our next generation of students. We have tried our best to update the content along with new pedagogical elements, chapter-end questions, and also included as many new diagrams, maps, visual aids wherever possible. The goal has been to attempt to incorporate new technologies and methods to make the book relevant and useful for the current generation of students. I believe that present book addresses key concerns from the student’s point of view and in each chapter there are few sections which pro-actively connect students to their role as a stake holder in creation and sustenance of different geographies around them.
The book which was earlier in black and white format is now available in its four-colored version. I have tried to include more recent photographs clicked during my field visits with students, family, and friends and have attempted to make visible the location of the places and physical features photographed through Google maps. As no single photograph was available from the original text, we had to buy many of these photographs which were not readily available from different libraries and museums of the world. Now the book is almost double the size with more than 500 pages and covers diverse areas all with enriched explanation visualized through more than 1,150 diagrams and 3D/2D artwork. The journey of coming out with the present version was beautiful . . . there was so much to know, read, and understand. It has not only added to my knowledge, but also has enabled me to grow as a human being.
Again, I wish to thank the Pearson team for trusting me with this work. I also wish luck to all those students, researchers, teachers, and practitioners who are going to use this book in future.
Seema Mehra Parihar
About Seema Mehra Parihar
Dr. Seema Mehra Parihar is an Associate Professor at Kirori Mal College, University of Delhi. She has more than 30 years of experience in academics in the specific area of Geo-Informatics, Natural Resource Management, Physical geography and Gender analytics. Dr Seema earned her Ph.D from the Department of Geography, Delhi School of Economics, University of Delhi. The title of her PhD research was ‘Natural Resource Management in the Bhagirathi Basin’ Her Post-Doctoral Fellowship at the Department of Geo-informatics, Cartography and Geo-visualisation, ITC, Enschede, The Netherlands involved designing and developing a web based course in Web Geo-informatics. Her specific interest lies in field-based research and geospatial mapping using remote sensing and GIS. She has recently coordinated 40 module e-learning course and recorded 20 lessons for postgraduate (epg) pathshala for Ministry of Human Resource Development, Government of India. She has been a Principal Investigator of 14 research Projects sanctioned by national & international funding agencies. She has authored more than 30 articles in Geospatial Journals and is credited for Gender Atlas of India (Series 1 & 2) sanctioned by Ministry of Women and Child Development, Government of India. She has been the Convenor of the Gender Forum in the Bandung Conference, Indonesia and is currently working on a project entitled ‘Mapping Geospatial Dimension of Hydro-politics in Jammu and Kashmir’ and guiding research students.
Dr. Seema has coordinated number of training workshops, seminars, conferences and refresher programs of UGC for University teachers in the field of Geospatail technologies; Geo-analytics; field work and Gender. Dr Parihar has also been a Trainer of Trainers and a resource person for National workshops on Capacity Building of Women Leaders in Higher Education. A trained behavioral assessor and an avid trekker, Dr. Seema has also been actively associated for more than thirty years in spreading the movement of national integration. Dr. Seema has guided Parivartan—a gender forum on issues surrounding gender and intersectionality in the Indian context and has been a driving force behind the events that the forum organises. Dr. Parihar was also a founder Chairperson of Central Placement Cell, University of Delhi(DU); Deputy Dean Students Welfare, University of Delhi; Joint Director, Developing Countries Research Centre (DCRC), DU and Fellow Institute of Life Long Learning (ILLL), University of Delhi.
Dr Seema has recently been awarded by an ‘Annual Award 2018’ during IIRS Academia meet 2019 by Indian Institute of Remote Sensing, Indian Space Research Organization, Government of India. She has also been awarded by Bhoo Samman an award for contributions in geosciences during a conference on ‘Rural IndiaMillenium Development Goals’ by Bhoovikas Foundation.
Acknowledgement
‘We often take for granted the very things that most deserve our gratitude.’ — Cynthia Ozick
This a wonderful moment, when I am getting an opportunity to acknowledge R.B Bunnett trust, United Kingdom, and Pearson Team, United Kingdom, for giving me a chance to unveil physical geography through the lens of R.B Bunnet, (first published in 1965). In this title, I could rework on each chapter, each diagram, each photograph and present those in a form that exist today. However, the presence of particular person at special place has only enabled me in adding almost double the pages and more than double images and diagrams covering diverse areas, and each one has been a key to the completion of this book and deserves a separate acknowledgement.
When Pearson India approached me initially to work on the 4th edition of Physical Geography, I felt overwhelmed. I would like to thank, first and foremost, the Pearson India team for entrusting me the responsibility to bring this wonderful book into life again!
I am more than grateful to H.R. Nagaraja, who not only encouraged for an contemporary adaptation, but albeit retaining its identity, understood the need for an overhaul with latest examples, cases-studies and pictures as there was no existing repository of diagrams and pictures present in earlier editions and more than fifty years had gone between the original text and current requirement of students. It is only because of that, a structure of each chapter was relooked into and visualized in four colours. I would equally like to thank Nandini Basu, for her continuous support, meticulous suggestions, giving new ideas and inputs to the book (analyzing chapter content, developing pedagogy, creating art works, modifying chapter end questions, etc.), flexibility and understanding the necessity of including satellite based images with features marked and adding new pictures from different sources, field experiences including mine. I also would like to thank Priyankia Dey, R&P Project Manager for taking permission clearances wherever required and putting it all together in a systematic way. My thanks also extends to Vipin Kumar from the production team for the creativity and patience in handling each page, all team members of the publishing team are most responsible for the coherent, well designed book that evolved from my initial drafts.
I must express my gratitude to our new Principal Dr. Vibha Singh Chauhan for enabling academic environment for pursuing additional academic works. I am also grateful to my Ph.D student Peerzada Raouf Ahmad for his helpful comments and my student research assistants of different projects including Rohit Kumar, JitendraTiwari and Jitender Rathore for their constructive feedback on each diagram, each image and early versions of chapters. I like to thank Rohit Kumar for reviewing the chapter end questions. I am further grateful to my undergraduate students at Kirori Mal College who have undertaken many field works with me to places in India, Nepal and Bhutan—thereby adding value to chapters through pictures, graphics and deep insights within different geographies.
Special thanks to my husband Premendra, son Dushyant and daughter Jayashree who have always been there and without their help and support it would have been impossible to dedicate time to complete this book.
Every effort has been made by publishing team to trace and contact copyright holders for their permissions to reprint material in this book. The publishers would be grateful to hear from any copyright holder who is not acknowleged and will undertake to rectify any errors or omissions in future editions of this book.
To all of these people, heartfelt thanks.
Seema
Mehra Parihar
This page is intentionally left blank
Learning Outcomes
The Solar System: Positions and Time 1
After completing this chapter, you should be able to:
● Visualize solar system, inner and outer planets and their positioning.
● Locate the position of a place on the earth’s surface.
● Understand the importance of Sun as the main input in the earth’s energy system.
● Compute different time zones in different locations of the world.
Keywords
Solar System, Earth’s radiation, Latitude, Longitude, Geoid, Greenwich Meridian Time and International Date Line.
According to NASA, ‘two of the outer planets beyond the orbit of Mars—Jupiter and Saturn— are called gas giants; the more distant Uranus and Neptune are called ice giants.’ This is because where the first two are dominated by gas, the last two have more ice. All forms contain mostly hydrogen and helium.
Introduction
In our solar system, there is the sun and eight planets. The planets are categorized in two different groups—the terrestrial planets (innermost planets) and gas giants (the outer planets). We are going to study about these terrestrial planets and outer planets of the solar system and understand the relevance of positions and time on the earth’s surface in this chapter. The terrestrial planets include Mercury, Venus, Earth and Mars. These planets are composed of silicate rocks. The other four planets, i.e., gas giants or outer planets are Jupiter, Saturn, Uranus and Neptune. These four gas giants are huge in size and are composed mostly of helium and frozen hydrogen (no solid surface).
The Solar System
Contemporary observations are changing our understanding of planetary system. The International Astronomical Organization (IAU) in 2006 resolved that ‘planets and other bodies in our solar system be defined into three distinct categories: ‘planet,’ ‘dwarf planet,’ and ‘small solar system bodies.’ A planet is a celestial body that is in the orbit around the sun, has sufficient mass for its self-gravity to overcome rigid body forces so that it assumes a nearly round, hydrostatic equilibrium shape, and has cleared the neighbourhood around its orbit. However, the ‘dwarf planet,’ unlike the planet, has neither cleared the neighbourhood around its orbit nor is a satellite. ‘As per Resolution 5A of IAU’ all other objects, except satellites, orbiting the sun shall be referred collectively as small solar system bodies.’
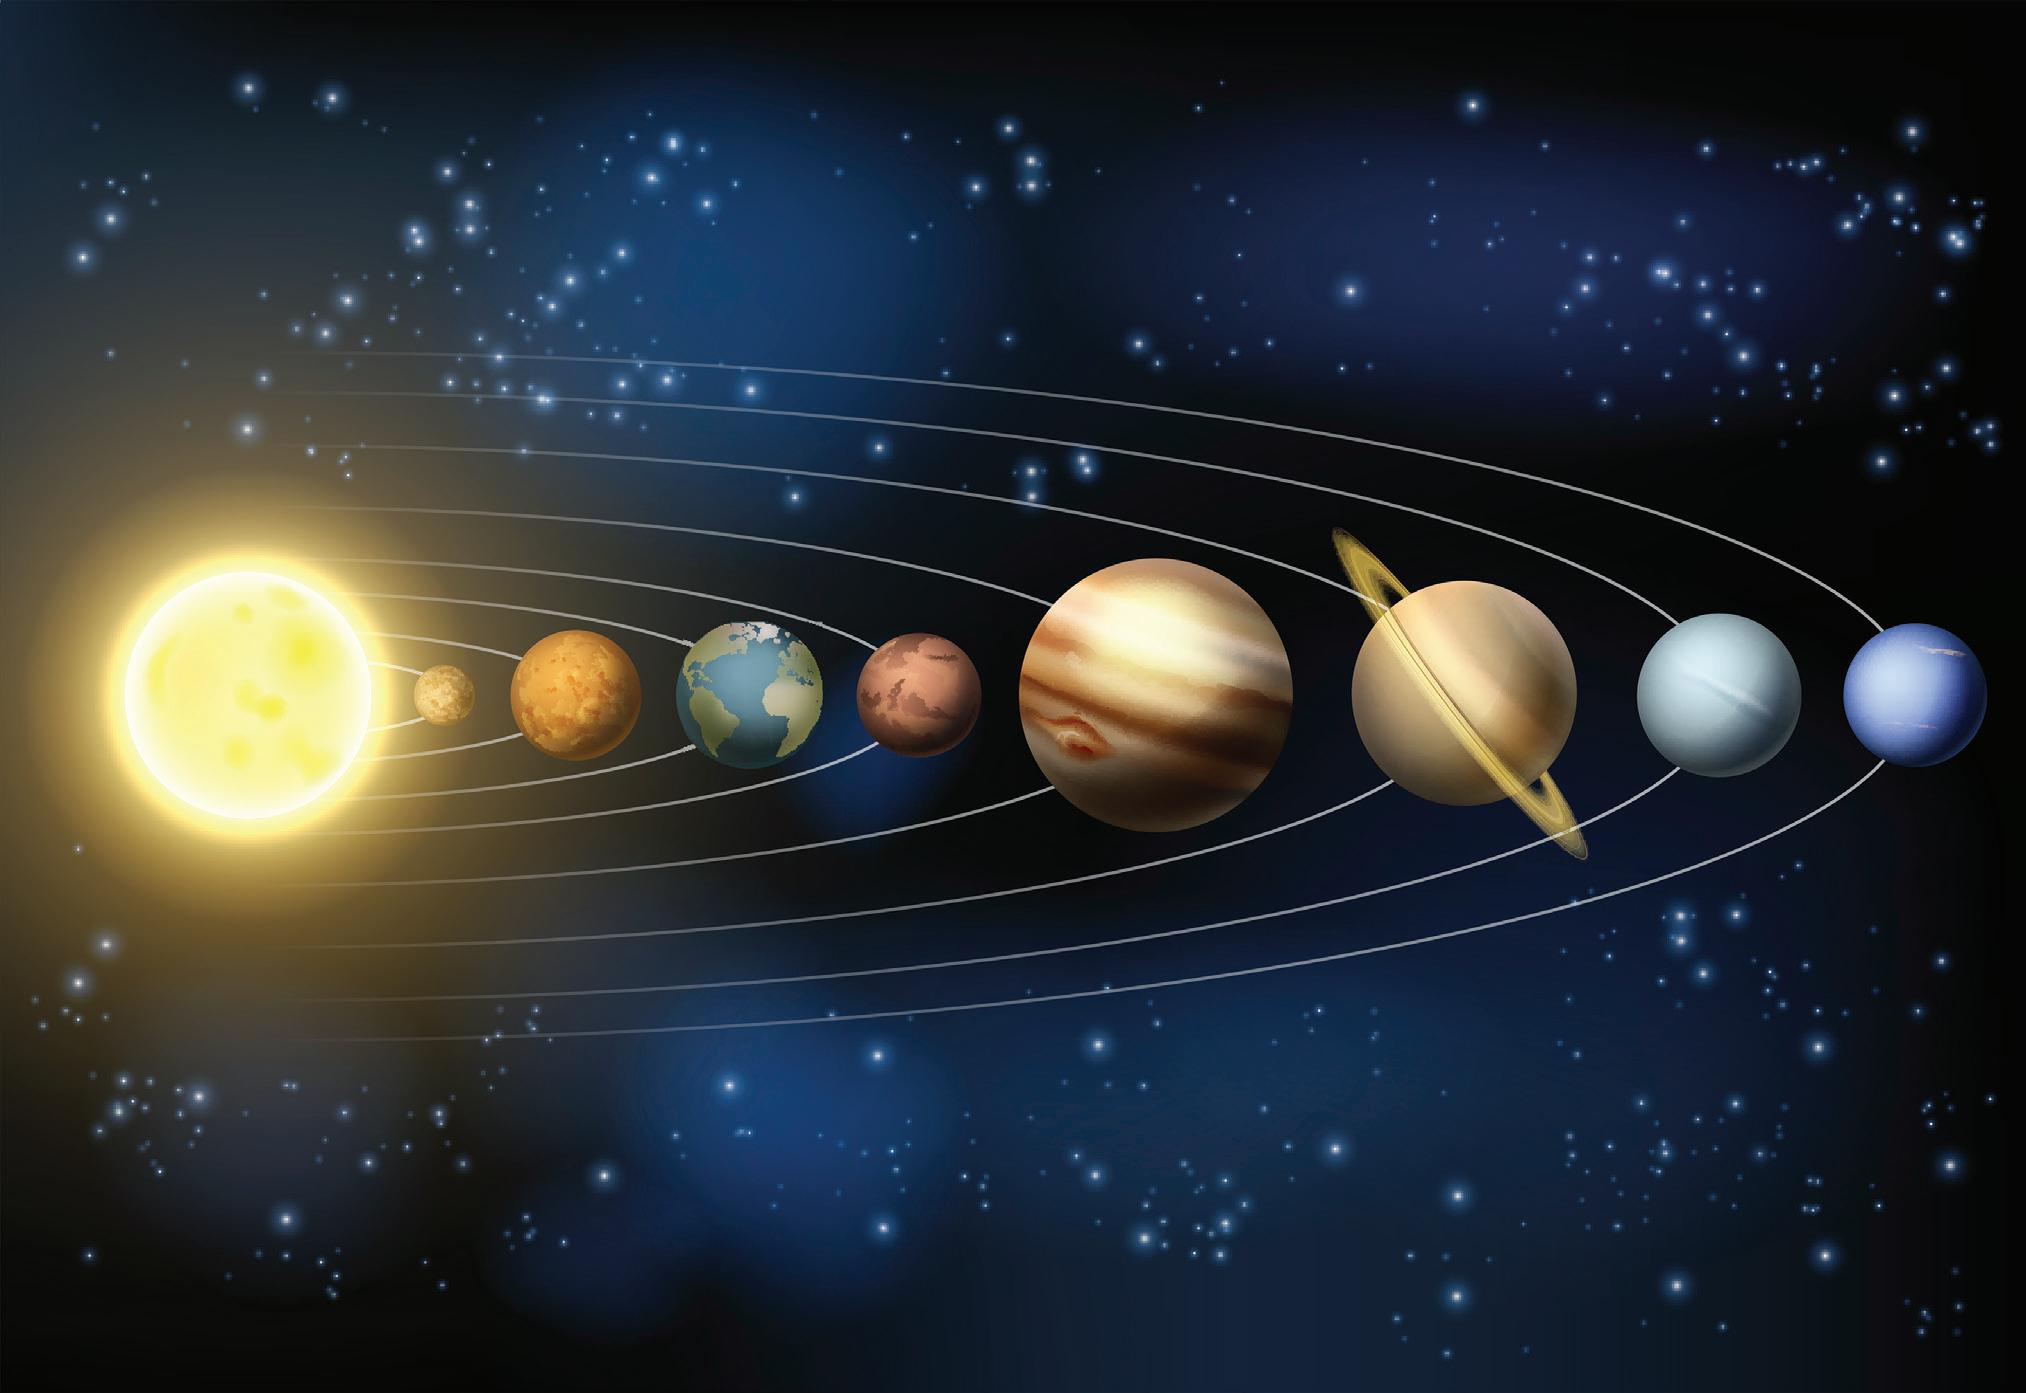
The eight planets in our solar system are Mercury, Venus, Earth, Mars, Jupiter, Saturn, Uranus and Neptune (Figure 1.1). The IAU (2006) has further resolved ‘Pluto’ as a dwarf planet by the above definition, thereby recognized as the prototype of a new category of trans-Neptunian objects.
tician and scientist from Poland), in 1514, proposed the heliocentric theory of . The ordering of planets in increasing
FIGURE 1.1 The Sun and the Eight Primary Planets of our Solar System.
order of distance from the sun is: Mercury—57.9 million km; Venus—108.2 million km; Earth—149.6 million km; Mars—227.9 km; Jupiter—778.3 million km; Saturn—1427.0 million km; Uranus—2871.0 million km; and Neptune—4497.1 million km. The size of the planets is as follows in decreasing order:
In our solar system, the earth is a unique planet which supports life and is thus termed as the living planet. It is the third planet nearest to the sun, Mercury is the nearest planet to the sun and Jupiter is the largest planet of our solar system.
Almost all the energy of the solar system is derived from the sun. The sur face of the sun is covered with burning gases at a temperature of about 6000°C. Mercury, the smallest planet, is nearest to the sun. Some of the planets, e.g., Earth, Jupiter and Saturn, have small celestial bodies called satellites in orbit around them. The moon is the satellite of the earth.
Each planet takes a different amount of time to complete one orbit around the sun. This is because their distances from the sun vary. Mercury completes its orbit in 88 days, which means that 1 year on Mercury lasts for 88 days. The earth completes its orbit in 365¼ days—the length of 1 year on earth. The moon takes about 27 days to revolve about the earth.
Table 1.1 provides a brief overview of the eight primary planets in our solar system, in order from the inner solar system to outward.
to the ancients and visible to the naked eye
Known to the ancients and visible to the naked eye
Uranus 1781 by William Herschel
Note: Pluto was considered as the ninth planet till 2006, when the International Astronomical Union (IAU) decided to call Pluto a dwarf Planet, reducing the list of real planets in our solar system to eight.
Table 1.1 Overview of the eight primary planets in our solar system
Shape of the Earth
In reality shape of the earth is not a perfect sphere, but an oblate spheroid—a sphere with a bulge around the equator (Figure 1.2). The earth is bulged outward at its equator because of the centripetal force occurring due to rapid rotation of earth on its axis. Similarly, the earth is flattened at the poles, and the equatorial diameter is large than the polar diameter by about 43 km. This actually makes a pretty big difference. Important dimensions of the earth are given in Table 1.2.
Therefore, the shape of the earth is referred as earth-like, i.e., ‘geoid.’ In addition, there are intervening highlands and oceans on the earth’s surface. The geoid is the equipotential surface that defines sea level, and is expressed relative to the reference ellipsoid (Figure 1.3). Temporal variations in the geoid are caused by lateral variations in the internal densities of the earth, and by the distribution of masses (primarily hydrological) upon the surface of the earth. Mass excess (either sub-surface excess density or positive topography) deflects the geoid upward.
1.2 Shape of the Earth
The gravity map (Figure 1.4) is what is known as a geoid; based on data, it was created by a European satellite called the Gravity field and steady-state Ocean Circulation Explorer (GOCE). Studying the geoid (Figure 1.5) can help us understand tectonic processes
Table 1.2 Important Dimensions of the Ear th
km
km
km
km
km2
FIGURE 1.3 Illustration of Earth’s Geoid Shape and Reference of Ellipsoid
FIGURE 1.4 A Model of Earth’s Gravity Field Made with Data from European Space Agency’s GOCE Satellite.
FIGURE
FIGURE 1.5 Earth’s Figure: Gravity and Geoid
and different natural phenomena like earthquakes. Scientists have established that large earthquakes move enough mass to change the gravity field. The change guides the mechanism of the quake and how much slip and uplift occurred, especially in offshore areas where it is difficult to observe (earth’s crust) directly.
Phases of the Moon
The illuminated part of the moon appears to vary in size as it revolves around the earth. In Figure 1.6 , the two circles represent moon positions. The outer circle clearly shows that exactly half of the moon is illuminated all the time. The inner circle shows what the moon looks like to us on earth during its different positions, e.g., at full moon it is a circle. Look at the moon on different nights in any 1 month, and find out whether the part of the moon that is not illuminated can be seen.
Because eclipses of the sun or moon happen relatively infrequently, they were always a cause of wonder, even fear to early peoples. Their explanations are fairly simple as shown in Figure 1.7 . There were two solar eclipses during 1987, neither of which was visible from Great Britain.
The Sun as an Input into the Earth’s System
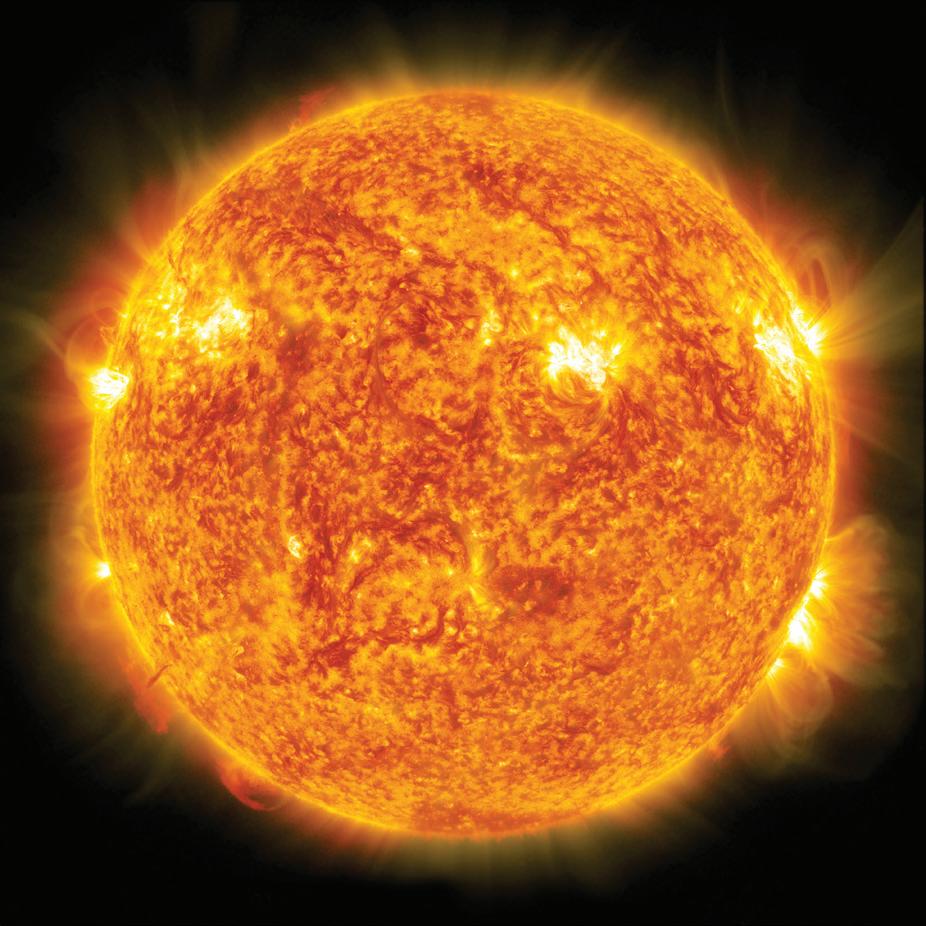
Of all the solar radiation reaching the earth’s atmosphere, 33 per cent is reflected back into the space by the upper atmosphere while the remaining 67 per cent proceeds into the atmosphere. Figure 1.8 shows the image of Sun producing energy. Out of this, 14 per cent is absorbed by the atmosphere and 53 per cent reaches the surface.
FIGURE 1.6 The Way the Moon Appears from Earth During its Revolution Around the Earth.
Moon
Eclipse of the Sun (Moon Comes Between Earth and Sun)
Eclipse of the Moon (Earth Comes Between Moon and Sun)
Eclipse of the Sun as Seen from the Earth
FIGURE 1.7 Eclipses of the Moon and Sun.
Out of the 53 per cent that reaches the surface, some is reflected back into the atmosphere and some is absorbed by the surface soil and water, which raises the surface temperature. The amount reflected into the atmosphere depends on the nature of the surface, e.g., snowfields reflect up to 80 per cent of the radiation; water surfaces reflect from 5 to 40 per cent according to whether the sun’s rays are vertical or oblique. A soil surface covered with vegetation usually reflects about 10–30 per cent. All of this is shown in Figure 1.9 (a), but it must be noted that the energy values given in this diagram are averages for the earth as a whole. As we shall see later, they vary according to the season, the latitude, the amount of water vapour in the air, and the amount of cloud cover.
Figure 1.9(b) shows that the energy reflected and re-radiated back into space equals the energy received. This incoming and outgoing energy is sometimes called the global energy balance. We shall see later that this energy balance fuels the earth’s other major cycles—the ocean currents and atmospheric circulation, as well as the hydrological cycle and the food cycle of which we all form a part.
FIGURE 1.8 Sun Produces an Enormous Amount of Energy. Nearly White Areas are the Hottest, White Deep-Red Regions are the Coolest. This Image was Taken in Extreme Ultraviolet Light by the Earth-Orbiting Solar and Heliospheric Observatory (SOHO) Satellite.
The solar energy input to the earth’s surface is vast in amount but is dissipated in various ways. Figure 1.10 illustrates this process. You will see that some of the energy is converted into heat, some powers the hydrological cycle, atmospheric circulation and the waves and currents of the oceans, and some powers the food cycle through the process of photosynthesis, which in turn links with the fossil fuels. It is important to remember that the bulk of the energy used by humankind throughout the world is solar energy that has been locked up, for vast periods of time, in the fossil fuels (oil, including natural gas and coal). The rest of the energy used by humankind comes from nuclear fission, flowing water, the wind, and to a lesser degree, geothermal activity.
(a)
33% Reflected into Space from Top of Atmosphere 14% Absorbed by Atmosphere
Of the 53% Reaching Earth’s Surface
95% Absorbed from Vertical Rays
60% from Oblique Rays
5% Reflected with Vertical Rays
40% Reflected with Oblique Rays
– 30% Reflected 51% Absorbed by Surface
Absorbed
1.9 (a) The Amount of Solar Energy Reflected from and Absorbed by the Earth’s Surface Depends on The Nature of the Surface;(continued)
FIGURE
(continued) FIGURE 1.9 (b) Earth’s Solar Energy Budget—Notice What Happens to 100 Units of Solar Energy When it Reaches the Earth’s Atmosphere. Solar
Position and Time
The position of a place on the earth’s surface
Take a large ball (to represent the earth) and mark two points on it in the centre so that they are exactly opposite to each other. Draw a line right a round the ball so that it is midway between the points all the way. The line divides the ball into two equal parts and because the ball is a sphere, each part can be called a hemisphere. In the case of earth, we call this line the equator, and you can see that it is a circle. One of the points is called North Pole and the other the South Pole (Figure 1.11).
FIGURE 1.10 The Dissipation of the Solar Energy Input.
We can now draw more circles parallel to the north and south of the equator. These can be called parallels or lines of latitude. Latitude refers to the angular distance from north or south of the equator
This idea is applied to the earth. The equator is given a value of 0°. The North Pole has a latitude of 90°N and the South Pole has a latitude of 90°S. Every other place on the earth’s surface has a latitude of so many degrees north or south of the equator ( Figure 1.12 ). Notice that the equator is the longest parallel. Figure 1.13 shows what the parallels look like on a globe from (a) the side and (b) a pole.
We can draw another set of circles on the ball, all of which pass through the two poles. That part of each circle between the poles can be called a meridian or line of longitude. This idea is applied to the earth also. The meridian, which passes through Greenwich, near London, is given a value of 0°; the opposite meridian, therefore, will have a value of 180° (Figure 1.14). Longitude refers to the angular distance east or west of the Greenwich Meridian. All places except those on Meridian 180° will have longitudes so many degrees east or west of Greenwich (Figure 1.15). Figures 1.14 and 1.16 show what the meridians look like from the side and from a pole, respectively.
FIGURE 1.11 The Poles, the Equator and the Two Hemispheres.
FIGURE 1.12 A Line of Latitude Gives the Angular Distance of a Place Nor th or South from the Equator.
FIGURE 1.14 (a) Lines of Longitude; (b) The Greenwich Meridian.
FIGURE 1.13 Parallels of Latitude on a Globe (A) from the Side and (B) from the North Pole.
FIGURE 1.15 A Line of Longitude Gives the Angular Distance of a Place East or West of Greenwich.