DATA SCIENTIST: GATHERING AND ANALYZING DATA


LESSON PLAN OVERVIEW

Career: Data scientists use scientific methods, processes, algorithms, and computer systems to extract knowledge and insights from data. Data science is also referred to as data mining and big data.
Lesson: This lesson plan provides activities for students to learn about a data scientist and how they analyze and interpret data. Students will examine and interpret data to determine if climate change is causing the sea level to rise. Students will then research how data scientists affect their everyday life and how their own data is collected and used.
Grade Level: Middle Grades
Learning Objectives:
〉 Students will be introduced to the career of a data scientist and how they analyze and interpret data.
〉 Students will examine and interpret data to determine if climate change is causing the sea level to rise.
〉 Students will then research how data scientists affect their everyday life by collecting data through online apps and social media
Materials

〉

TEACHER GUIDE
Lesson Instructions: The following activities will help you introduce students to how data scientist organize and analyze information to determine trends and solve problems. Begin the lesson by reading the Class Message below to your students, then have them watch the recommended career video. Afterwards, facilitate discussion using the Class Discussion Questions listed below.
After the discussion, students will work on two activities. Each activity has a printable worksheet with student instructions and areas to record their work. Have students read their worksheets before beginning each activity.
You should also familiarize yourself with the student worksheets to provide assistance when needed, help demonstrate any procedures, and help in facilitating the discussion that ends each activity


Class Message: Today, we are going to learn about data scientists and how they organize and analyze big data. Data scientists use scientific methods, processes, algorithms, and computer systems to extract knowledge and gain insights from data.
You will examine and interpret data to determine if climate change is causing the sea level to rise. You will then research how data scientists affect your everyday life by collecting data through online apps and social media.
Let’s watch this short video to learn more about a data scientist.


Class Discussion Questions:
〉 What do you think big data is? - Response Suggestions: massive amounts of data, all the data collected in the world, all the data collected over time; government records, purchase records, personal information, etc.
〉 Why do you think there is a need for data scientists? - Response Suggestions: to analyze data in order to identify an issue or problem, to analyze and solve problems or issues, to look for trends and patterns, to analyze and correct an issue or problem, to generate predictions for the future, etc.
〉 Why do you think companies hire data scientists? - Response Suggestions: to examine trends in the market to help them make better business decisions, to provide meaningful insights for their industry, to provide marketing strategies, etc.
Activities Overview: This lesson plan includes two student activities. In Activity #1, students will examine and interpret data to determine if climate change is causing the sea level to rise. In Activity #2, students will research how data scientists affect their everyday life by collecting data through websites, online apps, and social media.
Read and familiarize yourself with the student worksheet for each activity.

Activity #1: Climate Change – The Rising Seas
Students will learn about the career of a data scientist by analyzing and interpreting data to determine if climate change is affecting the rise in sea level
Activity Instructions:
〉 Hand out the student worksheet.

〉 Introduce the activity and guide students as needed.
〉 Optional – online access for research.
〉 After completion, facilitate a discussion using the questions for the activity.
Activity Results: Students learned how data scientists analyze data to identify an issue or problem and make projections on future change.
Scientific Questions:
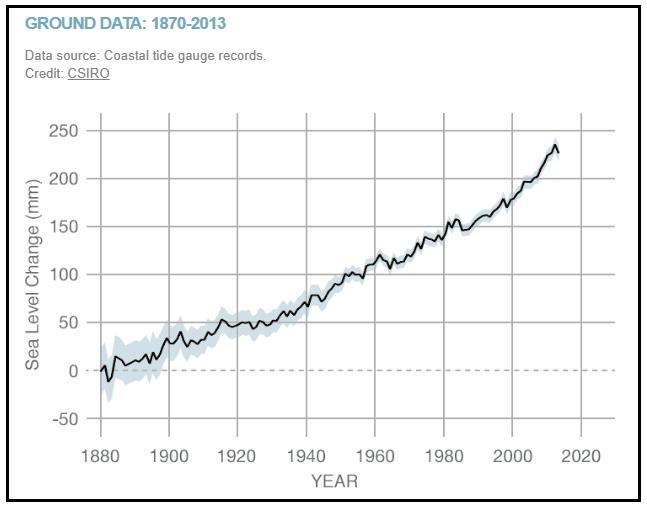
What is the source of the data for each graph?
Graph 1 – Satellite sea-level observations
Graph 2 – Coastal tide gauge records
Which years are covered by each graph?
Graph 1 – 1993-Present
Graph 2 – 1870-2013
By approximately how many millimeters did sea level rise between:
A) 1910 and 1930?
50 mm - 40 mm = 10 mm


B) 1930 and 1950?
100 mm - 50 mm = 50 mm
What is the approximate average rate of increase of sea level rise between 1870 and 2000?
The correct answer is approximately 1.3 mm per year
Note: students of various math abilities may approach and solve this problem within their capabilities. The most sophisticated approach is to find the slope of the line of best fit. Formula - Slope = Rise/Run
170/130 = 1.3
By how many millimeters did sea level rise between 1995 and 2013?
65 mm - 10 mm = 55 mm
What is the approximate rate of sea level rise between 1993 and present? 3.3 mm per year
Note: The answer for this problem is directly stated at the top of the graph, 3.3 mm per year. Students of various math abilities may approach and solve this problem within their capabilities. The most sophisticated approach is to find slope of the line of best fit. Formula - Slope = Rise/Run
90/27 = 3.3
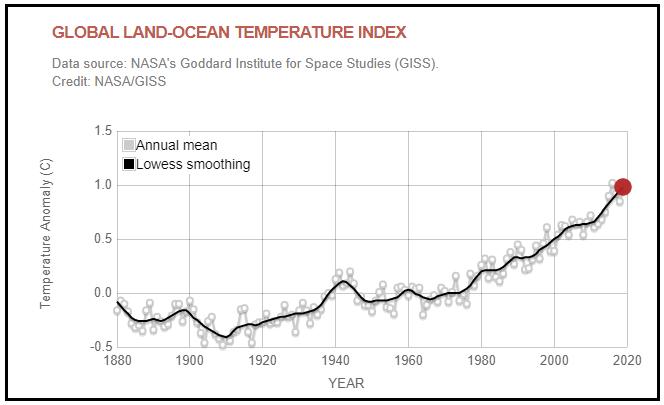
By how much did the average global temperature change, and did it increase or decrease?
A) Between 1910 and 1930?
(-0.10) – (-0.45) = 0.35 (increase by 0.35 degrees C)
B) Between 1930 and 1950?
(-0.20) – (-0.10) = -0.10 (decrease by 0.10 degrees C)
Compare your answers to question number 7 with your answers to question number 3. Can you offer an explanation for the correlation or lack thereof?
Encourage students to critically examine the graph, noting the temperature increase that occurred between 1930 and 1944, preceding the temperature decrease between 1944 and 1950. Thermal expansion of water - Consider that our oceans absorb over 90 percent of the heat trapped by greenhouse gasses in Earth’s atmosphere. When water heats up, its molecules become more energetic, causing the water to expand and take up more room, so that accounts for about a third of sea level rise. However, it may take a long time for a big amount of water like the ocean to absorb heat from the air, so it can take several years after the air warms for the oceans to absorb the heat and expand, making the water level rise.
Activity Discussion:
〉 Why do you think it is important for Data Scientists to research and track this type of information? - Sample answers may include: to analyze the data to make decisions, implement new or revised processes and procedures, to understand what is happening and why it is happening, to better manage resources to prevent the effects of climate change and global warming, etc.
〉 What do you think can be done to reduce or prevent climate change? - Sample answers may include: move away from burning fossil fuels and use more renewable resources such as wind, solar, and hydroelectric for energy;

reduce carbon footprint by using electric cars and utilizing mass transit systems; improve electric grids to be more energy efficient and save money; etc.
〉 What do you think will happen to our environment in 10 years if we do nothing?Sample answers may include: Rising sea levels could impact 1 billion people by the year 2050; changes in water temperature will cause sea life to die; Arctic ice shelf will continue to melt away; heat waves will become more severe around the world affecting humans, animals, and plants; greater risk of more frequent rainfall, snowfall, tornados, and hurricanes which increases chances of flooding, etc.

Activity #2: Collecting Your Data
Students will research how data scientists affect their everyday life and how their own data is collected and used.
Activity Instructions:
〉 Hand out the student worksheet.
〉 Introduce the activity and guide students as needed.
〉 Optional - online access for research.
〉 After completion, facilitate a discussion using the questions for the activity.
Activity Results: Students learned about the career of a data scientists by researching how they affect their everyday life and how their own data is collected and used.

Activity Discussion:

〉 What do you think companies do with this information? - Sample answers may include: target you to purchase their products, create new products based on current trends, recommend other products you might be interested in, get you to buy or recommend their products or services, etc.
〉 What concerns do you have about the privacy of your personal information?Sample answers may include: information can be used to trick you into buying something, ask you to provide sensitive information, information can be sold to others, people can find or harm me and my family, etc.
〉 What are some things you can do to stay safe online? - Sample answers may include: never give out your home address, do not give anyone your login or password, never give detailed personal information to someone you don’t know especially online, do not give out credit card or payment information unless you know it is a secure site, etc.


CAREER INSIGHT
Career Highlight: This lesson plan highlights some of the concepts and skills a data scientist uses to analyze large amounts of data to solve a problem or change a business process or product. See the Employers in My Area section to contact businesses and organizations in your area about classroom demonstrations, on-site visits, or other additional career exposure opportunities.
Featured Career: Data Scientist
Career Description: Data scientists use scientific methods, processes, algorithms, and computer systems to extract knowledge and insights from data. Data scientists prepare data for analysis, analyze data, and present findings to inform high-level decisions within an organization. Data scientists incorporate skills from computer science, mathematics, statistics, information visualization, graphic design, marketing, and business. Data science is also referred to as data mining and big data.

Data scientists invent and design new approaches to computing technology and business and find innovative uses for existing technology. They study and solve complex problems in computing for business, science, medicine, and other fields.
Data scientists write algorithms that are used to detect and analyze patterns in very large datasets. They improve ways to sort, manage, and display data. Computer scientists build algorithms into software packages that make the data easier for analysts to use. For example, they may create an algorithm to analyze a very large set of medical data in order to find new ways to treat diseases. They may also look for patterns in traffic data to help clear accidents faster.
Data scientists typically do the following:
〉 Collect large amounts of data and transform it into a more usable format.
〉 Solve business-related problems using data-driven techniques.
〉 Work with a variety of programming languages, including SAS, R, and Python.
〉 Have a solid grasp of statistics, including statistical tests and distributions.
〉 Stay on top of analytical techniques such as machine learning, deep learning, and text mining or analytics.
〉 Communicate and collaborate with both IT and business teams.
〉 Look for order and patterns in data, as well as spotting trends that can help a business’s bottom line.
Other Names for this Career: Research Scientist, Computer Scientist, HPC (High Performance Computing) Applications Manager, Control System Computer Scientist, Computer Specialist, Scientific Programmer Analyst, Computer and Information Research Scientist


