2 minute read
Key Drivers


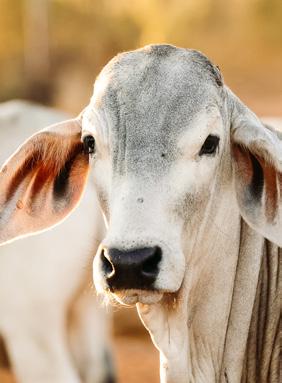
Buyside drivers aren’t as favourable as previous quarters due to interest rate rises and a decline in select commodity prices. However, buyers have taken a long term view despite these factors, in a market where buying opportunities are limited. ⋅ Australian commodity prices remain high across most categories, barley (+31pc YoY), canola (+18pc YoY), wheat (+26pc YoY), beef (+4pc YoY) and skim milk powder (+37pc YoY). Lamb and wool prices are currently the exception, trade lamb (-16pc YoY) and eastern wool indicator (-8pc). ⋅ Business interest rates continue an upward cycle, medium business rates increased 0.77pc during Q2-2022 and a further 0.44pc in July, taking the average to 3.8pc. Large business rates increased by 0.94pc in Q2-2022 and a further 0.46pc in July, taking the average to 2.95pc. ⋅ Debt to Agriculture, Forestry and Fishing increased by 8.7pc in Q2-2022 to $101.2 billion, however, the balance declined by 1.3pc in July as borrowers paid down debt. ⋅ The National Farm Management Deposit (FMD) balance at the high point of the year in June was $6.8 billion, 9.1pc higher than June 2021, highlighting the strong level of liquidity in the industry. The gap between commodity prices and rural property prices closed in Q2-2022, driven in part by increasing property values and a slight decrease in commodity prices. The likely outcome from the above drivers is that rural property prices will continue to grow in the second half of 2022, supply is tightening across the country which will drive demand higher for properties that do list. Buyers are looking to be more informed compared to previous years, however, long term confidence in the industry remains high.
2020-21 = 100 150 140 130 120 110 100 90 80 70 60 50
Advertisement
National median $/ha and rural commondity prices indexed
National Median $/ha Rural commodity prices
Q2-2017 Q3-2017 Q4-2017 Q1-2018 Q2-2018 Q3-2018 Q4-2018 Q1-2019 Q2-2019 Q3-2019 Q4-2019 Q1-2020 Q2-2020 Q3-2020 Q4-2020 Q1-2021 Q2-2021 Q3-2021 Q4-2021 Q1-2022 Q2-2022
billion $ 105 100 95 90 85 80 75
JAN-21 FEB-21 MAR-21
Debt to agriculture, forestry and shing
APR-21 MAY-21 JUN-21 JUL-21 AUG-21 SEP-21 OCT-21 NOV-21 DEC-21 JAN-22 FEB-22 MAR-22 APR-22 MAY-22 JUN-22 JUL-22
Following on from Q1-2022, interest rates continued to rise in what will become a permanent trend for the coming quarters. Despite interest rates being the most topical driver of property markets they haven’t had the most impact
in the rst half of 2022. Executive Summary, page 6