12 minute read
Software news


CityFFD – Urban environment and energy simulations on GPUs
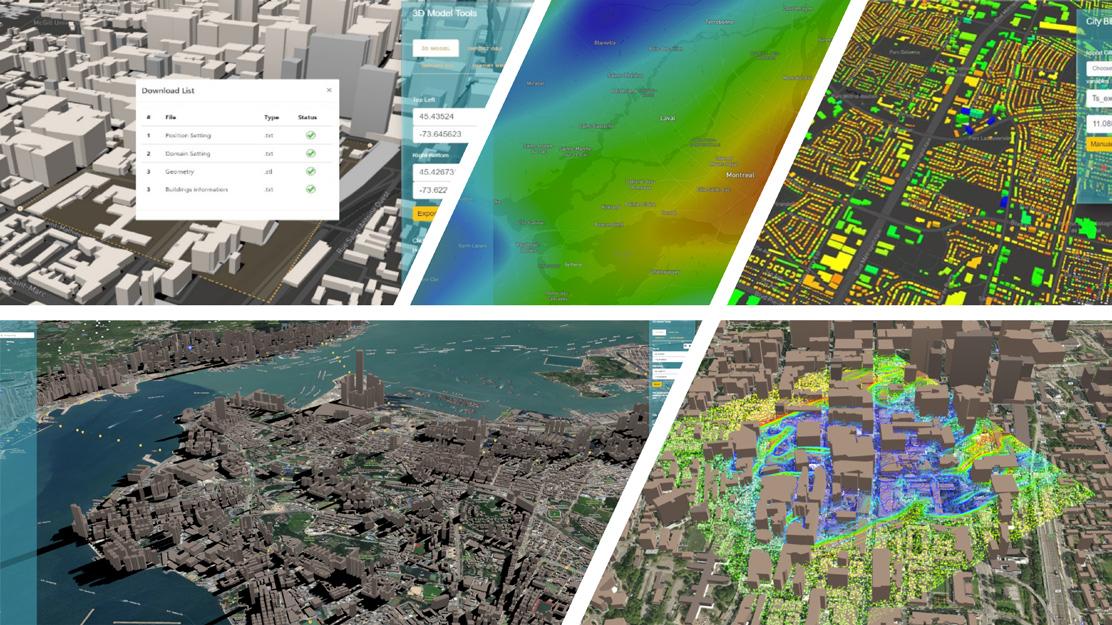
Understanding the multi-physics and multi-scale interactions for urban environment and energy performances is becoming essential, driven by broad concerns over climate change and interests in smart city designs and operations. Such an analysis is often associated with computational fluid dynamics simulations of urban aerodynamics and thermal conditions at a building level, whereas existing models have been limited by computing costs, data availability, and large-scale validations and accuracies. Dr. Leon Wang’s team at Concordia University developed CityFFD – City Fast Fluid Dynamics, with its supporting web portal of digital cities. Speed and accuracy are maintained through novel numerical algorithms with large eddy simulation implemented on graphics processing units (GPU) and validated through a wide range of benchmark cases. We demonstrated a new approach to modeling urban microclimate by CFD on GPUs widely available on modern PCs.
Advertisement
Learn More at https://users.encs.concordia.ca/~leonwang/moodle/ and https:// doi.org/10.1016/j.uclim.2021.101063. n
cove.tool update their HVAC design software, loadmodeling.tool
In 2021, cove.tool launched loadmodeling.tool (https://www.cove.tools/ loadmodelingtool-hvac-design), a robust HVAC design and load modeling program designed to empower mechanical engineers, energy modelers, and HVAC contractors to design, optimize, and collaborate within the cove.tool platform. The automated tool can help establish peak cooling and heating loads to design and right-size mechanical systems. The software’s interoperability and ease of use has revolutionized the way engineers design and optimize their models.
How does it work?
loadmodeling.tool uses the EnergyPlus engine for detailed, room-by-room load calculations and HVAC system sizing. Models are created via a web interface that provides full customization of geometry, templates, schedules, systems, and more. The defined model is then processed with the help of the OpenStudio SDK, and a simulation is run, all on the cloud. Models and results are accessed via a web-interface for quick performance and ease of sharing results with large teams. The entire model is always exportable to OpenStudio and EnergyPlus native files for use or record keeping offline.
When is loadmodeling.tool used?
Engineers and contractors use loadmodeling.tool from early schematic design phases until the end of construction. At the schematic and design development stage, it helps right size equipment for selections and automates the evaluation of energy-saving concepts, such as the effects of daylighting, HVAC optimization strategies, and highperformance glazing. At the construction drawing phase, the model can be updated further to produce final zone, system, and mechanical plan sizing reports.
The software is continually being updated to provide more powerful features and functionality.
Key Features
n Room Templates - handles creation, customization, assignment and saving back to the library templates for rooms. This is where internal gains, set points and outside air flow rates are assigned. n Schedules - handles creation and customization of all detailed schedules, which are assigned throughout loadmodeling.tool. Here specific schedules for equipment, lighting, occupancy, etc. are created for use or saved back to the library. n Project Data Editor - allows for in depth view into the project details. In version 2 zones can be created and assigned here, along with zone assignment to air systems. n Air System Inputs - handles the creation from template and customization of Air Systems. Air Systems include all central and local equipment that provide the heating, cooling and ventilation to zones. Air Systems can be sized with the platform. n Results - provides reporting of cooling and heating loads for each Zone and each Air System in a model. A detailed breakdown of the load is provided in an easy to understand graphic. Full results can be downloaded from this page to a spreadsheet or pdf. n General Settings - includes the high-level settings of the model, such as heating and cooling sizing factors. The run simulation button, along with weather and design day controls. The building analysis model can also be downloaded here as a .osm, .idf, .gbxml.
Latest updates
loadmodeling.tool Version 2.5 offers several new air system components, including:
n Active Chilled Beams n Parallel Fan-Powered Boxes n Series Fan-Powered Boxes n Induction Units n Local Fan Coil Units n Packaged Terminal Air Conditioners (PTAC) n Water to Air Heat Pumps (WAHP) n Energy Recovery Ventilators (ERV) n Packaged Terminal Heat Pumps (PTHP) n Unit Heaters n Radiant Cooling Panels (RCP) n Baseboard Heaters
and a Project Input Report which summarises the key project inputs.
Upcoming Features
n Mechanical Plant Modeling and Sizing n Room in Zone results n Ventilation Calculation Tool n Improved BIM imports n Additional automation and templates
More information about loadmodeling.tool is available from on our website at https://www.cove.tools/loadmodelingtool-hvac-design. n
LUMO: a learning tool for sunscreen & daylighting design
Aloísio Leoni Schmid, Professor, Graduate School of Civil Engineering, Federal University of Paraná, Curitiba, Brazil, iso@ufpr.br
LUMO was conceived to support the learning of solar geometry concepts in an innovative way. It uses an interactive graphic interface that resembles a spaceship cockpit, with a kind of tracking ball that governs the time macro-scale, and a power grip that controls the time micro-scale with the movement of a photon from the sun to the building on Earth. In doing so, it reveals the Astronomic origin of well-known rules of thumb used in the design principles of sunscreens.
Once the day of the year and the time of the day are set, Earth is approached up to the point the photon sees an outdoor isometric perspective of the building with the window. Solar incidence and daylighting parameters can be simulated at this stage. Next, a sunscreen is input as composed of prismatic elements (in the shape of brisessoleil, marquise, venetian blind or other devices). Finally, daylighting parameters with the sunscreen are calculated, providing comparison criteria. Different resources like
the solar chart, isolux lines and Spatial Daylight Autonomy (SDA) and Annual Solar Exposure (ASE) plots are available. Figures 1 and 2 illustrate a typical run of LUMO.
Figure 1
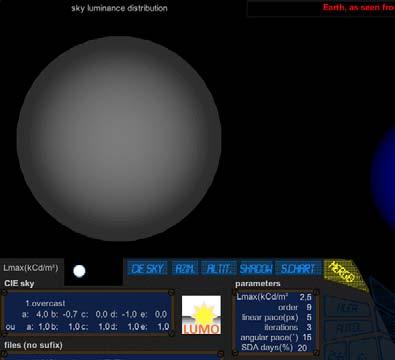


A sun ray targeting Curitiba, Brazil (lat. -25˚, long. -49˚). Date is June 21, Winter solstice in the Southern hemisphere, at 4 P.M. Above, left: overcast sky model. Right: Earth orbit scheme
View from a photon approaching Earth and turning 180˚ around its own axis View from photon closer to building showing north-facing window Fast daylight render and isolux plot under overcast sky
Written during the fi rst pandemic year of 2020 in Java, LUMO implements the modeling of solids as diverse in scale as the sun, the Earth, and a room of rectangular plan to be lit by a single window which may be on a vertical, sloped or horizontal façade plane (last case is that of a skylight). It may also comprise an upper pane of a different glazing type (e.g. translucent). LUMO also models something as thin as a single venetian blind. The Earth with the building on it and its sunscreen undergoes a translation around the sun and a rotation around its own axis that is inclined at 23˚45’ to the ecliptic plane. That allows the precise modeling of shadows in the room scale.
The atmosphere is modeled according to the various CIE sky models, providing a distribution of diffuse light, comprising both sky and albedo. That allows the numeric simulation of daylight in the room. Several, well-known Computer Graphics techniques are used to produce images, which are different kinds of perspectives. Rendering itself is supported by the use of numeric methods of raytracing and radiosity.
Figure 2

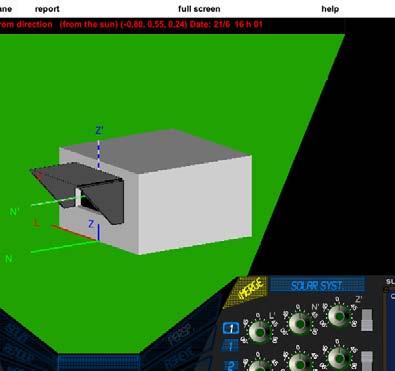

Solar protecting device entered by coordinates on the panel right side. It consists of three prismatic solids: a marquise and two vertical, trapezoidal fi ns
Isolux plot with sunscreen Solar stain plot (clear sky) LUMO’s photon-shaped spaceship
Architect Rafael Santos Fischer, an experienced user of building simulation software and developer, wrote that LUMO is a rather useful tool to help architects design, assess, and evaluate sunscreens in building design. It saves designers modeling time by providing a default building template. All-in-all, the software has a great potential to be a helpful tool during the design processes, producing data that can drive a more scientifi c building design process. In a semester beginning in February, 2021, the author’s own, 4th semester architectural students at UFPR were (individually) assigned a task of designing an effective sunscreen for an existing window in their own residence. The majority of a group of 50 students preferred LUMO to usual plugins of building modeling tools and declared themselves satisfi ed with its usability.
For free download, installation and operation, see Lumo’s handbook at https://www. researchgate.net/publication/344159353_LUMO_20_FOR_SUNSCREEN_STUDY_ AND_DESIGN_SOFTWARE_HANDBOOK n
Oops … New Global Simulation Climate Data Set from Climate. OneBuilding.Org
Oops… in last fall’s IBPSAnews, we said that an updated TMYx climate data set with data through 2020 was available. For multiple reasons (data synchronization of multiple data sources, etc.), we were not able to complete that update. But now, we have updated the TMYx climate data set with data through 2021.
In early 2022, Climate.OneBuilding.org updated their worldwide TMYx data set with weather station meteorology data through 2021 and corresponding solar radiation from the ERA5 reanalysis data set (https://www.ecmwf.int/en/forecasts/datasets/ reanalysis-datasets/era5). The ERA5 data, courtesy of Oikolab (https://oikolab.com), provides a comprehensive, worldwide gridded solar radiation data set based on satellite data. The new data set adds more than 1000 new locations (>10% increase), bringing the total to more than 14,500 locations. These (and all other weather files on the site) also include the latest ASHRAE 2021 design conditions.
The TMYx are derived from hourly weather station meteorology data through 2021 in the ISD (US NOAA’s Integrated Surface Database) and gridded solar radiation data from ERA5 reanalysis using the TMY2/ISO 15927-4:2005 methodologies. Often, there are two TMYx for a location, e.g., for Washington Dulles Intl AP: USA_VA_DullesWashington.Dulles.Intl.AP.724030_TMYx and USA_VA_Dulles-Washington.Dulles. Intl.AP.724030_TMYx.2007-2021. In these cases, there’s a TMY for the entire period of record and a second TMY for the most recent 15 years (2007-2021). Not all locations have recent data.
With this update, Climate.OneBuilding.org now provides TMYx climate data at no cost for more than 14,500 locations worldwide and another 3,200 from other data sources. All data have been through extensive quality checking to identify and correct data errors and out of normal range values where appropriate.
Each climate location .zip contains: EPW (EnergyPlus weather format), CLM (ESP-r weather format), WEA (Daysim weather format), and PVSyst (PV solar design weather format NEW!) along with DDY (ASHRAE design conditions in EnergyPlus format), RAIN (hourly precipitation in mm, where available), and STAT (expanded EnergyPlus weather statistics).
For more information or to download any of the weather data (no cost), go to http://Climate.OneBuilding.org n
EWE: Exemplary Weather and Energy index
Exemplary Energy publishes, as a free monthly benchmarking service to industry, the Exemplary Weather and Energy (EWE) Index. At present the EWE Index is available for Brisbane, Canberra, Perth and Sydney, and the authors aim to expand the service to all eight capital cities in Australia in the coming weeks.
The weather part of the EWE analysis is focused on comparing the mean dry-bulb temperature, relative humidity, wind direction and wind speed of the current month to the long-term average, based on Real Time Year (RTY) datasets that are produced continuously as compared to the Reference Meteorological Year (RMY) for each location. The fi gure below shows the monthly infographic summarising the weather analysis for February 2022.
The energy part of the EWE analysis is based on energy models of three archetypical buildings – a 10-storey offi ce, a 3-storey offi ce and a single level supermarket – and an optimum-tilt residential solar PV system. We apply the RTYs to the models, presenting the results in the form of deviations of the monthly means of minimum, average and maximum recorded data, as well as a comparison of the energy performance of the buildings and the PV system.
The EWE index ultimately aims to support PV owners and Green Star, SmartScore, NatHERS and NABERS-rated building owners and facility managers. Users employ the tools to determine the likelihood that lower performance is being driven by weather anomalies, and to trigger investigations into underperforming buildings and promptly evaluate potential corrective actions as appropriate.
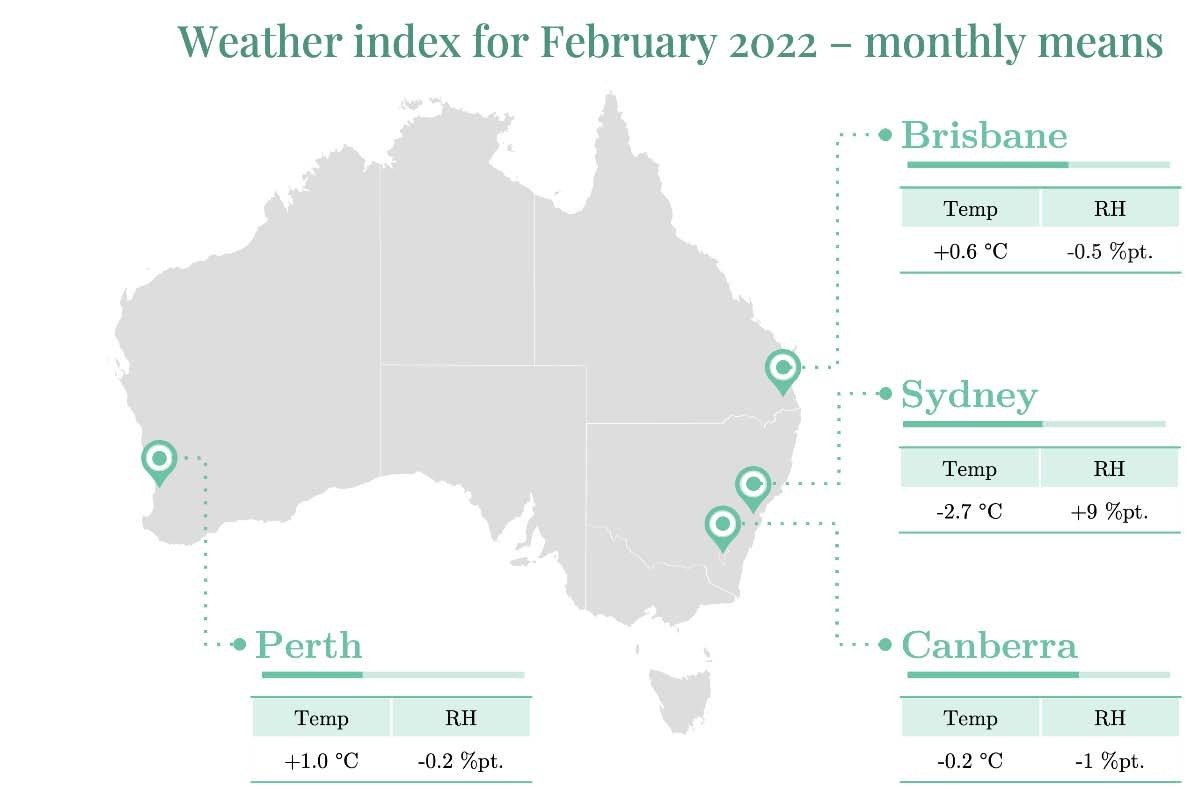
EWE index infographic - February 2022
More information can be found at https://exemplaryenergy.wordpress.com n
DesignBuilder releases new free short tutorials, case studies, and webinars

New tutorials
DesignBuilder have released a new series of free short tutorials that provide concise guidance to help you get started using the software. They also enable existing users to refresh their knowledge with the latest tools, techniques, and tips to help improve their modelling efficiency.
A few highlights in this latest series of tutorials include:
n Using geometry convention templates to ensure correct volumes and surface areas. n Using the same model to comply with codes having different geometric conventions (gross/net areas/volumes) without rebuilding your model. n Specifying the performance of opaque building fabric and glazing. n Quickly and easily applying opening and shading data to selected facades. n Modelling the time-varying heat gains in a building from occupancy, equipment, lighting etc., and the time-varying operation of HVAC systems.
The tutorials are freely accessible at https://designbuilder.co.uk/training/tutorials and cover several essential areas of DesignBuilder modelling. If you have never received DesignBuilder training or were trained using earlier versions of the software, we would strongly recommend that you view these short high-impact tutorials.
New case studies
Fabric and service design for a college teaching building in South India PSI Energy (https://psienergy.in) used DesignBuilder’s tools to optimise the fabric and service design for a college campus teaching building in South India, aiming to discover the architectural and system design solutions offering the best energy performance at the lowest cost. The detailed analysis enabled the team to identify a set of optimum solutions and to provide suitable recommendations in timescales
that would not be possible using traditional iterative simulation methods. You can read more about the project in https://designbuilder.co.uk/casestudies/ PSICaseStudyCampusOptimisation.pdf
Sensitivity analysis to simplify and speed up optimisation In this case study, written by Chad Isnor, a Sensitivity Analysis is carried out as a precursor step to improve the clarity and accuracy of the design optimisation outputs. If you’ve ever wondered how to go about systematically quantifying and ranking the impact of the various design decisions in your simulation projects, then this case study is well worth a look. You can read more about the project in https://designbuilder. co.uk/casestudies/PSICaseStudyCampusSAImprovesOptimisation.pdf
There are more case studies at https://designbuilder.co.uk/about-us/case-studies.
New Webinar
A new webinar Modelling HVAC Systems: From Concept Through Detailed Design has been added to our website at https://designbuilder.co.uk/training/webinars. This webinar explains the HVAC modelling capabilities in DesignBuilder, illustrating which is best for early and detailed design and so on.
For up-to-date information on new webinars, case studies and software releases, you can subscribe to our free monthly newsletter at https://designbuilder.co.uk/aboutus/newsletter. n


