68 minute read
UPTAKE OF INDUSTRIAL ELECTRIFICATION


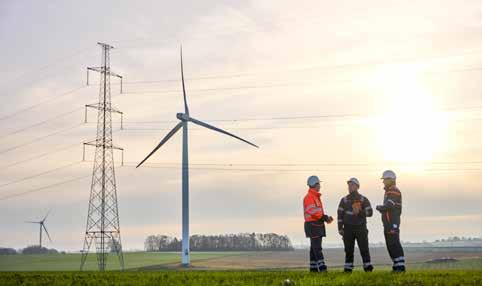
4. NEWLY ELECTRIFIED INDUSTRIAL PROCESSES OPERATING FLEXIBLY AT TIMES OF SCARCITY CAN STRONGLY REDUCE THE NEW CAPACITY REQUIRED FOR ADEQUACY
Many industrial players in Belgium are front-runners in terms of electrification: they have been carrying out pilots and investments as part of their decarbonisation strategies. Powering Industry towards Net Zero’, Elia Group’s latest study on industrial electrification, concluded in 2022 that Belgium’s annual industrial electricity consumption is due to increase significantly in the lead-up to 2030.
The signs that these projections will materialise are present: several concrete project announcements have accompanied a steep increase in connection requests to the transmission grid. Even if industrial projects are at an advanced stage, it’s not a given that all of them will come to fruition (or that additional projects won’t be added). Clearly, these uncertainties are an integral part of the decision-making process for our energy system: infrastructure development must be anticipated as security of supply is a prerequisite for anchoring industry in Belgium.
The timely realisation of the Ventilus and Boucle Du Hainaut projects is a precondition for enabling largescale industrial electrification in Belgium: both projects are essential for bringing offshore renewable energy to land. This is especially true for the West-Flanders and Hainaut provinces, since the new axes will also strengthen supply to the adjacent 150 kV grids. They are vital links for creating the necessary hosting capacity for new and reinforced connections due to industrial electrification, therefore ensuring the economic attractiveness of different provinces and regions.
▶
More information can be found in Section 3.3.5 of this study
To ensure industry can access large amounts of low-carbon electrons, an unprecedented build-out of on- and offshore infrastructure (for the production, distribution and transmission of low-carbon electricity) needs to be undertaken.
Newly electrified industrial processes could deliver important benefits for the system if these can be operated in a flexible manner, particularly during moments of scarcity, as assumed and quantified in this study. Discussions with all involved partners should be held in order to assess the implications, benefits, barriers and operational implementation of such an approach.
Withlowflexibilityfromnewlyelectrifiedindustry WithlowflexibilityfromEV/HPs
For this study, 70% of the newly electrified industrial demand is assumed to be able to be reduced at times of scarcity by 2030. Likewise, at the residential level, two thirds of EVs are assumed to exhibit some level of intelligent charging; one third of HPs are assumed to react to local or market signals; and more than half of home batteries are assumed to participate in the energy market.
Together, these flexibilities can avoid needing to add about 2.5 GW of additional capacity to the system, on top of the 2.9 GW of additional capacity needed by the end of 2029. If only low levels of flexibility are unlocked by the end of 2029, more than 1 GW of additional new capacity will be required in the system on top of the 2.9 GW.
The volumes of reserves needed to keep the system balanced in real time will also increase in future due to additional levels of volatility in the electricity system. Unlocking the above levels of flexibility in the system will allow this increase to be reduced by 65% (from a factor of 2 compared with today’s needs to a factor of 1.3), so leading to substantial cost savings for society.
▶ More information can be found in Section 4.5 of this study
5. EVOLUTION OF THE BELGIAN ELECTRICITY MIX UNDER THE CENTRAL SCENARIO
Future European Electricity Mix
Nuclear power has historically been the primary source of electricity generation in Belgium. Beyond 2025, Belgium will predominantly rely on RES and gas for its domestic electricity generation, as nuclear production decreases. A part of its generation will also be replaced by imports.
According to the simulations carried out in this study, Belgium will be a net importer of electricity in the future, resulting in a lower total amount of domestically generated electricity in comparison with the total amount consumed. Consequently, the share occupied by domestic RES in the total level of consumption (around 40% in 2035) will be lower than in the total level of generation (60% by 2035).
• In the first few years nuclear generation will be replaced by imports and gas-fired generation, in line with the capacity mix*.
• After 2030, the contribution of gas-fired generation will decrease, and domestic RES will mainly compensate for this. New offshore power generated in the Princess Elisabeth Zone will significantly contribute to this reduction in gasfired generation.
• In the long run the contribution of RES will increase and will mainly compensate for the expected increase in electricity consumption. The share of imports will increase following the commissioning of Nautilus and TritonLink, as both interconnectors will allow more RES to be imported into Belgium.
▶ More information can be found in Section 7.2 of this study
* The extent to which gas-fired generation is used will depend on various factors such as the installed capacity mix, both in Belgium and abroad, and fuel and CO prices. Indeed, when gas prices are lower, operational costs for gas-fired units decrease compared to coal and lignite units, and gas generation in Belgium is seen to increase. This impact is estimated to manifest itself in the system over the next decade; it will carry diminishing significance as the phase-out of coal progresses.
Sources: EMBER for 2000-2022. Elia’s simulations of the EU-BASE scenario for future years.
The European electricity mix is being profoundly transformed as the continent shifts from using fossil fuels to renewable energy. Currently, the share occupied by EU27 electricity generated by RES (RES-E share) stands at 39%. This percentage is expected to exceed 50% and 60% by 2025 and 2030 respec- tively. Together, on- and offshore wind power are expected to become the most important source of electricity from 2025 onwards. By 2035, low-carbon energy sources (mainly RES and nuclear) are estimated to account for more than 85% of the European electricity mix.
6. DELAYS IN THE CONSTRUCTION OF GRID INFRASTRUCTURE WILL NEGATIVELY IMPACT ADEQUACY AND REQUIRE ADDITIONAL INVESTMENT IN NEW CAPACITIES
7. ADDITIONAL ELECTRIFICATION DELIVERS LARGE BENEFITS IN TERMS OF CO2 EMISSION REDUCTION
The evolution of the power sector’s CO2 emissions (including imports) and offsets in other sectors due to electrification (compared with 2022)
The increased electrification of demand requires distribution and transmission grids to be strengthened and expanded. The timely realisation of grid infrastructure is instrumental, as infrastructure developments have a significantly longer lead time compared with industrial projects. Streamlining permitting procedures will be an important lever in this timely realisation of grid infrastructure.
The need for additional capacities in Belgium is seen to remain quite stable between 2029 and 2033 while consumption rises. This favourable trend is directly linked to the commissioning of the Princess Elisabeth Zone and additional interconnectors like Nautilus and TritonLink*.
This study clearly underlines the importance of the punctual realisation of crucial backbone investments in the Belgian transmission grid, such as Boucle du Hainaut, Ventilus and the HTLS upgrades. Without these projects being realised, the need for new capacity in Belgium will continue to rise after 2029.
▶ More information can be found in Section 4.5.7 of this study
Electrification gains only. This excludes other measures such as insulation, modal shift, energy efficiency in industry, ban of oil boilers for heating… Power generation emissions are an output of the electricity market model and include emissions from imports as well as assuming 1 new CCGT in Belgium from 2028 (on top of the already 2 new CCGT contracted).
Heat pumps emissions reductions are compared to a gas boiler as alternative in new and renovated buildings. EVs emissions reductions are compared to gasoline cars, whereas vans, buses and trucks are compared to diesel vehicles
Industry: assumption that e-boilers and HPs replace gas based heating systems
Based on the EU-BASE/CENTRAL and ‘Mix’ GAP filling scenario
Electrification offers important opportunities for reducing the consumption of fossil fuels, which leads to significant reductions in direct domestic CO2 emissions.
The replacement of internal combustion engine vehicles, gas boilers for residential and tertiary heating and fossil based heat supplies in industry will lead to a significant reduction in (direct) emissions in these sectors. The analyses only take the effect of electrification into account. Indeed, there are many other levers that will result in lower CO2 emissions, such as additional energy efficiency or sufficiency measures (changes in behaviour and the usage of energy).
In the short term, total emissions (domestic and imports) deriving from the generation of power in Belgium are expected to increase and stagnate in the longer term. This is mainly due to additional gas generation, which will increase the CO2 intensity of electricity generation in the lead-up to 2026.
Beyond 2026, CO2 emissions linked to power generation will steadily decrease due to more RES entering the system. In the early 2030s, this decrease will slow, caused by the increase in electricity demand.
The electrification of the mobility, heating and industrial sectors will more than compensate for the additional emissions linked to the increased power generation needs. The effect of electrification can reduce emissions by more than 10Mt CO2 by 2034 and almost 20Mt CO2 when including carbon capture and storage (CCS) in industrial processes. While CCS is not seen as direct electrification, it requires large amounts of electricity, which is accounted for in the electricity consumption.
▶ More information can be found in Section 7.6 of this study.
8. DECREASING AMOUNT OF RUNNING HOURS OF GAS-FIRED UNITS IN BELGIUM
For a well-interconnected country like Belgium, the running hours of a given technology are mostly driven by its place in the European merit order. The merit order is a way of ranking available energy resources for electricity generation. It is based on the lowest marginal cost and defines the sequence in which power plants are designated to deliver power, with the aim of economically optimising the electricity supply.

The figure shows the simulated running hours for the most efficient CCGT, an existing CCGT and an old CCGT unit in Belgium (on average and for the 10th and 90th percentiles). Over the next 10 years, the number of running hours will decline for the three types of CCGT plants. This decrease is mainly explained by the increased penetration of RES which is expected to occur both in Belgium and abroad.
For the old CCGT units in Belgium (the least efficient CCGTs), the running hours will slightly increase in 2034 as the European mix starts to include more technologies with higher marginal costs, such as hydrogen units.
▶ More information can be found in Section 7.5 of this study.
9. EVOLUTION OF SIMULATED AVERAGE ELECTRICITY WHOLESALE PRICES IN BELGIUM
Over the next two years, the simulated average price for the LOW price scenario is calculated at approximately 70 €/MWh, while it triples for the HIGH price scenario. This discrepancy arises from the influence of gas-fired units on price determination, as changes in their marginal cost will significantly impact average electricity prices.
Rising carbon prices further contribute to higher average wholesale prices, while planned thermal decommissioning exacerbates this effect. However, the substantial deployment of RES, with its near-zero marginal cost, will drive down future wholesale prices.
▶ More information can be found in Section 7.4 of this study.
10. SYSTEM FLEXIBILITY NEEDS WILL BE INCREASING IN THE RUN-UP TO 2034
Methodology
Close collaboration with the Belgian electricity sector

In line with the Belgian Electricity Act, this study was prepared in collaboration with the Federal Public Service (FPS) Economy and the Federal Planning Bureau, and in consultation with the Commission for Electricity and Gas Regulation (CREG). Regular meetings and consultations were held with these institutions from October 2022 onwards, and a review of the draft documents took place.
In addition, a public consultation was held in November 2022, during which stakeholders were given the opportunity to review and to learn about the data and methodology used and different scenarios explored for the study. Following this, Elia received over 200 comments and suggestions from 15 stakeholders.
This study meets Belgian and European requirements and includes up-to-date information
After EU Regulation 2019/943 came into force (October 2020), the EU Agency for the Cooperation of Energy Regulators (ACER) approved a new set of methodologies for performing future European Resource Adequacy Assessments and national adequacy assessments.
ACER stipulated that the new methodologies should be implemented before the end of 2023. However, to ensure that the results obtained for this study were robust and reliable, Elia decided to implement the new methodological approaches earlier than required by ACER.
Flexibility needs will increase in the run-up to 2034. This is explained by the integration of variable renewable capacity into the system, such as wind power and photovoltaics. The development of additional offshore wind power capacity, which is due to increase to up to 5.8 GW by 2030, will be an important driver for these increasing needs.
As 2034 is approached, the importance of intra-day markets will increase with regard to managing forecast updates several hours before real time, which can amount to up to more than
4 GW (accounted for as ‘slow flexibility’). At the same time, the amount of required ‘fast flexibility’, that can react within 15 minutes to cope with prediction errors linked to renewables and generation and transmission (HVDC) asset outages is expected to double, reaching almost 3 GW. The same holds for ‘ramping flexibility’, which is able to react within 5 minutes, to manage up- and downward variations in generation and demand in real time; this is expected to reach approximately 500 MW in 2034.
Provided that the electricity system is adequate, the analysis shows that sufficient flexibility means are expected to be present in the system. However, significant volumes of this flexibility still need to be unlocked (e.g. end user flexibility), which requires the implementation of an improved market design and the remaining barriers to consumers participating in the market to be overcome. Upfront reservation of (part of) the balancing capacity can be required to ensure its availability in real-time.
The development of sufficient flexibility in the system is very important both for the market to balance portfolios and for Elia to manage the remaining system imbalance and ensure operational security.
▶ More information can be found in Section 6 of this study.
A wide range of stakeholder proposals were integrated into this study. Firstly, as suggested, the latest data relating to 2022 for all countries was included into the scenario trajectories (amount of RES, EVs, HPs, offshore ambitions, electrification, impact of the ‘energy crisis’). Secondly, several assumptions were updated or further expanded upon such as the investment costs, additional segmentation of EVs per type, and price cap increase rules. Finally, the study includes hundreds of simulations and assesses all years between 2023 and 2034 (the year 2023-24 was included following requests from several stakeholders). The requested sensitivities included (amongst other sensitivities): the pace of RES development; availability of generation abroad; delays to grid development; higher/lower consumption forecasts; high/lower fuel and carbon prices; and higher/lower flexibility unlocked across the industrial and residential sectors.
This study is therefore fully aligned with the current legal and regulatory framework, including EU legislation (such as the Clean Energy for All Europeans Package) and the European Resource Adequacy Assessment (ERAA) methodology.
The scenarios explored in this study are based on the most up-to-date information that Elia had access to at the end of February 2023. This includes the regional and federal ambitions which are now covered in the Regional/Federal Energy Climate Plans and will be integrated into the draft Belgian National Energy and Climate Plan, which will itself be submitted to the European Commission by the end of June 2023. This study also includes Europe’s most recent ambitions, policies and targets (Fit for 55, REPowerEU), Member State plans or ambitions; the most recent offshore wind ambitions; and public announcements (e.g. national unit closures/extensions, historical data), national adequacy studies and bilateral discussions. The scope includes 28 countries: all EU countries (except for Cyprus and Malta) along with Norway, Switzerland, and the UK.
1.1. BACKGROUND TO THIS STUDY
The energy system is currently evolving at an exceptional pace. Amid a background of shifts away from fossil fuels, increased targets linked to the build-out of renewable energy sources (RES), the electrification of society, concerns related to energy security and affordability (linked to the Russian invasion of Ukraine and the energy crisis), three facets of the energy system are at the forefront of public debate: security of (energy) supply, affordability and tackling climate change. Security of supply and affordability are essential for society, as it ensures that people have access to reliable and affordable energy sources, which are crucial for daily life and the economy. The recent energy crisis, which was linked to the Russian invasion of Ukraine, has highlighted the critical importance that energy security plays. Depending on a single energy source or supplier can increase a country’s vulnerability and increases the risk of supply interruptions, which can have severe consequences for society. The recent energy crisis has also demonstrated that it is key for countries to diversify their energy sources and suppliers but also to invest in solid energy infrastructure to ensure a stable, affordable and secure energy supply for the future.
The fight against climate change is one of the most pressing challenges facing the world today. The European Union (EU) has been at the forefront of efforts to address it. The EU’s commitment to climate action and the implementation of the 2019 Clean Energy Package are important contributors towards achieving the goal of limiting global warming to well below 2°C, as outlined in the 2015 Paris Agreement. This package was complemented with additional measures, policy proposals and enhanced ambitions from Member States.
Developments of European energy policy
Since the publication of Elia’s previous ‘Adequacy and Flexibility Study for Belgium’ in June 2021 (AdeqFlex’21), the European Commission published its Fit for 55 package of proposals. The latter includes a set of proposed measures which are designed to achieve a 55% reduction in greenhouse gas emissions by 2030 compared with 1990 levels. The package includes a revision of the EU’s Emissions Trading System (ETS), the promotion of renewable energy, energy efficiency measures, and the introduction of a carbon border adjustment mechanism.
Following the Russian invasion of Ukraine, which began in February 2022, the package was then complemented by an additional set of proposed measures included in the ‘REPowerEU’ plan. This focuses, amongst others, on promoting the generation of renewable energy, such as wind and solar power, to increase the share of renewable energy in the EU’s energy mix.
Both packages are related to security of supply, as they aim to reduce the EU’s dependence on fossil fuels and increase the use of clean and renewable energy sources. The packages also reflect the EU’s strengthened ambitions with regard to addressing climate change and transitioning to a more sustainable and low-carbon economy. All of these moves will lead to more variable RES in the system and an increase in the electrification of the heat, transport and industrial sectors. This will affect adequacy and flexibility requirements at national and European level.

The draft updated NECPs (National Energy and Climate Plans) are anticipated to incorporate the latest European policy updates, and Member States are required to submit them by the end of June 2023.
Changes to Belgian policy
In addition to energy policy changes occurring at the European level, over the past two years, several major policy changes have occurred in Belgium. For instance, in March 2022, the Federal Government announced it would revisit its earlier intention to fully phase out nuclear power by 2025, deciding instead to extend the life of two of its seven nuclear power plants by ten years.
The Federal Government also expanded its plans related to offshore wind capacity (this, in addition to previously planned expansions) and began exploring the construction of an interconnector that will link Belgium to Denmark (TritonLink) which is planned to be commissioned in 2031 or 2032 (in addition to the Nautilus interconnector planned to be commissioned during 2030).
Over the past two years, the first CRM (Capacity Remuneration Mechanism) auctions have taken place, contracting new and existing capacity. In addition, a large number of large-scale batteries projects are being considered by project developers.
Several recent measures adopted at a regional level will also affect the electricity system, such as a ban on the sale of cars running on fossil fuels by 2029 in Flanders or the introduction of more strict emission levels in some regions and cities (by means of low emission zones). Furthermore, the revision of the deductibility rules for company cars will facilitate a higher adoption of electric vehicles (EVs) on the road. The tax relief for internal combustion engine company cars ordered after 1 July 2023 will be gradually reduced, facilitating a higher adoption of EVs. Another example is Flanders aiming to ban natural gas heating in new buildings from 2025, or the phase out of oil heating in the coming decade in Belgium.
Given the above, forward-looking assessments of the adequacy and flexibility of our energy system are more important than ever. Such studies are critical for identifying the major trends that will likely emerge over the next 10 years, so enabling all relevant actors to measure, anticipate, support and help to shape the changes that the energy system is undergoing. This study is such an assessment. Given the large number of uncertainties, in addition to the different scenarios, hundreds of simulations were performed covering a large amount of sensitivities to allow the reader and relevant authorities to evaluate the impact of certain assumptions.
1.2. REGULATORY FRAMEWORK
The origin of this study and Elia’s role
As Belgium’s transmission system operator (TSO), Elia plays a central role in enabling the changes outlined above: its electrical infrastructure must be adapted to cope with tomorrow’s challenges. Consequently, the Electricity Act assigned Elia the task of carrying out a biennial study of the Belgian electricity system’s ten-year projected adequacy and flexibility needs.
Elia published the first study of this kind in April 2016. In 2018, the Electricity Act of 1999 (further referred as ‘Electricity Act’) was modified and Elia published the first study in line with this modification in June 2019. The current study is therefore Elia’s fourth adequacy and flexibility study, as outlined in Figure 1-1. The two central points of focus of this study - adequacy and flexibility - are both crucial components that enable the electricity system to properly function.
• The assessment of the system’s ‘adequacy explores whether the sum of expected available capacities, including electricity imports, is sufficient to meet Belgium’s reliability standard - or the necessary level of adequacy. It should be noted that the current study also assesses the economic viability of needed capacities.
• The assessment of flexibility investigates the extent to which this capacity carries the right technical characteristics to cope with future (un)expected variations in power generation (in particular, power produced from renewable energy sources) and demand.
The study is also complemented with results on future economic, sustainability and electricity mix indicators resulting from the hourly future market simulations used in both assessments.
FIGURE 1-1 — LEGAL FRAMEWORK RELATING TO BIENNIAL ADEQUACY AND FLEXIBILITY STUDIES
Amended Belgian Electricity Act
This study is based on Article 7bis, §4bis of the Electricity Act, which states that (Elia’s translation into English):
Art.7bis, §4bis (framework for the study)
“No later than 30 June of each biennial period, the system operator shall carry out an analysis of the needs of the Belgian electricity system in terms of the country’s adequacy and flexibility for the next ten years.
The basic assumptions and scenarios, as well as the methodology used for this analysis, shall be determined by the system operator in collaboration with the Directorate General for Energy and the Federal Planning Bureau and in concertation with the regulator.”
Belgium’s current reliability standard
The reliability standard for Belgium is defined according to the Belgian Electricity Act and related royal decrees (Royal Decree of 4 September 2022 [LAW-1] and Royal Decree of 31 August 2021 [LAW-2]). The definition of the reliability standard for Belgium was established following a set legal process and in compliance with ACER’s ‘VOLL/CONE/RS methodology’.
Furthermore, as referred to in the “Whereas” Article (4) of ACER’s ‘VOLL/CONE/RS methodology’, “the responsibility to determine the general structure of its energy supply is a Member State’s right”, pursuant to Article 194(2) of the 2009 Treaty on the Functioning of the European Union. A Member State’s freedom to set its own desired level of security of supply is also highlighted in recital (46) of the ‘Whereas’ section of the Electricity Regulation (EU Regulation 2019/943). Pursuant to Article 25(2) of the Electricity Regulation, reliability standards should be set by individual member states and are to be based on the ACER approved ‘VOLL/CONE/RS methodology’.
APR 2016 Adequacy & Flexibility
2017-2027 Adequacy Flexibility
JUL 2018 Legal requirement in the Belgian Electricity Act
At the request of the Minister of Energy, an ad hoc study covering the adequacy and flexibility of Belgium’s needs was published in April 2016. As requested by the authorities, an addendum was subsequently published in September 2016, based on a large stakeholder consultation which was undertaken following the publication of the initial study.
Art. 7bis, §4bis (Elia’s translation into English): “No later than 30 June of each biennial period, the system operator shall carry out an analysis of the needs of the Belgian electricity system in terms of the country’s adequacy and flexibility for the next ten years The basic assumptions and scenarios as well as the methodology used for this analysis, shall be determined by the system operator in collaboration with the Directorate General for Energy and the Federal Planning Bureau and in concertation with the regulator ”
Paragraph 5 of the same article states that the analysis should be submitted to the Minister of Energy and the Directorate General for Energy of the Federal Public Service for the Economy (‘FPS Economy’). In addition, it must be published on the websites of both the TSO and the FPS Economy.
As required by law, this study covers the time period which runs from 2024 to 2034. As requested by stakeholders, it has been extended to also cover the winter period of 2023-24, given the uncertainties linked to the current geopolitical context and the energy crisis that Europe is facing. Therefore, the study covers every year from 2023 to 2034 (a total of twelve years are analysed).
In order to address identified adequacy concerns after the year 2025, the Belgian authorities have, over the past few years, developed a legal framework which establishes a market-wide capacity remuneration mechanism (CRM). More information on that mechanism in Belgium can be found in BOX 1-1.
The methodology used by Elia in this study (as outlined further below in Chapter 2) enables the quantification of indicators which can be compared to the reliability standard values, in order to assess the level of reliability/adequacy and related capacity needs. The reliability standards of Belgium and other countries used in this study are explained in more detail in Appendix H.
Note that there is currently no legally determined standard for flexibility. However, the analysis and methodology used in this study are based on identifying needs in order to keep the system in balance at all times, which is one of the core tasks of a TSO in accordance with Article 8 of the Electricity Act 1999. In addition, Balancing Responsible Parties (BRPs) are expected to balance their portfolios.
JUN 2019 Adequacy & Flexibility
2020-2030 Adequacy Flexibility
The first study published in 2019 after the modified law.
JUN 2021 Adequacy & Flexibility 2022-2032 Adequacy Flexibility
The study published 2 years ago.
JUN 2023 Adequacy & Flexibility
The present study.
It is important to note that this study is not a CRM calibration report and does not aim to calculate the parameters of future auctions. The goal of this study is to highlight potential adequacy and flexibility challenges in Belgium by quantifying and analysing expected electricity market and system requirements. This study therefore seeks to identify any missing capacity or remaining margin in Belgium over the coming 10-year period, in line with different scenarios and sensitivities. Moreover, whilst auction parameters do need to be defined in order for Elia to undertake the yearly capacity auctions as part of the Belgian CRM, these parameters are the subject of specific and separate CRM calibration reports. Such reports are prepared for each CRM capacity auction in accordance with the applicable legislation. The CRM scenario framework, auction parameters and rules are drawn from Article 7undecies of the Electricity Act.
The lack of a specific legally determined standard for flexibility is not to be confused with the minimum criteria that Elia uses for its dimensioning of reserve capacity on Frequency Restoration Reserves (FRR) when covering Load Frequency Control (LFC) block imbalances. This is currently set to cover at least 99.0% of expected LFC block imbalances, as specified in the LFC block operational agreement, approved by the Commission for Electricity and Gas Regulator (or CREG - the regulator). This criterion does not lessen the requirement for the system (and market) to be in balance at all times.
Methodology for calculating the value of lost load, the cost of new entry and the reliability standard in accordance with the 2019/943 regulation (EU)
On 20 October 2022, ACER approved (ACER Decision 23-2020) the methodology for calculating the value of lost load (referred to as ‘VOLL methodology’), the cost of new entry (referred to as ‘CONE methodology’) and the reliability standard (referred to as ‘RS methodology’) in accordance with Article 23(6) of Regulation (EU) 2019/943 of the European Parliament and Council of 5 June 2019 on the internal market for electricity (recast) (hereafter referred to as ‘Electricity Regulation’). The three methodologies are collectively referred to as the ‘VOLL/CONE/RS methodology’.
The Royal Decree of 4 September 2022 [LAW-1] amending the Royal Decree of 31 August 2021 [LAW-2] and relating to the determination of the reliability standard and the approval of the values of the cost of unsupplied energy (referred to in the EU regulation as value of lost load‘VOLL’ or ‘VoLL’) and of the fixed cost of a new entrant (referred to in the ACER methodology as the cost of new entry – ‘CONE’), set the reliability standard value for Belgium at 3 hours loss of load expectation on average.
Indeed, in accordance with the commitment made within the framework of decision (EU) 2022/639 of the European Commission of 27 August 2021 concerning the aid scheme SA.54915 – 2020/C relating to the introduction of a capacity remuneration mechanism in Belgium (margin number 28), the Belgian authorities updated the single estimate of VOLL on the basis of a new survey concerning the willingness to pay, in accordance with the ‘VOLL methodology’. Furthermore, new values for VOLL, CONE and RS were established according to the legal process and in compliance with ACER’s ‘VOLL/CONE/RS methodology’ in the Royal Decree of 4 September 2022 [LAW-1].
The LOLE criteria does not require that for a given target year, every simulated future state (or ‘Monte Carlo’ year) to meet the criteria individually. Instead, it stipulates that the average LOLE calculated across all simulated future states should comply with the criteria. Consequently, there will be a significant number of simulated future states without any loss of load, while some other future states may experience a loss of load exceeding the average criteria.
1.3. ADEQUACY STUDIES
1.3.1. OVERVIEW OF BELGIAN AND EUROPEAN ADEQUACY STUDIES
In addition to publishing biennial ten-year adequacy and flexibility studies, Elia publishes a number of additional adequacy-related studies in close cooperation with external partners.
Elia has been mandated to publish CRM calibration reports which contain information that is required for determining the volume to be contracted and proposed parameters for each CRM auction. This task was assigned to Elia in 2021 following the modification of the Electricity law of 29 April 1999 relating to the organisation of the electricity market (‘Electricity Act’), and related Royal Decrees. These calibration reports are published in line with the Royal Decree that sets the method for calculating the volume of capacity required and the parameters that are necessary for the organisation of auctions within the framework of the CRM (‘Royal Decree on Methodology’). The Royal Decree on Methodology outlines the steps that need to be taken for the definition of scenarios and the methodology that should be followed when drawing up these reports. For further details, see BOX 1-1.

With regards to the strategic reserve volume evaluation report, Elia performs a yearly analysis of the Belgian system’s capacity requirements for the next winter period. This responsibility was assigned to Elia in line with Article 7bis of the Electricity Act. Currently, the European Commission’s approval of the Belgian strategic reserve mechanism has expired; since 31 March 2022, therefore, it has not been possible to contract a strategic reserve. All previously published reports are available on the websites of Elia [ELI-1] and the FPS Economy [FPS-1].
In addition, Elia also collaborates with European colleagues from the European Network of Transmission System Operators for Electricity (ENTSO-E) in order to produce a yearly European adequacy analysis. ENTSO-E has published two ‘European Resource Adequacy Assessments (ERAA) so far, in 2021 and 2022 (see Section 1.3.2 for more information). ENTSO-E also publishes Seasonal Outlooks twice a year - in the summer (usually in June) and during the winter (usually in December). These reports analyse potential risks related to Europe’s security of supply, due to, for example, high/low temperatures and other ‘extreme’ conditions. Winter and summer periods are the most critical periods for the power system.
FIGURE 1-2 — OVERVIEW OF ADEQUACY STUDIES PUBLISHED BY ELIA AND ENTSO-E
i Further details about the reliability standards for Belgium and other European countries and how to interpret the LOLE criteria are included in Appendix H.
European & national resource adequacy assessments in the 2019/943 regulation (EU)
Article 23 European resource adequacy assessments
[…] 5. The European resource adequacy assessment shall be based on a transparent methodology which shall ensure that the assessment:
(a) […]
(b) is based on appropriate central reference scenarios of projected demand and supply including an economic assessment of the likelihood of retirement, mothballing, new-build of generation assets and measures to reach energy efficiency and electricity interconnection targets and appropriate sensitivities on extreme weather events, hydrological conditions, wholesale prices and carbon price developments;
(c) contains separate scenarios reflecting the differing likelihoods of the occurrence of resource adequacy concerns which the different types of capacity mechanisms are designed to address;
(d) appropriately takes account of the contribution of all resources including existing and future possibilities for generation, energy storage, sectoral integration, demand response, and import and export and their contribution to flexible system operation;
(e) anticipates the likely impact of the measures referred to in Article 20(3);
(f) includes variants without existing or planned capacity mechanisms and, where applicable, variants with such mechanisms;
(g) is based on a market model using the flow-based approach, where applicable;
(h) applies probabilistic calculations;
(i) applies a single modelling tool;
(j) includes at least the following indicators referred to in Article 25: – “expected energy not served”, and – “loss of load expectation”;
(k) identifies the sources of possible resource adequacy concerns, in particular whether it is a network constraint, a resource constraint, or both;
(l) takes into account real network development;
(m) ensures that the national characteristics of generation, demand flexibility and energy storage, the availability of primary resources and the level of interconnection are properly taken into consideration.

Article 24 National resource adequacy assessments
1. National resource adequacy assessments shall have a regional scope and shall be based on the methodology referred to in Article 23(3) in particular in points (b) to (m) of Article 23(5).
National resource adequacy assessments shall contain the reference central scenarios as referred to in point (b) of Article 23(5).
National resource adequacy assessments may take into account additional sensitivities to those referred to in point (b) of Article 23(5). In such cases, national resource adequacy assessments may:
(a) make assumptions taking into account the particularities of national electricity demand and supply;
(b) use tools and consistent recent data that are complementary to those used by the ENTSO for Electricity for the European resource adequacy assessment.
In addition, the national resource adequacy assessments, in assessing the contribution of capacity providers located in another Member State to the security of supply of the bidding zones that they cover, shall use the methodology as provided for in point (a) of Article 26(11).
2. National resource adequacy assessments and, where applicable, the European resource adequacy assessment and the opinion of ACER pursuant to paragraph 3 shall be made publicly available.
3. Where the national resource adequacy assessment identifies an adequacy concern with regard to a bidding zone that was not identified in the European resource adequacy assessment, the national resource adequacy assessment shall include the reasons for the divergence between the two resource adequacy assessments, including details of the sensitivities used and the underlying assumptions. Member States shall publish that assessment and submit it to ACER.
Within two months of the date of the receipt of the report, ACER shall provide an opinion on whether the differences between the national resource adequacy assessment and the European resource adequacy assessment are justified.
The body that is responsible for the national resource adequacy assessment shall take due account of ACER’s opinion, and where necessary shall amend its assessment. Where it decides not to take ACER’s opinion fully into account, the body that is responsible for the national resource adequacy assessment shall publish a report with detailed reasons
1.3.2. EUROPEAN RESOURCE ADEQUACY ASSESSMENT (ERAA)
On 1 January 2020, the new Regulation of the European Parliament and of the Council on the internal market for electricity (recast) came into force (EU Regulation 2019/943, henceforth referred to as ‘the Regulation’). This Regulation is part of a legislative package known as the ‘Clean Energy for all Europeans Package’ (CEP).
Chapter IV of the Regulation, which comprises 8 articles (Articles 20-27) addresses resource adequacy. Article 24 outlines the required methods for carrying out a National Resource Adequacy Assessment. Article 23 addresses the ERAA, which ENTSO-E is required to publish on a yearly basis. The ERAA methodology was proposed by ENTSO-E (in line with Article 23(6)), after which it was amended and adopted by ACER on 2 October 2020 [ACE-2].
The ERAA methodology must be fully implemented by the end of 2023, in line with Article 12 of ACER’s decision regarding it. Its implementation requires the introduction of numerous additional procedures, techniques and features which entail significant challenges related to the preparation of future pan-European and regional adequacy assessments. ENTSO-E developed an ‘Implementation Roadmap’ (latest update: December 2022 [ENT-1]) to ensure a stepwise implementation of the ERAA methodology.
Several elements of the methodology are therefore due to be implemented by ENTSO-E according to the ‘Implementation Roadmap’, to strike a balance between the accuracy of the assessment and feasibility of the targeted improvements. Nevertheless, ACER has decided neither to approve nor amend both the first and the second editions of ENTSO-E’s European Resource Adequacy Assessment (ERAA) report [ACE-4].
As outlined in the previous adequacy and flexibility study (AdeqFlex’21), Elia is committed to ensuring that each of its 10-year adequacy and flexibility studies is aligned to the furthest extent possible with both the spirit and the modalities of Article 24 (concerning national resource adequacy assessments) and the more elaborated principles as stipulated in Article 23 (concerning European resource adequacy assessments), with particular attention being paid to Article 23(5) (b) to (m) of the Regulation and to the adopted ERAA methodology.
Elia has performed probabilistic adequacy studies for over a decade. The methodologies it has employed for these have been continuously improved through the involvement of stakeholders from across Belgium. More information on methodological details is included in Chapter 2 of the present study and in dedicated appendices.
1.4. CAPACITY MECHANISMS
1.4.1. CAPACITY MECHANISMS IN EUROPE
A vast number of European countries are relying on capacity mechanisms to ensure security of supply. The reasons for this and the nature of the capacity mechanisms themselves vary from country to country. However, it’s clear that these markets are no longer solely relying on energy market revenues to ensure a sufficient level of installed capacity for maintaining security of supply. In its ‘Security of EU electricity supply in 2021’ report [ACE-8], ACER provides an overview of all capacity mechanisms across Europe. The map in Figure 1-3 includes all capacity mechanisms which were being employed at the end of 2021, as published in ACER’s October 2022 report [ACE-8]. The European Commission granted approval to the Belgian capacity mechanism in August 2021, marking it as the first capacity mechanism to receive approval following the implementation of the CEP (Clean Energy Package), which introduced stricter regulations.
1.4.2. CAPACITY MECHANISMS IN BELGIUM Strategic reserve (2014-2020)
The Federal Government introduced a strategic reserve as the first capacity mechanism in Belgium to ensure security of supply from winter 2014-15 onwards. The mechanism was approved by the European Commission in 2018 [EUC-3] until March 2022. The strategic reserve was designed to maintain existing generation units (strategic generation reserve, or SGR) and demand side response capacities (strategic demand reserve, or SDR) out-of-market as a backup to meet peak demand when the market failed to do so. The overview of the volumes that were contracted out-of-market are detailed in Figure 1-4. From the winter 2018-19 onwards, no volumes were contracted under the framework of the strategic reserves and, following, the rules introduced in the CEP, the approval of the mechanism was not extended.
Rules [ELI-8]. The mechanism was reported to the European Commission in 2020 and after an in-depth investigation, the mechanism was approved in August 2021, subject to certain conditions. The first Y-4 auction for the delivery period 2025-26 was held in October 2021, a ‘re-run’ of the first Y-4 auction was also held in April 2022. A second Y-4 auction for delivery period 2026-27 was held in October 2022. More information on the CRM’s design principles can be found in BOX 1-1.
Low Carbon Tender (proposal for delivery period 2024-25)
CAPACITY MECHANISM TYPE
Market wide – central buyer
Market wide – de-centralised obligation
Strategic reserves
Targeted capacity payment
No CM
Generally, a strategic reserve mechanism focuses on preventing existing generators or demand response and storage capacities to leave the market. The instrument is not adapted to support the development of large amounts of new capacities and was therefore not fit for addressing the upcoming adequacy challenges that Belgium will face in relation to the nuclear phase-out and fast electrification.
Market-wide CRM (2025 - …)
Given the significant need for new capacities in the coming years as a consequence of the nuclear phase-out, the ageing of the thermal fleet, developments in neighboring countries and widespread electrification, a market-wide CRM mechanism was introduced by law in April 2019 [LAW-5]. The law fixed the general features of the CRM, which was then further complemented by a Royal Decree [LAW-6] and Functioning
As part of the long-term measures included in the Winter Plan introduced by the Federal Government on 15 July 2022, and as presented by the Cabinet during the Adequacy Working Group on 25 August 2022 [ELI-6], the Minister of Energy instructed Elia to prepare a targeted tender for low carbon technologies (LCT) as one of the measures intended to ensure security of supply for the delivery period of 2024-25. The introduction of the LCT was made subject to a ‘needs assessment’ that would form part of the present AdeqFlex’23. To be ready in time for a potential auction, the assessment was due to be delivered in April 2023 instead of the end of June 2023 (as required by law for the AdeqFlex’23 study). The needs assessment performed for April 2023 [ELI-17] concluded that there was no need for a targeted auction under the reference scenario selected by the Minister. The scenario choice used for the LCT needs assessment process followed a similar framework to that of the CRM reference scenario choice. Prior to the selection, it involved a consultation process, a recommendation from Elia, a proposal from the regulator, and advice from the FPS Economy.
“Note: The first auction of the new Belgian capacity mechanism took place in October 2021. In Bulgaria, the capacity mechanism was phased out in 2020. In Greece, auctions were suspended since March 2019 and last delivery period included 2020. In France a complementary scheme targeting demand response is also in place since 2018. The first delivery of the new Italian capacity mechanism started in 2022. Contracts of the previous targeted capacity payment scheme were still valid in 2021. A new auction was held in February 2022 for delivery in 2024. In Portugal, a targeted capacity mechanism was introduced in 2017, and has been revoked since 2018, yet some capacity payments are provided to hydro power plants due to “legacy” contracts. In Spain, the capacity mechanism used to comprise of “investment incentives” and “availability payments”. Such availability payments were removed in June 2018, and investment incentive payments still apply only to generation capacity installed before 2016.”
Source ‘Security of EU electricity supply in 2021: Report on Member States approaches to assess and ensure adequacy’, ACER, October 2022 (Figure 7).
The original figure is adapted to include the Great Britain as a country with a ‘Market wide - central buyer’. The capacity mechanism in the Great Britain has been active since 2017 and was reapproved in 2019 [The SmartEn Map 2021, Resource Adequacy Mechanisms]
BOX 1-1 — BELGIAN CRM IN A NUTSHELL
General purpose of the Belgian CRM
The Belgian Capacity Remuneration Mechanism (CRM) is the cornerstone for ensuring security of supply in Belgium as from 2025. It involves a centrally organised competitive bidding procedure, which is market-wide and technology neutral. It carries the noteworthy features outlined below:
Both existing and new capacities can participate; Projects that require significant amounts of investment can apply for multi-year contracts (a maximum of 3, 8 or 15 years, depending on the level of required investments);
Both a Y-4 auction and a Y-1 auction are organised for each delivery period. The auction held 4 years before the delivery period is aimed at projects that have a longer lead time, whereas the auction held 1 year before the delivery period is ideal for projects that cannot commit to providing capacity a long time in advance (such as the flexibility disclosures from industrial processes);
It is demand side management (DSM) friendly as explained in the SmartEN Map 2021 on Resource Adequacy Mechanisms in which the Belgian CRM is framed as “one of the more inclusive European mechanisms for DSF” (Demand Side Flexibility) [RAM-1];
The CRM will soon be open for low-voltage participation in Belgium and for explicit participation from cross-border capacities from Germany, the Netherlands and France;
The CRM is based on reliability options meaning that revenues collected above a defined strike price need to be paid back, in order to avoid windfall profits. For DSM, payback exemption clause is under investigation at the time of writing.
The purpose of the CRM is to compensate for missing-money problems, i.e. when revenues from energy market and/or revenues from ancillaries are insufficient to compensate for the relevant costs of the (new or existing) capacity. The CRM addresses this by offering a fixed revenue per MW that contributes to Belgian Security of supply
What is the service to be provided?
Capacity contracted under the CRM must be available during (part of) the delivery period(s) to which it has committed. Availability monitoring will take place during all adequacy-relevant moments, defined as the hours for which the Day-Ahead price surpasses a certain level. Elia may also perform availability tests, which are especially relevant in case a capacity cannot be monitored on a frequent basis.
It is important to note is that there is no interference with the energy market the latter will continue to operate as usual. The CRM applies on top of current energy market provisions and only aims to supplement normal market behavior – providing all contracted capacity in case of (near-) scarcity.
How can market parties participate?
Each auction is held according to parameters selected by the Minister of Energy based on a collaborative process involving the CREG, the FPS Economy and Elia as well as additional external stakeholders via a public consultation. Detailed information about the CRM and specific auctions are available on the website of Elia, the CREG and the FPS Economy:
• Elia: https://www.elia.be/en/electricity-market-and-system/adequacy/capacity-remuneration-mechanism
• The CREG: https://www.creg.be/nl/professionals/ marktwerking-en-monitoring/capaciteitsremuneratiemechanisme-crm
• The FPS Economy: https://economie.fgov.be/nl/themas/energie/bevoorradingszekerheid/elektriciteit/ capaciteitsmechanismen/capaciteitsremuneratiemechanis
Eligible capacities that meet all requirements stemming from article 7undecies, §8 of the Electricity Act, are allowed to participate. Key eligibility criteria include respecting the CO2 emission criteria, the refusal of other variable subsidies during the delivery period and achieving – optionally via aggregation – the participation threshold of 1 MWd of capacity that contributes to Belgian Security of Supply. The contribution to adequacy of each technology is determined via derating factors.
As illustrated in Figure 1-6, these are the different stages to go through as a participant:
• Prior to and as a prerequisite for participation to the auction the participant must successfully complete a prequalification process;
• Upon selection in the auction but prior to the delivery period, a capacity contract is signed, and the participant prepares its capacity for delivery (in one- or fouryears’ time) while going through a pre-delivery monitoring process
• During the delivery period, the participant receives a capacity payment in turn for respecting its availability obligation However, a payback obligation applies under certain conditions and when the strike price is exceeded.
A secondary market is available as a risk management tool to address capacity shortages and/or to valorise excess available capacity.
The past and upcoming Belgian CRM
Auctions
At the time of publication of this study, two Y-4 CRM auctions have already taken place (a re-run was also held for the first auction) resulting in around 1.6 - 1.7GW of new capacity derated being contracted. In October 2023 the third Y-4 auction for delivery year 2027-28 will be held according to the parameters selected by the Minister of Energy in March 2023. The auction parameter selection process for the Y-1 auction with delivery year 2025-26 and Y-4 auction with delivery year 2028-29 is ongoing at the time of publication of this report.
1.5. STAKEHOLDER INVOLVEMENT
As stipulated in Article 7bis §4bis of the Electricity Act, this study is the result of a collaboration between Elia, the FPS Economy and the Federal Planning Bureau and in concertation with CREG During the collaboration process, several ‘Comité de Collaboration’ (CdC) were held between May 2022 and the time of publication of this study, as illustrated in Figure 1-8.
During these meetings, discussions focused on:
• methodological choices and improvements;
• scenario sources and data;
• any sensitivities to be considered;
• information sharing with different regions;
• the public consultation processes (documents to submit, Elia’s answers, etc.);
• the presentation of the first results.
FIGURE 1-8 — TIMELINE OF THE STAKEHOLDERS INVOLVEMENT PROCESS
BOX 1-2 — PUBLICATION CONSULTATION ON SCENARIOS, METHODOLOGY AND DATA
A public consultation focusing on the data and methodology employed for the present study was held by Elia between 28/10/2022 and 28/11/2022. In addition to the scenario data and associated explanations, Elia also put out the methodology and four external studies for consultation.
Over 200 comments from 15 stakeholders were received, as illustrated in Figure 1-9. The public consultation report and the updated scenario data were presented to market parties during the Adequacy Working Group on 17/02/2023. The relevant documents and presentations are available on Elia’s website [ELI-18].
FIGURE 1-9 — PUBLIC CONSULTATION DOCUMENTS AND FEEDBACK
Documents put out to public consultation
• Document providing explanations on the input data
• Excel file with detailed input data
• 9 comprehensive methodology appendices
• AFRY study on fixed costs of existing units
• DELTA-EE study on residential and tertiary future flexibility
• N-SIDE study on forced and planned thermal plant outage
• Prof. K. Boudt study on the WACC and the hurdle premiums
Stakeholders feedbacks
• 12 non-confidential replies received
• 3 confidential replies received
• More than 200 comments
Comité de Collaboration (CdC) - meeting with Elia, the FPS Economy and the Federal Planning Bureau and with CREG as observer. Public Consultation (PC) report - report containing answers to each comment received from stakeholders during the public consultation. Adequacy Working Group (WG) - meeting during which Elia and market parties can discuss the development and evolution of the different mechanisms related to the topic of adequacy.
Elia held a public consultation from 28 October to 28 November 2022 which focused on the input data, assumptions and methodology employed for the present study. The consultation, which Elia held voluntarily, aimed to increase transparency, increase the study’s robustness and collect valuable feedback from market parties.
The scenario for the current study underwent a public consultation during the same period to allow stakeholders sufficient time to provide their feedback, enabling Elia to conduct and publish the study by June 2023. At the time the consultation was held, numerous uncertainties persisted, such as the escalating severity of the energy crisis, and Russian invasion of Ukraine. Although many policy announcements had been made, their precise details had not yet been released, including updates to each Member State’s National Energy and Climate Plan, which were scheduled for mid-2023. Nonetheless, Elia diligently worked to propose a CENTRAL scenario based on the available information for Belgium and other countries. As communicated during the consultation period, Elia conducted a review of the study’s assumptions at the beginning of 2023 to ensure the incorporation of the latest available information such as the preliminary insights on developments that took place in 2022.
The complete methodology employed for the adequacy and economic viability assessments (which comprises several appendix documents and builds on the methodology employed as part of the previous adequacy and flexibility study) was also put out for public consultation. Several external studies were also put into public consultation. Those are detailed in BOX 1-2.
The methodology used for short-term flexibility was employed for the first time as part of the AdeqFlex’19 study; no fundamental revisions have been made to it since. The focus instead has been on incremental improvements (such as on the offshore wind power profiles, power-to-x, the role played by interconnections and end consumer flexibility).
Public consultation report
An answer was provided for each piece of feedback that was received
When possible, feedback and answers were grouped together
Each answer provided was first discussed during a Comité de Collaboration
As indicated during the public consultation in November 2022, Elia performed beginning of 2023 a reality check of the short-term projections, based on the latest 2022 data and any new announcements that could influence future projections. Following this and the many comments and suggestions received during the public consultation, several assumptions for Belgium and other countries were updated. Those included:
• solar photovoltaic (PV) historical data, short-term projections and long term targets;
• onshore wind historical data, short-term projections and long term targets;
• inclusion of the updated planning for the offshore Princess Elisabeth Zone;
• inclusion of the Zandvliet Power plant repowering;
• update to several thermal unit parameters (e.g. efficiencies);
• update of the future profiled thermal generation installed capacity based on the latest information available to Elia in its database;
• home batteries historical installations based on preliminary data published by DSOs;
• large-scale batteries installed capacities and potential based on the project’s maturity;
• update to the energy content of large-scale batteries based on known projects;
• integration of the realised 2022 data for the load consumption in Belgium and in Europe;
• update to the future Belgian electricity demand, by including the impact of high prices on industrial demand;
• update to the heat pump (HP) scenario (% of air-air HP as main heating system) as well as update on the heating demand assumed for each unit;
• update to the electric vehicle scenario (parameters for PHEV and differentiation of company and private cars);
• latest policy announcements for other countries were taken into account (coal phase outs, wind offshore ambitions, realised data on RES installations…);
• update to the additional electrification of industry following the study published by Elia Group in November 2022 and inclusion of the associated flexibility from its process;
• amount of heat pumps, split of electric passenger cars per type and e-truck developments;
• update on the fuel and carbon prices for the short-term based on the latest forwards.
Furthermore, the feedback received following the launch of the public consultation, several clarifications of methodological choices were integrated in the methodology appendices of this report. The feedback received also led to the following changes being made:
• update to combined heat and power (CHP) credit assumptions to account for the overall efficiency of the units;
• update to the investment costs for new and existing technologies. All numbers were also normalised to be expressed in Euros2022;
• update to the price cap increase following newly approved ACER method in January 2023;
• update to the parameters for the WACC calculation using the latest economic parameters and based on the update to Professor K. Boudt’s study;
• clarifications to the methodology (dispatch of storage during scarcity situations, compliance with the ERAA methodology, convergence of EVA results, climate database, calculation of balancing revenues…);
• clarification on how units are modelled (individually vs. aggregated);
• clarifications regarding the flow-based methodology.
Based on the feedback, several sensitivities were also highlighted as interesting areas to be studied in further detail:
• inclusion of the 2023-24 target year;
• sensitivity linked to higher and lower RES development;
• sensitivity linked to higher and lower electricity demand (e.g. rebound and slow-down of the industry; delay and acceleration of the electrification in the industry);
• sensitivity linked to the availability of thermal units due to more strict CO2 emissions’ limits to be introduced in the CRM;
• sensitivity linked to increased/lower DSR/storage capacities;
• sensitivity linked to the flexibility associated with EVs, heat pumps and home batteries;
• sensitivity linked to the availability of nuclear units in Belgium;
• sensitivity linked to the Belgian grid (e.g. delays to the Boucle du Hainaut project);
• sensitivity linked to assumptions regarding Belgium’s neighbouring countries (availability of the nuclear units in France) and the fact that those countries would take the necessary measures to comply with their reliability standard;
• sensitivity linked to carbon and fuel prices;
• sensitivity linked to the cross-border exchange capacities (minRAM assumptions);
• combined sensitivities driven by similar triggers.
Note that the projections for the other countries were also updated based on newly published reports or announcements, such as the Monitoring Leveringszekerheid from Tennet for the Netherlands, the public consultation for the next Bilan Prévisionnel from RTE for France, the update to the Netzentwicklungsplan NEP2023 in Germany, etc.
Regarding the short-term flexibility, the public consultation was limited to providing clarifications based on questions of the stakeholders as there were no requests for modifications of the method or assumptions.
In cooperation with AFRY, Elia carried out an update of the peer review of the Cost of Capacity study that was originally realised in 2020. In order to maximally involve stakeholders, Elia also included this update in the public consultation on the methodology, the basis data and the scenarios of this adequacy and flexibility study. Elia and AFRY’s responses to stakeholders’ concerns can be found in the consultation report.

Elia continuously improves the methods and data it uses for its Adequacy and Flexibility studies, employing the latest approaches to ensure a methodology that is up-to-date and robust. This study builds on the AdeqFlex’21 which is compliant with the ERAA methodology (and its implementation plan) and, in some areas, even goes beyond the methodology used in the latest ERAA 2022 study published by ENTSO-E. Although not required under Belgian law, the methodology used in this study was put out for public consultation in November 2022, alongside the CENTRAL scenario and data for Belgium.
The purpose of this chapter is to provide a concise summary of the main methodological approaches used in this study. More information can be found in the dedicated appendices that are mentioned at the end of each section.
Following the public consultation that was held at the end of November 2022, the methodology for this study was
Overall process and link between adequacy and flexibility
The first step of the process consists of quantifying scenarios for the electricity system for each year of the following decade (see Section 2.1 for more details) in Europe (the scope of the study includes almost all EU countries along with Norway, Switzerland and the UK; see Section 2.2).
Once the scenario has been defined, flexibility needs are quantified as the need for flexibility required to balance the system between the day-ahead timeframe and realtime. Part of this flexibility is then modelled in economic dispatch simulations used for the adequacy assessment to ensure that flexibility requirements are covered, even during scarcity risk periods, in line with the ERAA methodology (also called the flexibility reservations’). Indeed, the ERAA methodology stipulates that in cases where a model with ‘perfect foresight’ is used (as is the case for the model used by Elia), these can be deducted from the available capacity. Section 2.3 provides an overview of the methodology to quantify the available flexibility means in the system.
An hourly economic dispatch model is then run on a large amount of ‘Monte Carlo’ years (or future states) to derive the different adequacy indicators, such as the capacity that is needed to comply with the reliability improved, with new approaches and clarifications introduced based on the comments received. An overview of the methodological changes introduced since the publication of the AdeqFlex’21, and their compliance with the ERAA methodology, can be found at the end of this chapter. The outcomes of the public consultation are described in the previous chapter, in Section 1.5.
2.1. TIME HORIZONS UNDER CONSIDERATION
As stipulated in the law, the present study covers the upcoming ten years, from 2024 to 2034. Additionally, in line with stakeholder requests, Belgium’s system adequacy is also analysed for the year 2023, given the uncertainties that have arisen from the energy crisis in 2022.
As illustrated in Figure 2-2:
• system adequacy is analysed for the main scenarios of this study for each year of the time horizon under consideration (12 years in total);
• 6 key years are analysed in terms of adequacy, economics, and short-term flexibility, with one additional year analysed in terms of adequacy and economics (2025).
• 2025-26: closure of the remaining nuclear power plants in Belgium (3.9 GW) and commissioning of around 1.7 GW of new gas thermal power plants (Flémalle and Seraing) and batteries, auctioned as part of the CRM Y-4 auction for delivery year 2025-26;
• 2026-27: 10-year extension of Doel 4 and Tihange 3 nuclear power plants;
• 2029-30: commissioning of 700 MW of offshore wind located in the Princess Elisabeth Zone (PEZ); standard or the LOLE (Loss of Load Expectation) and EENS (Expected Energy Not Served) indicators (see Section 2.4). Some of these simulations are run iteratively (for example, to find the required capacity volume for the system to be adequate; see Section 2.5). In addition, hourly economic dispatch simulations are also used to perform an assessment of the economic viability of existing and new capacity (see Section 2.6). Other economic results are also analysed (electricity prices, sustainability indicators, electricity mix…) to derive indicators about Belgium’s future electricity system.
Finally, based on the hourly dispatch of each capacity in Belgium, the available flexibility means are quantified and compared to the flexibility needs. This allows an assessment of whether the expected future electricity mix will be able to cope with the expected forecast errors of demand and generation and forced outages.
As the reach of this study extends beyond adequacy (since it includes flexibility assessments of the needs and means for Belgium, as well as an assessment of the economic viability of different capacities), the links between the different areas explored in this study are summarised in Figure 2-1.
Each year examined as part of this study runs from 1 September to 31 August. For example, the year 2025 runs from 1 September 2025 through 31 August 2026 and therefore includes the entire winter period of 2025-26.
The following major events took place or are expected in Belgium for the upcoming years (based on the CENTRAL scenario assumptions that will be further detailed in the Chapter 3):
• 2022-23: closure of nuclear power plants in Belgium (Doel 3 and Tihange 2, amounting to 2 GW), which already took place when publishing the present study;
• 2030-31: commissioning of 2,800 MW of offshore wind in the PEZ and the commissioning of Nautilus (interconnector between Princess Elisabeth Island (PEI) and Great Britain). 2030 is also the year by which European targets are usually set (those are further detailed in Chapter 3);
• 2032-33: commissioning of the TritonLink interconnector between Belgium and Denmark, which will be linked to the offshore energy island in Denmark.
During the whole period, the further electrification of heating, transport and industry is expected to increase electricity consumption in Belgium and Europe while several countries will in parallel completely phase out their coal generation.
2.2. SIMULATED GEOGRAPHICAL PERIMETER
When studying Belgium’s adequacy, it is crucial to consider all relevant interactions with other countries, since Belgium is located at the heart of the European grid. Belgium is structurally dependent on electricity imports for adequacy. Therefore other European countries must also be included in the performed simulations.
The scope of simulation of this study covers the Core region and most Member States of the European Union (only Malta and Cyprus are not included in the simulations) along with United Kingdom, Norway and Switzerland.
The perimeter of the present study includes the same 28 countries as those covered in AdFlex’21 (see Figure 2-3):
Bidding zones are defined as zones or areas within which market participants are able to freely exchange energy without requiring allocation of cross-border capacity, since congestions inside those zones/areas are not accounted for in the market clearing. The bidding zone configuration currently in place is maintained throughout the entire period analysed in this study. New offshore wind connected to so-called ‘hybrid interconnectors’ is added to separate offshore biddings zones (as it is the case for Nautilus and TritonLink). Countries being constituted of multiple bidding zones, i.e. Italy, Denmark, Norway and Sweden, are modelled using multiple market nodes. This specific type of modelling is in line with the current definition of bidding zones and is identical to the approach used in other studies, for example in those published by ENTSO-E.
2.3. FLEXIBILITY NEEDS, RESERVATION AND MEANS
The methodology for the flexibility assessment was developed and discussed with stakeholders ahead of the first Adequacy and Flexibility study in 2019. This methodology, used in the AdeqFlex’23, was consulted along with the adequacy methodology. Besides some incremental improvements, no fundamental modifications to the methodology were introduced compared with the initial version.
Flexibility in a power system is generally defined as: ‘the extent to which a power system can modify electricity production or consumption in response to variability, expected or otherwise’ [IEA-7] as defined by the International Energy Agency. As shown in Figure 2-4, power systems and markets need flexibility to cope with three types of uncertainty (also referred to as flexibility drivers’):
(i) the variability and uncertainty of demand as it is not possible to know ex-ante what the exact electricity demand will be in real-time, since it depends on external variables such as consumer preferences and weather conditions;
28 Countries
Countries simulated Countries not simulated
Austria (AT)
Belgium (BE)
Bulgaria (BG)
Switzerland (CH) the Czech Republic (CZ)
Germany (DE)
Denmark (DK)
Estonia (EE)
Spain (ES)
Finland (FI)
France (FR)
United Kingdom (GB and NI)
Greece (GR)
Croatia (HR)
Hungary (HU) the Republic of Ireland (IE)
Italy (IT)
Lithuania (LT)
Luxembourg (LU)
Latvia (LV) the Netherlands (NL)
Norway (NO)
Poland (PL)
Portugal (PT)
Romania (RO)
Sweden (SE)
Slovenia (SI)
Slovakia (SK)
(ii) the variability and uncertainty of renewable and distributed generation as renewable generation such as wind and solar power as well as other highly distributed generation sources such as combined heat and power or run-of-river hydroelectricity, are characterised by uncertainty, since they are subject to variable and uncertain weather conditions; and
(iii) unexpected generation unit or transmission asset outages, as forced outages are an inherent characteristic of generation and transmission systems and are by definition unpredictable. These events result in a sudden loss (or excess) of power.
In order to keep the system in balance, which is a fundamental prerequisite for system security, these expected and unexpected variations in demand and generation must be covered at all times through the use of flexibility sources, also referred to as the ‘flexibility means of the system. Flexibility means are delivered by technologies which are controllable: they can alter their generation or demand upon request in a relatively short timeframe. Examples of such technologies include:
(i) generation units since most conventional thermal units can modify their output within a certain timeframe;
(ii) demand side assets since some of these can provide flexibility through modifying their demand following a reaction to explicit signals, or (implicit) price signals;
(iii) electricity storage since this technology is generally very flexible and is characterised by an ‘energy’ reservoir; and
(iv) interconnectors which can import (or export) flexibility from/to other regions by means of cross-border forward, intra-day/day-ahead or balancing markets.
Ensuring that the system’s flexibility needs are covered is important as shortages in flexibility can result in a need for applying emergency measures to avoid frequency deviations (and the preventive or real-time curtailment of generation or shedding of demand to avoid black-outs). On the one hand, flexibility needs are estimated to increase following the increase in renewable generation (e.g. solar photovoltaics) and new demand applications (such as electric vehicles). On the other hand, flexibility means are also increasing following the integration of new flexible demand (e.g. electric vehicles and heat pumps) and storage (e.g. batteries) technologies, provided a timely implementation of the necessary market reforms allowing to unlock and value this flexibility. The aim of this flexibility study is to investigate whether the power system of the future will have sufficient technical capabilities and characteristics to deal with variations in demand and generation. i The methodology for the assessment of the short-term flexibility is further described in Appendix M.
2.3.1. HIGH-LEVEL METHODOLOGY
This flexibility analysis focuses on the flexibility required between the day-ahead timeframe and real-time in order to ensure the balance in the Elia LFC block. The flexibility analysis therefore focuses on short-term flexibility, i.e. the capabilities which are required to cover the unexpected, intra-day and real-time variations in load and generation, as well as forced outages of generation and transmission assets Longer term variations (yearly, seasonal, daily) are also referred to as flexibility, but are already covered in the hourly economic dispatch simulations.
It is important to notice that this study focuses on the total flexibility needs in the system. The study therefore investigates both the availability of sufficient flexibility that is activated within the market and the availability of sufficient reserve capacity. This is important as only focusing on the future availability of reserve capacity would implicitly assume that part of the flexibility to be delivered by the market is by default available in the system. This could result in an underestimation of the impact of the required capacity and flexibility of the system.
2.3.2. FLEXIBILITY NEEDS
The flexibility needs assessment is based on a categorisation of three types of flexibility which are derived from the timeframes during which new information is received by market players. This information may relate to forecast updates, or information concerning the unexpected unavailability of a generation or transmission asset.
• Slow flexibility represents the ability to deal with expected deviations in demand and generation following intra-day forecast updates. It concerns information received between the day-ahead market (up to 36 hours before real time) and the intra-day forecast (received several hours before real time), depending on the forecast service. Additionally, this flexibility deals with power plant or transmission asset outages which are announced several hours before real time (or have still not been resolved after several hours). This flexibility can be provided by most of the controlable installed capacity, as there are several hours during which it is possible to change the output of a generation, storage or demand unit and even to start or stop a power plant.
• Fast flexibility represents the ability to deal with unexpected power deviations in real time, or deviations for which information is received between the last intra-day forecast and real time. This type of flexibility covers information received between several hours and a few minutes before real time, depending on the forecast service. Additionally, this flexibility type needs to deal with forced outages until the providers of slow flexibility can take over. Fast flexibility can be provided by generation units which are already dispatched and are able to modify their output programs within a few minutes, or by units which have start or stop times of a few minutes, as well as storage units (pumped storage hydropower and batteries) and demand side response units which are considered to be very flexible.

• Ramping flexibility represents the ability to deal with realtime variations in forecast errors, in particular forecast errors of the last intra-day forecast before real time. This type of flexibility can be expressed as the capacity required to react in 5 minutes, or even per minute (MW/min). This type of flexibility does not cover forced outages which are assumed to be covered by FCR, and relieved by fast and slow flexibility. Ramping flexibility is covered by assets which can follow forecast error variations on a minute-by-minute basis – so only those units which have already been dispatched, as well as some battery storage and demand side response units which are considered to be very flexible.
The flexibility needs for each type of flexibility is determined in three steps, as follows: (i) determining the probability distribution of the forecast errors of the demand, renewable and distributed generation, aggregated as the residual total load forecast error; (ii) determining the probability distribution of the forced outage of generation units and cer- tain transmission assets; and (iii) determining the flexibility needs based on a convolution of both probability distribution curves. This is determined for each future year based on an extrapolation of the relevant time series by means of the demand and generation capacity projections for that year.
2.3.3. FLEXIBILITY RESERVATIONS
A TSO is required to cover the flexibility needs to ensure system security in line with the European network guidelines, while also incentivising market players to balance their portfolios as much as possible. Since 2019, Elia has implemented a dynamic dimensioning method, according to which its FRR needs are determined on a daily basis for each block of four hours of the following day.
As represented in Figure 2-7, FRR reserve capacity can be seen as a subset of the fast and ramping flexibility types. When establishing a link between the reserve capacity types and the flexibility types, fast flexibility will contain the future FRR (aFRR + mFRR) needs, which, in case of activation, should be able to reach the maximum contracted power in 12.5 – 15.0 minutes. Ramping flexibility will contain the future aFRR, which should be able to react in 5.0 – 7.5 minutes. Slow flexibility is assumed to be covered by intra-day markets. Note that the FCR falls outside the three flexibility categories and should be seen as a separate category, calculated at the level of the synchronous area of continental Europe - and therefore considered out of scope of this national flexibility study.
2.3.4. FLEXIBILITY MEANS
The flexibility means analysis starts from the hourly dispatch schedules of all generation, storage and demand-side assets resulting from the economic dispatch simulations. These schedules are assumed to represent the market schedules under perfect foresight with an hourly resolution. They allow to determine the remaining flexibility which is available to deal with expected and unexpected variations in the intraday and balancing time frame. Together with the technical constraints of these assets in view of upward or downward ramping of their capacity (further specified in Section 3.8), these are used to calculate the available remaining flexibility from hour to hour.
As explained in the previous section, part of the required flexibility, i.e. upward FRR needs together with the FCR needs, is already enforced in the economic dispatch simulations through the reservations of flexibility. However, for the sake of efficiency, and to avoid adequacy needs being overestimated, the economic dispatch simulations only integrate reserve capacity requirements during scarcity periods. In other words, it does not take into account the full flexibility needs of the system for every hour of the year.
Using the results, the amount of up- and downward flexibility each unit can deliver in 1 minute, 15 minutes, 30 minutes, … up to 5 hours is determined. When these profiles are aggregated, this determines the total flexibility which can be delivered within a time span of 1 minute and 5 hours for every hour in every ‘Monte Carlo’ year. These results are compared to the required flexibility needs using several statistics.
2.4. ECONOMIC DISPATCH MODEL
The cornerstone of this study lies in the use of an economic dispatch/unit commitment model to simulate the electricity market. Elia uses the Antares Simulator, an open-source hourly electricity market simulator developed by RTE. This model minimises the total system costs by dispatching the different generation, storage and demand response units while taking the commercial exchanges capabilities between countries into account. The model requires specific information sets for each country that falls within the simulated perimeter. These are either input parameters or constraints for the problem to be solved. Figure 2-8 provides an overview of the input and output data of the model and includes the following elements:
• the hourly consumption profiles for each climate year, consisting of hourly demand profiles, taking into account the effect of different drivers (see dedicated Appendix B for all details);
• the large thermal production facilities with their technical parameters and costs;
• the hourly generation profiles associated with decentralised thermal production facilities;
• the hourly generation profiles related to each climate year (consisting of hourly load factors) for RES supply;
• the hourly generation profiles of out-of-market devices that are based on the residual load (computed based on consumption profiles and RES generation profiles for each climate year), such as residential out-of-market batteries;
• the hydro facilities type, installed capacity and their associated technical and economic parameters;
• installed capacity of storage facilities with their associated round-trip efficiency and reservoir constraints;
• installed demand flexibility capacity, its type (e.g. demand response, batteries, vehicle-to-grid…) and associated constraints (if any);
• Power-to-X capacities (e.g. electrolysis, power-to-heat…) with their associated constraints;
• the cross-border capacity between countries. These constraints can be modelled in two ways: (i) through flow-based constraints (with Standard or Advanced hybrid coupling (see Section 3.6.2)), or (ii) through fixed bilateral exchange capacities between countries (NTC method, see Section 3.6.1).
FIGURE 2-8 — INPUT AND OUTPUT DATA FOR THE UNIT COMMITMENT/ECONOMIC DISPATCH MODEL
Input Data
For each of the simulated areas
• Consumption
• Centralised thermal production facilities
• Decentralised thermal production facilities
• Renewable production
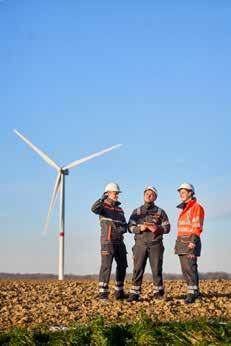
Model Output
• Hourly dispatch for all units in each area
• Commercial exchanges between areas
• Hourly marginal prices
• Part of the flexibility cannot be covered by the market and results in residual imbalances to be covered by FRR (aFRR/mFRR)
• FCR is a separate flexibility type, determined at the level of the synchronous area (including N-1 conditions)
Part of the flexibility needs are explicitly modelled in the economic dispatch simulations by reserving capacity on available generation, storage and demand response assets. This is implemented in line with the ERAA methodology, Article 4(6)g [ACE-2]. The reserve capacity requirements are therefore included in the simulations used for the adequacy assessment by means of additional constraints, which ensure that the available capacity in the system covers electricity demand and required reserve capacity needs during periods of scarcity. In other words, a capacity that meets the technical requirements of reserve capacity is set aside to cover residual system imbalances.
Note that given the scope of the economic dispatch simulations, only the upward FCR and FRR capacity is taken into account. As specified in Section 3.8, the latter is limited to the dimensioning incident, i.e. 1039 MW, corresponding with the capacity of the largest nuclear unit. This accounts for the fact that renewable prediction risks are considered to be lower during scarcity risk periods given the estimated low availability of renewable generation during such moments.
• Hydro
• Storage
• Demand flexibility
• Cross-border capacity between countries (NTC/FB)
• Power-to-X
Simulations
Hourly dispatch optimisation to minimise total costs of the system
Based on the inputs provided to the model, market simulations provide the hourly dispatch economic results, which aim to minimise the total operational cost over the simulated perimeter. When this optimum cost is found, the following output can be extracted:
• locational marginal prices based on market bids (locations are usually bidding zones);
• hourly dispatch of all the units in each market zone; and i More details, including the limitations of the model, the software used, and the formulation of the problem can be found in Appendix A.
• hourly commercial exchanges between market zones.
• Adequacy indicators
- LOLE, EENS
• Economic indicators
- Market welfare, total costs, unit revenues, running hours
• Sustainability indicators
- Emissions, RES share
• Dispatch indicators
- Imports/exports, generation per type
The output data provided by the model allows for a large range of indicators to be analysed:
• adequacy indicators (LOLE – Loss of Load Expectation, calculated as the average number of hours with Energy Not Served (ENS) over all future possible states (or ‘Monte Carlo’ years), EENS – Expected Energy Not Served, calculated as the average energy not-served (ENS) over all future possible states (or ‘Monte Carlo’ years)) (see Section 2.5 below and Appendix G);
• economic indicators (e.g. market welfare, total costs, unit revenues, running hours);
• sustainability indicators (e.g. emissions, RES shares); and
• dispatch indicators (e.g. imports/exports, generated energy per fuel/technology).
2.5. ADEQUACY ASSESSMENT
The goal of the adequacy assessment is to find the margin or gap that is required to meet the legal reliability standard of Belgium (being LOLE < 3 hours on average; see also Appendix H for more details).
Assessing the needed capacity or margin for a given scenario requires three steps to be followed. The steps are run iteratively until a compliant solution is found. They are illustrated in Figure 2-9 and are explained in more detail below.
FIGURE 2-9 — ADEQUACY ASSESSMENT PROCESS FOR A SPECIFIC TIME HORIZON AND SCENARIO
STEP 1A Definition of ‘Monte Carlo’ years
The first step is the definition of future possible states (or ‘Monte Carlo’ years) covering the uncertainty of the generation fleet (technical failures) and weather conditions (impacting RES generation and demand profiles due to thermosensitivity effects). For this, simulations should span as many possible future states as required to yield robust results, called ‘Monte Carlo’ simulations. Each ‘Monte Carlo’ year consists of a combination of the following:
• A climate year consisting of hourly timeseries of weather variables used for the computation of RES generation and consumption profiles. The ERAA-compliant climate database used in the AdeqFlex’21 which consists of 200 climate years and represents the projected climate conditions in 2025 is used in this study. This climate database is provided by the French weather and climate service, Météo-France, which is also used by RTE for its national adequacy assessment. Elia provided information about the methodology from Météo-France to market parties to facilitate their understanding. These documents are available for download on Elia’s website [MET-1] and are further described in the Appendix J. Climate variables are then translated to generation factors that can be used by the model in combination with the future installed capacities.
• Forced outage parameters used to construct daily availability profiles for each individually modelled unit and HVDC link in Europe. A random selection of the availability profiles is then performed for each ‘Monte Carlo’ year. This means that each ‘Monte Carlo’ year has a different availability profile for each unit and HVDC link.
STEP 1B Amount of capacity in the scenario
In addition, an initial amount of capacity is defined. Usually, the process starts without adding any capacity to the system (on top of the capacity already defined in the scenario).
STEP 2 Quantifying the amount of hours with structural shortage
The second step involves the identification of structural shortage periods, i.e. moments during which the electricity production in the market is not sufficient to satisfy the electricity demand. Hourly market simulations are performed to quantify deficit hours for the entire future state.
The hourly economic dispatch/unit commitment model is described in Section 2.4. The model allows a quantification of the amount of hours during which the system is not adequate for each future state (or set of ‘Monte Carlo’ years).
If one or more bidding zones are suffering from scarcity at the same time, the rules for curtailment (energy not served, ENS) and sharing, referred to as ‘adequacy patch’, are applied in order to realistically distribute the ENS across the concerned countries (see Appendix I for details).
STEP 3 Comparing the results with the reliability standard
The third step involves assessing the additional capacity needed (100% available) to satisfy the legal adequacy criterion. This capacity is evaluated through an iterative process. The simulated amount of scarcity hours is compared with the reliability standard set for Belgium (3 hours on average per year). If the adequacy criterion for Belgium is not satisfied, additional capacity (in blocks of 100 MW) which is considered to be 100% available is added to the relevant market area in the simulations.
The adequateness of the new system obtained is again evaluated. This operation is repeated several times, with fixed capacity in blocks of 100 MW (100% available) being added each time, for as long as the legal criterion for Belgium is not satisfied. On the other hand, if the simulation without any additional generation capacity complies with the adequacy criterion, the margin on the Belgian electricity system is examined through a similar approach removing capacity. Blocks of 100 MW are chosen, being the smallest size which still ensures statistically robust results for the determination of the volume. Especially when searching for the tail of the distribution (e.g. LOLE criterion), this statistical robustness is a limiting factor. Choosing a smaller block size, besides exponentially increasing calculation time, might lead to a calculation result with a ‘perceived’ higher accuracy (in terms of tens of MWs: 110 MW, 120 MW, 130 MW blocks), but the outcome will differ depending on the random seeding of the model, i.e. it won’t actually be a statistically robust result. The 100 MW block size is also used when calibrating CRM models or for the evaluation of strategic reserve volumes and other adequacy analyses performed by other TSOs and ENTSO-E.
The full adequacy methodology is described in Appendix G.
The climate years database used is further described in Appendix J.
An example of outage draws is provided in Appendix C.
More information on the LOLE definition can be found in Appendix H.
The adequacy patch is further explained in Appendix I.
2.6. ECONOMIC VIABILITY ASSESSMENT
The economic viability assessment (EVA) is a crucial but complex process which allows to assess the economic viability (under certain conditions) of existing or new capacity in the electricity market. The ERAA methodology (see [ACE-2] Article 6) indicates that the EVA should either assess the viability for each capacity iteratively or by minimizing the overall system costs, where all capacities are optimised at once. This second method, the minimisation of overall system costs, is considered in the ERAA methodology as a simplification of the EVA methodology. In this study, as in previous studies, the first method referred to in the ERAA methodology, i.e. the assessment of the viability for each capacity resource is considered. A full iterative approach is thus applied. For each iteration, the economic viability of all monitored capacities (or ‘candidates’) is evaluated following a selected criterion or
2.6.1. THE PROCESS IN A NUTSHELL
Starting from the initial scenario, an hourly economic dispatch simulation is performed for multiple ‘Monte Carlo’ years and for multiple future years taken into account in the assessment. Generation and economic indicators of each unit monitored, for all the years, are combined to calculate the expected revenues for each unit. In this way, the future energy mixes that may occur during the lifetime of a unit are explicitly considered. In addition, the rules of the (new) ‘SDAC Harmonised Maximum and Minimum Clearing Price methodology’ (approved by ACER on 10/01/2023) [ACE-7] are metric. The details of this approach are presented in Appendix K. This section gives a short summary of the methodology used for the economic viability assessment.
Elia has performed economic viability assessments for recent and past studies. In the previous adequacy and flexibility study published in June 2021 [ELI-15], several major improvements were introduced to make the EVA metric compliant with the ERAA methodology, following the adoption of the ERAA methodology itself, as well as the feedback received after the adequacy and flexibility study published in June 2019 [ELI-16]. These improvements included an extension of the perimeter to cover countries other than Belgium and the inclusion of additional capacity types in the assessment.
1 The process begins with the adoption of a starting situation (= given scenario).
2 The necessary economic dispatch simulations are performed. In the multi-year approach (used in this study), several full-year future market simulations (on an hourly basis) are performed to sample the expected future revenues of the units. The amount used is further elaborated in Appendix K. Each simulation consists of multiple ‘Monte Carlo’ years.
3 For every simulated ‘Monte Carlo’ year, several indicators are calculated for each capacity type/unit. These are needed to calculate the IRR metric that determines the economic viability of a given capacity type or unit. In addition, other revenue streams are taken into account if relevant.
2.6.2. UPDATED HURDLE RATES AND METRIC
The methodology of Professor K. Boudt used in this study [BOU-1] allows to model the behavior or a real-life investor as closely as possible. This methodology assumes that a riskaverse investor always prefers to receive a given expected return with certainty over receiving the same expected return with uncertainties. According to this methodology, a capacity is considered to be viable if the average simulated internal rate of return on a project is equal to or exceeds the so-called hurdle rate:
Economically viable Average internal rate of return ≥ hurdle rate implemented in this study. The increase of the price cap is considered as from the first simulated time horizon being 2023-24. The changes to this price cap are also computed based on the full multi-year approach. More information on the calculation of revenues, inframarginal rents and market price caps can be found in Appendix K.
The methodology used in this study represents a significant improvement in comparison to the AdeqFlex’21 study as it now, amongst other improvements, takes the evolution of the energy mix into account by performing a multi-year EVA.
4 For each scenario and case, candidates for (de)-investment are defined. Depending on the scenario framework or analysis to be performed, the relevant list of candidates is thus defined. This list of candidates depends on the perimeter, the type of units, the state of the units (existing, new, in need of refurbishment…) and whether or not they are part of the EVA. Each capacity type is also associated with costs that need to be covered. Since an investment decision (for example in new capacity) may be made in any future year, a new candidate is used for each of the assessed future years.
5 To determine the hurdle premium needed to assess the viability of each capacity type, the latest study of Professor K. Boudt published on the Elia website is used [BOU-3]. Based on the different simulation outputs and candidate parameters, the Internal Rate of Return (IRR) is calculated for each candidate. To do so, first, a large number of sequences of cashflows that each candidate could obtain over their entire economic lifetime is simulated. For each sequence of cashflows, the IRR is calculated. The average of the sampled IRRs is then used in the economic decision-making process.
6 The average of the IRR over the large number of draws is then compared to the hurdle rate (i.e., the sum of the weighted average cost of capital (WACC) and the technology-specific hurdle premium) for each candidate).
7 The candidates for which the average of the IRR is below the hurdle rate are marked as having to be removed from the model, as these are not economically viable. On the contrary, if the IRR is above the hurdle rate, the candidate in question is marked as remaining in the market or to be invested in (if they are not yet in the market). Given the non-linearity of the evolution of revenues (when removing or adding capacity), the amount of capacity to be removed or added in each iteration is limited.
8 The process (from 2 to 8) is repeated a large number of times until convergence of the results is reached.
The average IRR and the way it is calculated is further explained in Appendix K. The hurdle rate equals the sum of an industry-wide reference WACC and a hurdle premium. A reference WACC equal to 4.7% is applied to all technologies, whereas the hurdle premium depends on the technology considered. The used hurdle rates are based on the latest study of Professor K. Boudt published on the Elia website [BOU-3].
2.6.3. INCREASES IN MAXIMUM PRICE CAP ARE TAKEN INTO ACCOUNT
In accordance with Article 41(1) of the Capacity Allocation and Congestion Management (CACM) Regulation [ACE-7], the harmonised maximum and minimum clearing prices (‘HMMCP’) for single day-ahead coupling (‘SDAC’) should take into account an estimation of the value of lost load (‘VOLL’). An adjustment rule is therefore implemented in the market coupling algorithm which allows the price cap (PC) to be gradually increased to a level which represents the VOLL. For simplicity, the ‘SDAC HMMCP’ is taken as reference for the price cap (PC) in this study as it is the biggest market in volume for which such a PC exists. The PC adjustment rule was already taken into account for AdeqFlex’21 with the rules that were applied before the update of those by ACER.
In January 2023, ACER approved a new version of the ‘SDAC Harmonised Maximum and Minimum Clearing Price methodology’ (HMMCP methodology) [ACE-7]. These updated rules have been properly taken into account in the EVA for this study.
Note that the increase of the PC is taken endogenously within the iterative process of the EVA simulations (see Appendix K for further details) from 2023 onwards. Regarding the assumptions behind the implementation of the PC increase in the simulations, further details are also provided in Section 3.7.5.
2.6.4. IMPROVEMENTS IN MULTI-YEAR REVENUE CALCULATIONS
Future investment decisions may impact the profitability of an investment made today and investments made today may impact the profitability of future investments. Therefore, properly assessing the time dimension of investment decisions has been identified as one of the big methodological improvements needed in the EVA of the present study. Thus, a significant refinement has been made with regards to the previous methodology concerning the estimation of costs throughout the lifetime of each unit. This change in process is schematically represented in Figure 2-11.
In Elia’s AdeqFlex’21 study, the evolution of profits throughout the lifetime of the unit was considered solely through the evolution of price caps. The method used in this study additionally also explicitly considers future energy mixes that may occur during the lifetime of each unit. To achieve this improvement, the economic lifetime of each candidate is assessed based on a sequence of economic dispatch simulations in a multi-year approach. Revenues are considered for the years which encompass the economic lifetime of each candidate. These revenues are explicitly calculated based on economic dispatch simulations for each year within the k-years of the economic lifetime of each candidate. The following seven years are modelled explicitly: 2024, 2025, 2026,
2028, 2030, 2032 and 2034. In cases where no simulation is available for a future year within the lifetime of a unit (i.e. the years 2027, 2029, 2031, 2033 and all years beyond 2034), revenues for that target year are taken from ‘Monte Carlo’ years which are selected from adjacent years available in the explicitly modelled seven years for which simulation data is available. A probability which is proportional to their proximity to the future year in the lifetime of the unit is considered. For example, for a unit with a lifetime of three years, an investment decision can be made for a lifetime covering the years 2025, 2026, 2027. After performing an economic dispatch simulation of the seven explicitly modelled years, simulation outputs for the years 2025, 2026 and 2028 are available. The revenues for the first two years of the lifetime of the unit are as such directly extracted from these simulations. For the year 2027, no economic dispatch simulation is available, hence the revenues are calculated based on random draws from the two closest simulations: 2026 and 2028. As 2027 is equally close to 2026 as it is to 2028, both have a probability of 50% in terms of being randomly selected.
Given the inclusion of a full multi-year economic viability assessment, this study is a front-runner in economic viability assessments for adequacy and economic studies.

