247 minute read
SCENARIOS AND DATA


This chapter aims to provide an extensive insight into the scenario framework and underlying assumptions and data used in this study.
The current context and recent evolutions in Europe and in Belgium are highlighted in Section 3.1 This study is built around one CENTRAL scenario for Belgium which was consulted upon for which an overview is given in Section 3.2 The Belgian consumption and associated flexibility are further described in Section 3.3 while the Belgian generation and storage assumptions can be found in Section 3.4
Section 3.5 is dedicated to the European assumptions, with the description of the EU scenarios. The cross-border exchange capacities are detailed in Section 3.6, followed by the economic assumptions (e.g. fuel and investment costs) in Section 3.7 The assumptions used for the short-term flexibility assessment are elaborated in Section 3.8
3.1. CURRENT CONTEXT AND EVOLUTIONS
3.1.1. KEY TRENDS IN THE ENERGY SECTOR
Figure 3-1 illustrates some of the major changes in the energy system that are required to reach net zero by 2050:
• a focus on energy efficiency, sufficiency and electrification to reduce final energy needs;
• an increase in the share of RES technologies integrated into the system;
• massive electrification of final consumption, so increasing the share occupied by electricity in the final demand and also increasing its share in absolute values.
These changes will already have significant impacts on the adequacy and flexibility requirements of the electricity system over the coming decade. They will affect the composition of the electricity supply mix as well as energy consump- tion patterns across Europe. The following sections of this chapter will delve deeper into various ongoing transformations related to these changes.
Since the publication of AdeqFlex’21 two years ago, the pace at which these changes have been occurring has accelerated significantly. Most notably, numerous countries have revised their offshore wind ambitions, while the installation rate of solar photovoltaic systems in Europe reached an unprecedented level in 2022. Furthermore, the ban on fossil fuel engines’ sales from 2035 onwards will expedite the adoption of EVs, leading to increased electrification. Likewise, there has been a marked increase in the installation of heat pumps across multiple European countries.
The total amount of energy consumed will be reduced through the use of additional energy efficiency and sufficiency measures but also through additional electrification as it mostly uses less energy to deliver the same energy use
The share occupied by electricity in final/ end energy consumption will increase with additional electrification
Renewable generation will increase both in the overall energy mix and in the electricity mix
Source: Inspired from ‘Increasing the EU’s 2030 emissions reduction target’ report from European Climate Foundation and Climact.
3.1.2. THE EU CONTEXT HAS GREATLY EVOLVED
In 2019, the European Commission presented the Green Deal strategy [EUC-7]: a set of policy objectives whose overarching aim is to make Europe the first climate-neutral continent by 2050. Following this strategy, the EU presented and adopted concrete legislative changes in order to reach the objectives outlined in the Green Deal as follows.
• On 9 July 2021, the EU Climate Law [EUR-3] was adopted and formally published, setting a binding objective for the Union to reach climate neutrality by 2050 and a binding Union target of reducing net greenhouse gas emissions by at least 55% by 2030 compared with 1990 levels.
• On 14 July 2021, the Commission released its ‘Fit for 55 legislative package [EUC-8]. In practice, the package is composed of a set of interlinked legislative proposals, which translates the ambitions of the Green Deal and Climate Law into more concrete measures, some of which entail a review of existing legislation or the adoption of new legislation.
While at the time the ‘Fit for 55’ and the EU’s climate ambitions were already high on the political agenda, the Russian invasion of Ukraine in February 2022 renewed Europe’s focus on energy security and climate-related policy. It further triggered a sense of urgency at EU level regarding to the need to rapidly and effectively deal with the heavy consequences resulting from the conflict, namely record-breaking high gas prices which drove electricity prices up, and the risk of disruptions to gas supplies, which in turn ran the risk of impacting the security of electricity supply. As a result of this, the following policy developments occurred.
• In May 2022, the Commission published its REPowerEU Plan’, which builds on the European Green Deal, the European Climate Law and the proposed ‘Fit for 55’ legislative package. ‘REPowerEU’ is “about rapidly reducing our dependence on Russian fossil fuels by fast forwarding the clean energy transition and joining forces to achieve a more resilient energy system and a true Energy Union” [EUC-9]. Consequently, it focuses on the diversification of Europe’s energy supplies, energy saving measures and increasing clean power, and proposes, among other things, further increases to the energy efficiency and renewable energy targets put forward under the ‘Fit for 55’ proposals.
• In October 2022, the Council adopted a Regulation which covered emergency measures to address high energy prices [EUR-4]. It provides measures that target the electricity market, including a coordinated electricity demand reduction, capping market revenues from inframarginal generators, retail measures, and mandatory temporary solidarity contributions from from fossil fuel sectors.
Resulting from the legislative process under the ‘Fit for 55’ package and the measures and proposals under ‘REPowerEU’, some recent developments are highlighted below:
• On 10 March 2023, European Council and European Parliament negotiators sealed a provisional deal on the recast of the Energy Efficiency Directive (EED). Under the agreed text, Member States should collectively ensure a reduction of energy consumption at EU level of at least 11.7% in 2030 compared to the projections of the 2020 Reference Scenario (this being the new EU energy efficiency target)1 However, the target will only be binding as regards final energy consumption (FEC); it will be indicative as regards primary energy consumption (PEC). Aside from higher targets, greater focus is given to the Energy Efficiency First (EE1st) principle, and the need to consider energy efficiency solutions in planning, policy and major investment decisions related to energy systems and other relevant sectors. With regard to this, it should be noted that demand-side resources and system flexibility are, in particular, regarded as constituting such energy efficiency solutions.
• On 14 March 2023, the European Commission published its proposal for reforms to EU electricity market design (EMD) rules, aiming to boost renewables, better protect consumers and enhance industrial competitiveness [EUC-10]. The proposal does not modify the electricity market fundamentals, namely the pricing merit order on the short-term market. Instead, it includes provisions to encourage the use of long-term contracts such as power purchase agreements (PPAs) and two-way contracts for difference (CfDs) to accelerate the deployment of renewables and low-carbon energy sources while providing long-term certainty for consumers. It also proposes an enhanced framework to empower and protect consumers, and to improve the flexibility of the power system (by, for example, mandating the assessment of flexibility needs at national level).
• On 30 March 2023, the European Council and European Parliament reached a provisional deal regarding the review of the Renewable Energy Directive (RED) [CEU-1]. The agreement raises the EU’s renewable target for 2030 to 42.5% (compared with the current 32%), with an additional 2.5% indicative top-up that would allow the EU to reach 45%. It includes provisions for binding and indicative targets related to the use of renewable energy in sectors such as industry, transport, buildings and heating and cooling. It also includes a definition of renewable fuels of non-biological origin (RFNBOs) such as renewable hydrogen. To speed up the deployment of renewable generation, it contains provisions related to accelerating the permitting procedures for renewable generation capacity and associated grid infrastructure, as well as creating renewable acceleration areas which (once these have been defined by Member States through appropriate environmental impact assessments) will enable projects to undergo permitting procedures at a faster pace. It also includes provisions for integrating renewables into the system, such as ensuring that Member State regulatory frameworks allow small or mobile systems such as domestic batteries and EVs to participate in electricity markets.
• On 25 April 2023, the EU Council, as a last step in the legislative decision-making process and prior to publication in the EU’s official journal, adopted no less than five pieces of legislation (which form part of the ‘Fit for 55’ package), including the revised Directive on the EU’s Emission Trading System (EU ETS 2) and the new Regulation that establishes a Carbon
Border Adjustment Mechanism (CBAM)3 These two pieces of legislation are closely interlinked and will further support the EU to achieve climate neutrality by 2050. The main features of the revised EU ETS Directive include an increased target for reducing Greenhouse Gas (GHG) emissions in EU ETS sectors by 2030; the widening of the scope of the EU ETS to cover additional sectors (e.g. maritime transport); the creation of a specific emission trading system for road transport, buildings4 and fuels for additional sectors; and the gradual phasing out of free allowances for certain sectors that will be subject to CBAM. For its part, the CBAM, which aims to reduce the risk of carbon leakage and protect the competitiveness of certain sectors of the EU’s economy, is a mechanism by which importers of certain goods originating in third (non-EU) countries will be required to purchase and surrender CBAM certificates when such goods are imported in the Union custom territory. By doing so, importers will be subject to a carbon price on their imports equivalent to that which would apply to similar goods produced in the EU under the EU’s carbon pricing regulations. Both the EU ETS and the CBAM5 are expected to give an additional boost to the decarbonisation of major economic sectors.
As a result of these developments in EU policy and legislation, Member States are being required to update and raise associated ambitions in national legislation.
Figure 3-2 provides an overview of the EU’s 2030 targets. Some of these are binding at EU level, whilst others are indicative.
1. When put in perspective, with respect to the previous target of a reduction of 32,5% of energy consumption by 2030 set using the 2007 Reference Scenario projections for 2030 as a baseline, this updated target (11.7%) “corresponds to a reduction of 38% for final and 40,5% for primary energy consumption respectively when compared to the 2007 Reference Scenario projections for 2030”. See, Council of the EU, Text of the trilogue agreement between the Council and the Parliament, Interinstitutional File, 2021/0203(COD), Brussels, 24 March 2023, p.16 (See Recital 22). See also Art.4 of the agreed text on the EU Energy Efficiency target.
2 European Council and European Parliament, Directive of the European Parliament and of the European Council amending Directive 2003/87/EC establishing a system for greenhouse gas emission allowance trading within the Union and Decision (EU) 2015/1814 concerning the establishment and operation of a market stability reserve for the Union greenhouse gas emission trading system, PE-CONS 9/23, Brussels, 20th April 2023. Rem: This is the version of the text such as adopted by the Council on the 25th of April 2023.
3 European Council and European Parliament, Regulation of the European Parliament and of the Council establishing a carbon border adjustment mechanism, PE-CONS 7/23, Brussels, 20th April 2023. Rem: This is the version of the text such as adopted by the Council on the 25th of April 2023.
4 It is to be observed that although a new emission trading system will apply to road transport and buildings, these sectors will also remain covered by the Effort Sharing Regulation (ESR) (which also covers other sectors such as agriculture and waste). In the context of the Fit for 55, the review of the ESR has also been pushed forward and also entails increased emission reduction targets in those sectors which fall within its scope. See: Regulation (EU) 2023/857 of the European Parliament and of the Council of 19 April 2023 amending Regulation (EU) 2018/842 on binding annual greenhouse gas emission reductions by Member States from 2021 to 2030 contributing to climate action to meet commitments under the Paris Agreement, and Regulation (EU) 2018/1999, OJL 111/1, 26 April 2023.
5 See European Commission, Carbon Border Adjustment Mechanism: Questions and Answers, Brussels, 14 July 2021.
3.1.3. UNCERTAINTIES REGARDING ELECTRICITY SUPPLY ARE INCREASING
The year 2022 involved significant supply concerns, primarily driven by three major factors.
Firstly, Europe faced challenges in terms of replacing gas imports from Russia. Russian invasion of Ukraine and the EU’s subsequent imposition of sanctions on Russian fossil fuel imports caused disruptions to its gas supply. In response, a range of measures were implemented, including demand reduction efforts, and increased liquefied natural gas (LNG) imports. Several countries also took steps to conserve gas for electricity generation by extending the operation of coal or nuclear units that were originally scheduled for closure, as well as implementing demand reduction measures. This situation in 2022 highlighted the importance of considering fuel supply constraints when evaluating security of supply. Additionally, unrelated to the previous factor, France experienced its worst-ever nuclear availability in 2022 Given that France has the largest nuclear fleet in Europe (which holds a capacity that exceeds 60 GW), the low availability of nuclear units in France triggered concerns across Europe. These nuclear availability risks were not new and had already been identified as far back as 2018 by Elia as a significant factor that could impact adequacy requirements in Belgium. Due to the geographical proximity of both countries and strong interdependence between France and Belgium regarding electricity consumption, any event affecting nuclear availability in France directly impacts the adequacy of the Belgian system. Given the common design used for reactors and the high share they occupy in the French electricity mix, an issue identified in one reactor can potentially lead to similar issues in other reactors, known as common mode failure. The discovery of corrosion welding cracks in 2021 necessitated additional maintenance and ongoing checks, which are due to continue until 2025. These additional measures compounded the challenges posed by an already dense maintenance schedule, which had been delayed by the COVID19 pandemic. The situation was further strained due to the extension of the operational lifetime of the oldest reactors beyond 40 years and recent staff strikes in some of the reactors.
Figure 3-3 illustrates France’s daily nuclear availability (excluding forced outages) in January from 2015 onwards. A consistent year-on-year decline in fleet availability during crucial periods in terms of ensuring adequacy can be observed. For an in-depth analysis of the historical and projected changes in nuclear availability in France, please refer to Section 3.5.3.1. Similar to previous publications, this study includes an examination of several sensitivities regarding the level of French nuclear availability.
In addition to the above, Europe experienced a period of extreme drought in 2022 which had multiple repercussions. Firstly, the drought resulted in significantly diminished hydroelectric generation during the summer and autumn seasons. It should be noted that hydroelectric power accounted for approximately 12% of electricity generation in Europe in 2020, meaning it plays a crucial role in ensuring adequacy, and in some countries, reservoirs can store water for several weeks or even months. Secondly, the drought raised concerns regarding the cooling capabilities of certain power plants due to low water levels and high water temperatures, alongside environmental restrictions. Additionally, the supply of coal to power plants relying on rivers for transportation was also affected by the drought. The scarcity of precipitation and the intensification of the drought heightened concerns related to the energy crisis in 2022. Climate change is expected to deliver even more extreme weather events in the future, which would further impact the electricity supply and adequacy calculations.
ACER summarised these concerns in its study entitled ‘ACER Security of EU electricity supply in 2021’ [ACE-8]:
“Some of the challenges are not new but seem to persist and compound the current emergency war time situation. For example, the concern related to low nuclear output in France for the coming winter or the system alerts issued in Ireland in the beginning of August 2022 echo risks flagged by past seasonal adequacy outlooks of the European Network of Transmission System Operators for Electricity (ENTSO-E). When issues of the past meet with unfavourable new circumstances the risks to the reliability of the electricity system compound.”
As part of this study, a sensitivity analysis assesses the implications of the above.
3.1.4. RENEWABLES ARE INCREASING MUCH FASTER THAN EXPECTED
The development of renewable generation in Europe (and across the world) is increasing at an unprecedent pace. Indeed, several countries have raised their RES targets over the past two years.
Solar PV
The combination of declining solar panel prices and growing energy supply concerns has resulted in a substantial increase in solar PV installations across Europe. As depicted in Figure 3-4, the installed capacity underwent a steady growth until 2017, after which it began to grow rapidly. In just five years, the installed capacity in Europe doubled, reaching approximately 220 GW in 2022 and marked the record-breaking installation of around 40 GW of solar PV in 2022. This upward trajectory is expected to persist due to measures aimed at reducing energy dependence on foreign energy sources and the establishment of higher targets.
While the proliferation of PV systems contributes to a reduction in the reliance on fossil fuel-based electricity generation, it also introduces challenges in terms of system flexibility. Concerning adequacy, PV’s contribution is limited but not insignificant, particularly in the northern regions of Europe where sunlight is less abundant during the winter. However, the presence of large PV capacities spread across different time zones in Europe and countries with more favorable winter sunlight conditions should have an overall positive effect on the system.
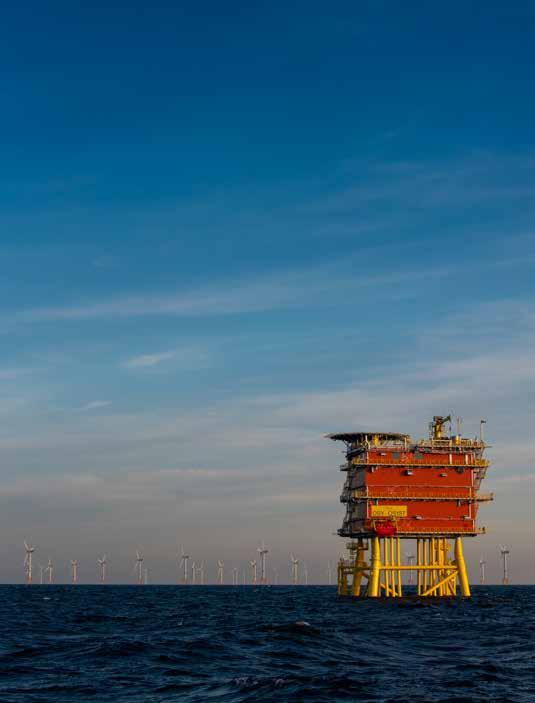
Offshore wind
European offshore development ambitions have been raised significantly since the publication of AdeqFlex’21. At the EU level, the European Commission [EUC-12] has set a target of achieving 300 GW of offshore wind capacity and 40 GW of ocean energy by 2050. Note that these numbers exclude Norway and the UK.
This target has been supported by many Member States which have coastlines. For instance:
• The Esbjerg Declaration signed in May 2022 by Belgium, Denmark, the Netherlands, and Germany demonstrated their commitment to the raised target. Together, they are aiming to achieve a combined capacity of 65 GW by 2030 and 150 GW by 2050.
• The North Seas Energy Cooperation (NSEC), which comprises Belgium, Denmark, France, Germany, Ireland, the Netherlands, and Norway, has agreed to reach 260 GW by 2050, representing 85% of the EU’s target for the same year.
• In the Baltic Sea, the Marienborg Declaration was signed, with its signatories pledging to expand offshore wind capacity by a factor of seven by 2030, equating to just under 20 GW.
=220GW
• In April 2023, a meeting in Ostend brought together the heads of state and ministers of energy from Belgium, Denmark, Germany, the Netherlands, the UK, France, Ireland, Norway, and Luxembourg. They committed to ambitious targets for offshore wind, aiming to establish at least 120 GW and 300 GW in the North Sea by 2030 and 2050 respectively [ADC-1].
Source: Data from IRENA
Illustrative impact on the residual load
The increase in variable RES (wind and PV) in the system will lead to an increasing number of instances where RES will be covering a large part of the electricity demand in Belgium (and Europe). Figure 3-5 displays the hourly load, photovoltaic and wind generation in Belgium during the month of March 2023, along with the rest of the electricity produced that month from diverse origins (‘Other’). This same month has been extrapolated to 2030 considering the installed capac-
Transports
ities expected for that year (including additional offshore wind capacity). The load has been proportionally increased to represent the anticipated growth in electrification for that year. It can be clearly observed that during some hours, domestic renewable generation exceeds domestic electricity consumption in 2030. Those effects will be further analysed in this study.
3.1.5. ELECTRIFICATION IS ACCELERATING
The electrification of heating in buildings, transportation, and industry is gaining momentum [IEA-5]. Governments are implementing policies to encourage electrification and phase out the use of fossil fuel-based solutions in these areas. The widespread adoption of heat pumps is proving to be pivotal in the shift towards clean energy and the achievement of carbon neutrality as outlined in the European Green Deal. Alongside the sale of EVs, the sale of heat pumps surged in 2022, reflecting how quickly the transition is occurring.
Heating in buildings
The widespread adoption of heat pumps is playing a crucial role in the transition to clean energy and the achievement of carbon neutrality in line with the European Green Deal [EUC17]. The ‘REPowerEU’ plan also emphasises the importance of prioritising investments in renewables and energy efficiency to reduce Europe’s reliance on fossil fuel imports and further advocated for doubling the current rate of heat pump deployment in buildings.
In 2022, the sales of heat pumps in Europe reached an unprecedented milestone, with over 3 Millions units sold. This remarkable achievement marked a significant 38% increase compared to the sales figures of 2021 [EHP-1]. As reported by the European Heat Pump Association (EHPA), the sales of heat pumps for heating and sanitary water purposes have undergone remarkable growth across all Member States [EHP-1]. Notably, the sale of heat pumps have increased by over 60% in countries such as Belgium. This surge can be attributed to the gradual implementation of impending bans on fossil fuel-based heating systems in new buildings (and even existing ones, as proposed in Germany and The Netherlands [BRT-1]). Yet in absolute terms the annual sales of heat pumps is still smaller than for example the annual installation of gas boilers [EHI-1].
Furthermore, the use of heat pumps helps to reduce final energy consumption due to their high Coefficient of Performance (COP). Additionally, the inclusion of buildings in the ETS system [EUR-6] is expected to have a further positive influence on the business case of heat pumps versus fossil-based alternatives. In April 2023, the European Commission launched a public consultation/call for evidence on upcoming measures to support the installation of heat pumps.
The electrification of transport extends beyond personal cars and encompasses a wide range of vehicles, including light-duty vehicles (vans), heavy-duty vehicles (trucks), buses, and city mobility options such as e-bikes. Although e-bike electricity consumption is relatively insignificant, the electrification of other types of transport will have a significant impact on national consumption patterns, especially if their consumption is not managed effectively. This study aims to explore various methods for charging these vehicles and evaluate their implications for adequacy and flexibility requirements in Belgium [EUP-1].
The upcoming EU ban on the sale of new petrol and diesel cars (with the exception of e-fuels) from 2035 onwards is expected to significantly expedite the adoption of EVs across Europe. In certain countries, particularly in the Nordic region, EV sales already account for approximately 40% or more of their total vehicle sales. In Central Western Europe, the share of EVs (battery EVs and plug-in hybrid EVs) in sales ranges between 20% and 40%. Various countries have implemented incentives for their adoption and a significant amount of public charging infrastructure is being deployed to support the transition. Fiscal policies concerning company cars in
Industry
Presently, the industrial sector accounts for a significant portion of energy consumption. Until now, industry has predominantly relied on fossil fuels. However, in recent years, industry has been actively seeking alternatives to reduce this dependency. Different approaches such as electrification, hydrogen and Carbon Capture, Utilisation and Storage (CCUS) have gained traction. Additionally, changes to production processes are creating opportunities for flexible consumption. In all foreseeable scenarios, electrification will play a pivotal role in industry’s path to achieving net-zero emissions. This is particularly true for low-temperature heat processes, although other areas will also require substantial amounts of electricity, such as carbon capture or locally produced green hydrogen. The IEA expects that the share of electricity consumed in total final energy industry consumption will grow from 21.5% in 2022 to 28.5% globally in 2030.
Belgium are expected to have a major influence on promoting the widespread adoption of electric vehicles (EVs) on Belgian roads in the upcoming years.
— HISTORICAL SHARE OF EV SALES IN SELECTED COUNTRIES IN EUROPE
Recognising the importance of the industrial sector in Europe and in response to the US’s announcement of its Inflation Reduction Act 2022, which aims to accelerate the transition to a clean energy economy with €400 billion of funding, the European Commission published the Net Zero Industry Act (NZIA) in March 2023 [EUC-14]. Several countries have also implemented measures to bring critical industries back to the countries they took off in or transform existing industries. For instance, France has introduced its ‘France2030’ Investment Plan [FRA-1], allocating over €5 billion to industrial decarbonisation, while the UK has embarked on its ‘Powering Up Britain’ initiative to ensure energy security and achieve net zero [UKG-2].
BOX 3-1 — ELIA GROUP STUDY ON ‘POWERING INDUSTRY TOWARDS NET ZERO’
Elia Group’s 2022 vision paper, published in November 2022, highlighted the role electrification will play in Europe’s move to net zero. Elia Group experts spoke to more than 50 companies in Belgium and Germany as part of their investigations. Based on the input provided by industry, the study quantified the expected increase in industrial electricity consumption.
The study demonstrated that the decarbonisation of industry is gaining momentum, since over the past few years, industry has been much more focused on investing in sustainable practices and processes. Electrification is playing a key role in this. By 2030, industrial electricity consumption is expected to grow up to by 40% and 50% in Germany and Belgium respectively. The study also concluded that in most cases, these new industrial electrified processes can provide flexibility to the grid.
In all considered scenarios, access to affordable, low-carbon electrons was found to be crucial for accelerating the electrification of industry, making it more resilient and sustainable. The rapid expansion of renewable energy therefore occupies a crucial position in industrial decision-making and will encourage the anchoring of industry in Europe.
Elia Group’s 2022 vision paper served as input for the scenarios included in the present study. Several sensitivities are also performed to assess the impact of uncertainties on the pace of electrification as well as flexibility those processes can bring.
3.1.6. ENERGY PRICES REACHED UNPRECEDENTED LEVELS IN 2022
Throughout 2022, Europe experienced a massive rise in wholesale electricity prices, surpassing historical levels. This spike in prices can primarily be attributed to the substantial escalation of gas prices, which resulted from the ongoing Russian invasion of Ukraine. Given the significant role of gas-fired power plants in electricity generation, the surge in gas prices directly drove up electricity prices, as depicted in Figure 3-7. Other factors were also not favorable such as low nuclear production in France and lower hydro production in Europe in 2022.
The FDP covers the extra-high-voltage sections of Elia’s grid (110 kV to 380kV). As Elia develops each plan, it is required to work closely with different actors from across society (including the CREG) and ensure the plans are aligned with national policy. The FDP must be approved by the Minister of Energy before being officially adopted. The latest FDP covering the period 2024-34 was approved in May 2023 [ELI-7].
Given that Elia also owns and operates the high-voltage sections of the power grid (30 kV to 70 kV), a similar (but slightly different) process of developing regional investment plans exists for Flanders, Wallonia and the Brussels Region.
At the European level, ENTSO-E’s Ten Year Network Development Plan (TYNDP) condenses and complements each Member State’s national development plans. It looks at the whole of the future power system and assesses how power links and storage solutions can be used to make the energy transition happen in a cost effective and secure way. The TYNDP describes a series of possible energy futures which are developed with ENTSO-E’s gas counterpart, ENTSO-G, and a number of environmental and consumer associations, the energy industry and other interested parties. It uses an approved European range of indicators to compare how electricity infrastructure helps to deliver European climate targets, market integration and security of supply. The TYNDP 2022 can be found on ENTSO-E’s website [ENT-2].
This study uses the latest Federal development plan 2024-34 for Belgium complemented with the TYNDP 2022 assumptions for the European grid development since it includes the most up-to-date information relating to other countries’ grid extension plans.
3.1.8. ENABLING CONSUMER FLEXIBILITY
Until recently, generation patterns could be adapted in line with fluctuations in energy demand. However, as the energy transition progresses, and increasingly dispersed and intermittent energy sources are integrated into the system, a shift is underway: consumption patterns must now increasingly be adapted in line with production patterns. Flexible consumption is becoming more and more important both for supporting the grid as electrification spreads and renewable energy levels rise and for controlling system costs.
impact on adequacy and flexibility results. These new flexible appliances will allow households to consume more electricity when there is lots of wind and sunshine available and reduce or even shift their consumption to other periods of time when renewable generation is limited. Elia Group’s ‘Consumer-Centric Market Design’ (CCMD) is one example that aims to facilitate this. The CCMD proposal includes two features which are needed to unlock the potential held in consumer flexibility: (i) a decentralised exchange of energy; and
These high electricity prices had a notable influence on consumption patterns, resulting in a significant decrease in the demand for gas and electricity from households and businesses alike. The International Energy Agency (IEA) suggests that energy prices are unlikely to revert to historical levels in the foreseeable future [IEA-2]. The IEA also observed that the overall electricity consumption in Europe decreased by 3% but expects the demand to recover [IEA-9]. The decrease in consumption has raised broader concerns about the impact of prices on future energy consumption trends. The present study takes the impact of high prices into account when computing future consumption data for Belgium. A recovery period starting from realised 2022 figures is also constructed for each country. This is further detailed in Section 3.5.2.2.
3.1.7. GRID DEVELOPMENT REMAINS KEY FOR THE TRANSITION
The building of ‘leading’ grid infrastructure is critical for matching society’s ambition to accelerate the energy transition. Since areas with high amounts of RES are often remote, the need for long-distance electricity transmission is rising. Moreover, areas with complementary production patterns need to be connected as the availability of RES is not equally distributed across Europe.
To make optimal use of the continent’s RES, Europe needs to set up frameworks for partnerships between countries with different levels of RES potential. The rise of hybrid interconnectors and energy islands will allow electricity to be exchanged between countries whilst also connecting them to offshore wind farms.
The high-voltage grid is therefore playing a key role in ensuring a secure access to electricity for all citizens while keeping the costs of transforming the system as low as possible. An appropriate set of investments is to be realised in order to enable and maintain market integration, as well as contributing to overall security of supply. It is vital to acknowledge that the construction of grid infrastructure has a longer lead time than renewable energy projects. Therefore, to make the energy transition a reality and reap the most benefits from it, it is in society’s interest that the required transmission infrastructure is built in time.
In Belgium, Elia is responsible for writing and publishing a Federal Development Plan (FDP) for the country’s transmission system every four years. Each plan covers a period of ten years and includes a detailed estimate of onshore and offshore transmission capacity needs, alongside an explanation of the assumptions and methods used to calculate them. It also includes the investment programme that Elia will need to implement to meet the identified needs.
The rise in flexible devices, such as EVs and heat pumps, combined with the spread of digitalisation, is enabling consumers to play a leading role in the energy transition. Through the use of flexible devices, end consumers can be empowered to help balance the grid whilst also helping large amounts of RES to be integrated into the energy system. There are various legislative initiatives in Belgium and Europe that strive to promote demand response, but several obstacles must be overcome to achieve this goal [EUC-2] [ENT –3].
End user flexibility can be defined as the ability of energy consumers to adjust their energy consumption patterns in response to the changing energy supply and demand conditions. This can be enabled through various means in the residential and tertiary sector: a plugged-in EV can be charged at the most opportune moment for the system and a heat pump’s setpoint can be lowered or increased. These aspects are assessed in this study, alongside insights linked to their
3.1.9. MATERIALS AND SUPPLY CHAINS
The availability of materials is becoming an increasingly critical issue in the context of the energy transition. As the world seeks to reduce its dependence on fossil fuels and shift towards cleaner energy sources, there is a growing need for materials for these sources to be developed.
The most critical materials include rare-earth elements that are essential constituents in permanent magnets which are used in wind turbines and electric motors. These metals are also used in a wide range of other high-tech devices, such as smartphones, laptops, and medical equipment. The production of rare earth elements is highly concentrated, with China undertaking over 80% of the refining of these elements
(ii) access to a real-time price. Once rolled out, existing and new energy service suppliers will be able to provide their customers with better products and incentives, allowing them to valorise the flexibility of their energy consumption in line with real-time system needs. It is important to note that the evolution of market design is key but is not the only enabler that will need to be activated in order to unlock the potential additional flexibility.
As industry decarbonises its processes, industrial flexibility is also emerging alongside (residential) consumer flexibility. Today, the business case is mostly focused on industrial loads providing ancillary services to the power system or load shedding at very high prices. However, much broader opportunities are available, allowing industry to better align its consumption with renewable generation patterns and optimise it against dynamic electricity prices. See Elia Group’s study on industrial electrification, ‘Powering Industry towards Net Zero’ (outlined in BOX 3-1) for further information.
[POL-1]. This has raised geopolitical concerns in the West related to the secure supply of such materials.
Another critical material is lithium, which is used in batteries for EVs and energy storage systems. The mining of lithium is concentrated in Australia, South America, and China [WEF-1], while most lithium refining is carried out by Chinese companies [ARG-1]. Questions concerning whether there will be enough lithium production to meet the rapidly growing demand for EVs have been raised.
Cobalt is another critical material used in batteries, and, like lithium, its production is highly concentrated in a few countries: 85% of mining capacity is located in the Democratic
Republic of the Congo, with China owning 77% of the refining capacity. The extraction of cobalt is also strongly linked to the use of child labor [NPR-1].
Other critical materials for the energy transition include copper, which is used in electric wiring and infrastructure, and nickel, which is used in batteries and wind technologies. Concerns relating to the secure supply of these materials have been raised, as well as the potential for environmental damage associated with their extraction.
To ensure a sustainable and secure transition to a cleaner energy system, it is important to address the challenges surrounding these critical materials. This includes increasing the efficiency of material use, investing in recycling and circular economies, developing alternative materials, and promoting sustainable mining practices. It also requires greater international cooperation and strategic planning to ensure that supply chains are both resilient and diversified.
It is important to note that the development of RES in Europe and, even more so, in Belgium, is directly linked to the avail- ability of critical raw materials that are required for many technologies. There are concerns in the West that a shortage of some materials could materialise given that it relies quite heavily on China for several of them. Europe is expected to take action, for example through its Critical Raw Materials Act, to establish a more resilient supply chain, “supporting projects and attracting more private investment from mining to refining, processing and recycling” [EUC-15].
In a similar vein, the manufacturing capacities for clean technologies will need to be massively upgraded. For instance, the current annual wind offshore installation rate of 7 GW needs to be tripled in order for recent European ambitions to be met [ORS-1] [CGE-1]. Similar concerns emerge for the batteries used in EVs or stationary applications, or for the charging infrastructure that needs to be developed. The supply chain does not only include the production of the devices themselves but covers their design, production, transport, associated engineering work, installation, grid connection projects, etc.
3.1.10. KEY FACTS ABOUT THE BELGIAN ELECTRICITY SYSTEM
Historical generation sources
In the early 1970s, Belgium relied heavily on fossil fuels to meet its electricity demand, with a limited amount of electricity generated using renewable sources such as small hydroelectric power stations and biomass. However, in 1975, the first nuclear reactor, Doel 1, was commissioned. In total, 6 other nuclear power plants were commissioned before 1985. Nuclear power is still currently the largest source of electricity in Belgium, which accounted for approximately 46% of the total electricity produced in 2022.
Increase in RES generation since 2000
The use of RES rose from 2000 onwards, with biomass experiencing the largest increase. However, it was only after 2010 that solar and wind production began to play a role in Belgium’s electricity mix. In 2022, renewable generation constituted more than 20% of Belgium’s total electricity generation.
Closure of the last coal-fired plant in 2016
Belgium has taken steps to reduce its reliance on coal for electricity generation. The country’s last coal-fired power plant was closed in 2016, following decades of the country being dependent on coal. Since 1990, these coal units have gradually been replaced by gas-fired generation units, making natural gas the second-most used primary resource for electricity generation, accounting for around 25% of the electricity generated in the country.
Nuclear generation is due to be extended after maintenance works
Following much political debate, Belgium’s Government decided that most of its reactors would be closed as mandated by law in 2025, with two of the existing plants (Doel 4 and Tihange 3) expected to be kept in use following a year of refurbishment. At the time of writing, this will reduce the nuclear fleet by a factor of three, but will allow Belgium to maintain a share of its baseload production. Uncertainties on the timing are covered by the present study.
Demand
As discussed in Section 3.1.6, the increase in electricity prices resulting from the Russian invasion of Ukraine has had a significant impact on electricity demand. The reduction in electrical load has been particularly noticeable since the sharp increase in prices in June 2022, as shown in Figure 3-9. The electrical load in Belgium decreased compared with previous years during the latter half of 2022 through to April 2023. Note that a similar reduction in demand was also observed across Europe [IEA-3].
Min/Max 2017-2021 Average 2017-2021 2022 2023
Load normalised according to the temperature
Since March 2023, electricity consumption has begun to recover with consumption levels now falling within the range of historical demand values. However, despite this recovery, electricity consumption is still below average. This could be due to a range of factors, such as changes in consumer behavior, the adoption of more energy-efficient technologies and prices which are still relatively high when compared to a few years ago. The CENTRAL scenario of this study integrates the impact of high prices on the consumption as well as the expected increase in electrification. Several sensitivities are conducted around those assumptions.
The reduction and recovery of electricity demand has not been the same for all sectors. Figure 3-10 shows the monthly average industrial load in Belgium. Due to high energy prices, industries have heavily reduced their electricity consumption at the end of 2022, going outside of historical ranges. Based on the latest data available for April 2023, this electricity consumption seems to have returned to normal levels but is still under the levels observed beginning of 2022.
Min/Max 2017-2021 Average 2017-2021 2022 2023
Load is not normalised according to temperature
3.2. BELGIAN SCENARIO FRAMEWORK
A CENTRAL scenario is created for Belgium, aligned with official announcements and latest trends. In AdeqFlex’21, the CENTRAL scenario was established following the approved Belgian targets for 2025 and 2030 which were outlined in the national energy and climate plan (NECP) of 2019, following the With Additional Measures (WAM) scenario.
Since then, there has been a greater drive in Europe to accelerate the implementation of the European Green Deal. It is expected that each Member State will submit an updated draft NECP to the European Commission by the end of June 2023. These updated plans are meant to reflect Europe’s strengthened ambitions, in line with the European Climate Law, ‘Fit for 55’ and ‘REPowerEU’.
Given that the assumptions adopted in the present study had to be frozen at the beginning of 2023 so that the study could be completed and published on time, Belgium’s updated NECP was not yet available. Therefore, assumptions for Belgium are based on the latest official information available and on discussions or exchanges with competent authorities or market players.
In comparison with AdeqFlex’21, the CENTRAL scenario in the present study incorporates several noteworthy changes in addition to the updated long-term targets and assumed growth rates. Specifically, the following significant changes are covered:
• On the supply side:
- the decision to extend the lifetime of two of Belgium’s nuclear units beyond 2025;
- the commissioning of two new CCGT units which were contracted with a long-term contract as part of the country’s Capacity Remuneration Mechanism (CRM) for the winter of 2025-26;
- the delay in the Princess Elisabeth Zone commissioning by two years as well as the increase of the considered additional offshore wind capacity.

• On the demand side:
- accounting for industry electrification and associated flexibility;
- accounting for recent policies regarding electrification of heating in buildings and transportation and associated flexibility;
- incorporating the impact of the recent energy crisis on the demand.
Figure 3-11 gives an overview of the framework for Belgium’s CENTRAL scenario:
• Electricity demand and associated flexibility: a distinction is made for different load categories. Macro-economic projections from the Federal Planning Bureau are driving, along with the estimated impact of high electricity prices on the load, and the assumed evolution of the existing usages. Additional electrification in the transport (EVs), heat (heat pumps) and industrial sectors is assumed, along with associated flexibility. Electrolysers and losses are also considered. These assumptions are further explained in Section 3.3
• Generation and storage: the best estimate 2030 targets are used to set RES capacities, along with the Princess Elisabeth Zone for offshore wind. Known projects are considered alongside developments in the production of large-scale batteries (if deemed economically viable) and pumped-storage capacity. The extension of Doel 4 and Tihange 3 for 10 extra years as from the winter of 2026 onwards is assumed. For the existing large gas units (CCGT/OCGT), the known closures are considered together with additional extensions or closures depending on the economic viability assessment. The assumptions are further explained in Section 3.4
FIGURE 3-11 — SYNTHESIS OF THE ASSUMPTIONS FOR THE CENTRAL SCENARIO FOR BELGIUM
Data at the end of the mentioned year.
(*) The economic viability of new capacity is assessed via the EVA
(**) The economic viability of existing capacity is assessed via the EVA
3.3. BELGIAN CONSUMPTION AND ASSOCIATED FLEXIBILITY
3.3.1. DIFFERENT CATEGORIES OF ELECTRICAL DEMAND
The electricity consumption taken into account in this study is the total electricity consumption consisting of the final electricity consumption, the energy sector’s electricity consumption (refineries, liquefaction and regasification of Liquid Natural Gas, …) and distribution and transmission losses. In addition, the consumption of ‘Power-to-X’ devices such as additional electrolysers is also taken into account. An indicator of electricity consumption is also published on the Elia website where a more detailed definition is available [ELI-10]. It is important to note that this definition is not equivalent to the ‘Elia grid load’ and may differ from other statistical definitions of electricity consumption that can be found in other reports. More information about the different definitions of consumption is provided in BOX 3-2.
The forecasting of total load takes a set of input parameters which represent the main variables that are driving the evolution of total electricity demand for each sector in Belgium. The total consumption can generally be split into five main categories (as illustrated in Figure 3-12):
1) Existing electricity usages and the way it will likely change in future is taken into account by considering the following: economic/population growth, energy efficiency, behavioural changes, and the expected impact of high energy prices observed in 2022. This component of consumption is associated with a volume of market response (consisting of existing demand reactions of the market to prices) which has been observed historically and is assumed to remain in the future; additional volumes of market response can be invested in if economically viable.
2) Additional electrification in the transport sector due to the growing penetration of EVs. The flexibility associated with this component comes from different potential modes of charging and discharging EVs depending on their type, infrastructure, technical capability and market incentives.
3) Additional electrification in the building heating sector due to the growth in space and water heating heat pumps. The flexibility associated with this component originates from the different potential heating modes which depend on the required comfort, infrastructure, technical capability, and market incentives.
4) Additional electrification in the industrial sector and new usages – this is added on top of existing changes in usage and is due to fuel switching in industry (this could involve, for example, industry moving from fossil-based heating to power-to-heat devices) or new usages (covering, for example, data centres, Carbon Capture and Storage (CCS) technologies and electrolysers). Industry load and new usages are also associated with additional flexibility that they can provide.
5) DSO and TSO grid losses are also accounted for and are linked to changes to the four components above.
While electricity consumption is expected to rise, those additional loads are expected to provide a certain amount of demand side response (DSR) to the system. Each of the additional electrification categories is linked to a certain type of flexibility that is outlined in the following sections.
FIGURE
Assumed
Turned
Activating
In this study, flexibility is modelled in the unit commitment and economic dispatch model in two ways:
• In-the-market: dispatched every hour based on the system optimisation, within the energy and power constraint specified for each asset.
• Out-of-market: pre-defined time-series, which differ from the average use of the asset or vary from the natural load profile.
The difference between the two is that one will produce a different profile every day of every simulated ‘Monte Carlo’ year (based on the dispatch, outages, RES generation, etc.) and the other will be fixed before the dispatch.
Additionally, regardless of the above two categories, flexibility of the load can happen in two different ways:
• Shedding: reducing electricity demand (or switch to another fuel in the case of power-to-heat) if a certain price is reached. The price can be set to different levels depending on the use of electricity; i The methodology for the creation of hourly consumption profiles is described in Appendix B
• Shifting: moving electricity demand within the day, usually from peak hours to off-peak hours.
To maintain consistency between assumptions and allow the reader to understand the way that they are modelled, the flexibility assumptions of each type will be explained together with the assumptions taken for the load.
The evolution of each demand component and its associated flexibility volumes and constraints are explained in the following sections. Their combined evolution in the CENTRAL scenario in terms of yearly electricity consumption is presented in Figure 3-13. For the calculation of hourly electricity consumption profiles, the thermosensitivity of the consumption is applied, leading to different profiles and volumes for each climate year considered in this study.
BOX 3-2 — DIFFERENT DEFINITIONS OF ELECTRICITY CONSUMPTION
What is the definition of ‘total electricity consumption’ used in this study (more generally referred to as ‘total load’)?
Total electrical consumption takes into account all loads across the Elia grid, as well as across the distribution system (including losses). Given the lack of quarter-hourly measurements for distribution systems, this load is estimated by combining calculations, measurements, and extrapolations. The total load includes an estimation of ‘auto-consumed’ (i.e. ‘behind the meter’) electricity. Indeed, the model used in this study takes all (decentralised) generation into account, hence it also needs to take all consumption into account to avoid double counting. This excludes pumping from pumped-storage power stations and roundtrip offtake from batteries, which are modelled separately in this study, but includes electrolysis demand. This definition is also the one used for adequacy studies conducted by ENTSO-E.
What are the differences between ‘total electricity consumption’ and Elia’s consumption (more generally known as the ‘Elia grid load’)?
The Elia grid load covers all offtake as seen from the perspective of the Elia grid. It is indirectly calculated based on the injections of electrical energy into the Elia grid, which includes the measured net generation of (local) power stations that inject power into the grid at a voltage of at least 30 kV, and the balance of imports and exports. Generation facilities that are connected to distribution systems at voltages under 30 kV are only included if a net injection into the Elia grid is measured. The energy needed to pump water into the reservoirs of the pumped-storage power stations connected to the Elia grid is deducted from the total. Decentralised generation that injects power into the distribution networks at a voltage below 30 kV is therefore not fully included in the Elia grid load. The significance of this segment has steadily increased in recent years. Elia therefore decided to complement its publication with a forecast of Belgium’s total electrical load. Elia’s grid comprises networks with voltages of at least 30 kV in Belgium plus the Sotel grid in Luxembourg.
What is the link between total electricity consumption used in this study and EUROSTAT categories?
The total electricity consumption can also be found in the EUROSTAT database by taking into account the following categories as summarised in Figure 3-14:
• ‘Final consumption’ from industry, transport and ‘other’ (commercial and public services, households, agriculture and forestry);
• ‘Distribution losses’ including losses from distribution and transport electricity networks;
• ‘Energy sector – petroleum refineries’ representing electricity consumption from oil refineries in Belgium. This definition also includes so-called ‘auto-consumption’ from all sectors.
FIGURE 3-14 — DEFINITION OF TOTAL ELECTRICITY CONSUMPTION BASED ON EUROSTAT CATEGORIES
EUROSTAT categories
BOX 3-3 – SOCIOCULTURAL CHANGES – SUFFICIENCY LEVERS REDUCING ENERGY CONSUMPTION
Sufficiency is about redefining energy needs to rely less on resource intensive services to achieve well-being. It aims at fulfilling everyone’s need for services (provided by energy, land, materials) while adjusting their nature and quantity to maintain demand at a level compatible within planetary bounds (as defined by the IPCC) [IPC-1].
The IPCC [IPC-1] has identified demand side mitigation as one of the main levers for mitigating climate change and CO2 emissions. In its 2022 report, it estimates that this, alongside other demand side measures (such as changes in urban planning and end-use technology) can reduce global GHG emissions in end-use sectors by 40–70% by 2050.
There is a need to investigate the most impactful levers identified by the IPCC to tackle climate change. Since changes in urban planning cannot be quantified in this study, and end-use technology adoption is already considered in the CENTRAL scenario (as these are part of stated policies in Europe and Belgium), sociocultural and behavioural changes are tackled in a sensitivity. Hence, their impact on the capacity requirements of the Belgian electricity system can be measured. Elia has therefore performed a first attempt to quantify and simulate such evolutions for the electricity system (based on existing studies).
Total electricity consumption
What is published on Elia’s website?
Two load indicators are published on Elia’s website: the Elia grid load and the total load. The published Elia grid load and total load [ELI-10] include the load of the Sotel grid.
What is included in the value of the total electricity consumption in this study?
The projection of total electricity demand (and hence the hourly profiles) for all years analysed in this study takes into account the existing usage of electricity and additional electrification:
• existing use of electricity that will evolve in line with macro-economic trends and energy efficiency measures;
• additional electrification in the transport, heat, electrolysis and industrial sectors;
• losses;
• the Sotel grid consumption.
What is excluded in the value of the total electricity consumption in this study?
The round-trip efficiency losses (pumped hydro storage, residential & large-scale batteries, V2G technology) are excluded from the total load. Those are explicitly included in the economic dispatch simulations as storage is optimised by the model.
In addition to the IPCC, several other institutions have pointed out sufficiency as an efficient way to mitigate GHG emissions. These have included the IEA in its proposals for cutting down on oil use during the energy crisis [IEA-4], RTE when planning its ‘Futurs énergétiques 2050’ [RTE-1], and the EU Commission in its ‘RePower EU’ plan [EUC-11]. Some institutions have proposed sufficiency measures in times of crisis that can be quickly implemented (for example, reducing motorway speed limits, reducing thermostat setpoints), but only RTE has pointed out that other sufficiency measures need to be planned in the long term to fully capture their potential (for example, selling smaller and lighter cars to improve their energy efficiency per kilometre). Hence, two levels of sufficiency are defined in this sensitivity: (i) one with changes in behaviors, and (ii) another with structural measures put into place
This sensitivity investigates the impact of sociocultural changes, with the same electrification rate as in the CENTRAL scenario, for the year 2034, relating to capacity requirements.
Sociocultural measures considered in this study
Several sufficiency levers were listed and investigated based on the CLEVER study [CLE-1]. The goal of the latter was to explore energy sufficiency as a path to decarbonisation, where the scenarios were built bottom-up with more than 20 national partners from either the academic world, research or civil society.
The CLEVER study produced corridor values defining the energy allowed for each need. These corridors define a lower and upper limit of consumption. Each corridor then becomes a target to be achieved by national trajectory. For example, the corridor value for the space of dwelling occupied per capita is defined by the values 32 and 40 m2 To define this sensitivity, Elia used the average for each corridor.
These corridor values concern various sectors such as the residential, tertiary, transport and industry sectors, and various activities within those sectors. These ranges were used to review the input Elia uses when defining the future energy demand.
Several measures identified by the CLEVER study are shown, along with their impact (estimated by Elia) on the electricity load in 2034, in figure 3-15 and are detailed in Appendix VIII.
SUFFICIENCY LEVERS PER SECTOR AND THEIR ESTIMATED IMPACT ON ELECTRICITY CONSUMPTION (RESIDENTIAL, TRANSPORT, TERTIARY, AND INDUSTRY)
Figure
The residential sector is identified as the most affected by the measures put forward (decrease of up to 2.8 or 3.1 TWh in 2034) in both variant of the sufficiency sensitivity. This is primarily due to the numerous measures (5) that can be applied to this sector. The most impactful measures are the reduction in the consumption of appliances, and a decrease in hot water needs (both in terms of quantity and temperature). The impact is only shown for the electricity consumption.
Following this, the transport sector is then most impacted by a reduction in electricity demand. The greatest reduction comes from lowering speed limit on highways. The tertiary sector follows, with savings in heating. Regarding the industry, avoided consumption is considered only in the
‘System Change’ variant, as these would require structural investments. In conclusion, in this sensitivity, the overall electricity demand is still seen to increase drastically compared with today (+30% between 2022 and 2032, instead of +50% in the CENTRAL scenario) due to the electrification of end uses (heating, transport) and industry, but this increase could be reduced thanks in part to measures that could be applied starting today (and supplemented by measures requiring structural investments in the future). It is important to mention that those measures can also have a significant impact on other energy vectors (petrol, gas) as those are nowadays mainly used in heating and transport.
BOX 3-4 — QUANTIFICATION OF RESIDENTIAL AND TERTIARY END USER CONSUMER FLEXIBILITY
The spread of electrification across the residential and tertiary sectors will add large amounts of electricity consumption into the system that will need to be managed by the system. Despite this challenge, the spread of electrification will bring about great opportunities for providing the system with additional flexibility.
In light of this, to investigate and consider all relevant related facets, Elia asked the consulting company DELTA-EE to undertake a study on its behalf. This was then submitted for public consultation in November 2022; its key points are summarised in scenario Appendix III
This study identified various technologies to consider, assessed their flexibility potential, and helped Elia refine its assumptions regarding future developments linked to flexibility in the residential and tertiary sectors.
Firstly, key technologies for flexibility in the residential and tertiary sectors were determined. Their conclusion, summarised in Figure 3-16, shows that the most relevant technologies to consider are electric vehicles (EVs), heat pumps (HPs) and residential batteries.
However, just because an asset can be operated in a flexible way, users may not necessarily use it in such a way.
What was needed to unlock this flexibility was investigated. A framework for this was developed and shown in Figure 3-18.
Many hurdles still have to be tackled to fully enable consumer flexibility. Assets require several elements in order to deliver flexibility:
• a certain volume (MW, MWh), meaning the flexibility it can offer is of a relevant size;
• a control signal which specifies when the asset’s power output should be modulated (such as a market able to cope with it);
• the capability to be controlled, which is linked to the control signal as well as normalisation of device’s interfaces and communication protocols;
• proper metering which can gather the data needed for the control signal;
• consumer willingness to engage with flexibility services. Once these elements have been established the capacity of the demand side asset is unlocked and its provision of flexibility can be encouraged.
Different operating modes for these assets are included in Figure 3-17 All assets are classed according to on whether they operate based on a local signal or a mar- ket signal. The former corresponds to implicit flexibility and the latter to explicit flexibility (coming from the end consumer).
Control signals
H - House Signal Operation of asset based on a Local signal from the household
E.g.: Static and dynamic time of use tariffs, capacity tariffs, PV optimisation.
HP1H: Flexible operation implicit flexibility
V1H:
Smart charging - implicit flexibility
V2H:
Bi-directional smart charging - implicit flexibility
B2H:
Bi-directional operation - implicit flexibility
Note: 1 stands for uni-directional flow of energy (charging)
2 stands for bi-directional exchange of energy
M - Market Signal
Formal contract with the market to provide flexibility
E.g.: Ancillary services, interval balancing, trading, DSO services.
HP1M:
Flexible operation implicit & explicit flexibility
V1M:
Smart charging - implicit & explicit flexibility
V2M:
Bi-directional smart charging implicit & explicit flexibility
B2M:
Bi-directional operation implicit & explicit flexibility i More details on the barriers identified are available in scenario Appendix III
As explained, several barriers are hindering the development of flexibility. With the right regulations and incentives in place, the deployment of flexible resources can be encouraged, unlocking the potential to better manage electricity demand and improve system reliability and efficiency. These elements need support to arise. For example, articles 19 to 22 of Directive 2019/944 [GOV1] supports the growing penetration of smart meters in Belgium which will help unlock flexibility at the consumer level. This policy and others were factored in when designing the CENTRAL scenario. DELTA-EE also looked beyond existing policies and made assumptions regarding the future development of policy in the area, most notably in terms of communication protocols. These are needed to ensure that the demand side assets can communicate with relevant parties seamlessly, exchange data with them and control their behaviours accordingly (in other words, how to coordinate a full fleet of EVs, or an EV and a HP within a house). The right standards could also facilitate interoperability and competition among vendors, lowering the costs and improving offers for customers. Without protocols and standards, the integration of EVs and HPs into the system and unlocking of their flexibility potential would be more than challenging.
The CENTRAL scenario also considers that market reforms are being put into place allowing behind-themeter devices to be optimised. If key pieces of such market reforms are adopted, such as third parties offering flexibility services behind the meter, this will greatly lower the barriers standing in the way of customers engaging with the market.
The CENTRAL scenario takes into account the development of EVs and HPs, vehicle-to-grid technology, and the ways consumers will interact with these changes in order to assess the impact of more or less flexibility being unlocked. The distinction between flexibility resulting from a local signal or market signal is also modelled in different categories for EVs, HPs and batteries. The impact of consumer-side flexibility (in the residential, tertiary, and industrial sectors) on Belgium’s adequacy and flexibility needs and means are assessed in this study.
3.3.2. EXISTING USES OF ELECTRICITY
This section provides an overview of the assumed evolution of the current utilisation of electricity by the different sectors. The CENTRAL scenario evolution is presented together with the quantified sensitivities related to the impact of energy prices. The associated flexibility from the existing usage of electricity is also further detailed and quantified.
3.3.2.1. Evolution in annual consumption
The existing use of electricity demand in Belgium has been defined and quantified with tools and methodologies developed by Climact, a Belgian consultancy company. They perform their analysis after the Federal Planning Bureau’s publication of their yearly detailed macroeconomic projections at the end of June, within the framework of the scenario choice for the Capacity Remuneration Mechanism calibration reports. The latest available projections are taken into account (June 2022) [FBP-2] for this study.
The model used by Climact is based on the ‘BECalc tool’, which was developed by Climact for the FPS Environnement, and was improved in order to take into account factors such as short-term economic projections to quantify total electricity demand projections in the short- and medium-term. The methodology they used is explored in detail in a public report [ELI-11] and was put out to consultation and discussed with stakeholders.
The tool takes a set of input parameters which represent the main variables driving changes in the use of electricity demand per sector and for Belgium. The indicators include the growth rate of added value per sector, disposable income, changes in the number of appliances or their usage, building renovation rates, and industry production levels per sector.
The tool factors in continuous improvements in terms of energy efficiency throughout the time horizons in all demand sectors and in different sub-categories (building – renovation, appliances including lighting, heating and cooling, processes in industry and agriculture, etc.). These assumed improvements in energy efficiency are aligned with current trends.
Changes in DSO and TSO grid losses are also considered. Note that these do not only depend on existing uses of electricity; they also depend on other categories of Belgium’s electricity consumption, as follows:
• transmission losses are calculated by Elia using a transmission grid model that takes into account the development of generation (including decentralised generation), evolution of load, European market flows as well as a best estimate for the localisation of future load and generation (taking into account the effect of decentralised generation on the power exchange at the interface between transmission and distribution);
• regarding the distribution losses an evolution in line with the evolution of residential and tertiary load (which includes EVs and HPs) is considered, starting from the values observed in 2021.
BOX 3-5 — QUANTIFYING THE IMPACT OF HIGH GAS AND CO2 PRICES ON ELECTRICITY DEMAND
In 2022, electricity prices soared following the Russian invasion of Ukraine. Compared with the two previous years, the average monthly wholesale price in Belgium dramatically increased due to increases of gas prices on the wholesale market (as depicted in Figure 3-7).
Our stakeholders communicated that the impact of high prices on consumption had to be considered in future estimations, since increasing prices lead to decreases in electricity consumption (and other energy carriers), as observed throughout Europe (see Section 3.1.6).
The impact of prices is also factored in the load trajectory for high and low prices trajectories. Higher fuel prices, will lead to higher electricity prices which above a certain threshold can have an impact on the demand consumption as observed in 2022. The opposite is also true for lower prices, leading to a lower impact on consumption. The different prices for these sensitivities are presented in Section 3.7)
The methodology to calculate the impact of electricity price levels on load was developed by Climact and presented to the Adequacy Working Group on 25 August 2022 [ELI-6]. It consists of 4 steps, as depicted on Figure 3-19:
• STEP1: future electricity prices are estimated based on the forwards or the fuel and carbon prices (outlined in Section 3.7.1 and Section 3.7.2);
• STEP 2: a price elasticity associated with electricity is considered (as described in a paper published by the CREG [IJI-1]) and, taking 2020 electricity price levels as a reference, a theoretical load reduction can be computed;
• STEP 3: the load reduction is different for each sector and a cap on the reduction is applied; for instance, the load reduction for hot water use, lighting and cooking are not the same as these energy uses do not fulfil the same basic needs. A reduction of electricity consumed by industry is also accounted for since this was observed in the second half of 2022 (see Figure 3-10). However when prices go back to lower levels after 2026, it is expected to have no residual impact on the industry;
• STEP 4: the corresponding reduction is applied for each future year, across each sector with their corresponding caps.
FIGURE
METHODOLOGY TO COMPUTE THE IMPACT OF HIGH PRICES ON THE LOAD ON THE SHORT, MEDIUM AND LONG-TERM
Accounting for price elasticity results in a lower consumption than would be initially estimated without taking this effect into account. But this impact differs for each price sensitivity, and changes in time following prices trend.
Figure 3-20 depicts the load reduction assumed in the CENTRAL scenario (which is already integrated in the figures presented in this Chapter) and the LOW/HIGH price sensitivities. Over time, two trends influence the impact: (i) the decreasing trend in gas prices in all scenarios which leads to lower electricity prices within each scenario and hence a smaller demand reduction over time, and (ii) the increasing trend in CO2 prices leading to higher electricity prices.
The impact for each price scenario can be explained as:
‘LOW gas and CO2 prices’: The reduction in electricity consumption does not exceed 2.2 TWh in 2023. As of 2026, as prices are back to historical low levels, there is no impact assumed on the load.
CENTRAL scenario: the highest load reduction is assumed in 2023 at 4.6 TWh. In the long-term, prices are expected to have a residual impact on electricity consumption as these are not expected to go back to historical levels. There is a lasting effect of around 1 TWh resulting from structural changes in consumption which result from the ‘energy crisis’ in the residential and tertiary sectors.
‘HIGH gas and CO2 prices’: the decrease in electricity consumption is here the highest, with an impact up to 7.4 TWh in 2023 and a lasting effect larger than 4.5 TWh over time affecting all sectors. With gas prices remaining high, this scenario takes the assumption of a lasting effect on industry consumption, as well as residential and tertiary sectors.
Sensitivities linked to short-term economic effects and energy prices on the existing electricity usages
Elia considers the assumption of existing industry remaining in Belgium to be an intrinsic aspect of defining a central scenario, since no industries have indicated that they will definitely close due to high electricity prices in Belgium. Some companies have temporarily reduced/stopped their production, but almost none have declared that they will definitively close. Moreover, the European Commission recently presented its Net Zero Industry Act (NZIA) [EUC-6], which includes goals and measures aimed at increasing investments in and the production of technologies and products which are critical for the green transition, alongside ensuring the EU’s security of supply and strategic autonomy in key sectors. Therefore, in the CENTRAL scenario, the implicit assumption remains that industry does not relocate but does react to high energy prices by increasing energy savings and fuel switching.
Nevertheless, there is a significant amount of uncertainty surrounding future energy prices and their (prolonged) impact on the behavior of private individuals and organisations, particularly in the residential and tertiary sectors. Additionally, the risk of (permanent) demand reduction or destruction exists, alongside a rebound effect in the industrial sector. To account for these uncertainties, two additional sensitivities are put forward.
A potential development which could occur following low energy prices would be a rebound effect of the economy, as experienced after the COVID-19 pandemic. Recently, the IEA predicted such an effect over the next few years in its 2023 electricity market report [IEA-3]; this would be aligned with the European Commission’s ambitions set out in the NZIA [EUC-6]. To assess the impact of such an effect on adequacy, a sensitivity analysis with a rebound effect for the short-term is proposed. This sensitivity is quantified taking the ‘LOW’ prices sensitivity into account (see Section 3.7 for more information) and calculating its impact on the electricity consumption as explained in BOX 3-5
On the contrary, the persistence of high energy prices in Europe (when compared with other continents) could undermine the competitive position of Europe’s industry. The temporary cuts to production undertaken in 2022 could turn into permanent ones, possibly leading to companies closing or relocating, in turn causing an economic slowdown in Europe. Furthermore, investments in new factories and/or electrification initiatives in line with the transition to clean energy might be delayed and/or abandoned (such as those discussed in Section 3.3.5). This sensitivity was therefore quantified using the ‘HIGH’ prices sensitivity (see Section 3.7 for more information) and calculating its impact on the electricity consumption as explained in BOX 3-5.
The uncertainty around energy price developments and reactions to these prices are taken into account as shown in Figure 3-21.
In addition to those sensitivities, the chosen scenario for the LCT needs assessment is also depicted on the figure. This consists in the average consumption between the ‘Rebound’ and CENTRAL scenario.
NORMALISED YEARLY TOTAL ELECTRICITY CONSUMPTION UNDER DIFFERENT SHORT-TERM SENSITIVITIES FOR BELGIUM [TWH]
3.3.2.2. Flexibility from existing usage of electricity (market response)
The starting point for assumptions regarding demand response amidst existing usage of electricity consists of shedding capacity. The amount is based on the E-CUBE market response quantification for winter 2021-22 (see [ELI-2]). The market response quantification encompasses volumes of existing DSR which are treated as distributed capacity, and which can be activated when prices exceed a certain threshold. This category may encompass storage and small-scale generators that are not explicitly modelled as generation units (e.g. emergency generators). Note that storage capacities are addressed separately in this study.
Based on the quantification of market response observed during winter 2021-22, a growth rate of +8% was applied, corresponding to the highest rate proposed and included in the E-CUBE quantification study. This leads to 1,798 MW of installed capacity by the end of 2022. The capacity is split between different categories depending on the number of hours during which DSR can be activated: 1 hour, 2 hours, 4 hours, 8 hours and unlimited; each of these categories amount to 130, 453, 634, 388 and 193 MW respectively.
The amount of capacity is kept constant over the entire period in the CENTRAL scenario. However, a capacity potential is also defined for each target year. The additional capacity potential is introduced in the economic viability assessment and is associated with a given investment cost. On top of the existing capacity, an additional potential volume can therefore be integrated into the model. This volume is considered in the scenario if it is shown to be economically viable without a support mechanism. This will be determined via the economic viability assessment (EVA). This additional potential volume increases over the time horizon and is assumed to be added in the 4 hours category, from 25 €/kW to 100 €/kW in steps of 300 MW. This is further detailed in Section 3.7.4.4
The maximum potential of DSR from existing usages in 2034 is defined as 25% of the peak load in Belgium today. To our knowledge, this goes well beyond any study about demand response potentials which contain percentages of between 10% and 20% [GIL-1] [RAP-1][JRC-1][SIA-1]. It is also important to note that the existing usage of DSR or market response does not include additional flexibility from additional electrification of transportation, heating or industry. This is tackled separately in upcoming sections.
Figure
Response And Capacity Potential Considered In The Central Scenario
3.3.3. ELECTRIFICATION OF TRANSPORT
In this section, the assumptions regarding the spreading of electrification across the transportation sector are presented. Distinct trajectories are presented for passenger cars, light-duty freight (also called vans), heavy-duty freight (also called trucks) and buses. The trajectories included in the CENTRAL scenario are derived from observed trends, discussions with relevant stakeholders and (where possible) from regional, federal, and European legislation. The section concludes with an overview of how flexibility from EVs is considered.
3.3.3.1. The evolution of passenger car fleets
At the end of 2022, there were around 5.9 million passenger cars on the road in Belgium, of which 90,000 were Battery Electric Vehicles (BEV) and 180,000 were Plug-in Hybrid Electric Vehicles (PHEV), representing a share of around 4.5% of the country’s total car stock.
In recent years, passenger car sales have suffered due to the COVID-19 crisis and subsequent supply chain issues. Based on the latest figures available from FEBIAC, in 2022, a record low of 366,000 passenger car units were sold. The drop was most significantly felt in the private car segment (-36% for the period 2020-2022 when compared to the 2009-2019 average), whereas its impact remained relatively limited in the company car segment (-15%). Some recovery can be expected, since an increase of +27% in car sales occurred during the first trimester of 2023 in comparison with the same trimester in 2022 [FEB-3]. In Belgium, there is a big difference in the uptake of EVs for company car (around 1.25 million cars at the end of 2022) and private car (around 4.7 million cars at the end of 2022) segments of the market. In 2022, 26.5% of passenger car sales were either BEVs or PHEVs, of which around 90% were company cars. It is worth mentioning that the ‘hybrid’ cars are not categorised in this study as ‘EVs’ as those do not rely on external charging.
For the expected evolution in the CENTRAL scenario, it is assumed that 415,000 new units will be sold per year during the period 2023-2035, given that car sales will likely recover once supply chain issues are overcome (although they are likely to remain below pre-crisis levels). Different policies are being put in place which will likely influence the electrification of this segment, as follows:
• It is assumed that all passenger car sales will be fully electric by 2035, due to the EU-wide ban on the sale of internal combustion engine (ICE) cars [EUP-1]. Note that following pressure from some Member States, the European Commission has backtracked on this decision and has allowed ICE vehicles which are powered by e-fuels to be sold [EUC-1]. As this decision was taken after the assumptions for electric vehicles for this study had been frozen, it was not possible to take this into account;
• In terms of company cars, it is assumed that due to fiscal measures implemented at the federal level and the Low Emission Zone (LEZ) in the Brussels Capital Region, all sales will be fully electric by 2029 [GOV-2] [BCR-1].
• In Flanders, it is assumed that all car sales will be fully electric by 2029 [VLA-1].
• In Brussels, it is assumed that no more diesel or gasoline cars will be sold as from 2030 and 2035 respectively due to the LEZ [BCR-1].
• In Wallonia, no policies at the time of undertaking this study have been identified. It is therefore assumed that 40% of sales will comprise BEVs in 2030, with sales reaching 100% by 2035, in line with the EU regulation.
The resulting number of BEV & PHEV vehicles are provided in Figure 3-24. The rapid electrification of vehicles observed between 2022 and 2030 is mainly driven by the company car segment (around 1.25 million units today). It is assumed that the electrification of the private car segment will happen at a somewhat slower rate, accelerating from 2030 onwards, with Flanders being a bit ahead of the other two regions due to local policies.
A high and a low sensitivity are also defined to capture a delay or an acceleration of the electrification of passenger cars. The associated trajectories are detailed in Figure 3-26 alongside the other segments.
IN BELGIUM PER SEGMENT (PRIVATE/COMPANY) AND REGION IN THE CENTRAL SCENARIO
3.3.3.2 Evolution of other transportation segments (vans, trucks and buses)
In addition to passenger cars, assumptions are also made for the evolution of vans (Light-Duty Vehicles, LDV), trucks (Heavy-Duty Vehicles, HDV) and buses. The trajectories for those segments are illustrated in Figure 3-26.
At the end of 2021, there were around 850,000 vans in Belgium, less than 1% of which were electric. In the run-up to 2035, it is assumed that LDV sales continue on a trend which is slightly below the 10-year average. The main policy considered is the EU-wide ban on the sale of ICE which will also apply to vans. Therefore, it is assumed that all LDV sales will be fully electric by 2035. As such, LDV sales will likely follow a similar trajectory to the trajectory of passenger cars, but with a more delayed mass uptake. Similarly, as for passenger cars, a high and low sensitivity is proposed.
At the end of 2021, there were around 150,000 trucks in Belgium, practically none of which were electric. The main driver for electrification in this segment is the EU regulation which has set CO2 emission performance standards for new heavyduty vehicles [EUR-1]. The European Commission has proposed an amendment to this regulation to strengthen CO₂ emission performance standards for new heavy-duty vehicles [EUC-5] (see BOX 3-6). According to the sector, such targets can only be reached by truck manufacturers switching from traditional drivetrains (i.e. diesel) to low-carbon ones (such as battery electric). Under the CENTRAL scenario, it is assumed that 30% of new truck sales in Belgium will be battery electric in 2030, increasing to 70% in 2035. This leads to around 25,000 units in 2035. As for the other segments, a high and low sensitivity is taken into account to cover the uncertainty related to supply chain readiness and alternative drivetrains. It is impor- tant to note that Belgium is also a transit country for trucks and that these would also use the charging infrastructure that is due to be installed in the future. This is not considered in this study, but might be considered in upcoming studies if the proportion of electrified HDV increases and if more data is made available about truck charging in Belgium. At the end of 2021, there were around 15,000 buses on the road, around 3% of which were electric. The electrification of this segment is mainly driven by ambitions communicated by the regional public bus companies, as follows:
• in Flanders, ‘De Lijn’ wants to own a 100% electric bus fleet by 2035 [DEL-1].
• in Brussels, the ambition is to have a 100% electric fleet by 2035 [MIV-1].
Given the above, it is assumed that 30% and 70% of all buses will be electric by 2030 and 2035 respectively. Note that the European Commission’s proposal [EUC-5] also means that all sales of city buses must be zero-emission by 2030.
BOX 3-6 — TRUCK TRANSPORT IS ALSO PLANNING TO ELECTRIFY
European legislation is getting stricter
In recent years, the electrification of trucks has picked up in Europe. This is explained by European policies [EUR-1], which have set strict CO2 emission targets for new trucks on the road. These objectives could be met by increasing the efficiency of trucks with existing drivetrains. However, the most recent proposal (14/02/2023) from the European Commission includes CO2 emission targets that can only be reached by switching to alternative (zero-emission) drivetrains [EUC-5]. These stricter targets include:
• a reduction of 45% in emissions by 2030 (compared to -30% under the current regulation [EUR-1]);
• a reduction of 65% in emissions by 2035;
• a reduction of 90% in emissions by 2040.
European truck manufacturers set ambitious targets
It should be noted that the European truck manufacturing market is rather cohesive: individual objectives rapidly impact the market as a whole. In a joint declaration published in December 2020, European truck manufacturers covering almost 90% of the market share (based on 2021 data from [STA-2]) committed to a target of 100% zero-emission vehicles (ZEV) by 2040 [AEA-1] as depicted on Figure 3-25. Some of these manufacturers have announced even stricter targets, a few of which specifically relate to the objective of battery electric trucks (BEV). Sales forecasts from European truck manufacturers show that, by 2030, more than 50% of sales are expected to be BEV [NOW-1]. In Belgium, at least one major truck manufacturer has announced it will start producing BEV trucks in Ghent [DTI-1].
FIGURE 3-25 — MARKET SHARES (2021) AND PUBLIC NEW SALES OBJECTIVES FOR EUROPEAN TRUCK MANUFACTURERS
Challenges and prerequisites for the successful uptake of BEV trucks
Initially, it was believed that the heavy weight and long-distance requirements could pose potential challenges for BEV technologies. However, it is worth noting that not all trucks need to travel long distances or carry extremely heavy loads and, in line with European legislation, truck drivers must take 45-minute breaks every 4 1/2 hours, which falls within the existing BEV driving range [EUR-2].
A prerequisite for the successful uptake of BEV trucks is the deployment of fast charging stations and the development of ultra-fast charging technologies which will reduce charging times and enable electric trucks to undertake long-distance travel. Additionally, advancements in battery technology, such as higher energy densities and faster charging capabilities, will further enhance the viability of electric trucks for long-haul applications.
3.3.3.3. Sensitivities related to the amount of electric vehicles
The uptake of electric vehicles depends on a set of uncertainties, such as changes in the number of vehicles sold, a number which may be influenced by lingering impacts linked to high energy prices, supply chain issues and/or the availability of production materials. Therefore, two additional sensitivities are considered, resulting in a ‘LOW’ and ‘HIGH’ trajectory for the uptake of EVs. These sensitivities are displayed in Figure 3-26 for the different segments.
In general, the ‘HIGH’ trajectory both assumes a higher absolute number of vehicles sold on a yearly basis and a higher relative share of EVs within those sales. The opposite assumptions are made for the ‘LOW’ trajectory. More details about the trajectories can be found in scenario Appendix I (Electricity consumption in Belgium).
FIGURE 3-26 — ASSUMED EVOLUTION OF ELECTRIC VEHICLES (BEV+PHEV PASSENGER CARS, LDV, HDV AND BUSES) IN BELGIUM UNDER THE DIFFERENT SCENARIOS
Figure 3-27 presents the evolution of yearly electricity demand for road transport in the CENTRAL scenario. The company passenger cars segment is the main driver behind the increase in electricity demand in the period leading up to 2030, as it is expected that the fiscal reform measures [GOV-2] will accelerate the electrification of this segment. After this period, private passenger cars, light- and heavy-duty freight are also likely to cause uptake in terms of electricity consumption. Between sensitivities, no distinction is made in the car usage per year and/or the efficiency. The difference is purely driven by assumptions about a different number of EVs.
3.3.3.5 Flexibility assumed in electric vehicle load
Passenger cars (either private or company-owned cars) and vans (LDVs) are assumed to provide flexibility under similar assumptions. No flexibility is assumed in terms of buses and HDVs, as the use of these assets needs to be maximised to make them economically viable, leaving them connected to a charger without charging for short periods only.
Moreover, not all EVs able to provide flexibility for the system will be operated in the same way. To model this, different operating modes have been defined, as summarised in Table 3-2. Each operating mode is modelled differently in
3.3.3.4 Annual electricity demand for electric vehicles
Table 3-1 summarises the assumptions related to the annual electricity demand per vehicle for road transport in the different segments. The annual usage (km/year) is derived from the historical number of vehicles [FEB-4] and total distance travelled per segment [FEB-5]. Note that for the passenger car segment, a distinction is made between company and privately owned cars, since historical data indicates a more intense usage of company cars, leading to a higher annual consumption. On the other hand, historical data analysis shows that PHEV cars are mostly used in non-electric mode in the company car segment [ICC-1].
this study. A distinction is made between in-the-market (V1M, V2M) modes, which are dispatched by the model, and out-ofmarket (V1H, V2H) modes, which correspond to pre-defined time series, as stated in Section 3.3.1.
i The EV modelling methodology is described in more detail in Appendix D.
Flexibility under the CENTRAL scenario
The different operating modes will penetrate the market to different extents, as shown in Figure 3-28. This scenario was established by DELTA-EE (further details can be found in scenario appendix III). As explained in the latter, and in BOX 3-4, several enablers are needed to unlock flexibility for each asset such as the development of adequate market mechanisms. The elements needed depend on the operating mode. The main elements resulting in a greater penetration of flexibility among EVs is the growing penetration of (i) smart meters, which will allow proper metering; and (ii) smart chargers, which will allow them to be operated based on a control signal. The flexible operation of EVs is therefore expected to grow in time with these elements.
The way the vast majority of EVs is operated today (Natural charging – V0) is expected to reduce to less than 10% of all EVs by 2034 (equivalent to roughly 200,000 EVs).
The greatest share of EVs will follow the V1H profile, optimising their consumption based on local signals (e.g. time-of-use tariffs): an astounding 1.4 million EVs is assumed to follow this pattern in 2034. The reason for this is that incentives already exist today for users to charge their EVs in such a way (e.g. day/night tariffs). With the right market reforms and most chargers installed in the future being smart, this category is expected to grow significantly.
The second biggest category is the V1M profile, which will cover a little less than 1 million EVs by 2034; these will be able to displace their daily energy consumption in line with the best moment for the market. The increase in this profile will be associated with the growth of smart meters in Belgium, and the moment when market players are expected to approach consumers with a simple and attractive offer allowing their participation in flexibility services. Market flexibility takes more time to penetrate the market, since it needs to overcome several barriers before it can be made available: (i) building a simple offer for consumers with no impact on their comfort; and (ii) the implementation of communication protocols and solutions.
The bi-directional exchange of energy between EVs and the grid will become a game changer for the operation of the electricity system. The latter is expected to become available as of 2026 along with the sale of new cars and new chargers. It is assumed that it will take two years for market players to build a market offer that allows the penetration of vehicle-to-market (V2M). Overall, V2 technology is assumed to grow as the technology becomes available in new EVs and charger sales, eventually reaching 300,000 EVs by 2034 (V2H and V2M).
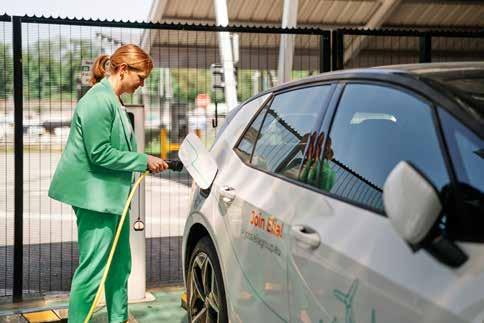
These proportions in the CENTRAL scenario were developed by DELTA-EE. Their work on residential and tertiary flexibility is briefly described in BOX 3-4, with all associated details included in scenario Appendix III.
Average hourly charging profiles
EV consumption is estimated for each day starting from an assumed yearly consumption of each type of EVs, and taking into account seasonal and weekly differences (e.g. weekend/weekday). This estimated daily consumption is then split through the day following an intra-day profile. The latter defines for each hour of the day the energy consumed by the asset. The intra-day profiles are different for each operation modes defined here. For the interested reader, the full description of the EV modelling is available in Appendix D. It describes the different profiles, and how the energy and power constraints of the in-the-market EVs are determined.
On the figures of this section are represented the so-called ‘intra-day profiles’. Those are representing the hourly share of the daily energy need. The resulting hourly load profile is a combination of the load profile of all the operating modes in the proportion shown in Figure 3-29. This figure is split in three parts:
STAGE 1: the intra-day profiles of all operating modes (V0, V1H, V1M, V2H, V2M) are represented at the top of the figure. From left to right, the profiles graphs show the natural charging (V0), the out-of-market profiles (V1H, V2H) and the in-the-market profiles (V1M, V2M). These profiles show how the energy demand is charged through the day. For example, the energy demand of all EVs following V0 operation mode will show a peak at 8 PM, as 10% of the daily energy demand is charged at that moment.
For natural charging (V0), or the out-of-market (V1H, V2H) operating modes, the pre-defined time-series do not change as each year passes, or even within each year. However, for the in-the-market operating modes (V1M, V2M), (dis-)charging can vary every day based on the model dispatch. Hence, any profile of EV charging should be considered with care.
STAGE 2: the EV fleet is split among these operating modes in different proportion in the CENTRAL scenario through the years. For example, the proportion of V0 decreases through the year, representing 76% of the EV fleet in 2023 and 8% by 2034.
STAGE 3: the profiles of the different operating modes in STAGE 1 are combined in the proportions shown in STAGE 2 to obtain an equivalent load profile for each year simulated. Note that the profile depicted at the bottom of the figure corresponds to a winter profile. The behavior in summer is different as shown in the next section.
The evolution of the average profile in winter as each year passes is provided in Figure 3-29. Several trends can be noted from this, as follows:
• In the evening (6 PM to 11 PM), the load decreases as each year passes and, as V2H and V2M penetrate the market
• Most of the charging happens before the usual total load morning peak (8 AM):
- there is a charging peak around 3-4 AM from 2026 onwards, due to the penetration of operating modes other than ‘natural charging’ (V0);
- the amount of charging during the day increases with the years, due to the increased penetration of solar panels in the system and market dispatched charging.
FIGURE 3-29 — EVOLUTION OF THE AVERAGE INTRA-DAY PROFILE FOR EV CHARGING FROM 2024 TO 2034 ON A WINTER’S DAY
DISCLAIMER: the dispatch of the V1M and varies for every hour and is an output of the simulations. Only the average winter dispatch is shown for illustrative purposes.
In-the-market profile variations

As each year passes, the share of EVs offering flexibility services to the system is assumed to increase. Whether by shifting their electricity consumption when electricity prices are at their lowest (V1M), or even injecting power back into the grid (V2M), the potential for flexibility will grow exponentially in line with the electrification of transport.
The dispatch across the years, in winter and summer, for V1M and V2M is presented in Figure 3-30 and Figure 3-31 respectively. Each figure depicts the dispatch for different years (2024, 2030 and 2034) and for winter and summer. These two seasons are shown as variations in the residual load drastically change between them.
For the sake of comparison, as the volume of flexible EVs increases across the years, the profiles are presented as the percentage of cars which will charge and discharge within that operating mode. Each graph depicts (i) the power constraint for charging and discharging; (ii) the average dispatch across all climate years; and (iii) the range between the 10th and 90th percentiles of values across all climate years. The power constraint for charging and discharging is linked to the assumed number of cars connected to a charger during the course of the day. More details on are available in the dedicated Appendix D.
For V1M, the energy to be charged every day is dispatched differently:
• as each year passes, as the energy system changes (with growing shares of renewables overall);
• within a year, as the production associated with different energy sources is not the same (e.g. more solar production in summer).
Regarding V2M, the behaviour does not change significantly over the different target years, but differs from season to season:
• injection always happens in the evening, when the peak loads occur;
• in winter, the charging is split between the early morning and the daytime, depending on the energy production of PV panels;
• in summer, the charging happens mainly during the day, when PV generation is high; in the run-up to 2034, the average profile shows overlap with the P10-P90 during the daytime, which is clearly linked to the PV generation during those hours.
Note that for both in-the-market operating modes (V1M, V2M), the P10-P90 range is wide. This shows the variability in the charging profile for smart charging between days.
3.2.3.6. Sensitivities linked to the flexibility assumed to be provided by electric vehicles
The extent to which EVs are operated as flexible assets is contingent upon numerous uncertain factors and developments, namely (i) the amount of smart chargers penetrating the market; (ii) the uptake of vehicle-to-grid technology in vehicles and chargers; (iii) the penetration of smart meters; (iv) market reforms; and (v) consumer adoption of EVs.
The present study includes sensitivities regarding the above to consider several different possibilities. Three sensitivities are performed regarding the flexibility assumed to be provided by EVs. These are explained in further detail below and summarised in Figure 3-32.
• ‘No Flexibility’: if no market initiatives or policies are implemented to incentivise flexibility, all cars are expected to charge in line with a natural profile throughout the time horizon explored in the present study. This is a theoretical approach and will only be used to highlight the importance of optimised profiles for adequacy.
• ‘Low Flexibility’: this scenario represents a situation in which today’s policies remain as they are, with no future adjustments and no implementation of an adequate market design allowing consumers to enable their flexibility. The pace of penetration of smart meters in this sensitivity remains insufficient and the lack of market reforms and clear price signals hinders the development of explicit flexibility offered by end consumers. However, assets can still be locally optimised. By 2034, this translates into roughly 50% of the EV fleet following natural charging patterns and the rest being charged outside of peak hours, with minor developments in vehicle-to-grid technology.
• ‘High Flexibility’: if the required policies and changes are implemented, the vast majority of EVs could react to price signals by 2034. This scenario involves (i) the adequate market reform being fully rolled out; (ii) the required infrastructure being rolled out (such as smart meters and smart chargers); and (iii) the necessary reforms being adopted (for example, protocol and communication standards being harmonised across assets). In this scenario, 90% of EVs could offer flexibility to the market by 2034.
3.3.4. ELECTRIFICATION OF HEATING IN BUILDINGS
This section outlines the assumed number of heat pumps in the residential and tertiary sectors. The trajectories in the CENTRAL scenario are based on the trends and known poli- cies on the matter. The section also provides an overview of the different operating modes of heat pumps and their associated flexibility.
3.3.4.1 The evolution of heat pumps in the residential sector

In Belgium, gas and oil are still the main fuels used for the heating of residential buildings. The heat pump market is still relatively small, but has grown steadily over the past few years, with around 21,000 Air-Water, 6,000 Groundwater and 120,000 Air-Air (reversible) units sold in 2022, based on market data by ATTB, the Belgian association of heating man- ufacturers and importers. The estimated stock of heating appliances in the residential sector of Belgium at the end of 2022 is represented below. It is important to note that these numbers also contain air conditioning units that are reversible (i.e. can be used for cooling and heating).
FIGURE 3-33 — ESTIMATED HEATING STOCK IN THE BELGIAN RESIDENTIAL SECTOR (AT THE END OF 2022)
Note that the amount of heating appliances is larger than the amount of dwellings in Belgium. This is explained by the fact that both primary & secondary heating appliances are counted.
Changes in the number of HPs across Belgium depend on the relative share of heat pumps installed in these new environments. Taking into consideration the aforementioned points, the following assumptions are made:
• Today, fully electric HPs are mostly installed in new buildings. Across Flanders, it is assumed that by 2025 all new buildings will be equipped either with a fully electric HP (96%), or with district heating (4%) due to the phasing out of new gas infrastructure across this region [VLA-1]. For Wallonia and Brussels, no strict obligations are yet in place, and a more moderate uptake is assumed with 100% HP and district heating being reached in 2035 in all new buildings. As
75% of new buildings are constructed in Flanders, its policies are the key driver for electrification in this segment.
• For renovations and end-of-life boiler replacements not a single region has put in place a strict ban on the use of fossil gas. Therefore, the replacement rate of old heating systems with HPs is assumed to increase at a modest rate to reach 23% and 35% by 2030 and 2035 respectively in buildings which have been renovated; and 20% and 27% in 2030 and 2035 respectively as end-of-life boiler replacements.
The resulting final stock of HPs is presented in Figure 3-34, with HPs accounting for 19% and 27% of all residential heating appliances in 2030 and 2035 respectively.
*Based on VEKA, EHPA, EurObserv’ER, Statisa, ATTB FRIXIS, DELTA-EE
Air-to-Air HPs are the most widely installed type of heat pump across Belgium today, which can be explained by their low investment cost, ease to install (especially after a retrofit) and, if they are reversible, the fact that they can also be used for cooling purposes. Indeed, ATTB and the Royal Belgian Association for Refrigeration and Air Treatment (FRIXIS) have confirmed that these units are predominantly used for their cooling functionalities and, with regard to heating, are used to a rather limited extent as backup heaters and/or are often used to supply heat to a specific area within a dwelling. For the purposes of this study, 20% of these units are assumed to be used as a residence’s main heating source (category HP Air-Air – primary), whereas the remaining 80% is assumed to be used as secondary heating sources (category HP Air-Air –secondary), and therefore carry a lower associated yearly and peak demand as they function in combination with another heater. Hydronic HPs (Air-water and Ground-water) are today less widely used, however these units are more commonly found in new buildings and buildings which have been renovated.
Assumptions regarding the future evolution of the number of HPs in the run-up to 2035 depend on the number of new buildings, renovated buildings and old heating systems being replaced, since each of these are considered to be opportunities for HPs to be used. The following assumptions are therefore made in this study:
• the yearly number of new dwellings is assumed to remain constant until 2035, with 55,000 dwellings being added each year, which corresponds to the average taken of the last five years (2018 to 2022) [STA-1];
• the building renovation rate is assumed to increase from around 0.7% today [STA-1] to 1.2% in 2035;
• regarding existing boilers, 5% of the stock is assumed to be replaced on an annual basis, which represents an asset lifetime of around 20 years.
3.3.4.2. The spread of heat pumps in the tertiary sector
The stock of installed HPs for primary heating purposes in the tertiary sector remained rather limited until 2021. Similar to the residential sector, their number was primarily comprised of Air-Air (reversible) units, with 80% of these categorised as secondary heating units.
Assumptions related to the evolutions in the number of heat pumps in the run-up to 2035:
• the number of new buildings constructed is assumed to remain constant until 2035, with 5,800 units being added each year, in line with the average taken over the last five years (2018 to 2022) [STA-1];
• the renovation rate is assumed to increase from around 0.7% [STA-1] to 1.2% in 2035 – which is similar to the rate assumed for the residential sector;

• regarding existing oil and gas boilers, it is assumed that 5% of these are replaced on a yearly basis, which represents an asset lifetime of around 20 years.

Compared with the residential sector, a slightly faster rate of electrification is assumed, with fossil fuels being completely phased out in new buildings by 2030 across all regions (by 2025 for Flanders, similar to the residential sector [ODE-1]). Additionally, it is assumed that by 2030, all heating systems in renovated buildings are replaced by a HP, whereas for end-of-life heating systems (without renovation) the share of HPs is assumed to be 25% (in 2030) and 30% (in 2035). The resulting stock of HPs in the CENTRAL scenario is depicted in Figure 3-35, with HPs making up 19% and 31% of all heating appliances in 2030 and 2035 respectively.
3.3.4.3. Sensitivities regarding the amount of heat pumps
The uptake of HPs depends on a set of uncertainties including the number of new buildings, renovation rates, the investment and running costs of HPs compared with alternatives, and the effect of potential future policies which might ban the installation of fossil-fuel based boilers in the future (recent examples of policies favouring HPs were taken in Germany, the Netherlands...). To grasp this uncertainty, two additional sensitivities are considered resulting in a ‘low’ and ‘high’ trajectory for the uptake of HPs.
In the high trajectory, a larger number of new buildings and renovations are assumed compared to the CENTRAL scenario. Additionally, HPs are assumed to occupy a larger relative share in appliances used to replace boilers following renovations and at end-of-life, anticipating more stringent measures such as the complete phase-out of the sales of fossil fuel boilers which could be in place in the future. The opposite assumptions apply for the ‘low’ scenario, in which a reduced amount (compared to the historical average) of new buildings and a more business-as-usual rate of renovations is assumed, with a lower relative share of HPs compared to the CENTRAL scenario, taking into account the uncertainty around consumer willingness to invest in these devices. More details on these trajectories can be found in scenario Appendix (Electricity consumption in Belgium).
3.3.4.4. Annual electricity demand of heat pumps
The annual heating demand associated with HPs depends on the primary heating needs of the building in which the appliance has been installed and the assumed coefficient of performance (COP) across the year.
The annual heating demand is derived from data shared by Fluvius, which is linked to metering data belonging to more than 2 million residential consumers. The data from Fluvius is clustered per EPC [EPC-1] category, with an average heating demand for each. Within this study, it is assumed that HPs are installed in new and (sufficiently) renovated buildings, such that new buildings are associated with the average annual heating demand associated with dwellings that fall within the EPC A category, and renovated buildings are associated with the annual heating demand associated with the EPC C category. Tertiary buildings are much more diverse and can include anything from small shops to large offices, with varying surfaces and hence demands. For simplicity, these are considered as an aggregate; the annual heating demand for these is based on data from EUROSTAT, where the total space heating demand is divided by the number of tertiary buildings in Belgium [EUS-1]. For a renovated and new building a 25%, respectively 50% lower heating demand is assumed.
TABLE 3-3 — HEATING REQUIREMENTS PER BUILDING TYPE
As can be seen above, the increase in total annual demand for HPs remains relatively limited. However, in the context of adequacy, it is important to note that due to their high thermosensitivity, HP load is concentrated in the (colder) winter months of the year. Figure 3-38 illustrates the distribution of average daily HP consumption for the year 2030 under the CENTRAL scenario (using the 200 climate year projections). The seasonal variation with a higher load during winter months can be clearly observed.
Figure 3-37 shows the assumed evolution in annual electricity demand for HPs in the residential and tertiary sectors. The values have been normalised using the climate conditions of 1990-2020, meaning that actual consumption in the simulations using the 200 forward-looking climate years slightly differs.
Figure 3-39 shows the assumed evolution in average daily HP load (the line in Figure 3-38), with each line depicting the average across the 200 climate years for each simulated target year. Note that these values are not the same as the hourly peak load from HPs, as the HP demand can experience (large) intra-day variations. The final hourly peak depends on the assumed flexibility regarding how the HP would be operated. The assumptions regarding these assumed operating modes are explained in the next section (3.3.4.5). The full methodology used for the creation of hourly demand profiles for heat pumps can be found in the methodological Appendix E.
3.3.4.5. Flexibility assumed in heat pump load
Just like EVs, it is assumed that HPs will be operated in different ways. To model this, different operating modes have been defined, as displayed in Table 3-4. Each mode is modelled differently in this study. A distinction is made between in-the-market (HP1M), which is dispatched by the model, and out-of-market (HP1H), which corresponds to pre-defined time-series, as previously stated in Section 3.3.1 i The HP modelling methodology is described in more detail in Appendix E.
TABLE 3-4 — SUMMARY OF THE DIFFERENT OPERATING MODES OF HPS
HP0 Natural profile
Heat Pumps (HP) -
Space Heating
HP1H Pre-heated profile
HP1M Smart heating
Flexibility under the CENTRAL scenario
Heat when homes are occupied to the setpoint (21°C). The profile demonstrates a morning and evening peak
Reduce the morning and evening peak via pre-heating of homes, respecting a tolerance of +-2°C around the setpoint
Answer daily needs when it suits the market best, while respecting comfort constraint (+-2°C around the setpoint).
The various operating modes will enter the market in varying proportions, as shown in Figure 3-40. These proportions in the CENTRAL scenario were developed by DELTA-EE. Their work on residential and tertiary flexibility is briefly described in BOX 3-4, and all details can be found in scenario Appendix III
The figure below shows that the flexible operation of HPs is assumed to be widely adopted. DELTA-EE assumed that new HPs penetrating the market would be made smart and that the amount of costly retrofitting would remain limited.
This results in 36% of HPs being operated with a natural profile (HP0, in grey in Figure 3-40) in 2035, corresponding to
Pre-defined time series
Pre-defined time series
Dispatched by the model following energy and power constraints roughly 500,000 HPs. The share of HPs made flexible based on a local signal (HP1H) is seen to grow in the run-up to 2035, which is linked to the increasing penetration of smart meters and smart thermostats.

The forecasted uptake of HPs for the provision of flexibility, driven by market signals, is expected to be slower. This is due to the increased complexity of the offering for customers, along with the need for smarter appliances that go beyond smart thermostats, as well as the harmonisation of communication protocols between appliances, energy users and providers or system operators.
Average hourly consumption profile HP consumption is estimated for each day starting from an assumed yearly consumption of each type of HPs, and taking into account the temperature of each day and the COP (Coefficient of Performance) of each type of HP. This estimated daily consumption is then split through the day following an intra-day profile. The latter defines for each hour of the day the energy consumed by the asset. The intra-day profiles are different for each operating modes. For the interested reader, the full description of the HP modelling is available in Appendix E. It describes the different, and how the energy and power constraints of the in-the-market HPs are determined.
The so-called ‘intra-day profiles’ are depicted on the figures of this section. Those are representing the hourly share of the daily energy need.
The load profile that is obtained is a blend of the load profiles for all operating modes, with the specific proportions specified in Figure 3-40. This figure is split in three parts:
STAGE 1: the intra-day profiles of all operating modes (HP0, HP1H, HP1M) are represented at the top of the figure. From left to right, the profiles graphs show the natural profile (HP0), the out-of-market profile (HP1H) and the in-the-market profiles (HP1M). These profiles show how the energy demand is answered through the day. For example, the energy demand of all HPs following HP0 operation mode will show a peak at 7 AM and 5 PM, as 6% of the daily heating energy demand is expected during each of those hours.
For the natural load profile (HP0) and out-of-market (HP1H) operating modes, the time series that are predetermined do not change across the studied years nor within a given year. However, for the in-the-market operating mode (HP1M), heating can fluctuate on a daily basis as per the model dispatch. Hence, any fixed profile of the HP charging should be considered with caution.
STAGE 2: the HP fleet is split among these operation modes in different proportion in the CENTRAL scenario through the years. For example, the proportion of HP0 decreases through the year, representing 92% of the HP fleet in 2023 and 36% by 2034.
STAGE 3: the profiles of the different operation modes in STAGE 1 are combined in the proportions shown in STAGE 2 to obtain an equivalent load profile for each year simulated. Note that the profile depicted at the bottom of the figure corresponds to a winter profile. The behavior in summer is different as shown in the next section (as there are no heating needs in summer).
The evolution throughout the years of the average profile in winter is depicted in Figure 3-41. Several trends can be noted in the latter, as follows:
• The growing penetration of HP1H leads to more ‘pre-heating’, showing that the evening peak moves to earlier in the day, and more load moves to midday to integrate solar production.
• With the increased penetration of HP1M in the market, providing more flexibility in the evening, the peak load in the evening significantly reduces around 6 PM.
FIGURE 3-41 — EVOLUTION OF THE AVERAGE INTRA-DAY PROFILE FOR HP ENERGY DEMAND OVER THE PERIOD 2024 TO 2034, ON A WINTER DAY
In-the-market dispatch
DISCLAIMER: the dispatch of the HP1M varies for every hour and is an output of the simulations. Only the average winter dispatch is shown for illustrative purposes. Out-of-market: pre-defined time-series In-the-market: dispatched by the model
Natural profile (HP0) Pre-heated profile (HP1H) Smart heating (HP1M)
STAGE 1: Profiles of all operation modes STAGE 2: Shares of operation modes for each year STAGE 3: Resulting average load profile (in winter)
In 2034, 16% of HPs are expected to be operated flexibly by the market, while ensuring comfort for consumers. This represents a fair share of the load, especially in winter. Figure 3-421 depicts the dispatch across the years in winter for HP1M. For the sake of comparison, as the number of flexible HPs increases over the years, each profile is presented as a percentage of the average load. Each graph includes (i) the average dispatch across all climate years and (ii) the range between the 10th percentile and 90th percentile of values across all climate years, showing the variability in the dispatch. The upward and downward boundaries for the operation of HPs are not depicted, as these change every day based on the outside temperature, to ensure consumer comfort.
The figures demonstrate that:
• across the years, the dispatch does not change drastically; as the dispatch of heat pumps is more constrained in the model, the margin to operate is limited, converging quickly even if the energy system changes across the years;

• as HPs consume energy mainly in winter, this is the time during which flexibility is available;
• the general trend is that HPs pre-heat as much as possible during the day in order to reduce the load in the evening. The average curve is relatively flat.
3.3.4.6. Sensitivities related to assumed flexibility provided by heat pumps
The share of HPs being operated flexibly depends on many uncertain developments, mainly: (i) the uptake of energy home management systems, smart thermostats or HPs made smart; (ii) the penetration of smart meters; (iii) market reforms; and (iv) consumer adoption of HPs.
Elia carries out sensitivities regarding the latter to consider all possible developments. Four sensitivities are performed regarding the flexibility provided by HPs, as outlined below:
• ‘No Flexibility’: if no market initiatives or policies are carried out to incentivise flexibility, HPs will not be operated in a smart way. This a theoretical set-up to understand the impact on adequacy results only.
• ‘Low Flexibility’: this scenario represents a situation in which today’s policies remain as they are. The pace of penetration of smart meters remains insufficient and the lack of market reforms and clear price signals hinders the develop- ment of explicit flexibility offered by end consumers. However, assets can be locally optimised. In 2034, roughly 50% of the HP fleet will follow natural charging patterns and 50% will be operated within comfort constraints set by the consumer.
• ‘High Flexibility’: if the required policies and changes are implemented, all HPs could be made flexible. This will involve (i) a full rollout of an adequate market mechanism allowing behind-the-meter devices to be optimised by market signals; (ii) the required infrastructure being delivered (i.e. smart thermostats, smart meters or HPs made smart); and (iii) the necessary reforms being adopted (for example, protocol and communication standards being harmonised across assets). In this case, the majority of HPs offer explicit flexibility to the market.
These sensitivities are summarised in Figure 3-43, with the CENTRAL scenario shown as a reference.
3.3.5. ELECTRIFICATION OF INDUSTRY, ELECTROLYSERS AND DATA CENTRES
The assumptions regarding additional electricity consumption from industry due to fuel switching of existing industries, carbon capture and storage (CCS) and the introduction of new data centres are based on the collected data and exchanges with customers conducted during the study published by Elia Group in November 2022 [ELI-4]. The findings of these interactions indicate a significant shift towards elec- trification, as reflected in the CENTRAL scenario. However, when it comes to adequacy, the impact is somewhat mitigated due to the assumptions made regarding flexibility of those new loads during periods of scarcity. Specifically, it is assumed in the CENTRAL scenario that approximately 75% of those new electrical loads can be curtailed during hours of scarcity.
3.3.5.1. Annual industrial electricity demand (existing and new)
The estimation of the total industrial electricity demand depends on three key drivers, as outlined below.
• Changes in the existing electricity demand: this concerns the existing electrical demand of industrial processes today, which is assumed to fluctuate in accordance with macroeconomic drivers (see Section 3.3.2) and energy efficiency.
• Additional electricity demand due to fuel switching: this relates to additional electricity demand linked to existing industrial processes being electrified; for example, replacing gas boilers with e-boilers for the production of steam in the chemical sector or the utilisation of industrial heat pumps.
• Additional electricity demand due to new usages: this mainly concerns the additional electricity demand linked to the introduction of data centres, the additional electricity needs for CCS processes and electrolysis for the creation of hydrogen and e-fuels.
As illustrated in Figure 3-44, industrial energy demand is currently mainly met by fossil fuels. One of the key tools for decarbonizing this sector includes the electrification of fossil-based processes (mainly the supply of process heat and steam). If this is carried out successfully, the total industrial demand and CO2 emissions will decrease at the same time as the demand for electricity increases.
No permanent closures or relocations of major industrial consumers are considered in Belgium, since no industries have definitively been closed due to high electricity prices in Belgium to date (note that some companies have temporarily reduced or stopped their production processes). Moreover, the European Commission recently presented its Net Zero Industry Act (NZIA) [EUC-6], which includes goals and measures aimed at increasing investment in and the production of technologies and products that are key for the green transition, as well as ensuring the EU’s security of supply and strategic autonomy in key sectors. Therefore, in the CENTRAL scenario, an implicit assumption is that no industrial players relocate – but they do react to high energy prices by increasing energy savings and even undertaking fuel switching. As explained in Section 3.3.2, changes in the existing uses of electricity in these sectors are assumed to evolve alongside macroeconomic growth and energy efficiency [ELI-6].
The assumptions regarding industrial fuel switching and demand from new uses in the CENTRAL scenario are derived from the Elia Group viewpoint focused on industry, logistics and data centres [ELI-4]. This study includes quantified trajectories for industrial demand in the lead-up to 2050 as well as intermediate values for 2030 & 2040. The values for 2030 are based on observed requests from Elia-connected clients and in-depth interviews of different industrial companies, sectoral organisations and researchers. Since the study focused on the target years 2030, 2040 and 2050, this study includes an intermediate trajectory for the yearly changes from 2023-2035, which was carried out by taking known commissioning dates into account (both those which have been publicly announced and those communicated to Elia).
The assumed evolution is presented in Figure 3-45. In general, electricity demand is seen to increase, particularly in the sectors outlined below:
• The chemical sector: consisting of the stepwise production of feedstock, high-value chemicals and final products. There is potential in this sector for the electrification of heat to occur. The energy demand and therefore electrification potential in this sector is mainly driven by a small amount of large industrial players. Power-to-heat installations, both for the provision of low-temperature heat (industrial HPs) and medium- to high-temperature heat and the production of steam (e-boilers) are assumed to be rolled out. It is also assumed that CCS technologies will start to be implemented for chemical crackers. Some new facilities have announced that they will begin electrifying their heat sources within the simulated timeframe. Note that within this study, more extreme electrification, such as the installation of electric crackers, is not taken into account.
• The steel sector: today, steel is still produced in very CO2intensive blast furnaces that use coal as an input. Electrification in this sector is mainly driven by a large-scale direct reduced iron (DRI) – electric arc furnace (EAF) project in Ghent, which carries a significantly higher electricity intensity than traditional blast furnaces [ARC-1]. For the remaining blast furnaces in this sector, it is assumed that the first CCS projects will be implemented.
• The food & drink sector: this is a relatively decentralised sector which carries great potential in terms of electrification due to its processes, which require relatively low- to medium-temperature heat. Power-to-heat technologies such as industrial HPs, electric boilers and electric ovens are expected to increase in the period covered by this study.
• The cement sector: the main share of emissions in this process is inherent to the cement making process itself, mainly linked to calcination. Therefore, the main tool for reducing emissions in this highly CO2-intensive sector lies in the application of CCS; with some of those projects having been announced by the sector.
• The refinery sector: just like the cement industry, this is a highly CO2-intensive sector where the refining process has inherent CO2 emissions that are linked to distillation. As such, the only way to make this process carbon-neutral is through the application of CCS; with some of those projects due to occur in the simulated time period.
• Other sectors: other sectors mainly include paper, non-metallic minerals, construction, agriculture… In these sectors, electrification is focused on power-to-heat technologies for the electrification of low- to medium-temperature heat, but, to a lesser extent, is also focused on the electrification of mechanical processes (moving from inefficient fossil-based processes to electric drivetrains).
• Data centres: In recent years, data centres have become significant electricity consumers in Belgium. Some key players have communicated their willingness to expand data centre operations in Belgium.
• Electrolysers: the additional electricity needed for the electrolysis of water for the production of hydrogen is also expected to rise in importance in order to reach the EU’s green hydrogen production and consumption targets. However, the installed capacity of electrolysers and their associated electricity demand are expected to remain relatively limited in Belgium. In October 2022, the FPS Economy published an update of its “Vision and strategy – Hydrogen” document [FPS-3]. From this document it becomes clear that the focus for Belgium lies on the import of hydrogen and includes the objective of reaching 150 MW of installed capacity by 2026. Regarding long-term changes, the trajectory is based on an average scenario coming from the Task Force scenarios [ELI-12], which were performed in January 2022. This leads to the following assumption for the present study: a capacity of 150 MW by 2026 447 MW by 2030 and 743 MW by 2034 More information regarding the operation of electrolysers can be found in Chapter 7, which outlines the study’s results.
To correctly assess the impact of industrial electrification on the electricity system, it is essential to understand the demand per sector and to take detailed assumptions regarding the reason behind the increase, as each category holds a different associated flexibility potential. Figure 3-45 illustrates the evolution of industrial electricity demand.
As can be seen from the figures, existing uses of electricity are assumed to remain relatively stable. Several factors come into play here, as outlined below:
• Macroeconomic growth projections are based on the Federal Planning Bureau 2022 projections [FPB-2]. The macroeconomic projections are applied per sector by Climact;
• As explained in the Adequacy Working Group on 25/08/22 [ELI-6], the pharmaceutical sector significantly contributes to the added value growth. However, the electricity consumption remains historically marginal compared to other chemical industries (2% of electricity consumption). Therefore, in order to account for this in the electricity demand growth for other industries, the overall growth in electricity consumption is considered negligible;
• On top of this, energy efficiency measures are considered, compensating for increases linked to the assumed economic growth (see Section 3.3.2).
For the period 2023-2025, a decrease in industrial electricity demand is assumed due to the prolonged effect of high energy prices. The increase in the run-up to 2034 is mainly explained by the uptake of power-to-heat devices (industrial HPs, electric boilers) in the chemical and food and drink sectors; CCS technologies in the steel, refinery, and cement sector; and DRI-EAF steelmaking and data centre computing.
3.3.5.2. Flexibility assumed in newly electrified industry, data centres and electrolysers
Flexibility linked to the existing usage of electricity (including industrial loads) is covered by the existing market response and associated potential, as explained in Section 3.2.2.
For new forms of industrial electrification, this additional load is superimposed onto existing load profiles, as they are expected to have distinct structural characteristics compared to current industrial demands. In practice, these new forms of electricity demand are assumed to power underlying baseload industrial processes. The final related load profile depends largely on the origin of the type of demand and the flexibility assumed. In general, new industrial demand can be split into 6 categories, as follows:
Power to heat – heat pumps: covering additional electricity demand due to fuel switching, generally from gas to electricity, and involving processes which require limited heat temperatures (e.g. 200°C). Their uptake is mostly expected in the food and drink, chemical, and paper industry. These systems can be installed in combination with (existing) fossil fuel based systems. This allows a hybrid running mode, which allows electricity to be used when prices are low and vice versa. Due to their high efficiency, these units typically have a high amount of running hours. When coupled with a gas backup, the strike price is computed as: in high-temperature processes in the food and drink sector. Just like HPs, these systems can be installed in combination with (existing) fossil fuel based systems. This allows a hybrid running mode, which allows electricity to be used when prices are low and vice versa. Since their efficiency is equivalent to that of traditional gas boilers, these units will have a lower amount of running hours than industrial HPs, typically being activated when units with low marginal cost set the price. When coupled with a gas backup, the strike price is computed as:
Heat pump eff Gas boiler eff (gas price+CO2 price).
Eletric boiler eff Gas boiler eff (gas price+CO2 price).
Direct reduction Iron – electric arc furnace (DRI-EAF): this is a technology used for primary steelmaking by first reducing iron ore with gas (potentially hydrogen), after which it is finally treated using EAF. EAFs in particular consume a lot of electricity. However, since EAFs operate on a batch basis, it is estimated that due to the build-out of some excess capacity, there is potential for load shifting within a given timeframe which would still allow production targets to be met. In practice, it is therefore assumed that (part of) this load can be shifted within a weekly timeframe, optimised based on electricity prices across the week.
Power to heat – e-boilers: covering additional electricity demand due to fuel switching, generally from gas to electricity, and involving processes which require heat temperatures to be above 200°C (typically steam). Here, the uptake is expected in the chemical industry and
Carbon Capture and Storage (CCS): different options exist to capture the CO2 generated by industrial processes; however, all of these require additional amounts of electricity. This technology is expected to take off in refineries and the chemical, cement and steel sectors. Theoretically, it could be possible to deliver some flexibility through CCS, either by storing the solvent and only heating it when the market prices are low or by making a valve where you can choose to run the waste gas through the CCS system based on market prices. However, due to the high CAPEX costs and additional complexity of these options, the potential for these processes to be made flexible is estimated to be low. When flexibility is assumed, it is assumed that (part of the) load will be shed when the price of electricity rises.
Data centres: the number of data centres is expected to gradually increase in the near term. These typically have baseload electricity requirements and are associated with high costs in case they fail and/or black out. Hence, even though some of these units have back-up generators, their flexibility potential is considered to be low. When flexibility is considered, it is assumed that (part of the) load will be shed when electricity price is above a certain treshold and back-up generators are activated.
Electrolysis: this involves additional electricity demand due to the synthesis of hydrogen and e-fuels from H2O electrolysis. It is assumed that electrolysers can provide great flexibility and optimise their running hours based on favourable market prices. This rationale is also supported by the latest existing European legislation regarding a.o. geographical and temporal constraints for the definition of renewable hydrogen [EUP-2]. In practice, this means that electrolysers are assumed not to run during moments of scarcity, but produce when the marginal price within the market node drops below a certain threshold.
Other: this category includes the increase of electricity demand which cannot be categorised under the previous categories and which are assumed to be inflexible processes.
Industry flex sensitivities
The flexibility delivered by these processes depends on the willingness and economic and technical capabilities of industry to deliver such services. As such, a high and low sensitivity is assumed to capture this uncertainty. It is important to note that the CENTRAL scenario assumes that the majority of the new electrified processes will be flexible during scarcity situations.
TABLE 3-5
The assumed evolution of newly electrified industrial demand in the CENTRAL scenario is shown in Figure 3-45. A large share of these new industrial processes is assumed to be inherently flexible. Indeed, the increase in the theoretical industrial demand which assumes no flexibility (depicted by the continuous black line) is significantly higher than the net load increase at times of (near-)scarcity (depicted by the dotted black line) due to the mitigation effect that would be caused by the activation of flexibility. For example, in 2030, this implies that the theoretical additional demand of just over 2,700 MW (in cases when all those processes are assumed to be running continuously) is largely mitigated by flexibility, such that the net increase in load actually lies in the order of 800 MW.
Industry load sensitivities
The first sensitivities on the additional industrial demand considered in the CENTRAL scenario are detailed on Table 3-5. And are related to the flexible operation of newly electrified industrial processes. Indeed, the amount of flexible capacity during scarcity hours has a direct impact on the adequacy requirements.
The assumptions in the CENTRAL scenario regarding new industrial electrification are based on observed requests from clients connected to Elia’s grid and in-depth consulta- tions with different industrial companies, sectoral organisations and researchers to quantify the expected extent of electrification in more decentralised sectors. However, the exact timing and volumes to be connected to the grid remain uncertain. Therefore, additional sensitivities are considered (seeFigure 3-47), in which the delay and/or cancellation of several of the electrification projects are taken into account. Similarly, a higher demand is also considered by taking into account an acceleration of certain projects or new projects which are not yet considered in the figures.
3.3.6. SUMMARY AND SENSITIVITIES REGARDING THE LOAD AND FLEXIBILITY
Figure 3-48 shows an overview of the CENTRAL scenario and all sensitivities related to electricity consumption and associated flexibility, as described in the previous sections.
FIGURE 3-48 — OVERVIEW OF THE CENTRAL SCENARIO AND SENSITIVITIES FOR ELECTRICITY CONSUMPTION AND ASSOCIATED FLEXIBILITY
Associated flexibility for adequacy Electricity consumption
Macro-economic projections from June 2022 taking the impact of high electricity prices into account.
Existing DSR (or Market Response) from E-CUBE study with potential new additional volumes if economically viable. High/lower demand due to low/high energy prices
Electric vehicles growth rate based on latest trends and policies

Faster (‘HIGH’) and slower (‘LOW’) uptake of electric vehicles.
Heat-pumps growth rate based on latest trends and policies
Faster (‘HIGH’) and slower (‘LOW’) uptake of heat-pumps.
All additional potential DSR capacity is assumed to be in the market already.
Regarding flexibility of newly electrified loads in the residential and tertiary sectors, Elia carries out sensitivities across all assets together. This includes EVs, HPs and small-scale batteries (the latter are tackled respectively in Section 3.2.3.6, Section 3.3.5.6 and Section 3.4.2.3) but are included in this overview of the flexibility sensitivities for completeness). Three sensitivities are carried out in relation to the CENTRAL scenario, as follows:
• ‘No Flexibility’: this is the least ambitious scenario; it assumes no EVs or HPs will be operated in a smart way in the future. This a theoretical sensitivity to assess the impact on adequacy only;
• ‘Low Flexibility’: this sensitivity assumes that the necessary policy developments relating to unlocking flexibility in residential and tertiary assets will occur at a slow pace, such as the lack of necessary market legal and regulatory reforms enabling the unlocking and valorisation of end consumer flexibility. The pace of penetration of smart meters remains insufficient and the lack of market reforms and clear price signals hinders the development of explicit flexibility from end consumers.
• ‘High Flexibility’: if the required measures are taken, all HPs could be made flexible. This sensitivity involves: (i) a full rollout of an adequate market mechanism (ii); the delivery of the required infrastructure (such as smart meters); and (iii) the adoption of the necessary additional reforms (for example protocol and communication standards being harmonised across assets).
Figure 3-49 shows the three sensitivities studied in relation to the CENTRAL scenario in terms of flexibility on the consumption side and for small-scale (home) batteries.
Fuel switching and new data centres based on Elia Group viewpoint on industry
Faster electrification rate of the industry (‘ACCELERATION) and slower (‘DELAY’) rate.
Shares of out-of-market EV (natural profile or locally optimised) and in-themarket EV (charging and/ or discharging based on market) [DELTA-EE study].
Shares of out-of-market HP (natural profile or locally optimised) and in-themarket HP (optimised by the dispatch) [DELTA-EE study].
From Elia Group viewpoint and exchanges, flexibility assumed per process considered.
Higher (‘HIGH’) and lower (‘LOW’) share of in-themarket EV.(*)
Higher (‘HIGH’) and lower (‘LOW’) share of in-themarket HP.(*)
Higher and lower % of flexible capacity per process considered.
3.3.7. LOAD AND FLEXIBILITY INDICATORS
As explained in previous sections, the electricity demand cannot be grasped separately from its associated flexibility; however, in this section, electricity demand which both includes and excludes the contribution of flexibility is explored. One of the indicators which gives an indication for the adequacy requirements of the power system concerns the hourly peak load, which is defined as the highest hourly electricity demand observed within a year. It is essential to note that the yearly peak load is not the only factor that drives situations of scarcity Indeed, as will be further explained in Chapter 4, many other factors influence a system’s adequacy. In addition, as it will be illustrated, relying on the peak load can lead to wrong conclusions regarding adequacy. Indeed, with the increasing flexibility of the consumption, the peak can be shifted within the day and not coincide with the most critical periods for adequacy (such as moments with low-RES generation).
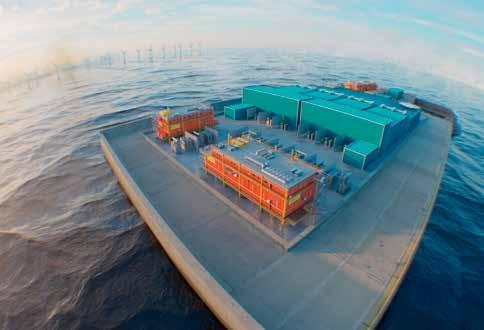
Figure 3-50 shows the average load duration curves for Belgium for the different target years simulated in this study in the CENTRAL scenario. The load duration curve is calculated by sorting all the hourly loads for each climatic year from large to small and calculating the average of all those climatic years. Figure 3-51 shows the impact of demand flexibility on the load duration curve for the year 2034 in the CENTRAL scenario
Figure 3-52 illustrates the evolution in the demand profile of an average winter’s day for Belgium in the CENTRAL scenario. The figure on the left shows the situation in which there is a complete absence of flexibility in the system and all the electricity demand is assumed to follow a so-called ‘natural’ profile. This would mean that EVs, heat pumps, appliances and industrial processes are used regardless of the availability of renewable electricity, wholesale prices and/or the adequacy situation. In this case, the daily load clearly shifts upwards with an even stronger impact on the evening peak load, as those natural behaviours typically coincide with the existing peaks which the system already experiences today. As explained in the previous sections, it is assumed under the CENTRAL scenario that a large part of this additional electrification will come with inherent flexibility. The impact of this flexibility can be clearly seen in the graph on the right, in which the daily load still increases, but the impact on the evening peak demand is clearly less severe.
Figure 3-53 illustrates the profile of an average winter’s day of the year 2034 in the CENTRAL scenario for cases excluding and including flexibility. The impact of flexibility is relatively significant and can be explained by the key drivers outlined below:
1 Additional flexibility allows both the morning and evening peaks in demand to be decreased This is because these hours are generally coupled with a low availability of (residential) solar PV and equally high loads in neighbouring countries with resulting higher wholesale prices, causing consumers to shift their consumption in time or reduce it.
2 Secondly, part of the load (including some from the morning and evening peaks) is shifted to around noon where it coincides with the availability of solar PV. Although this effect is more limited compared to spring and summer, it can be explained by residential consumers consuming the solar power they generate themselves and/or the fact that high PV generation in Belgium, which is likely to coincide with PV generation in its neighbouring countries, results in lower wholesale electricity prices. This, in turn, incentivises industrial and smaller consumers to shift their demand to those hours to avoid being exposed to higher prices.
3 Part of the load is shifted towards the night and early hours of the morning. These are typically off-peak moments that experience lower levels of demand and potentially lower wholesale prices as a consequence, again incentivising consumers to adapt their consumption patterns in line with this.
One final key observation is that the more flexibility is integrated into the system, the more structural changes occur in terms of the hourly demand. In combination with an increase in RES generation, this might even result in more flexibility in the system increasing the yearly peak load due to a combination of loads (EVs, HPs, industrial power-to-heat, electrolysis…) being concentrated on the same moment of excess RES generation. In this case, a higher yearly peak load does not lead to a more challenging situation in terms of adequacy, on the contrary.
3.4. BELGIAN GENERATION AND STORAGE
3.4.1. RENEWABLE ENERGY SOURCES (NON-THERMAL)
In this study, the reference scenario is developed in line with the latest official ambitions. Given that Belgium’s updated National Energy and Climate Plans (NECP) are due to be published in mid-2023, after the assumptions’ freeze of this study, the trajectories for Belgium result from discussions with Belgium’s regions and the latest data reported by DSOs relating to existing capacities.
The following methodology has been applied for elaborating the trajectories in relation to PV and onshore wind capacity in Belgium.
• For each region, a ‘reality check’ of the installed capacity at the end of 2022 is performed, based on the preliminary information available on installed capacities.
• For each region, the trajectory is updated with the latest available information regarding the future evolution:
- For Wallonia, the latest ‘Plan Air Climat Energie’ (PACE) 2030 has been adopted in December 2022 in first reading by the Government of Wallonia and finally adopted in March 2023 [WAL-1].
- The Brussels PACE was put out to consultation in December 2022. The version of this document that is available at the time at which this study is being prepared does not include official targets in terms of capacity or the production of green electricity.
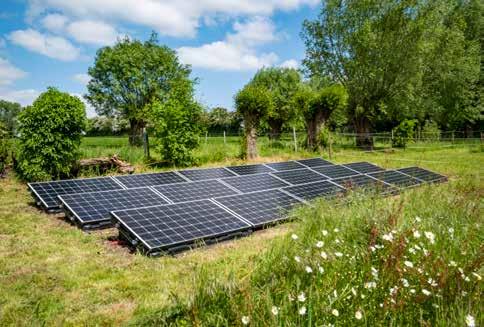
- With regard to Flanders, the updated Vlaamse Energie- en Klimaatplan (VEKP) was not available when freezing the assumptions for the scenarios. Given the lack of official photovoltaic and onshore wind targets for 2030, the latest yearly increases for the end of 2023 targeted by the Flemish region have therefore been used to elaborate future trajectories. The updated plan was finally published in mid-May 2023 with updated targets [VEK-1].
Regarding Belgium’s offshore wind capacity, the CENTRAL scenario is aligned with the latest information from the FPS Economy about the planned dates for the commissioning of the offshore wind farms located in the Princess Elisabeth Zone. This is further detailed in the Section 3.4.1.3.
As highlighted in Section 3.1.4, the penetration of renewables could be accelerated in the future (given data related to the growth rates of PV installations observed over the past two years…) or could also be slowed down due to public resistance or a lack of raw materials/high prices.
Sensitivities linked to the CENTRAL scenario are defined to assess the impact of slower (‘LOW RES’) and faster (‘HIGH RES’) RES development in Belgium. For solar PV and onshore wind, these sensitivities can be seen as ‘unconstrained’ and ‘constrained’ transition scenarios. For offshore generation, a delay in the commissioning of the wind turbines is also considered as well as an higher offshore capacity by 2034.
Note that this section does not include biomass, which is included in the ‘Thermal production fleet’ in Section 3.4.3.
3.4.1.1. Solar PV
The energy crisis and surge in electricity prices have put solar photovoltaics in the spotlight in Europe, including Belgium. In 2022, the demand for new installations rose significantly, resulting in much longer installation times compared to previous years. As illustrated in Figure 3-55, the majority of the installed photovoltaic capacity in Belgium is currently located in Flanders.
The long-term evolution of installed solar photovoltaic capacity in Belgium for this study is created with the following approach:
• Wallonia’s PACE plan includes a target of 5,100 GWh of electricity produced by solar PV in 2030 [WAL-1], which translates to around 400 MWp of additional capacity per year in the run-up to 2030;
• for Flanders, the target of 450 MWp for additional capacity in 2023 is used to derive a potential 2030 value, leading to about 9 GWp by 2030; the VEKP of Flanders, published midMay 2023 (after the assumptions used in the present study were frozen), includes the goal of about 10 GWp (8.9 GWe) by 2030 [VEK-1];
• for Brussels, a yearly increase of 30 MWp is considered, which is slightly higher than the increase observed in 2022 according to Bruegel [BRU-1].
This leads to a yearly increase of around 880 MWp for the whole of Belgium in the lead-up to 2030 with 14.5 GWp installed at the end of that year. This same yearly increase is assumed for the period 2030-2034, leading to 18 GWp by 2034.
In comparison, AdeqFlex’21 was based on the final NECP 2019 for Belgium, in which the WAM scenario target for solar PV was 11 GWp by 2030 [NEC-1].
In terms of the sensitivities, the following assumptions are elaborated (see Figure 3-54):
• ‘HIGH RES’: the annual average capacity increases by 1320 MWp per year (+50% compared with the CENTRAL scenario), reaching 18 GWp of PV capacity by 2030 and 23.3 GWp by 2034;
• ‘LOW RES’: the annual average capacity decreases by 440 MWp per year (-50% compared with the CENTRAL scenario), leading to 11 GWp of PV capacity by 2030 and 12.7 GWp by 2034.
3.4.1.2. Onshore wind
The same approach as that adopted for photovoltaic is applied for determining the trajectory for onshore wind in Belgium.
• Wallonia’s PACE study includes a target of 6,200 GWh of electricity produced by onshore wind in 2030 [WAL-1]. This represents around 180 MW of additional capacity per year in the lead-up to 2030, leading to around 2.7 GW of onshore wind by 2030;
• for Flanders, the target of 150 MW of added capacity per year is used to derive the 2030 value. This leads to around 2.9 GW of onshore wind by 2030. The VEKP of Flanders, published in mid-May 2023 (after the assumptions used in the present study were fixed), includes the goal of 2.64 GW of onshore wind in Flanders by 2030 which is slightly below the assumed 2.9 GW for this study [VEK-1].
This leads to a yearly increase of around 330 MW for the whole of Belgium in the lead-up to 2030, with 5.6 GW installed at the end of that year. This same yearly increase is considered for the period 2030-2034, leading to 6.9 GW by 2034.
By comparison, the AdeqFlex’21 assumptions were based on the final NECP 2019 for Belgium, in which the WAM (scenario target for onshore wind was 4.9 GW by 2030 [NEC-1].
The evolution of onshore wind in Belgium is largely influenced by the availability of land and permits. In this projection, it is assumed that measures will be taken so that the official target set by relevant authorities will be reached. As an example, specific measures have been already taken through its ‘Pax Eolenica’ in Wallonia to ensure the deployment of additional onshore wind [WAL-2].
Regarding the sensitivities, the following assumptions are taken (see Figure 3-56):
• ‘HIGH RES’: the average annual capacity increases to 495 MW per year (+50% compared with the CENTRAL scenario), reaching 6.9 GW of onshore wind capacity by 2030 and 8.9 GW by 2034;
• ‘LOW RES’: the average annual capacity decreases to 165 MW per year (-50% compared with the CENTRAL scenario), leading to 4.3 GW of onshore wind capacity by 2030 and 4.9 GW by 2034.
3.4.1.3. Offshore wind
Belgium is a front-runner in terms of offshore wind development, despite its limited coastline. In 2020, Belgium ranked fourth of the countries with the most offshore wind power in total installed capacity (behind the United Kingdom (1st), Germany (2nd), and China (3rd) and ahead of Denmark and the Netherlands [BOP-1]).
Two zones in the Belgian Exclusive Economic Zones are dedicated to offshore wind (see Figure 3-58).
First zone – Eastern zone
The construction of the first offshore wind farms in this zone started in 2008 and ended in 2020 with the commissioning of the Northwester 2 offshore wind farm. A total capacity of 2,261 MW of offshore wind, linked to 9 different offshore wind farms, is located in this area (which spans 238 km²). Part of this production is connected to the Belgian electricity grid through the Modular Offshore Grid, which was commissioned by Elia in 2019.
Second zone – Princess Elisabeth Zone (PEZ)
In 2021, the Belgian Government decided to further increase its offshore wind capacity by 3.15 to 3.5 GW [FPS-6]. A zone of 285 km² was then designated for this purpose. The Council of Ministers approved the development of offshore grid infrastructure that can transmit 3.5 GW [FPS-6].
In order to connect these new offshore wind farms to its onshore grid, Elia will construct the Princess Elisabeth Island (PEI) in the Princess Elisabeth Zone (PEZ). The former will be the world’s first artificial energy island. The island will serve as an electricity hub that will be connected to offshore wind farms and will act as a landing point for interconnectors with neighbouring countries [ELI-9] such as Great Britain (Nautilus) and Denmark (TritonLink).
The connection of new offshore wind farms located in the North Sea to the onshore grid is directly related to the reinforcement of onshore grid infrastructure (so that it can transport the electricity produced at sea further inland across the country). The two main projects that are therefore needed are the Ventilus [ELI-2] and Boucle du Hainaut [ELI-3] projects.
The completion of the Ventilus project will allow the first wave (700 MW) of offshore wind to be connected to the onshore grid. The additional 2,800 MW of offshore wind will only be connected to the onshore grid once the Boucle du Hainaut project has been completed.
In the longer term, it is also possible that additional offshore capacity might be connected in the Belgian EEZ as the government’s ambition is to reach 8 GW by 2040 (e.g. repowering of the Eastern zone, floating solar panels…). As explained in the latest Federal Development Plan (FDP) published by Elia (see Section 4.2.5. of the FDP), the connection of supplementary wind capacity to the onshore grid is subject to further studies and depends on the formal ambitions of the Belgian Government (in terms of concrete power, location of potential new area(s), type of RES), for which studies are ongoing and which is yet to be decided.
To grasp the uncertainties regarding the permits projects necessary for the development of offshore capacity, a sensitivity with lower offshore capacity is studied, together with a sensitivity with an increased capacity (see Figure 3-59):
• ‘HIGH OFFSHORE’: as a first step towards the increased ambition of 8 GW by 2040, a ‘HIGH OFFSHORE’ sensitivity is performed assuming the entire repowering of the first offshore zone which also assumes an additional 600 MW of offshore capacity by the end of 2034 is analysed; note that, as previously mentioned, the connection of additional wind capacity to the onshore grid is subject to further studies;
• ‘LOW OFFSHORE’: to account for the impact of a potential delay in the planning (due to the slow granting of permits or a delay in the installation and connection of the wind farms), the ‘LOW OFF’ trajectory assumes a delay before the additional 2,800 MW can be connected to the grid, meaning that 2.96 GW in 2030 and 2031 are assumed, instead of 5.76 GW. Another sensitivity, detailed in Section 3.6.5. will assume a delay in the realisation of the ‘Boucle Du Hainaut’ project and considers both the ‘LOW OFF’ sensitivity and a delay in the commissioning of the Nautilus interconnector.
Zeebrugge
Bruges
3.4.1.4. Run-of-river hydroelectricity
Nieuwport
Regarding the projection of offshore wind capacity considered in this study, the following assumptions are made:
• a total capacity of 3.5 GW in the PEZ is considered, leading to a total installed capacity of 5.76 GW by 2030 three phases with three offshore wind capacities commissioned are considered (phase 1: 700 MW; phase 2: 1400 MW; phase 3: 1400 MW).
• the latest plans published by the FPS Economy [FPS-6] in March 2023 are used to derive the following assumptions:
- it is assumed that the full 700 MW of offshore wind (phase 1) will be fully operational by the winter of 2029-30, even though the first few wind turbines from phase 1 might already be commissioned by the end of 2028;
Zomergem
- the additional 2,800 MW of offshore wind (phases 2 and 3) is assumed to be commissioned by the end of 2030 and hence available for winter 2030-31.
• thanks to technological improvements, the wind farms in the PEZ are expected to be more efficient than the older ones installed in the first offshore zone in Belgium; therefore, a higher capacity factor is assumed for the PEZ (more electricity produced for the same amount of capacity installed).
Belgium has limited capacity in terms of run-of-river hydroelectricity. The latter consists of small hydro units (installed along rivers) with the largest of these located on the river Meuse, in Wallonia. According to the Bilan Energétique de Wallonie 2020 [WAL-3], the evolution of the installed capacity in Wallonia has seemed to stagnate since the 1980s.
Wallonia has nevertheless set the ambition of increasing the production in the run-up to 2030 in its PACE. The trajectory assumed in the present study considers a small increase in installed capacity in the future (regular growth), leading to an installed capacity of 150 MW in 2030 and 163 MW in 2034
3.4.2. STORAGE
This section details the assumptions in terms of storage reservoir in Belgium. Three categories are considered:
• pumped-storage reservoir;
• large-scale batteries;
• small-scale batteries (i.e. home batteries).
The storage in vehicles (e.g. vehicle-to-grid technologies) is tackled as part of the consumption flexibility where flexibility in EVs are included (see Section 3.3.3.)
3.4.2.1. Pumped-storage
Pumped-storage units store energy in the form of gravitational potential energy of water. Water is first pumped from one lower reservoir to another higher reservoir. To generate electricity, the water is released from the upper reservoir back down to the lower one. The operating cycles (pumping and turbining) of pumped-storage units are optimised by the hourly economic dispatch model, which determines the ideal moment at which to use the units based on the hourly market price. In order to take into account the limited energy that can be stored, a reservoir volume is associated with each unit together with a round-trip efficiency.
The current pumped-storage installed capacity of 1,224 MW (1080 MW in Coo 1-6 and 144 MW in Plate Taille 1-4) is considered at the end of 2022. A total reservoir volume of 5,913 MWh is considered with Coo (5,213 MWh) and Plate Taille (700 MWh) at the end of 2022. The following evolution is then considered:
• The reservoir volume at Coo is due to be increased by the end of 2023 thanks to extension works (increasing the volume from 5,213 MWh to 5,600 MWh);
• the turbining capacity at Coo is also expected to increase following the installation of new turbines over the coming years (from 1,080 MW to 1,161 MW at the end of 2025) [ENG-1].
This leads to a total installed capacity of 1,305 MW of pumped-storage in Belgium by the end of 2025 along with a total reservoir volume of 6,300 MWh
Pumped-storage units are typically also used to provide ancillary services In order to account for the provision of ‘black start’ services, the total storage capacity available for economic dispatch in this analysis is decreased by 500 MWh A round-trip efficiency of 75% is used for Coo [ENG-2].
Given the ‘limited’ reservoir size of pumped-storage units in Belgium, they usually follow daily cycles: the reservoirs are filled during the night in order to be able to compensate for the peaks in demand that occur during the day. This cycle could change as more PV installations are installed, meaning it could be more beneficial to pump energy during the day (when PV produces the most energy). This is taken into account in the model with the economic optimisation of storage facilities.
3.4.2.2. Large-scale batteries
Large-scale batteries are batteries which are usually directly connected to a DSO or TSO grid. These operate in a similar way to pumped-storage, in the sense that they can produce electricity and store it at opportune moments. They are therefore modelled in a similar way as pumped-storage (storage/production moments are optimised by the economic dispatch model), assuming they are in-the-market.
Batteries are a fast-changing business ‘Feasibility studies’ and ‘connection studies’ are regularly performed by Elia to study new requests from batteries to connect to the Elia grid. The statuses of the large-scale batteries projects are constantly evolving: new projects are on the way, other projects have been delayed or stopped, and some projects have had their battery capacities adapted. Elia has revised its approach for the assumed capacity and volume of large-scale batteries compared with AdeqFlex’21 to account for these information.
Two categories are considered in the present study:
• in service’ capacity;
• additional potential capacity if economically viable (based on the known projects at Elia).
The ‘in service’ capacity is based on the existing capacity at the beginning of 2023 and includes the battery capacity contracted as part of in the CRM Y-4 auction for the 2025-26 delivery period.
On top of the ‘in service’ capacity, additional potential capacity is considered, based on large-scale battery projects known by Elia. These projects are considered in the CENTRAL scenario if they are proven to be economically viable without a support mechanism in place. This is determined via the EVA performed in this study.
The following categories are assumed:
• batteries ‘in service’, based on existing capacity at the beginning of 2023 and including the battery capacity contracted as part of CRM Y-4 auction for the 2025-26 delivery period;
• new batteries ‘in realisation’ (‘in rea’) where 100% of the total capacity of projects being realised are assumed as potential capacity;
•new batteries ‘connection studies’, where 75% of the total capacity of projects which are undergoing an Elia ‘connection study’ are assumed as potential capacity, in order to account for the likelihood of some of these projects not materialising;
• new batteries ‘feasibility studies’, where 25% of the total capacity of projects which are undergoing an Elia ‘feasibility study’ are assumed as potential capacity, in order to account for the likelihood of some of these projects not materialising;
• new batteries ‘extra additional potential’, corresponding to additional potential related to unknown projects that might be there after 2030.
Elia has applied a refined approach for estimating future commissioning dates in order to associate the capacity of ‘connection’ and ‘feasibility’ study projects to specific years. This approach is not only based on commissioning dates (in line with client wishes), but also takes into account the time required for the completion of grid studies and the realisation of grid connections. It should be noted that the dates arrived at are ‘best-case’ dates, meaning that it is assumed that client decisions will be taken within a few months and that the studies and grid connections will then follow soon after. No extra delays are considered.
The capacity assumed per year and per category is illustrated in Figure 3-60, based on the statuses of the projects known at Elia beginning of 2023. A total of 152 MW of ‘in service’ largescale batteries is assumed at the end of 2023, with three large projects (of 50 MW, 25 MW and 25 MW) that were commissioned at the end of 2022 and beginning of 2023. Note that the batteries which are ‘in realisation’ phase at the end of 2024 are capacities that have been contracted as part of the CRM Y-4 auction for the 2025-26 delivery period and are therefore considered as ‘in service’ at the end of 2025.
Regarding the assumed energy content Elia has also reviewed its approach following feedback received during the public consultation. Instead of considering a fixed ratio of 2-hour and 4-hour batteries throughout the studied time horizon, a moving ratio is considered based on the following assumptions:
• for the ‘in service’ capacity, a mix of 2-hour and 4-hour batteries is considered based on available information:
- considering BloombergNEF’s information regarding Belgian batteries (batteries in service or with secure financing in place), it is assumed that 51 MW of ‘in service’ capacity is of 4 hours and 74 MW is of 2 hours.
- it is assumed that the other smaller existing batteries not mentioned in BloombergNEF’s database are of 2 hours (corresponding to 27 MW), since they comprise a lot smallsize batteries;
• for the other categories the EVA considered investments in 1h, 2h and 4 hours content. When assessing the impact of additional batteries on adequacy in the sensitivities, the 4 hours content was assumed;
This approach leads to:
• 406 MWh of ‘in service’ volume at the end of 2023 and 1105 MWh for the same category at the end of 2025;
• 11776 MWh of additional potential battery volume at the end of 2034 if economically viable.
A forced outage rate of 2% is assumed for large-scale batteries (see Section 3.4.4 on the outages for more information). A round-trip efficiency of 85% is also considered.
Capacity assumed at the end of the mentioned year. Batteries 'extra additional potential' Batteries in ‘feasibility studies’ (25%) Potential new capacity in ‘connection studies’ (75%)
‘in rea’ (100%)
‘in service’
3.4.2.3. Small-scale batteries
Small-scale batteries are batteries which are usually connected to people’s homes, and are also called ‘residential’ or ‘home batteries’. Since 2019, subsidies for home batteries have been in place in Flanders, leading to a marked increase in the number of small-scale batteries in Belgium; in July 2022, around 185 MW of home batteries were estimated to exist in Flanders [FLU-1].
Figure 3-61 shows the evolution in capacity assumed in Belgium for the CENTRAL scenario, considering that:
• the subsidy in Flanders has stopped in March 2023. Therefore, it is assumed that the number of home batteries in Flanders continues to increase as they did throughout 2020/2021 until March 2023, followed by a slower growth rate after that. No other incentive is assumed;
• the installation of home batteries is mainly driven by the installation of solar panels. For later years, it is assumed that an additional capacity equivalent to 0.2% of the existing PV capacity in MW is installed.
Note that this projection assumes the use of batteries of 4.5 kW on average which last for an average of 2 hours (9 kWh). This leads to a volume of 1023 MWh at the end of 2030 and 1290 MWh at the end of 2034
While small-scale batteries used to be considered as ‘behindthe-meter’ and therefore ‘out-of-market’, two categories are considered in the present study:
• local optimisation with the battery being ‘out-of-market’ (also referred as ‘B2H’ for home);
• market dispatch with the battery being ‘in-the-market’ (also referred as ‘B2M’ for market).
The way these two categories are modelled is explained in Appendix F. Figure 3-61 shows the assumed installed capacity together with the assumed share of ‘in-the-market’ and
‘out-of-market’ shares in the CENTRAL scenario. From 2030 onwards, all small-scale batteries are assumed to react to market prices in the CENTRAL scenario.
FIGURE 3-61 — ASSUMED EVOLUTION OF THE SMALL-SCALE BATTERIES IN BELGIUM IN THE CENTRAL SCENARIO
3.4.3. THERMAL PRODUCTION FLEET
The CENTRAL scenario considers the following assumptions in terms of thermal production in Belgium:
• all existing capacities are available for the entire horizon, unless a closure has been officially announced (based on legal documents published by capacity holders, either article 4bis notifications [FPS-4] or data published through REMIT [REM-1]);
• new capacity with a contract as part of the framework of the Capacity Remuneration Mechanism (new gas thermal plants in Seraing and Flémalle for the 2025-26 delivery year with a 15-year contract);
• new small thermal capacity (CHP and biomass) is considered based on the project maturity and commissioning dates made available to Elia from DSOs;
• nuclear extension – long-term operation (LTO) – of Doel 4 and Tihange 3 as of winter 2026-27 and available for the rest of the horizon assessed in this study.
Regarding the commissioning/decommissioning of thermal plants, the exact expected dates are considered in the simulations. Therefore, if the closure is expected to happen within a simulated year, the exact date is considered in the models. In addition to these capacities, several types of new capacities will be considered in the economic viability assessment. The assessment will consider existing units (by checking their economic viability) as well as new capacities (by checking whether they would be economically viable ‘in-the-market’). The types of new capacity are further detailed in Section 3.4.6
The following sections provide more information about the different thermal generation types: nuclear, gas-fired units, turbojets, combined heat & power, biomass, and waste. An overview of the assumed thermal capacity is provided in Figure 3-63.
Sensitivities related to small-scale batteries
The share of batteries ‘in-the-market’ depends on many factors and so is subject to uncertainties. A detail overview of the barriers is also provided in BOX 3-4. As such, sensitivities are carried out in the present study to give the most complete view of the matter. Two sensitivities are carried out around the CENTRAL scenario (see Figure 3-62):
• ‘Low Flexibility’: no small-scale batteries are assumed to be operated based on a market signal. This means that all home batteries are dispatched based on daily solar panel production to net the household load (as explained in Appendix F), and this for the whole simulated period;
• ‘High Flexibility’: this sensitivity is more ambitious regarding the amount of small-scale batteries operated by the market, leading to 100% of home batteries to be dispatched by a market signal as of 2027 onwards.
Note that a third ‘flexibility’ sensitivity is described in sections 3.2.3.6 and 3.3.5.6 for EVs and HPs respectively: the ‘No Flexibility’ sensitivity. In the case of small-scale batteries, the assumptions are the same as for the ‘Low Flexibility’ scenario.
3.4.3.1. Nuclear
The CENTRAL scenario considers the phase-out of nuclear power in accordance with the law introduced in 2003, which was amended in 2013 and 2015 to cover the operational lifetime extension of Tihange 1 and Doel 1 and 2 [LAW-3]. In addition, the CENTRAL scenario also considers the lifetime extension (also referred to later as long-term operation – LTO) of Doel 4 and Tihange 3, as approved in a preliminary legislative proposal introduced by the government on 1 April 2022 [LAW-4]. This results in the following assumptions for Belgian nuclear units in the CENTRAL scenario (also on Figure 3-64):
• the closure of all reactors by 2025 (Doel 3 and Tihange 2 having already closed in October 2022 and February 2023 respectively) and the reopening of Doel 4 and Tihange 3 after lifetime extension works, as follows:
- Doel 1 closure on 15 February 2025;
- Doel 2 closure on 1 December 2025;
- Doel 4 closure on 1 July 2025 and assumed reopening on 1 November 2026 (LTO);
- Tihange 1 closure on 1 October 2025;
- Tihange 3 closure on 1 September 2025 and assumed reopening on 1 November 2026 (LTO).
• the reopening dates for Doel 4 and Tihange 3 are based on assumptions retained by the government in the context of its negotiations with the nuclear operator, following the agreement of 9 January 2023 relating to a Heads of Terms between the Belgian State and Engie. Through this agreement, both parties confirmed their commitment to make their best efforts to restart the Doel 4 and Tihange 3 nuclear units in November 2026.
FIGURE 3-64 — ASSUMED EVOLUTION OF THE INSTALLED NUCLEAR CAPACITY IN BELGIUM
BOX 3-7 — HISTORICAL NUCLEAR AVAILABILITY IN BELGIUM
Over the last decade, as shown in Figure 3-65, nuclear power reactors in Belgium were rarely available at the same time (offering up to 5,900 MW). At some points (e.g. in 2014, 2015 and 2018), less than half of the entire fleet was available for use. The availability of power plants is driven by both planned and unplanned (forced) outages Forced outages are usually related to unexpected events or malfunctions leading to a shut-down and can be either ‘technical’ or ‘long-lasting’ in nature. ‘Techni- cal’ forced outages are the result of a well-defined and limited issue, while ‘long-lasting’ forced outages are the result of unpredictable events leading to a long shutdown (and sometimes also affect other units because the units have similar designs). Planned outages are considered to be part of usual maintenance works known beforehand, but also include longer planned maintenance periods which are needed to solve issues encountered after a ‘long-lasting’ forced outage.
Forced and planned outages
As is the case for other generation technologies (as detailed in Section 3.4.4), nuclear capacities are not always available due to forced and planned outages. A historical analysis was conducted for the years 2012-2021 to derive the availability parameters (see BOX 3-7 for more information). The availability of nuclear units used in the CENTRAL scenario is based on the choice made by the Belgian Minister of Energy regarding the CRM reference scenario for the Y-4 auction of 2026-27 and 2027-28 delivery years [ECO-1]. The assumptions are outlined below:
• Planned maintenance based on expected planning (REMIT data). This was precisely modelled by considering the exact dates foreseen for each unit for each year. For years where no REMIT data is yet available, no maintenance is assumed to happen in winter months The latter can be considered as an optimistic assumption since historical data demonstrates that planned maintenance also happens during the winter. Nuclear unit maintenance during winter periods amounted to 8.1 % on average over the past 10 years.
• ‘Technical’ forced outages These outages are taken into account with a forced outage rate based on historical dayahead nominations and amount to 4.0 %.
• ‘Long-lasting’ forced outages (as depicted in Figure 3 65) are considered based on information from the AFCN/FANC website relating to a case-by-case analysis of outages of the different nuclear units and amount to 16.5%
Nuclear sensitivity
Regarding sensitivities around the CENTRAL scenario (i.e. the 10-year extension of Doel 4 and Tihange 3 from November 2026), the following sensitivities relating to the nuclear available capacities in Belgium are performed.
• ‘FlexLTO’ assumes that Doel 4 and Tihange 3 are available during the winter of 2025-26 (from November 2025 to March 2026), but are not available between April and October 2026. Such a scenario allows the two nuclear units to be accounted for during the winter of 2025-26, with the work being realised at another period;
• ‘DelayedLTO’ assumes that the 10-year extension of Doel 4 and Tihange 3 is postponed, i.e. the necessary works for the LTO cannot be carried out before the winter of 2026-27. Regarding nuclear availability parameters, two sensitivities are assessed from 2026 onwards:
• A better nuclear availability rate consisting of a lower forced outage rate (10% instead of 20.5%) is assessed. This could reflect the fact that the historical rate could be better than the one calculated on the whole fleet historically;
• Similarly, a worse nuclear availability rate consisting of a higher forced outage rate (30% instead of 20.5%) is considered. This could reflect the fact that LTO works could have a spillover effect on the winter period or that other issues could arise during the undertaking of maintenance work, lowering the nuclear availability.
In addition to ‘technical’ reasons, other reasons have caused the forced (long-lasting) outages of nuclear units in Belgium over the last few years:
• parts of the unit being sabotaged – such events are unpredictable and can lead to months of unavailability whilst the plant is being repaired;
• damages to certain parts of the plant following engineering or extension works;
• non-conformity issues discovered during major overhauls or inspections – such discoveries can lead to one or more reactors becoming unavailable (as some of them are based on the same technology) in order for additional analyses (and possible repairs) to be performed. These events can lead to long periods of unavailability and should be considered in the forced outage rate for nuclear units in Belgium.
Planned outages are usually scheduled outside of critical periods for security of supply and therefore have less impact on the latter. However, as is clear in Figure 3-65, planned outages can also occur during the winter and could potentially pose an additional risk to the availability of nuclear units. However, these are not considered in this study (unless they are planned in REMIT for the upcoming 3 years).
The outage characteristics for Belgian nuclear units were calculated by Elia based on historical day-ahead nominations of Belgian nuclear units from 2012 to 2021. The calculation was performed at the request of the Minister in the course of 2022 in order to derive a derating factor to be used in the CRM auctions. Figure 3-65 displays the availabilities for 2022 for informative purposes, but these were not used for the determination of the outage characteristics, given that the calculations were performed in the course of 2022, based on data until 2021.
The resulting historical outage characteristics for Belgian nuclear units are listed in Figure 3-66. Elia provided the values for ‘technical’ and ‘long-lasting’ forced outage rates and the planned outage rate in winter periods.
The forced outage rate for Belgian units used in the context of this study is the sum of the ‘technical’ and ‘long-lasting’ forced outage rates and corresponds to 20,5%. The choice to consider ‘technical’ and ‘long-lasting’ forced outages is in line with the reference scenarios for the Y-4 CRM auctions for the 2026-27 and 2027-28 delivery years, as decided by the Minister of Energy.
Regarding the commissioning or repowering of units, the following assumptions are considered:
• the 32 MW small CCGT (operating also as CHP) of Borealis Kallo is considered to be commissioned in July 2024 following some delays the to the original timetable [SPG-2];
• the repowering of Zandvliet Power, i.e. an increase in the capacity from 386 MW to 419 MW is assumed as of November 2024, as mentioned in REMIT [REM-1];
• the capacity contracted as part of the CRM Y-4 auction for the 2025-26 delivery period for a duration of 15 years is considered; this concerns two new CCGTs, the 890 MW unit of Flémalle (Engie) and the 885 MW unit of Seraing (Luminus).
This leads to about 5,679 MW of gas-fired individually modelled thermal units assumed in November 2023 and 7,093 MW considered as available from November 202 . Figure 3-67 provides information on the location of larger plants (bigger than 150 MW) and the split per category of the whole fleet.
No other commissionings or decommissionings are considered for individually modelled gas-fired units after 2025 in the CENTRAL scenario.
In addition to CCGTs and OCGTs, one 305 MW unit (Knippegroen) burns blast furnace gas and recovers converter gas from the ArcellorMittal steel plant. The unit is usually referred to as ‘Classical’.
Some of the gas-fired power plants that are individually modelled in this study also have a ‘CHP mode’. To account for the fact that those units are also used to supply processes (for example heat or steam) and that they might continue running during low electricity prices, a partial ‘must run’ is considered. More information about the modelling of thermal power plants can be found in the dedicated methodology section included in Appendix C.
Note that the economic viability of both existing and new gas-fired CCGT/OCGT units are assessed via the EVA and additional CCGT/OCGT capacity can be considered if deemed economically viable. As from 2030, hydrogen fueled CCGT and OCGT are also considered as candidates for investments in the EVA.
This map shows only the units above 150 MW considered available as of September 2023, together with the assumed changes by November 2025 Note that several of the units can operate in CHP mode.
Total capacity of gas-fired individually modelled units considered as available:
Capacity [MW] i More details on the determination of the outage characteristics for Belgian nuclear units can be found in scenario Appendix V.
3.4.3.2. Gas-fired units
In this study, two kinds of units using gas as fuel in Belgium are modelled:
• large units which are usually directly connected to the Elia grid; these units are individually modelled in the simulations of the electricity market;
• smaller decentralised units which are usually connected to the distribution grid; these units are aggregated and a profile based on historical data is applied.
This section details the assumptions regarding both kinds of units.
Individually modelled
The list of individually modelled units consisting of large units (mostly connected to the Elia grid) was submitted for public consultation in November 2022 and modified in line with feedback from stakeholders.
Gas-fired power plants in Belgium are made of combined cycle gas turbine (CCGT) units, open cycle gas turbine (OCGT) units and classic steam turbine (CL) Smaller combined heat & power (CHP) units that are typically connected to DSO grids are tackled in the next section (aggregated profiled CHP units).
The latest information regarding official closures is taken into account:
• the 170 MW steam turbine in Seraing is due to close on 18/04/2024 (article 4bis notification) [FPS-4];
• regarding the 360 MW CCGT unit in Vilvoorde, it is assumed that the 105 MW steam turbine closed in April 2023, in line with REMIT information. The remaining 255 MW gas turbine operating then as OCGT is assumed to close on 31/10/2025 (article 4bis notification) [FPS-4]].
From 5679 MW in Sep. 2023
To 7093 MW as of Nov. 2025
*Assumed changes from Nov. 2023 to Nov. 2025
Apr-24: Seraing ST (170 MW) assumed to close and Seraing GT (300 MW) assumed to operate as OCGT.
Jul-24: Borealis Kallo (32 MW) assumed to operate as CCGT.
Nov-24: Repowering of Zandvliet Power (from 386 to 419 MW) assumed as of Nov. 2024.
Oct-25: Vilvoorde GT (255 MW operating as OCGT since the closure of ST in April 2023) assumed to close.
Nov-25: Flémalle (890 MW) and Seraing NEW (885 MW) assumed to operate as CCGT (capacity auctionned in the framework of CRM DY 2025-26)
Decentralised gas-fired CHP units
This section focuses on the decentralised gas-fired CHP units in Belgium, which are usually connected to the DSO grid. In the modelling, these units are aggregated into one profiled production (see Appendix C for more information about the modelling).
The capacity assumed for the smaller gas-fired CHP units is based on existing and future projects. To do so, Elia uses the PISA database: an Elia database containing all units of the Belgian system (which are connected to the TSO and DSO grids), which is based on data that DSOs communicate to Elia on a regular basis.
In addition to the known future projects, a rather optimistic assumption is taken by considering no potential decommissioning of the existing capacities. Indeed, while most of these existing CHP are located in Flanders it is expected that many will lose access to subsidies in the years to come [DTI-2]. However, CHP units can still participate in CRM auctions and their business case might be influenced by high electricity prices or by the associated process they supply. It is thus difficult to assume a trajectory that does not consider that all existing units will remain in the market for the whole period covered by this study and that all known and mature projects will be materialised.
This leads to 1,499 MW of aggregated gas-fired CHP units in November 2023 (with 982 MW of gas turbines and 517 MW of motors engine) and to 1,594 MW from November 2027 onwards.
Note that the economic viability of new individually modelled CHP units is assessed via the EVA and additional CHP capacity can be considered if deemed economically viable. The existing decentralised CHP capacity is assumed to stay in the market throughout the whole of the period which is studied.
In order to consider a potential faster or slower evolution of new small gas-fired CHP capacity in the long term, sensitivities with + 1000 MW 2030 are performed (and also with -1000 MW).
3.4.3.3. Biomass & waste
Similarly to gas-fired units, two kinds of units using biomass (e.g. wood pellets) or waste (e.g. incineration stations) in Belgium are modelled in this study:
• Larger units which are usually directly connected to the Elia grid; these units are individually modelled;
• Smaller decentralised units which are usually connected to the distribution grid; these units are aggregated with a profiled production (see Appendix C for more information about the modelling).
Biomass and waste-fired production are considered as renewable energy sources.

The approach for the assumed capacity is the same as the one applied for the gas-fired capacity.
Total capacity of gas-fired aggregated CHP units considered as available:
From 1499 MW in Sep. 2023 to 1594 MW in Sep. 2027
• In terms of individually modelled units, the capacity assumed is based on the existing fleet, as no future projects are known. The biomass unit Rodenhuize (205 MW) is not considered as available anymore as it has been used as backup unit for Zelzate Knippegroen since February 2023, as reported in REMIT. This leads to 68 MW of biomass units individually modelled and 286 MW of waste units indi- vidually modelled This capacity is assumed to stay in the market throughout the entire period that is covered by this study. Some of these units can also operate in CHP mode.
• In terms of decentralised biomass and waste capacity (aggregated capacity), the PISA database is used in the same way as it is for decentralised gas-fired CHP capacity. The known projects are considered and no decommissioning within this capacity is assumed. Based on the known future projects, an increase in the biomass capacity from 547 MW in 2023 to 567 MW is considered as decentralised production. A constant capacity of 48 MW of decentralised waste units is assumed.
It is important to note that no reduction of the existing capacity is assumed even though the latest VEKP considers a reduction of the biomass installed capacity towards 2030. Note that no EVA is performed for biomass and waste units, since these units are more policy-driven rather than market-based. It is therefore assumed that all existing capacity will stay in the market throughout the whole of the time period which is being studied.
949 MW of total installed capacity considered as available in Sep. 2023:
615 MW of biomass 334 MW of waste
Note that biomass unit Awirs 4 (75 MW) has closed in September 2020 (75 MW) and that biomass unit Rodenhuize (205 MW) is used as backup unit to Zelzate Knippegroen since February 2023.
E-wood biomass unit (22 MW) came in production in December 2022.
3.4.3.4. Oil-fired units (turbojets)
Turbojets are oil-fired peaking units integrated into the electricity grid. They function just like an aircraft jet engines. They are individually modelled in the simulations. The turbojets are mainly located in Flanders.
Based on the latest information regarding official closures, it is assumed that the turbojet Volta (18 MW) will be closed by August 2023 (article 4bis notification [FPS-4]). The remaining 140 MW of turbojets are to be considered available as of September 2023 for the whole of the period being studied. It is important to note that these units have high specific CO2 emissions and will not be able to participate in upcoming CRM auctions. A sensitivity that removes the turbojet capacity is performed.
Note that the economic viability of existing turbojets is also assessed via the EVA. Due to the high specific emissions associated with oil-fired units, such new units are not considered as EVA candidates.
3.4.4. OUTAGE RATES
Belgian thermal generation units with daily schedules are modelled individually by the Antares model by taking into account periods of planned unavailability (usually maintenance) and unplanned unavailability (usually caused by an unexpected malfunction).
Planned unavailability is taken into account the following way:
• if the maintenance dates are known and available in the transparency platforms belonging to the producers in the framework of REMIT (for the first years analysed in this study), they are explicitly taken into account;
• if the maintenance dates are not yet known or are beyond
BOX 3-8 — N-SIDE STUDY ON OUTAGE RATES
The outage characteristics used in this study were calculated as part of a study performed by N-SIDE during 2022 and which was put out to consultation in November 2022. The study was performed after several questions were received from stakeholders in the framework of adequacy studies. Additionally, it aimed to acquire a more robust dataset by incorporating a greater number of units of the same type from other countries.
In the study, the outage characteristics of generation units and DC links are calculated using historical availability data from 2015 to 2021 available on the ENTSOE Transparency Platform (ETP), in line with REMIT regulation.
The availability data from ETP for Belgium, France, Great Britain, the Netherlands, Germany, and Italy was combined with data from Elia’s database (Elia DB) for smaller Belgian units which are not included in ETP. Including the scope of REMIT, then a maintenance rate (in line with the ENTSO-E common data) is used. The maintenance is then drawn by the model before the simulation. other countries in addition to Belgium improves the statistical robustness of the results. ETP data is used as the main source as large units are legally required by REMIT to publish outages on ETP. Data from 2015 to 2021 was used as ETP only has outage data from 2015 onwards. The combination of data from ETP and Elia DB was compared with data from other transparency platforms such as Nordpool [REM-1] and EDF transparency [EDF-1] to ensure the quality of the ETP data.
Note that no maintenance work is considered for individually modelled units for Belgium during the winter months (November to March), unless these are provided on ENTSO-E Transparency Platform (hereafter referred to as ETP). This assumption could be viewed as optimistic, because it is not always possible to exclude the scheduling of maintenance works during winter periods.
Regarding nuclear power, Elia refers to Section 3.4.3.1 and BOX 3-7.
In the study, N-SIDE compared various data sources for historical outages, compared the outage metrics with results from a literature review and performed some additional analysis related to outages. Figure 3-70 illustrates the methodology applied by N-SIDE in the outage study.
For pumped storage, the outage characteristics are calculated on Belgian units only to avoid including other types of hydro units reported on ETP.
It is important to note that the study did not assess the outage of batteries (due to a lack of data), but that a forced outage of 2% is applied as a derating factor on the installed capacity. This was introduced based on com- ments received in the framework of the public consultation. For nuclear units, the outage characteristics were calculated by Elia and are detailed in scenario Appendix V
More details on the outage study performed by N-SIDE can also be found in in scenario Appendix IV.
Three different forced outage (FO) parameters are needed for the current study: The definitions of the first two parameters are used in adequacy studies and are in line with the ENTSO-E methodology. The third one is only used for the flexibility assessment.
• Average FO rate [%] (used for the adequacy assessment). This consists of the amount of unavailable energy due to FO divided by the sum of the available energy and the unavailable energy due to forced outages.
• Average duration of FO rate [hours] (used for the adequacy assessment). This is the average length of a FO expressed in days or hours.
• Number of FO per year (only used in the flexibility assessment). This is the average amount of FO events that happen per year.
The average amount of events is particularly relevant for the flexibility assessment as it is important to cover unexpected outage events immediately after they have occurred (fast flexibility) and during intra-day (slow flexibility). After dayahead, these fall under the scope of the adequacy analysis, where the duration and the outage rate are used as relevant parameters (i.e. the time for which a unit is effectively not available).
TABLE 3-6 — OVERVIEW OF THE OUTAGE CHARACTERISTICS
3.4.5. CARBON EMISSIONS OF THE BELGIAN FLEET
The Clean Energy Package introduced a requirement of CO2 limits as a prerequisite for participating in capacity mechanisms. More recently, the FPS Economy proposed more strict limits for Belgian units to be used in the upcoming auctions starting from delivery period 2027-28. Based on the presentation made by the FPS Economy in the WG adequacy on 23/03/2023, the proposal leads to using additional carbon emissions limits from the 2027-28 delivery period (until 203132). These were set in the functioning rules. They consist of the following:
• all units below the specific emission threshold of 550 gCO2/ kWh are allowed to participate;

• for units commissioned before 04/07/2019: a maximum specific emission threshold of 600 gCO2/kWh is allowed if the annual emission threshold of 306 kgCO2/kWe/year is met; this means that a unit emitting exactly 600 gCO2/kWh cannot run for more than 510 hours per year.
In Belgium, different technologies have different CO2 intensities. Nuclear and RES units, not reported in Figure 3-71, have no direct specific emissions. Large CCGTs have the lowest emissions amongst thermal units. Turbojets (oil-fired units) have the highest. From their ranking, it is clear that introducing emissions limits for the capacity mechanism will lead to:
• existing turbojets being excluded from participating in the CRM;
• some old OCGTs being allowed to participate if their total amount of yearly running hours is limited.
However, it is important to note that the picture is nuanced regarding the CHP. Firstly, the overall CO2 emissions of CHP plants should take into account their heat production, as their electricity efficiency might be lower than that of CCGTs. The heat recovered can increase their overall efficiency so that it rises above 90%, this needs to be accounted for.
* Only considering technical forced outages.
** Also considering long-lasting forced outages
*** Regarding batteries, the forced outage rate is considered in the models by applying a derating factor on the installed capacity
In order to assess how compliant the Belgian fleet is with emission limits that are due to be set for upcoming CRM auctions, the Belgian thermal fleet is ranked based on its CO2 intensity, or the amount of CO2 emitted per unit of electricity produced (g/kWh_e). This intensity is calculated based on the information available to Elia with regards the efficiency of the unit and the primary fuel used by the unit. Other information that might impact this calculation are not accounted for and the figure is to be considered as indicative. This is depicted in Figure 3-71.
3.4.6. NEW CAPACITY TO FILL THE GAP
Depending on the adequacy results and the EVA, if a GAP (new capacity needed on top of all existing and new capacities assumed in the CENTRAL scenario) is required to meet the reliability standard, new capacity will be assumed. This new capacity can be filled by the following technologies:
• new CHP;
- without ‘must run’;
- with partial ‘must run’;
- with full ‘must run’;
• new storage;
- batteries 1h;
- batteries 2h;
- batteries 4h;
Based on the aforementioned analysis, a sensitivity analysis is conducted on turbojets and other units not complying with the threshold as from 2027-28, specifically by removing them from the system and assessing their economic viability, as specified in Section 3.4.3.4. Furthermore, the results will also provide the number of hours that old OCGTs are dispatched to allow the comparison with the yearly emissions threshold.
Units that cannot participate to the CRM as from 2027-28. Mainly TJs
Units will need to run less than 510 hours. Mainly OCGTs
Units not constrained by CO2 emission limits in CRM participation
• new demand side response 4h;
• new CCGT:
- methane-fuelled;
- hydrogen-fuelled;
• new OCGT;
- methane-fuelled;
- hydrogen fuelled.
The capacities mentioned above are also used as candidates in the EVA; the process of determining the new capacities which are economically viable in the market is further described in the methodology in Section 2.6
3.4.7. SUMMARY AND SENSITIVITIES ON GENERATION AND STORAGE
Figure 3-72 provides an overview of the CENTRAL scenario and sensitivities for electricity generation and storage.
FIGURE 3-72 — OVERVIEW OF THE CENTRAL SCENARIO AND SENSITIVITIES FOR ELECTRICITY GENERATION AND STORAGE
Other characteristics Electricity supply and storage
Best estimate of 2030 target based on exchanges with regions/ DSOs.
Princess Elisabeth Zone considered with 3.5 GW by end 2030.
Existing capacity and foreseen project (Coo)
Growth rate depending on assumed evolution for photovoltaics.
Faster and slower growth rate of PV and onshore wind
Higher offshore capacity (e.g. repowering) (‘HIGH’). Two years delay for full PEZ commissioning (‘LOW’)
3.4.8. ADDITIONAL SCENARIOS COMBINING SENSITIVITIES ON DEMAND, GENERATION AND FLEXIBILITY
After the request of the regulator, several sensitivities have been combined in order to assess their combined impact. It is important to acknowledge that certain factors can induce changes across multiple aspects of the scenarios. The combined impact is therefore assessed in term of capacity requirements but also on the impact of carbon emissions. The selection of these drivers was based on the trends highlighted earlier in this chapter. This resulted in four scenarios defined for Belgium as depicted on the tables below. The impact is assessed for 2030 and 2034.
Storage fully optimised by the market
Shares of out-of-market home batteries (locally optimised) and in-themarket (optimised by the market)
Projects known at Elia with best estimate commissioning date + additional capacity if economically viable.
Additional potential largescale batteries assumed to be in the market already
Storage fully optimised by the market
Higher and lower share of in-the-market home batteries. Closure of all units
Availablility of the nuclear fleet assumed with a forced outage rate of 20.5 % (historical analysis) Fuel saving during summer to maintain T3 and D4 during winter 25-26. Delay in the 10-year extension of T3 and D4 (DelayedLTO)
In
Constrained Transition and Unconstrained Transition scenarios, the percentage of EV/HP in-the-market is the same as in the CENTRAL scenario, but as the amount of EV and HP is different, the absolute available flexibility from HP and EV is different.
In the Constraint Transition scenario, less offshore wind is assumed due to the delay of the Boucle du Hainaut project (cf. Grid assumption).
Higher and lower capacity of decentralised
The Constrained Transition scenario examines the impact on Belgium’s adequacy when the transition cannot progress at the expected pace set by authorities. It assumes limitations in materials availability (e.g., rare-earth materials) and supply chain (e.g., manufacturing capacities) described in Section 3.1.9. Furthermore, it considers low acceptance of grid infrastructure projects and large RES generation assets like onshore wind. These factors affect the installation rate of solar PV and onshore wind (following the ‘LOW RES’ sensitivity) as well as the adoption of EVs and HPs (following the ‘LOW EV’ and ‘LOW HP’ sensitivity). Additionally, the scenario assumes a three-year delay in the additional electrification of industry due to similar reasons and lower flexibility in electrified processes (‘LOW INDUSTRY FLEX’). The scenario also accounts for a 2-year delay in the Boucle du Hainaut project (following the ‘Delay of Boucle du Hainaut’ sensitivity described in Section 3.6.4.2).
In contrast, the Unconstrained Transition scenario assumes a faster transition without limitations in materials availability or supply chain and a higher acceptance of large RES generation projects, resulting in a rapid uptake of RES (following the ‘HIGH RES’ and ‘HIGH OFFSHORE’ sensitivities) as well as EVs and HPs (following the ‘HIGH EV’ and ‘HIGH HP’ sensitivities). The Unconstrained Transition scenario also assumes an acceleration of industry electrification by one year.
The Prosumer Power scenario explores a consumer-driven bottom-up energy transition, where consumers electrify their consumption (with ‘HIGH EV’ and ‘HIGH HP’) and pursue self-reliance through solar PV (‘HIGH PV’). Additionally, it focuses on removing barriers to enable increased flexibility from residential and tertiary consumers leading to higher shares of EVs, HPs and home batteries being optimised by the market (‘HIGH FLEX’ for EVs, HPs, and small-scale home batteries).
Finally, the High Gas Prices scenario assumes reduced electricity consumption (‘SLOWDOWN/HIGH PRICES’ sensitivity) due to high energy prices and emphasizes the authorities’ push for EVs/HPs (‘HIGH EV’ and ‘HIGH HP’) and solar PV (‘HIGH PV’) to decrease reliance on gas. It also incorporates a 2-year delay in industry electrification due to the economic slowdown caused by high gas prices.
3.5. EUROPEAN ASSUMPTIONS
The 27 other European countries considered in this study are modelled with similar levels of granularity as used for Belgium (consumption, generation units, storage facilities, renewables, demand side response…). This section first sets the scene highlighting the European scenario framework and sensitivities; it then examines the key trends in the EU-BASE scenario alongside providing more details about neighbouring countries. Next, the EU-SAFE scenario – which includes relevant sensitivities on short-term risks abroad – is elaborated. The scenarios assuming no market-wide CRM are also defined.
3.5.1. OVERVIEW OF SCENARIOS AND SENSITIVITIES
An overview of the different reference scenarios and sensitivities is provided in Figure 3-73. The starting point for determining all reference scenarios and sensitivities is the latest publicly available ENTSO-E dataset which includes data collected from TSOs, in the framework of the ERAA 2022 study and published at the end of 2022 [ENT-4]. This dataset is then updated based on latest policies, European/national announcements, recent developments (e.g. the available information regarding the latest figures of 2022) and available national studies. These sources therefore also include packages published at the European level: ‘Fit for 55’ and ‘REPowerEU’.
Consequently, for this study, a first scenario is explored which consists of the best estimate for each country and takes the latest ambitions and policy measures into account:
• ‘EU-BASE’: reflecting a scenario that considers market-wide capacity mechanisms to continue in countries where such a mechanism is already in place. It further assumes all countries to comply with their reliability standard starting from 2027, or a LOLE of 3 hours if a specific standard is not yet established or known.
While this scenario reflects an estimated view of the future parameters of the European electricity system, it could be argued that some of the assumptions reflect a rather optimistic view of the future system which does not account for specific risks related to uncertainties over which Belgium has no control. The impact of such risks are quantified through several sensitivities related to the availability of capacities abroad, to the availability of cross-border exchange capacities at times of system stress or in exceptional periods of drought. Generally, these risks share the trait of only becoming apparent close to operational timeframes, which means investors are no longer able to fully anticipate their effects, and can therefore be referred to as ‘unpredictable short-notice events’. In addition, the assumption that each country complies with its reliability standard from 2027 (adopted in the EU-BASE scenario) can be seen as optimistic. A sensitivity analysis (‘EU-NoNewCRM’) is also conducted, assuming that countries that have not yet approved and implemented a market-wide CRM will not take the necessary measures to stay below their reliability standard, or will do so through an out-of-market mechanism not open for other countries.
While the probability of the simultaneous occurrence of those risks can deemed–to be low (but cannot be excluded - the year 2022 has demonstrated that the combination of several independent risks is not to be excluded), an analysis of historical information shows that it is prudent to account for these risks. To this end, an additional scenario is defined by selecting a single sensitivity deemed to be representative of the foreign risks identified:
• ‘EU-SAFE’: reflecting a scenario which takes into account short-notice risks that are beyond Belgium’s control. The scenario is constructed starting from the EU-BASE scenario and applies the defined sensitivities one by one. Each sensitivity is evaluated individually to assess its impact on the scenario outcomes and system adequacy of Belgium. Based on the results, but also on the decisions taken within the framework of the Belgian CRM regarding the reference scenario definition, the sensitivity assuming four additional nuclear units as unavailable in France is taken as representative. For the shorter time horizons (where such data is available), this corresponds to taking the REMIT data calibrated to the minimum yearly generation forecasts (see Section 3.5.3.1 for more information).
As required by EU Regulation 2019/943, the national resource adequacy assessment must contain the reference central scenarios as referred to for the ERAA. These scenarios shall include, amongst other things, an EVA of generation assets. The methodology for the ERAA, as adopted by ACER, further specifies that two central reference scenarios are to be defined: one including capacity mechanisms across Europe and one without such capacity mechanisms.
Therefore, four additional scenarios are constructed on both the EU-BASE and EU-SAFE scenario:
• ‘EU-BASE_noCRM’ and ‘EU-SAFE_noCRM’: reflecting a scenario that excludes market-wide capacity mechanism revenues in Europe starting from the EU-BASE or the EU-SAFE scenario, so assuming that no market-wide capacity mechanisms exist in Europe. This scenario is obtained after performing a full EVA in most European countries.
• ‘EU-BASE-BEnoCRM’ and ‘EU-SAFE-BEnoCRM: reflecting a scenario that excludes market-wide capacity mechanism revenues in Belgium starting from the EU-BASE or the EU-SAFE scenario, assuming that no market-wide capacity mechanism exists in Belgium, which is contrary to the situation across the rest of Europe. The outcome of the scenario is obtained after performing an EVA on the Belgian production fleet only, while keeping the assumptions for the other countries unchanged.
Figure
FIGURE 3-73 — EUROPEAN SCENARIO FRAMEWORK OF THE STUDY
FR-NUC
XB-DelayedGrid
EU-LowHydro
EU-NoNewCRM
EU-BASE
In order to create the EU-BASE scenario, all countries are assumed to respect their reliability standard (or 3 hours of LOLE if unknown) from 2027 onwards. This means that for countries without a market-wide capacity mechanism, additional capacity is added to comply with the standard, if required. For countries with a market-wide capacity mechanism, the amount of capacity is defined to be at the national reliability standard. Moreover, if after having ensured that the reliability standard is met, additional capacity is economically viable, this is also added to the system. This computationally intensive process requires capacities to be added or removed in an iterative manner (gas/H2-fired, oil-fired, storage or demand response) to the relevant countries.
The construction of the EU-BASE scenario is based on the assumption that market-wide capacity mechanisms would be in place in all European countries where these are required for countries to comply with the reliability standard by 2027, or that countries that are expecting to close existing thermal capacities (e.g. coal or nuclear) will take measures to extend the lifetime of those units. For countries with a market-wide mechanism, this process ensures that those countries will respect their reliability standard while ensuring that additional capacities which are not required to respect the standard do not benefit from capacity mechanism revenues. This process requires a detailed view of adequacy metrics (LOLE) and revenues and hence time-consuming iterative economic dispatch simulations are performed.
In order not to complicate the process and avoid undertaking endless amounts of simulations, the economic viability is assessed for the countries that most impact adequacy in
Belgium. Belgium, France, the Netherlands, Germany, Great Britain, Poland, Italy, Austria and Switzerland are therefore involved. These countries represent more than 70% of the thermal generation capacity in Europe.
It is important to mention that in AdeqFlex’21, the EU-BASE scenario assumed that only countries with market-wide capacity mechanisms were calibrated to their reliability standard (while in other countries, only economically viable additional capacity was added). In the present study, it is assumed that every country will take the necessary actions to ensure compliance with the reliability standards in the market by 2027, even if no market-wide capacity mechanism is planned by the country.
Prior to 2027 existing and new capacities are taken into account for each country as included in national studies or the ERAA 2022. Given the time it takes to implement a capacity mechanism and get it approved, for countries which do not have an approved market-wide capacity mechanism in place today, no additional capacity is included to respect the national reliability standard. However, for countries that do have a market-wide capacity mechanism in place today, such capacities are added where required to respect the reliability standard. Prior to 2027, all countries are found to be below their reliability standard in the EU-BASE scenario.
Note that some countries have strategic reserves in place to ensure their adequacy. Since these capacities are considered to operate out-of-market as last-resort solutions when a national scarcity situation occurs, these strategic reserves cannot be relied upon by other countries. The results of the market simulations are not impacted as these strategic reserves are supposed to be dispatched after the market has depleted all of its in-the-market resources and de facto reaches the price cap. From a model perspective, it does not impact the flows or the market prices. However, it is important to note that the assumption adopted in the EU-BASE scenario assumes that all countries will stay below their reliability standard in the market.
Additional scenarios assuming no market-wide CRMs in Europe or Belgium starting from the EU-BASE scenario are defined, as outlined below.
• The definition of the EU-BASE_noCRM scenario starts with the same initial dataset, upon which a full EVA assessment is performed. As part of this procedure, given the definition
EU-SAFE
The EU-SAFE scenario is created by choosing one of the multiple identified sensitivities to the EU-BASE scenario. The goal of this scenario is to reflect a realistic view of additional uncertainties abroad beyond Belgium’s control which could significantly impact the adequacy situation in Belgium. Indeed, given Belgium’s high dependency on imports (as will be illustrated in the results), any event happening abroad can have a significant impact on the adequacy requirements of the country.
The sensitivities related to these uncertainties abroad are defined both in this section when related to available capacity abroad and in the section on cross-border exchange capacities when it comes to grid assumptions. The sensitivity selected for the EU-SAFE scenario as representative of the different risks is the ‘FR-NUC4’ sensitivity. In Chapter 4.1, the adequacy results for Belgium for these different sensitivities are presented, justifying the choice of the FR-NUC4 sensitivity.
As described above, several sensitivities are applied to reflect short-notice uncertainties regarding the availability or contribution of foreign capacities in the system:
• ‘FR-NUC’ sensitivities, related to the actual short-notice availability of French nuclear generation in the market (see Section 3.5.3.1);
• ‘XB-RAM’ sensitivities, related to the minimum margins given to the market by each TSO through cross-border capacity calculations and the risks surrounding these (see Section 3.6.4.1);
• ‘XB-Delayed’ related to the risk of delays in grid infrastructure development abroad, e.g. due to the introduction of the minRAM (see Section 3.6.4.2);
• ‘UK-not2EU’ sensitivity, related to uncertainties regarding the availability of cross-border links to the UK (see Section 3.5.3.2); of the scenario which excludes capacity mechanism revenues in Europe, the simulation of adequacy metrics is not required, and no check with respect to the reliability standards has to be performed. As such, capacities are added or removed in the system up to the point where every monitored capacity present in the market is economically viable, and no additional capacity would be viable.
• In line with the previous scenario, in the EU-BASE_BEnoCRM scenario, capacities are added or removed in Belgium to the point where every monitored capacity present in the market in Belgium is economically viable. Capacities in other countries remain untouched. Such a scenario allows the relevance of a CRM mechanism in Belgium to be assessed.
3.5.2. KEY TRENDS FOR THE EU-BASE SCENARIO
3.5.2.1. Supply
Wind and solar capacities
Many European countries have set ambitious renewable energy targets, in line with the goal of achieving carbon neutrality by 2050.
Under the EU-BASE scenario, it is assumed that solar capacity in Europe will triple by 2030, compared with its 2022 levels. Solar energy is widely acknowledged as relatively easy to install and economically attractive, meaning it is at the centre of the development of RES capacity in Europe. The assumed 585 GW in EU27 by 2030 as depicted in Figure 3 74 is mainly driven by the 215 GW expected in Germany, 75 GW in Italy, 50 GW in the Netherlands and 47 GW in France.
The onshore wind capacity is assumed to reach 329 GW by 2030 in EU27, where Germany, with 115 GW, is expected to remain the leading holder of onshore wind in Europe.
During the first half of 2023, a lot of focus was placed on the development of offshore wind in the North Sea and in the Baltic Sea especially (highlighted in Section 3.1.4). Several statements and increased ambitions were announced. A capacity of 106 GW offshore wind by 2030 in EU27 is assumed.
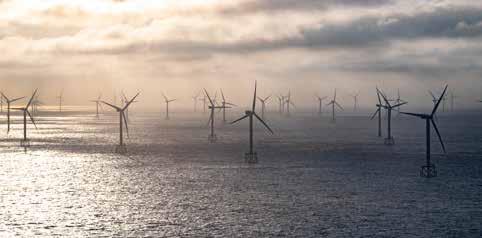
• ‘NO-not2EU’ sensitivity, related to uncertainties regarding imports from Norway (see Section 3.5.3.2);
• EU-LowHydro’ sensitivity, related to the risk of drought in Europe leading to low hydro production (see Section 3.5.3.3);
• ‘EU-NoNewCRM’ sensitivity, related to the risk that no new capacity mechanisms are put in place in Europe or that the lifetime of units which are due to be closed are not extended (mainly coal), considering therefore only the existing mechanisms in place in the relevant countries (see Section 3.5.3.4).
Additional scenarios assuming no market-wide CRMs in Europe or Belgium starting from the EU-SAFE scenario are defined, as outlined below.
• The definition of the EU-SAFE_noCRM scenario starts with the same initial dataset as the EU-SAFE scenario (selecting the FR-NUC4 as a reference sensitivity), upon which a full EVA is performed. As part of this procedure, given the definition of the scenario which excludes capacity mechanism revenues in Europe, the simulation of adequacy metrics is not required, and no check with respect to the reliability standards has to be performed. As such, capacities are added or removed in the system up to the point where every monitored capacity present in the market is economically viable, and no additional capacity would be viable.
• In line with the previous scenario, in the EU-SAFE_BEnoCRM scenario capacities are added or removed in Belgium up to the point where every monitored capacity present in the market in Belgium is economically viable. Capacities in other countries remain untouched. Such a scenario allows the relevance of a CRM mechanism in Belgium to be assessed.
Coal
Historically, coal-fired power units have played a significant role in electricity production throughout Europe. However, their usage has declined in recent years due to growing concerns over their environmental impact. In response to these concerns, several European countries have implemented policies that are aimed at reducing their dependence on coalfired power and most have announced complete phase-outs over the coming decade.
Belgium took an early step in 2016 by phasing out coal-fired power plants; it was then followed by Sweden and Portugal. However, due to the ongoing energy crisis, countries like
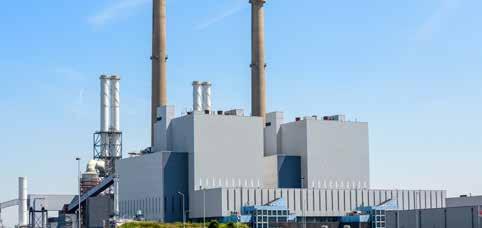
France, the United Kingdom, and Germany have postponed the planned closure of certain coal-fired power plants. Nevertheless, the majority of European countries have committed to phasing out coal by 2030 or slightly later (2033 for the Czech Republic and Croatia), with the notable exception of Poland.
Figure 3-75 shows the historical and assumed coal-fired capacity in Europe. Although today, Germany and Poland are responsible for nearly 75% of the coal-fired capacity in Europe, it is assumed that Poland will be one of the last remaining European countries with coal-fired capacity in 2034 (11.5 GW).
Nuclear
The nuclear capacity in Europe is currently mainly concentrated in France, which holds 61 GW and accounts for nearly 60% of the total nuclear capacity in Europe. With regard to the present study, the discussions regarding the extension of existing units carry a lot of weight. Several countries have decided or are now discussing the extension of their nuclear plants (which means their lifetimes may be increased beyond what was initially planned or set in legislation).
In France the President announced plans to avoid the closure of existing units where possible, which resulted in assuming that the nuclear capacity will remain constant after the commissioning of the EPR in Flamanville in the EU-BASE scenario. In the United Kingdom it is assumed that two units scheduled to close in 2024 will continue to operate until early 2026, although this still needs to be confirmed. In Belgium, the extension of Doel 4 and Tihange 3 is assumed to have occurred from the winter of 2026-27 onwards. In Germany, however, the last nuclear reactors were closed in 2023, after a short extension that lasted a few months. No German nuclear capacity is therefore assumed in this study.
The historical and assumed future nuclear capacity in Europe is depicted in Figure 3-76. The EU-BASE scenario assumes the commissioning of several new nuclear reactors that are taken to be commissioned before 2034 two units in the United Kingdom (Hinkley Point C reactor by 2027 and Sizewell C reactor by 2033), as well as reactors in Romania and Hungary. While other countries are also discussing the construction of new nuclear reactors, these plans are mainly focused on the period that falls outside of the timeframe of this study. Typically, the commissioning of nuclear power plants occurs at least 10 years after discussions related to their construction begins.
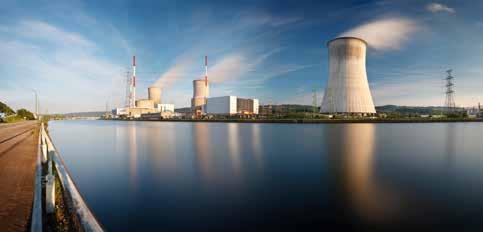
3.5.2.2. Electricity demand
When examining the evolution of the electrical demand in Europe, it is crucial to consider two significant trends: (i) the repercussions of the 2022 energy crisis; and (ii) the spread of electrification across all European countries. In the short-term, the effects of the energy crisis are noticeable when the amount of electricity consumed is examined. However, in the long term, the focus will shift towards the
The 2022 energy crisis impact on load electrification of transport, heat and industry. Over the course of the upcoming decade, from 2024 to 2034, an assumed addition of 860 TWh (equivalent to almost 30% increase) is expected to accommodate growing electrification needs. In some countries, the pace will be faster (e.g. heating relying on large shares of fossil fuel, industry plans to electrify, policy measures for residential and tertiary sectors…).
As outlined in Section 3.1.6, there was a significant rise in energy prices in 2022 that resulted in a decrease in electricity consumption for that year. However, the load trajectories for the European countries in the ERAA 2022 database did not account for this energy crisis, as they were collected at the end of 2021 and fixed for the analysis in May 2022. Consequently, the load trajectories for all European countries needed to be updated, taking into account the available historical data that reflects the observed decrease in load during 2022. This revision allows for a more accurate assessment of the future load patterns and enables the recent changes in energy consumption trends to be included. (see scenario Appendix II for more information).
To incorporate the observed reduction in electricity consumption in 2022, an estimation of the consumption is conducted for each country. These estimations are based on data from several sources such as the ENTSO-E Transparency Platform, national publications and statistical offices, or a combination of reliable sources. The consumption values are then normalised for each country and adjusted using EUROSTAT data from previous years. The revised load trajectories are depicted in Figure 3-77, which illustrates a 3% reduction in 2022 when compared with 2021 levels [IEA-6].
Relative comparison of assumed future electricity consumption in Europe
Figure 3-78 depicts the electricity consumption in Belgium and in (future) electrically connected countries. Note that this figure does not include electrolysis (these are explicitly taken into account and hence the consumption is optimised by the model based on electricity prices). Accounting for those will further increase the electricity consumption in the countries shown in the figure. The figures are based on the latest national studies combined with a correction applied for the energy crisis, as explained in the previous paragraph. The electricity consumption is normalised to the year 2022 for each country.
By comparing the different projections in Figure 3-78, similar increases are expected in most countries. Electrification will impact different sectors and will entail the massive development of EVs in the transport sector, the deployment of HPs across the residential heating sector and the electrification of industry and data centres. For France, a recent report form the French TSO which summarizes the public consultation held for their upcoming adequacy study outlines higher consumptions in the proposed base case scenario resulting from an expected acceleration of the electrification. Those are not accounted for in the figure although the consumption used in this study falls within the range proposed by the French TSO.
Figure
— EVOLUTION OF ELECTRICITY CONSUMPTION ASSUMED IN BELGIUM AND OTHER COUNTRIES NORMALISED TO 2022 (EXCLUDING ELECTROLYSIS)
Electrification of heat and transport
As explained in section 3.1.5, the electrification of passenger cars in different European countries is gaining momentum. However, even though sales reached a 20% market share in 2022, EVs only represent 2.5% of the stock of passenger cars [IEA-10].
European policies such as the ban on fossil-based cars by 2035 [EUP-1] and the inclusion of transportation in the ETS system [EUP-3] are all elements which will accelerate the electrification of the passenger cars in Europe.
The period 2023-2035 will likely see a massive uptake in the number of EVs, with sales expected to continue increasing in larger markets (such as Germany, France and the United Kingdom), particularly when compared with the relatively smaller Scandinavian market where EV’s already represent a larger proportion of the stock of passenger cars. It is expected that BEV sales will reach a market share of around 50-60% by 2030 [TRA-1]. As illustrated in Figure 3-79, more than 50 million EVs are assumed to be on European roads by the end of 2030 in the EU-BASE scenario (around 70 millions when including the United Kingdom, Norway and Switzerland).
EUBASE SCENARIO)
Additionally, several European policies are expected to positively influence the installation of new HPs. Under the ‘REPowerEU’ Plan, which aims to reduce Russian gas imports, the European Commission set a target of doubling HP deployment rates, which is due to result in nearly 60 million units being installed by 2030 according to the EHPA [EHP2]. Additionally, the inclusion of buildings in the EU-ETS system [EUR-6] should positively influence the HP business case (versus fossil-based alternatives). In addition to these meas- ures, the European Commission is also proposing – under the ‘Fit for 55’ and ‘REPowerEU’ policy packages – to set stricter limits for heating systems, implying 2029 as an end date for stand-alone fossil fuel boilers and relegating these boilers to the bottom of the energy class [SPG-1]. Some countries such as Germany and the Netherlands have indeed followed suit and have prohibited new fossil based heating systems in the short-term.
3.5.2.3. Demand side response and batteries
The evolution of DSR is closely tied to the overall increase in electricity demand across Europe, which is driven by the upcoming electrification of various processes and the flexible optimisation of existing ones. Hence the DSR capacity in the EU-BASE scenario is assumed to undergo a threefold increase over 10 years.
In the coming decade, the growth in installed capacity of batteries is assumed to increase by a factor of fifteen, from around 24 GWh installed today to over 360 GWh between 2022 and 2034. This volume can be put in perspective with the most prominent form of storage present in Europe: hydro closedloop pumped storage, which amounts around 1.3 TWh of storage by 2035 according to the ERAA database. The evolution for the battery storage is depicted in Figure 3-80.
FIGURE 3-80 — EVOLUTION OF THE STORAGE CAPACITY OF BATTERIES IN EUROPE (HISTORICAL AND ASSUMED AMOUNT FOR THE EU-BASE SCENARIO)
3.5.2.4. The Netherlands
The data used in the scenario for Dutch capacity is based on the data submitted by TenneT, the Dutch TSO, for the ERAA 2022 report as well as the latest national adequacy study published by the latter (the ‘Monitoring LeveringsZekerheid 2022’ report, or MLZ2022) in December 2022. The assumptions used in the EU-BASE are mainly based on the ‘high ambition scenario’ (HA) from the MLZ2022 [TEN-1]. Figure 3-81 gives an overview of the installed capacity and consumption assumptions taken for the Netherlands.
Nuclear
The Borssele nuclear power plant (0.5 GW) is the Netherlands’ only nuclear generation facility. It is expected to remain in service until end 2033. However, a feasibility study exploring the extension of the operation of the existing Borssele plant beyond 2033 was recently requested by the authorities. Given these uncertainties and based on the information provided by TenneT for the ERAA 2022 report, the Borssele unit is assumed to be available until the winter of 2033-34 in this study. Finally, discussions related to the construction of two new reactors at the Borssele plant site are ongoing: no official decision has yet been taken. These are not assumed to be constructed within the period covered by this study.
Coal
Coal-fired power plants are, in line with current policy and national climate ambitions, due to be completely phased out by 2030. The Dutch National Climate Agreement [KLI-1] forbids coal firing for electricity generation from 2030 onwards. Hence, it is assumed that part of the coal capacity in the Netherlands will be partially and gradually converted into biomass-fueled units.
Gas
Regarding gas-fired power plants, the ERAA 2022 report has been considered as the main reference. However, there are uncertainties regarding the capacity of gas-fired power plants in the Netherlands, as indicated by the MLZ2022. For instance, in the MLZ2022, a sensitivity with a reduction of 1.6 GW in gas capacity was considered for the years 2025 and 2030, although this is not integrated in the EU-BASE scenario.
Renewable energy sources
Given current and proposed energy policy developments in the Netherlands, wind and solar capacity is due to grow sharply in the coming years. Following a discussion with TenneT, the 2030 ‘high ambition’ scenario (HA) in MLZ2022 was chosen as the reference value for the values at the end of 2029 regarding RES capacity for the Netherlands in this study. Onshore wind capacity is assumed to reach 12 GW in 2030. Offshore wind capacity is assumed to significantly increase from 6.1 GW in 2025 to 24 GW in 2030. Solar capacity is assumed to more than triple with respect to todays’ levels, reaching 49 GW in 2030.
Electricity consumption
According to the MLZ2022 [TEN-1], a significant increase in electricity demand is expected in the coming years. This increase is linked to direct electrification being carried out in different sectors, as an important conduit for sustainability and energy savings. The development of the demand is also accompanied by an increase in flexibility e.g. via the smart charging of EVs, storage of electricity in batteries and demand side response. As for the other components for the Netherlands, the ‘high ambition’ scenario (HA) was selected as reference value for the year 2030, which is aligned with the ‘Fit for 55’ ambitions.
Finally, the ambition for electrolysers across Europe depends on each country but also on the potential renewable capacity that each country holds. While countries such as Belgium aim to mainly rely on imports, other countries are developing a strategy to produce large amounts of hydrogen locally. The hydrogen that is produced will primarily be used to decarbonise the current hydrogen consumption, representing slightly under 9 Mt, which is currently mainly produced from fossil fuels. The installed capacity of electrolysers assumed for 2030 is 55 GW for the whole perimeter covered by this study. Those are assumed to produce hydrogen only when electricity prices are below 20 €/MWh. The amount of hydrogen produced from electricity is an output of the model. The results are discussed in Chapter 7.
3.5.2.5. Germany
The assumptions for Germany are based on the ERAA 2022 alongside the updated renewable targets included in the 2022 Easter Package and the Netzentwicklungsplan (NEP2023, or grid development plan). The assumed energy supply and demand in Germany up to 2034 is displayed in Figure 3-82.
Nuclear Germany remains committed to phasing out nuclear energy. Although the plan was to close the last nuclear reactors by the end of 2022, they were kept operational until the end of the winter period of 2022-23 due to the low supply of gas from Russia. However, as of April 2023, all of Germany’s nuclear reactors have been closed down. Therefore, this study does not take into account any nuclear capacity in Germany for the period covered by the study.
Coal
In August 2019, Germany adopted the ‘Coal Phase-out Act’ (Kohleausstiegsgesetz) which aimed to gradually and completely phase out coal-fired power plants (i.e. hard coal and lignite plants) in Germany before the end of 2038 [BUN-1]. The coal exit tenders have led to several coal unit closures since then. Note that his Act lies at the basis of the German coal assumptions used in the previous AdeqFlex’21 study.
At the end of 2021, the new German Government agreed to accelerate the development of renewables and to accelerate the phase-out of coal by moving the process to an earlier year, from 2038 to 2030 [EUV-1]. Since the start of the Russian invasion of Ukraine in February 2022, some coal units have been reactivated (or reserves were put back in the market) and the planned closures of some coal-fired plants have been postponed until March 2024. However, the ambition to phase out coal before 2030 has been maintained. In November 2022, a draft law aiming to phase out coal-fired units in North Rhine Westphalia (where many of the coal plants are currently located) was approved [REU-1].
In this study, the ‘2030 coal phase-out’ in the EU-BASE scenario for Germany follows the same assumptions as in the ERAA22 (i.e. German TSOs assume the phase-out will happen by 2029, leading to no remaining available capacity at the end of 2029). In the short-term, the assumptions are based on data published by the German regulator in November 2022: the available coal-fired in-the-market capacity at the end of 2022 (including some of the reserves that have been put back into the market) and the coal capacity that is due to remain by 2025 (together with the planning of the closures) [BUN2]. This assumes that Germany returns to its coal phase-out schedule from 2024-2025 onwards, as also expected by the IEA in its ‘Electricity Market Report 2023’ [IEA-3].
Note that drought can also impact the electricity produced from coal-fired plants. During the summer of 2022, coal-fired plants in Germany faced supply shortages since boats were unable to take on enough coal because of the low level of the Rhine River [REU-2]. This is not considered in this study, as in-the-market coal plants are assumed to be fully available.
Renewable energy sources
In April 2022, the German Government passed its so-called ‘Easter package’ [BMK-1], which included a number of legislative changes and new frameworks related to renewable energy, power grids and markets.
The country is now aiming for 80% [EUV-2] of its gross electricity consumption to be covered by renewables by 2030. Additional targets included in the package are reaching 215 GW of solar capacity by 2030, 115 GW of onshore wind energy by 2030 and reaching at least 30 GW and 40 GW offshore wind energy by 2030 and 2035 respectively. The package also saw renewable energy being defined as an overriding matter of public interest and security, which should speed up the permitting processes associated with new renewable projects and reduce delays associated with legal appeals [BMK-2].
Regarding plans to reach 30 GW of offshore wind by 2030 and projects for after 2030, the assumptions are based on the ‘Flächenentwicklungsplan 2023 für die deutsche Nordsee und Ostsee [BSH-1 – see Table 17], published in January 2023. As outlined in this document, it can be assumed that most of the additional offshore capacity will be installed in 2029 and 2030 (5.5 GW and 9.5 GW respectively).
Electricity consumption
In the long term, Germany anticipates a significant surge in electricity demand attributed to the extensive electrification of various sectors. This includes the electrification of industrial processes, transportation, heating systems (such as HPs and district heating), as well as the adoption of electrolysers for hydrogen production. These developments reflect Germany’s commitment to transitioning towards cleaner and more sustainable energy sources, with electricity playing a pivotal role in powering these required changes across multiple sectors.
The government has suggested a ban on the placement of new oil and gas boilers from 2024 onwards. It is aiming to ensure that newly installed heating systems utilise a minimum of 65% renewable energy from 2024 onwards [EUV-1].
In cases where some industries reduced or ceased their operations in Germany due to the energy crisis in 2022, it seems that these will receive support from the authorities to ensure Germany’s economic recovery. In order to support the electrification of the industrial sector, Germany plans to subsidise electricity-intensive industries by taking on part of their electricity costs [FTI-1].
The assumed electricity consumption for the long-term in Germany in this study is based on ‘scenario B’ from the Netzentwicklungsplan (version 2023) [NUP-1], excluding electrolysers which are modelled separately.
Additional new capacity considered in Germany
Germany is projected to potentially face significant capacity shortages by 2030, primarily due to the planned phase-out of coal-fired power generation and the expected rise in electricity consumption, despite the country’s ambitious goals regarding RES [REN-1]. In January 2023, the German Government announced that Germany might need to build between 17 GW and 21 GW of gas-fired generation to cope with this increasing demand and the phase-out of coal [EUV-3].
No official plans have been laid out and it is not clear if this capacity will effectively be built without additional support.
Even in the absence of a market-wide capacity mechanism in place, one might assume that Germany will take the necessary actions in order to ensure its system’s adequacy, with additional new capacities or the extension of existing (coal) capacity. The process followed in the EU-BASE scenario resulted in adding large amounts of capacity across Ger- many from 2027 onwards to ensure their reliability standard is respected (as defined in the EU-BASE scenario). This leads to the addition of 20.5 GW of new capacity in 2030, 15.5 GW of which is thermal capacity (e.g. CH4 + H2) and 5 GW is non thermal capacity (e.g. DSR) (see Figure 3-82).
3.5.2.6. Great Britain
The assumptions for Great Britain mainly originate from the Future Energy Scenarios published on a yearly basis by the local TSO, National Grid ESO (NG ESO) [ESO-1]. The FES22 outlines several scenarios relating to the energy transition in Great Britain. NG ESO communicated to Elia that the ‘Consumer Transformation’ scenario, was aligned with the data included in the ERAA dataset.
The energy supply in Great Britain comprises a mix of thermal capacity (coal, gas and nuclear) with ever-increasing ambitions regarding developing renewable energy. The country is also expected to experience an impressive rate of electrification. A general overview of Great Britain’s assumed energy supply and demand up to 2034 is displayed in Figure 3-84.
Nuclear
In terms of nuclear power, the fleet in Great Britain continues to age, and several nuclear units have already been decommissioned (notably, Hinkley Point B, which was decommissioned in July 2022). By 2026, nuclear capacity is expected to further decrease by 2.4 GW (Heysham 1 and Hartlepool). By 2030, an additional 3.6 GW will be decommissioned.
The lifetimes of the Heysham 1 and Hartlepool units were recently extended. They were supposed to close in 2024, but will now operate until 2026 [REU-4]. Even though this extension has been published by Energie de France (EDF, the operator of the two units), this still needs to be approved by the Britain’s Office for Nuclear Regulation. A sensitivity (called ‘GB-noNukeExt’) will be performed on the closure of Heysham 1 and Hartlepool which will consider their extensions being refused.
Since the publication of AdeqFlex’21, the new power plants that were being planned (Hinkley Point C and Sizewell C) have already been delayed by a year. Hinkley Point C is set to start generating power in 2027 [EDF-4] (instead of 2026), and EDF is planning to build two new nuclear power plants: Sizewell C and Bradwell B. The application process for Sizewell C has already started; it is expected that its first unit will start generating power by the end of 2033, with the second unit generating power by mid-2034 [UKG-1]. The public consultation for Bradwell B is ongoing, and as it has no start-up date yet is not assumed in-the-market in this study.
Coal
As of May 2023, the British Government remains committed to phasing out coal power by 2024; several coal-fired power stations have been closed in recent years. However, as in most countries around Europe, a few coal units were maintained to generate electricity in the short-term. The last remaining coal-fired power station, Ratcliffe-on-Soar, is set to be closed down by the end of 2024, marking the end of coal power in Great Britain.
The commissioning and decommissioning dates of nuclear and coal power plants assumed in the EU-BASE scenario are included in Figure 3-84.
Gas
The largest thermal capacity in Great Britain lies with gas power plants. However, this capacity is expected to decrease through the years as combined gas capacities decrease from 38 GW to 25 GW.
Announcements related to the CRM in Great Britain are important. The results published before March 2023 regarding the 2024-25 T-4 auctions and the T-1 auctions for 2023-24 are included this study [UKG-5].
Renewable energy sources
All assumptions regarding renewable developments are based on the ‘Consumer Transformation’ scenario from the FES22 published by NG ESO. Since the publication of Adeq Flex’21, the United Kingdom has greatly increased its RES ambitions. The UK Government has unveiled plans to decarbonise the power system by 2035 [UKG-3].
The country’s offshore wind capacity was previously expected to double over the span of 10 years; now it is expected to more than quadruple, reaching 74 GW (alongside 35 GW of onshore wind capacity) by the end of 2034. Solar capacity is also expected to reach 47 GW by the end of 2034 (the target used to be 18 GW by 2032).
Electricity consumption
The demand trajectory for Great Britain used in the scenario is sourced from FES22. The scenario considers different trajectories based on short-term and long-term outlooks.
In the short-term, National Grid has provided a specific trajectory for the next 5 years, which is incorporated into the EU-BASE scenario. This trajectory takes into account various factors, including the economic impact of the COVID-19 pandemic and high energy prices observed in 2022, resulting in a lower electricity demand in the short-term from the commercial and industrial sectors.
In the long-term, the Consumer Transformation scenario from the FES22 is used, which accounts for the UK’s ambitious decarbonisation goals. The scenario anticipates a 55% increase in demand, even with assumed improvements in energy efficiency. Notably, the projections include a significant number of HP installations in residential buildings (over 1 million per year, from 2035 onwards), a large number of battery EVs on the road (>25 million by 2035), and increased electricity demand in the industrial sector (an additional 15 TWh by 2035).
Additional new capacity considered in Great Britain
As for the other markets with a market-wide CRM under the EU-BASE scenario, the amount of capacity in the zone is computed to attain its reliability standard. This results in additional capacity that is added to the system (on top of the initial dataset). This amounts to 1.8 GW of additional capacity from 2031 and 6.4 GW for 2034.
’Lifetime prolongation of Heysham & Hartlepool from 2024 to 2026 was announced in March 2023; and still needs to be approved by Britain’s Office of Nuclear Regulation. A sensitivity is performed consldering the lifetime prolongation does not take place, and units close in 2024
3.5.2.7. France
The assumptions for France are based on the ERAA22 database and have been updated with the latest available information in February 2023.
During a speech at Belfort in February 2022, the French President made it clear that France will have to rely on both nuclear and renewable energy sources in order to eliminate the use of fossil fuels and support an increase in consumption [FRG-1]. Important targets and trajectories were announced and are considered in the present study.
For the long-term time horizons, the assumptions included in ‘Futurs Energétiques’, published in October 2021, are also taken into account [RTE-1].
In order to consolidate and validate the dataset for France, the trajectories and assumptions proposed by RTE against the background of the public consultation of the next ‘Bilan Prévisionnel’ were analysed [RTE-2]. The ‘Bilan Prévisionnel’ is to be considered as the French implementation of the National Resource Adequacy Assessment. The next study should include trajectories between 2023 and 2035, with a specific focus on 2030. It will aim (among other things) to assess the challenges of electrification (even if a significant share of residential energy consumption is already electrified), the evolution of the geopolitical context and the integration of renewables into the system, while continuing to operate nuclear reactors. A public consultation for the next study which will be published after the summer of 2023 was held by RTE [RTE-6]. In June 2023, the French TSO released the findings of its public consultation regarding its forthcoming adequacy study, slated for publication in September 2023. The detailed information outlined in that publication could not be integrated in this study so close to publication.
The only notable changes from the CENTRAL scenario are a more moderate increase of the consumption in coming three years, and a higher consumption in the long term. The other assumptions for France in the EU-BASE fall within the ranges proposed by RTE. The impact of the above changes is limited given that for the long term, every country is made compliant with its reliability standard by adding capacity to the market.
Nuclear
The majority of France’s electricity generation comes from nuclear power. However, the French nuclear fleet is ageing, and the Fessenheim reactors, built in the late 60s, were the first nuclear ’units to be shut down in 2020. ‘The French Government’s previous plan, known as the ‘Programmation Pluriannuelle de l’Energie’ (PPE) in 2020 [FRG-3], aimed to reduce the share occupied by nuclear power in the energy mix to 50% by 2035, by decommissioning 14 reactors (900 MW each).
However, more recently, the French President has promised to ’retain nuclear energy as a key component of France’s energy mix. In the Belfort Speech he announced plans to:
• build six new nuclear reactors (EPR2 type), with the first reactors to be commissioned by 2035 and possibly eight more reactors to follow;
• halt the planned closure of existing reactors that are still safe to operate;
• launch a study to extend the lifetime of all reactors beyond 50 years.
The EU-BASE scenario assumes no additional reactor closure until 2034. The availability of the Flamanville ‘EPR’ reactor that is currently under construction is based on the proposal that RTE included in the public consultation documents relating to their ‘Bilan Prévisionnel’. Therefore, the reactor is assumed to be started in mid-2024 and have a partial availability [EDF-1]. Finally, it should be noted that there are still some additional uncertainties as the head of the pressure vessel needs to be replaced [ASN-1]. This operation should take between 4.5 and 9.5 months. It is assumed that the reactor will close at the beginning of 2025 for six months in order to change the lid.
The availability of the French nuclear fleet has been an important area of focus, especially in recent months, since issues have been discovered in different reactors. This underlines the importance of a careful modelling of the fleet’s availability. In the present study, the availability is based on the transparency platforms of producers in the framework of REMIT for the years where such data is available, calibrated to an estimated yearly generation output. In the absence of data on availability beyond three years, maintenance profiles used in the ERAA 2022 are considered as a basis for the other years in the EU-BASE scenario (2026 onwards). More information on the modelling of the availability of the French nuclear fleet is provided in Section 3.5.3.1, along with related sensitivities. Figure 3-86 shows the geographical location of the existing and ‘in construction’ nuclear plants in France.
Coal
The coal power plant Cordemais in France was initially scheduled to be shut down by 2022 as part of the country’s plan to phase out coal-fired power plants. However, in 2021, the French Government announced that the plant’s closure would be postponed to 2024 due to concerns about potential electricity shortages during the winter months [LEM-1]. Finally, the plant is considered as a coal-fired power plant until the end of 2027; following this, given the green light that the French Government gave to the Ecocombust project [FR3-1] Cordemais is assumed to be fully converted to a biomass-fired plant.
Gas
France has been increasing its gas-fired capacity in recent years, with several new gas-fired power plants being built. The latest gas-fired power plant, Landivisiau, was commissioned in 2022. However, the French Government has stated its commitment to not building any new gas-fired power plants in France. In this study, it is assumed that the existing gas-fired capacity in France will remain available during the whole period considered under the EU-BASE scenario. This assumption was also included in the public consultation documents relating to RTE’s next ‘Bilan Prévisionnel’.
Renewable energy sources
The French President also confirmed its intention to pursue the growth of onshore wind farms at Belfort and proposed the concept of a gradual approach towards achieving development goals. The new target for 2050 is around 40 GW (instead of for 2030). Nevertheless, the speech lacked specific details regarding the trajectory and milestones for the years to come. The next multi-year energy plan (PPE) will need to clarify the planned trajectory. The trajectory considered in this study is obtained by considering a slower installation rate compared to the ERAA22 data. This assumption is in line with the one assumed by RTE and included in the public consultation documents relating to the next ‘Bilan Previsionnel’.
The President is keen for France to work on developing the country’s solar capacity since this technology is cheaper and easier to integrate into landscapes. The goal is to increase the solar electricity production by a factor of ten by 2050, going beyond 100 GW. In this study, an increased installation rate compared to the ERAA22 data is considered in the shortterm in light of the historical installation rate.
France is also due to develop its offshore wind capacity: it aims to reach 40 GW by 2050, with the first offshore wind farm being commissioned in the final months of 2022 [FRG2]. The assumed capacity of offshore wind in this study follows the trajectory proposed in the public consultation documents relating to the next ‘Bilan Previsionnel’.
Electricity consumption
The electricity consumption in France is aligned with the ERAA22 dataset. In the short-term, before 2025, the impact of the lower consumption observed in 2022 is accounted for, leading to a slight decrease in electricity consumption. The trajectory is in line with the assumptions proposed in the public consultation documents relating to the next ‘Bilan Prévisionnel’. In the document published on 7th June by RTE [RTE-9] the electricity consumption assumed in this study falls within the ranges proposed by RTE for the long term.
3.5.3. SHORT-NOTICE RISKS RELATED TO FOREIGN ASSUMPTIONS (EU-SAFE)
The foreign assumptions applied for this study have a significant impact on the results for Belgium, as the country is strongly connected to surrounding countries and relies heavily on imports. While these assumptions are based on the most up-to-date public information and policies, important uncertainties linked to these hypotheses remain. In order to quantify the risks these uncertainties might pose for Belgium, several sensitivities are defined with regards to assumptions adopted for other countries. Note that two types of additional sensitivities are also defined with regards to cross-border exchange and electricity grid infrastructure (see Section 3.6.4).
• A first sensitivity focuses on the foreseen availability of the French nuclear fleet (‘FR-NUC’); the past couple of winters have proven that the number of planned unavailabilities do not match the actual number of unavailabilities.
3.5.3.1. French nuclear availability
The EU-BASE scenario starts from the assumption that the French nuclear fleet will follow either:
• the forecast of the French producer as published in REMIT for 2023, 2024 and 2025, calibrated to an estimated yearly generation output; or
• the maintenance profiles used in the ERAA 2022 as a basis for the other years (2026 onwards).
In addition, forced outages are drawn and added to the unavailability.
The availability of the French nuclear fleet is a key parameter that impacts Belgium’s adequacy (given the strong correlation between both countries in simulated scarcity situations).
The sensitivity was also included in the CRM calibration scenarios chosen by the Minister for Energy. Since 2017, Elia has consistently recommended a prudent approach be taken with regard to French nuclear availability. The reasons for this to: Max forecast Min forecast
• The uncertainty around support for EU countries from non-EU countries (the United Kingdom and Norway in particular) during periods of scarcity is covered through a second sensitivity (‘UK-not2EU’, ‘NO-not2EU’).
• The risk of drought in Europe (such as the drought experienced during the summer of 2022) is analysed via its impact on the production of hydroelectricity (‘EU-LowHydro’).
• The EU-BASE scenario assumes that all the countries will take the necessary steps to safeguard their security of supply. However, for countries without capacity mechanisms already in place, there is no guarantee of this happening. Therefore the ‘EU-NoNewCRM’ analyses the case where EU countries that do not have a capacity mechanism in place today do not respect their reliability standard.
Applying the methodology described in BOX 3.9 to align REMIT data with the annual EDF forecasts, one can derive the number of units projected to be taken as unavailable in 2023, 2024, and 2025, on top of the REMIT data, as illustrated in Table 3 7. The expected availability of the EPR in Flamanville is added on top of the existing fleet’s REMIT data, meaning it is not covered by the analysis.
TABLE 3-7 — NUMBER OF NUCLEAR UNITS TO BE REMOVED FROM REMIT FORECASTS IN ORDER TO MATCH EDF’S YEARLY EXPECTED GENERATION LEVELS REMIT decreased by...
The EU-BASE scenario is based on the ERAA 2022 availability profiles for 2026 onwards stance are outlined in this section. The highlighted risks have been confirmed and intensified over the past two years.
The EU-BASE scenario is based on REMIT data calibrated to the maximum expected generation forecast for 2023, 2024 and 2025.
The availability of the French nuclear fleet is calculated based on REMIT data which is calibrated to be in line with the latest EDF forecasts. The calibration methodology for 2023, 2024, and 2025 is explained in BOX 3-9. Figure 3-88 illustrates the yearly assumptions for nuclear generation and the used sources. The assumptions are based on the most recent information regarding yearly generations publicly provided by EDF for 2023 and 2024. For 2025, the values assume the same increase in nuclear generation (as expected by EDF) between 2023 and 2024. The EU-BASE scenario assumes the maximum forecasted value by EDF, while the EU-SAFE scenario is calibrated on the minimum forecasted value.
From 2026 onwards, given the absence of detailed expected nuclear availability data, the ERAA 2022 planned outages are used as basis. Sensitivities of 2, 4, 6 or 8 additional unavailable units on top of the base scenario are considered. In order to provide an indication of the profile, Figure 3-89 provides the weekly average nuclear planned availability over the year as well as the historical range (but not including the lowest availability observed in 2023).
FIGURE 3-89 — WEEKLY FRENCH NUCLEAR PLANNED AVAILABILITY CONSIDERED FROM 2026-27 ONWARDS AND COMPARED TO THE PREVIOUS AVAILABILITY
BOX 3-9 — MATCHING THE REMIT AVAILABILITY AND EDF’S PRODUCTION FORECAST
Just like for any unit above 100 MW, REMIT availability data for the French nuclear fleet is available for the next three years on ETP. In addition, EDF also publishes yearly generation forecasts [EDF-2] which are lower than the potential production indicated by the REMIT availability data. By combining this publicly available information, scenarios for French nuclear availability in 2023, 2024, and
2025 can be derived. The methodology, initially proposed by Elia for the LCT scenario definition, was subsequently modified by the FPS Economy so that it only takes into account the impact of the winter period. The steps of the methodology are illustrated in Figure 3-90 and described in more detail below
FIGURE 3-91 — WEEKLY NUCLEAR PLANNED AVAILABILITY IN FRANCE BASED ON REMIT DATA
Weekly max since 2012
1 Starting from the theoretical generation of the French nuclear fleet (without any outages):
The theoretical maximum generation is derived by assuming that the installed capacity is 100 % available over the entire winter period without any outages.
2 Removing planned outages announced under REMIT:
The sum of the planned outages for the winter period according to REMIT is removed from the theoretical maximum.
3 Removing forced outages:
To account for unforeseen forced outages, an estimation of their occurrence needs to be factored into the figures. The value used, as indicated in ERAA22 and provided by RTE, is 5.3%.
After steps 1, 2 and 3, the expected availability of the French nuclear fleet as provided by EDF under REMIT is obtained.
4 Starting from the EDF yearly forecasts:
EDF provides yearly estimates of nuclear generation in France. If those are not available, an estimation or assumption is required.
5 From yearly to winter generation forecasts:
To estimate the capacity that would be unavailable during the critical winter period, the yearly forecasts are converted into winter forecasts. This step, recommended by
Ku = 93%; ‘utilisation factor’ due to environmental, societal and regulation constraints, client’s consumption, ancillary services and optimization
There are several reasons to deviate from the REMIT data as published by the nuclear producer in France
Yearly expected generation (based on yearly EDF forecast) the FPS Economy in the LCT scenario, was introduced to reflect the increased demand for adequacy during winter. Historical monthly generation data indicates that nuclear generation in France typically increases by approximately 20% during the winter months, which run from November to March (inclusive).
6 Taking the ‘utilisation’ factor of the nuclear fleet into account:
The generation forecast provided by EDF can be converted into an expected availability forecast using the average historical ‘utilisation’ factor reported by EDF. The utilisation factor (Ku) represents the proportion of energy produced compared to the total availability of the nuclear fleet. According to EDF’s official documentation, the utilisation factor takes into account various factors such as environmental, social, and regulatory constraints, consumer consumption patterns, and ancillary service delivery. Based on historical data, a utilisation factor of 93% can be considered representative for future projections.
7 Difference between steps 3 and 6 expressed in equivalent amount of units
The difference between the expected availability calculated from EDF yearly forecasts and availability calculated from REMIT availability data can be derived from steps 3 and 6. The difference in energy can be translated into an equivalent number of nuclear units (of 900 MW). This is the amount that is removed from the REMIT availability data in order to match the yearly forecasts.
Despite the efforts undertaken by French nuclear producers to maximise unit availability and carry out necessary maintenance work on time, there are compelling reasons to adopt a cautious (and more realistic) approach to projections regarding French nuclear availability. Over the past decade, nuclear unavailability in France has increased significantly, reaching unprecedented levels (as shown in Figure 3-92). Analysis of REMIT availability data from the past 8 years, which provides information about the expected unavailability of each nuclear unit, reveals a consistent underestimation of unavailability rates when published a few months before the winter. This observation holds true when comparing initial winter forecasts with realised figures after the concerned winter period (more details can be found in scenario Appendix VI). Publicly available data from EDF is used for this analysis, including announcements of planned unavailabilities for each unit.
Figure 3-92 presents:
• the average number of units (assuming a capacity of 900 MW) forecasted to be unavailable during over several winters;
• the number of units that were actually unavailable (excluding forced outages) in addition to the forecasted amount before the winter periods in question (unavailability that was unplanned before the winter).
Over the past 8 winters, these underestimations ranged from at least 3 units during the winter of 2018-19 to 17 units during the most recent winter of 2022-23. It is also clear that unpredicted unavailability has been increasing since the winter of 2018-19. These findings justify the adoption of a more cautious approach to French nuclear availability.
There are many uncertainties regarding the future nuclear availability in France (these are further detailed with sources in a dedicated scenario appendix VII), as outlined below.
• The French nuclear fleet is experiencing a major overhaul, as the lifetime of its ageing fleet is extended beyond 40 years. These extension works will last for at least a decade. Afterwards, new extension works will need to be performed after the fleet has reached an age of 50 years, as the assumption is that no additional decommissioning would take place in the coming decade.
• The discovery of issues linked to stress corrosion in several reactors has led to a large number of additional checks, maintenance work, unforeseen repair works, etc. and the impact of these repairs has greatly modified the initial maintenance plans (which were already very extensive, due to the lifetime extension work, and the impact of the COVID-19 lockdown restrictions). The issues related to stress corrosion are also due to be verified in 2024 and 2025 in several reactors.
• All scenarios explored in this study assume that the new ‘European Pressurized Reactor’ (EPR) in Flamanville will be online from mid-2024 onwards and will be partially available in Q3 and Q4 of 2024. Based on the recent public consultation of RTE for their next adequacy study, the unit should be closed for 6 months at the beginning of 2025 and is due to become fully available from mid-2025 onwards. The go-live date of this unit was originally planned to be 2012 and has been postponed several times over the past years. If any further delays in the commissioning of the unit arise, this could lead to a 1.6 GW drop in French nuclear capacity.
• In addition, France’s ageing nuclear fleet could be subject to similar events in future (aside from issues linked to stress corrosion), as the fleet is very vulnerable to generic issues given the fact that the same technological conception was used in each of the reactors (a similar situation was already experienced during the winter of 2016-17).
• In its recent ‘Futur Energétiques 2050’, RTE outlines that it expects that the nuclear uncertainty to be about 100 TWh in 2030, which corresponds to around 11 GW in terms of capacity if spreads equally over the year.
• As part of a recent public consultation on their upcoming adequacy study, RTE proposed that it would assume that the existing nuclear fleet’s generation in France would amount to around 350 TWh in 2030, well below the ten-year average of 395 TWh.
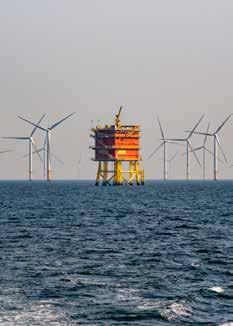
Therefore, several sensitivities are included in the present study.
The ‘FR-NUC’ sensitivities applied to the French nuclear availability (to reflect the situation observed over the last few winters and to take into account the consistent underestimation of French nuclear outages than the forecasts) are as follows:
For the years before 2026:
• the EU-BASE scenario is based on REMIT data calibrated to the maximum expected yearly generation forecast by EDF;
• the EU-SAFE is based on REMIT data calibrated to the minimum expected yearly generation forecast by EDF.
For the years after 2026:
• the EU-BASE scenario takes into account the planned unavailability used in the ERAA 2022 study;
• 2 units are considered ‘additionally unavailable’ for the whole of winter: ‘FR-NUC2’;
• 4 units are considered ‘additionally unavailable’ for the whole of winter: ‘FR-NUC4’ (also used as a reference sensitivity for the EU-SAFE scenario);
• 6 units are considered ‘additionally unavailable’ for the whole of winter: ‘FR-NUC6’; i More details regarding the French Nuclear availability can be found in Appendix VI and VII
• 8 units are considered ‘additionally unavailable’ for the whole of winter: ‘FR-NUC8’.
3.5.3.2. Export limitations
In the EU-BASE scenario, a perfect cross-border solidarity in Europe is assumed. When certain countries experience scarcity, electricity will mainly flow towards them from countries not experiencing the same scarcity. Moreover, it is assumed that the impact of each scarcity event is shared between each country that experiences a shortage.
While the first assumption is indeed driven by financial motives, the second assumption is much less straightforward, given that electricity prices in countries experiencing scarcity skyrocket. Indeed, when shortages occur, countries could be encouraged to avoid unsupplied demand within their borders by (for example) disallowing transit flows through their grids, or blocking electricity exports through their interconnectors. These measures are against the rules of curtailment sharing and solidarity.
The risk of such measures being taken is low in the European Union, as several legal rules and principles have been put in place to avoid such behaviour. However, non-EU countries are not necessarily bound by the same agreements.
As part of a robustness check, and to quantify the impact of reducing market flows across interconnectors coming from non-EU countries, two sensitivities are performed: one related to electricity imports from Norway to Europe; and one related to electricity imports from the United Kingdom to Europe.
Norway
Norway is one of the largest exporters of electricity in Europe: its extensive hydropower resources make it a major player in the regional electricity market. However, during the summer of 2022, Norway considered limiting its export towards Europe because of low reservoir levels. The Norwegian water and electricity management authority requested that electricity producers reduce their production, even though electricity prices were rising, to allow reservoirs to replenish by the autumn and prevent a potentially serious energy crisis [LMO-2]. A sensitivity is therefore proposed as part of the EU-SAFE scenario, called NO-Not2EU which consists of not counting on the interconnectors from Norway to the rest of Continental Europe and Great Britain (as detailed in Figure 3-93).
Great Britain
The United Kingdom left the European Union in February 2020, which had a major impact on all levels of interaction between the EU and the UK. Regarding the cross-border trade of electricity, Brexit brought about some important changes: the UK is no longer part of the Internal Electricity Market, meaning (for example) that cross-border capacity is no longer allocated through day-ahead implicit market coupling.
Belgium and its neighbours share strong electrical links with the UK through Nemo Link, the IFA interconnectors, ElecLink and the Britned cable, which run between the UK and Belgium, France and the Netherlands respectively. Several projects are also being considered and are due to be commissioned in the coming decade (including NeuConnect, GridLlink or Nautilus).
The base assumption made throughout this study is that electricity will freely flow across all interconnectors between the UK and continental Europe, without any political restrictions, both under normal circumstances and when there are shortages. As a robustness check and to quantify the impact of reducing market flows across these interconnectors in terms of scarcity in the UK, and assuming that the UK decides to avoid unsupplied demand within its borders, the ‘UK-not2EU’ sensitivity is created. In this sensitivity, all interconnectors between the UK and continental Europe and between the UK and Norway are assumed to be unavailable at times of scarcity in the UK. This is illustrated in Figure 3-93.
3.5.3.3. Drought
In recent years, Europe has experienced several severe droughts. The risk of such events is expected to increase over the next few years due to climate change. Droughts not only affect the availability of water for drinking and irrigation but also have a significant impact on the production of hydroelectricity.
Hydroelectric power generation relies on the flow of water in rivers and reservoirs. Droughts can cause the water levels in these bodies of water to drop, reducing the amount of electricity that can be generated. In extreme cases, hydroelectric power plants may have to shut down entirely, as water levels fall below the minimum levels required for their safe and efficient operation.

The impact of drought on hydroelectricity production can be felt across Europe. For example, in 2018, a severe drought in Europe caused the hydroelectric power production to drop in Northern countries but also impacted the pumped-storage units in Belgium [LSO-1]. More recently, the drought experienced in summer 2022 also impacted the whole of Europe [JRC-2].
In order to account for such risks, a sensitivity EU-LowHydro’ is performed where the overall production of hydropower generation is reduced by 13%. This percentage originates from a comparison between the average production across all climate years and the production of the 3 climate years where hydro production is at its lowest. The reduction is not uniform across Europe, but differs between countries in line with their hydro generation potential.
It should be noted that the sensitivity analysis presented above does not take into account other possible impacts of drought. When water levels in rivers and canals are low, other types of power plants may also be affected. This is because some power plants require water to cool down their processes (e.g. nuclear plants) or transport fuel. For instance, during the 2022 drought, nuclear power production in France decreased as a precautionary measure to ensure the safe cooling of its nuclear plants, while coal-fired power production in Germany also declined due to the low level of the Rhine River, which restricted the passage of ships carrying cargoes of coal.
3.5.3.4. No new CRM in Europe
The EU-BASE scenario assumes that from 2027 onwards, all countries comply with their reliability standard in the market (or 3 hours if unknown). Indeed, if they do not comply with it, additional capacity is added to the market in each relevant country. This process assumes that all countries develop new capacities in the market (or extend the dates for planned closures) which would not be developed without additional measures.
Therefore, an additional sensitivity is constructed called ‘EU-NoNewCRM’. This sensitivity relates to the risk that no new market-wide capacity mechanisms are put in place in Europe or that no lifetime extensions of existing units that are due to be closed (mainly coal) are undertaken. It therefore only retains the in-the-market capacity mechanisms that are already in place in the concerned countries; it does not retain the introduction of in-the-market new capacity mechanisms for other countries. As a consequence, there is no assurance that countries without market-wide capacity mechanisms remain at their reliability standard. The sensitivity is performed by applying an EVA in several countries. Only the economically viable new capacity is added to the system while keeping the countries with a market-wide CRM at its reliability standard.
3.6. CROSS-BORDER EXCHANGE CAPACITIES
Cross-border exchange capacities are modelled taking into account the expected grid projects and market design changes. The model simulates the European market with flowbased constraints within the Core region complemented with Advanced Hybrid Coupling (AHC) and Standard Hybrid Coupling (SHC) between Core and non-Core countries and Net Transfer Capacities (NTC) for the links outside of Core. Several figures are provided to illustrate the possible exchange capacities between countries.
3.6.1. NTC MODELLING BETWEEN TWO NON-CORE COUNTRIES
For trading between non-Core countries, ‘Net Transfer Capacities’ (NTC) are defined. These correspond to fixed maximum allowable commercial exchange capacities between two bidding zones. They are illustrated in Figure 3-94. Values are taken from the most recent dataset available from ENTSO-E and from exchanges with other TSOs.
Exchanges* outside of Core are modelled in NTC
Exchanges* from non Core countries to Core modelled as external flows (Assumed AHC as from 2025-26)
Channel interconnectors assumed as SHC for all time horizons
Considered cross-border capacity in 2025 (Considered additional cross-border capacity in 2030)
Exchanges inside of Core are modelled via flow-based
* the value displayed is the NTC in one direction for cross country exchange only (it can sometimes differ for the other direction) i Further details on cross-border capacities are described in Appendix L.
Only NTC values for cross country links are shown on the figure. NTCs are also considered for the bidding zones within Italy, Denmark, Norway and Sweden.
3.6.2. FLOW-BASED PARAMETERS
This section provides an overview of the main parameters required to generate flow-based domains across different target years, as illustrated in Figure 3-95.
3.6.2.1. Target years and grid assumptions
Five future years were used to create new flow-based domains. Those were allocated to the different target years of this study. The Core flow-based domains were created for:
• 2023 (used for target year 2023-24);
• 2024 (used for target year 2024-25);
• 2026 (used for target year 2025-26, 2026-27 and 2027-28);
• 2030 (used for target years 2029-30, 2030-31 and 2031-32);
• 2034 (used for target years 2032-33, 2033-34 and 2034-35).
In order to create those domains, the evolution of the Belgian grid is based on the projects contained in the approved Federal Development Plan 2024-2034 [ELI-5], whereas the Core grid is based on the available TYNDP reference grid for each future year on which a flow-based domain was created. For the external grid (outside or to/from the Core region), the capacities have been updated for each target year based on the years considered in the TYNDP and other available information.
3.6.2.2. Core perimeter and treatment of external flows
As it is explained in the methodology Appendix L, flow-based market coupling was adopted across the Core region in June 2022. Core is therefore modelled as a flow-based region for all years of this study. Flows between non-Core countries are modelled as NTC and interactions between the flowbased region and countries beyond Core are modelled using Standard Hybrid Coupling (SHC) until the year 2024. ALEGrO was always considered as an additional variable (additional degree of freedom) in the flow-based domains, introducing a thirteenth variable into the “Power Transfer Distribution Factor” (PTDF) matrix, in addition to the 12 variables corresponding to the Core bidding zones’ net positions. As of 2025, external flows are modelled using Advanced Hybrid Coupling (AHC), except for interconnectors with Great Britain where Standard Hybrid Coupling (SHC) is used. This increases the complexity of the model. Indeed, the number of variables (i.e. the number of columns in the PTDF matrix) increases by one for each external border and/or external link treated in AHC.
It is also important to note that since the United Kingdom’s exit from the European Union, since 1 January 2021, the bidding zone of Great Britain does not participate in Single DayAhead Coupling (SDAC) and Single Intraday Coupling (SIDC). To represent the switch from an implicit to an explicit allocation, channel interconnectors are modelled as Standard Hybrid Coupling (SHC). In addition, the DC part of the PEZ is modelled as an offshore bidding zone. More explanations can be found in the methodology Appendix L.
Switzerland (CH) is currently not participating in the flowbased market coupling. At the time of writing, significant uncertainties still exist both in terms of the rules for the inclusion of Swiss network elements in the computation of cross-border exchange capacities within Core as well as in the computation of NTCs for cross-border exchanges across Core-CH borders. Given such uncertainties and in order to maintain consistency, the modelling of the CH borders to Core is kept to AHC, representing the most efficient approach to allocate capacities.
3.6.2.3. CNEC selection and loading
The critical network element and contingencies (CNEC) selection defines which grid elements from the common grid model can be taken into account in the calculation of the flowbased domain. In CWE flow-based, the 5% PTDF rule (meaning the CNEC is at least 5% sensitive to a net position change of any of the Capacity Calculation Regions (CCR) bidding zones) was used as threshold for the determination of CNECs. In Core flow-based, the 5% threshold is still considered. Currently, the Core DA Capacity Calculation Methodology (CCM) puts forward a more stringent requirement and stipulates that by 18 months after the go-live of Core FB DA CC
• Core TSOs have to evaluate the impact of increasing the 5% threshold to 10% or higher;
• Core TSOs have to submit a request to include internal CNECs, since by default only cross-borders CNECs would be allowed to limit the market. In this request, Core TSOs have to prove that it is more beneficial, from an economical point of view, to incorporate an internal CNEC into the flow-based calculation, rather than applying redispatch, performing a bidding zone split or introducing network investments.
However, the target model for Core flow-based is still to have only cross-border CNE’s limiting the market. Therefore, despite the annulment of the Core CCM [CCR-1] by the EU General Court [EUJ-1], in the absence of any legally approved amended version of the Core CCM, and due to the uncertainty around the CNEC selection, the existing Core CCM [CCR-1] still remains the main available reference.
Hence, for this study, cross-border CNECs and internal CNECs that show a sensitivity of 5% or more to at least one net position change are selected for the creation of the flow-based domains for the target year 2023 (‘XB CNECs + internal CNECs 5%’). For later time horizons, the assumption is that only cross-border CNECs can limit the flow-based domains. Sensitivities in relation to these assumptions are considered in this study (see Section 3.6.4.1).
Furthermore, when creating flow-based domains for this study, it is also assumed that no grid maintenance is planned throughout Europe in the winter periods. In other words, while the impact of single contingencies is taken into account through the CNEC definition process, it is assumed that prior to a contingency, the European transmission grid is always fully available and operational. For the winter months (when focusing on the representation of scarcity events), this optimistic assumption is retained; for summer months, however, assuming that there will not be any grid maintenance is deemed unrealistic. As a proxy for this reduced availability of the transmission grids, the domains generated for the summer months assume a fixed RAM of 70% applied to the fully available transmission grid. This approach does not impact the adequacy requirements calculated in this study, as the stress situations occur during winter periods for Belgium.
Finally, while following the methodology presented in Appendix L, the calculated RAMs have a maximum possible value equal to the technical transmission capacity of each considered CNEC.
3.6.2.4. Controllable devices
Use of PSTs in capacity calculation
A cross-border phase shifting transformer (PST) is a controllable device which can redistribute cross-border flows. In the context of the Clean Energy Package (CEP), TSOs can first use PSTs to optimise loop flows in order to comply with minRAM requirements. Thus, in the capacity calculation phase, a part of the range of the PST is defined, per PST, to increase the domain in the likely market direction. This part is equal to 50% of the tap range for Belgian PSTs and equal to 33% of the tap range for the other PSTs in Core. If, after this initial PST setpoint optimisation, some taps of the PST range are still unused, the remaining flexibility of the PST can still be given to the market for further economic optimisation (welfare maximisation).
HVDC in capacity calculation

Similar to a PST, an HVDC connection is a controllable device that can redistribute cross-border and internal flows. Again, both loop flow optimisation and welfare maximisation are possible uses of an HVDC connection. For the latter, in the capacity calculation phase, the setpoint of the HVDC can be optimised to increase the domain in the likely market direction. Currently, there are no cross-border HVDCs that are optimised this way during capacity calculation. Alternatively, the market will determine HVDC setpoints in order to optimise welfare at capacity allocation. ALEGrO is currently the only cross-border HVDC within the Core CCR and is optimised in the capacity allocation. No other cross-border HVDCs are at this moment expected to be commissioned between Core countries until 2034.
Figure 3-95 summarises the capacity calculation assumptions for the Core zone together with a list of key investments planned in the Belgian grid. The exact dates of the projects can be found in the latest Federal Development Plan for 2024-34.
BOX 3-10 — MINRAM, DEROGATIONS AND ACTIONS PLAN
Until June 2022, the 20% minRAM requirement was in place within the CWE flow-based area. This threshold relates to the minimum share of the CNEC’s thermal capacity which had to be offered to the market for CWE exchanges. With the go-live of Core FB DA CC in June 2022, the 20% minRAM requirement has still been applicable, but now has the Core exchanges as its scope. It is expected that when AHC is implemented in the Core region, the 20% minRAM requirement will be applicable for Core exchanges and exchanges resulting from bidding zone borders upon which AHC is applied.
Since the beginning of 2020, the CEP has been in force. Therefore, a 70% minRAM has to be offered to the market for all commercial exchanges. Countries are not expected to apply this minRAM change overnight; the CEP package outlined 2 options: installing a national action plan or applying for a derogation. However, from 31/12/2025 onwards, the 70% minRAM requirement has to be applied rigorously to all CNECs. These countries have to meet the linear increase in their minRAM targets on the road to 70% in line with their action plans. Countries can also gain derogation plans based on foreseeable grounds.

The application of these minimum capacity requirements in the operational processes comes along with a validation of the operational security. In cases where operational security cannot be maintained, despite the use of non-costly and costly remedial actions, TSOs are allowed to reduce the capacities as a last resort measure. More information regarding this validation step can be found in Appendix L, section 3.6.
The different minRAM trajectories used during the creation of the flow-based domains are summarised in Figure 3-96 based on the information available at the time of the creation of the domains (see [ACE-6]). Various countries have put in place an action plan, while Belgium requested a derogation that is expected to be reintroduced until the externalities justifying such a derogation have been resolved.
FIGURE 3-96 — MINRAM TRAJECTORIES ASSUMED IN THIS STUDY
BOX 3-11 — THE ELIA FLOW-BASED DOMAINS PROCESS IN A NUTSHELL
Over the years, Elia has developed a process which allows the creation of flow-based domains for future years based on the future grid, foreseen market arrangements, future evolution of the electricity mix, etc.
The process is illustrated in Figure 3-97. For each target year where a flow-based domain was computed, the initial loading of each CNEC is computed. This initial loading is then increased with virtual minimal margins to reach the minRAM target defined for each market zone. A domain for each hour of the year is obtained. The full set of domains is reduced using a two-level clustering approach to create typical day domain clusters. This reduced number of domains allows the adequacy simulations to stay within acceptable computation times. The chosen domains are then mapped based on climate variables. The final step is then to allocate these clusters based on the climatic data in the adequacy model.
Determination of initial loading of CNECs without cross-bidding zone commercial exchanges
Hourly market simulation
Determine representative domains to be used in the market simulation by a 2 level step clustering
Clustering on shape
Determine climatic correlation for each representative domain
Adequacy simulation using the clustered domains plan 2020-2025; Derogation for 2022 (related to floop flows & noncoordinated transit flows); max value of linear target provided in the figure.
3.6.3. ILLUSTRATION OF FLOW-BASED DOMAINS OBTAINED
Just as it is impossible to capture all details of the 3-dimensional shape of an object (e.g. a pyramid) through any 2-dimensional projection, it is generally not possible to capture all dimensions of a flow-based n-polytope by a 2-dimensional surface projection.
Since the switch to the Core region and the use of AHC to represent exchanges between Core countries and other countries, the flow-based complexity has significantly increased, reaching 41 dimensions (Core + ALEGrO + AHC) in this study. With such a high number of dimensions, it not possible to create fully representative 2D projections of the n-polytope (i.e. create 2D projections of the n-polytope while allowing up to 41 dimensions of the polytope to take any possible value simultaneously). It is also important to remember that the domain projections of this study incorporate margins of reserved capacity specifically for (SHC) Channel interconnectors.
Furthermore, and as explained in Appendix L, in order to even make these projections possible, it is necessary to select a subset of ’relevant’ desired dimensions for the 2D projection while fixing the other dimensions. For the sake of clarity, this ‘reduction’ in the number of dimensions was only necessary in order to be able to create 2D representations of the n-polytope, for illustration and clustering purposes. This ‘reduction’ is not needed nor used when implementing the flow-based linear constraints in the assessment (41D PTDF-RAM linear constraints are provided to the model).
In this section, figures will show domains created with a focus for the winter period as these are the most relevant for adequacy; one for the weekend; two for peak hours during week days; and two for off-peak hours during week days. All combinations of projections are possible, but the emphasis will be on the BE-FR projection. This choice was made to retain consistency with previously presented figures and because FR and BE are key dimensions for examining Belgium’s adequacy due to the high correlation of simulated scarcity situations between both countries in the past. Other projections will also be shown for illustrative purposes and to show the variations of the domain depending on the dimensions used for the projection.
Figure 3-98 illustrates the five different domains for the target year 2026. Working day peak 1 and non-working day domains are the most constraining ones in the third quadrant (in a situation where both FR and BE are importing, as shown in the bottom left of the figure) for this specific projection, while the others (working-day peak 2 and working day off-peak) are less constraining in this 2D projection when looking at the third quadrant.
towards Core + external links [MW]

Figure 3-103 displays the 2D projection for 2 domains, 2023 and 2024, for a working day peak hour in which the external flows are treated in SHC and hence these dimensions are not represented in the domain. The axes of the figure represent the net positions of Belgium and France towards Core. Figure 3-104 displays the 2D projection for 3 domains: 2026, 2030 and 2034 for a working day peak hour. The external flows, except the Channel borders, are considered in AHC and each of them is considered as an extra dimension of the domain. The axes correspond to the net position towards ‘Core + the external AHC links’. In summary, in SHC, imports from external borders are simply not integrated into the flow-based domain calculation, while in AHC, these external borders are considered in the flow-based calculation as extra dimensions (see Appendix L for more details). The difference in the size of the domains is due in particular to the fact that the 2024 domain does not include internal CNECs as opposed to the 2023 domain.
3.6.4. SHORT NOTICE RISKS RELATED TO AVAILABLE CROSS-BORDER EXCHANGE CAPACITIES
Several reasons can be proposed to justify the addition of sensitivities on the applied cross-border exchange capacities as part of the ‘EU-SAFE’ scenario in the context of this study. Two types of sensitivities are studied and described in
3.6.4.1 minRAM targets
These sensitivities are defined by variations in the minRAM targets.
BOX 3-10 describes the rules and principles that exists in relation to the minimum availability of transmission capacities for cross-border trade. In exceptional circumstances, the minRAM requirement might need to be set below the targeted legal threshold by a TSO, in order to maintain operational security (see CEP article – 26.3 [EUC-16] and “RAM coordinated (CVA) and individual validation (IVA)” - BOX 3-10).
This type of event cannot be excluded and a 70% minRAM can therefore not be guaranteed at every hour and on every CNEC. The circumstances leading to these situations might happen at relatively short notice, making it difficult for the market or for countries to handle these short notice risks in a reactive way, hence requiring some form of anticipation.
The complexity and uncertainties linked to the forecasting of remedial actions (RA) are one of the main factors justifying the possibility that such operational security exceptions could occur during the period covered by this study. Such exceptional circumstances might arise during near-scarcity periods. These situations can even lead to the application of the 20% minRAM target as a ‘fallback’ solution during some hours. Examples of this are currently reported by TSOs in the ‘message board’ of the JAO allocation platform [JAO-1].
Sensitivities related to the applied flow-based domain could be further justified in order to capture the potential delay in meeting the 70% minRAM target. Any country that would be facing unforeseen difficulties to meet the legal target could still legally request an exemption after 2025.
Furthermore, the current legislation does not exclude the inclusion of grid elements internal to a bidding zone in the CNE list, as mentioned in section 3.6.2.3 above. Given that the flow-based domains calculated in this study only consider cross-border CNECs from 2024 onwards, decreasing the available margin on those cross-border CNECs can be considered as a proxy for the inclusion of internal constraints in the market coupling.
If a country is facing systemic difficulties in relation to meeting the CEP requirements, a bidding zone split could be used as a solution. In August 2022, ACER proposed several alternative bidding zone configurations for Germany, France, Italy, the Netherlands and Sweden [ACE-10]. Following ACER’s proposal, TSOs have 12 months to conduct a bidding zone review and provide a recommendation on whether to keep or amend the existing bidding zones. At the time the computation of the domains for this study was being undertaken, no recommendation was available. A potential modification of the bidding zone configuration could however have an impact on Belgium’s adequacy situation.
Finally, as mentioned earlier, in determining the flow-based domains for winter periods, the optimistic assumption that this section: sensitivities on the minRAM targets (‘XB-RAM’) and sensitivities on transmission grid investments in Europe (‘XB-Delayed’). the transmission grid is always fully available was made for this study. While covering the potential impact of any single contingency taking place, prior to such a contingency, a European transmission grid without planned outages and without forced outages that cannot be quickly repaired was assumed.
The above mentioned arguments justify the application of the following sensitivities in this study, to assess the impact of such events:
• one sensitivity applied for the years 2023, 2024 and 2025 considering a fixed RAM 20% for all cross-border CNECs: ‘XB-RAM20’;
• two sensitivities for the years 2025, 2026, 2028, 2030 and 2034 fixed RAM 50% and fixed RAM 70% called ‘XB-RAM50’ and ‘XB-RAM70’ respectively.
These sensitivities are also in line with Art 3.6(f) ‘variations on cross zonal capacities’ of the ERAA methodology.
Illustration of the flow-based domains applied for the sensitivities
Figure 3-105 shows the fixed RAM 20% and 50% domain in comparison with a working day peak domain and the non-working day domain for the 2024 target horizon. It should be noted that for 2024, all exchanges between Core and other countries are SHC and are therefore not included in this representation.
Figure 3-106 displays the fixed RAM 50%, 70% and 100% domains in comparison with a working day peak domain and a non-working day domain for the 2026 target horizon. The 100% domain is included in the figure for illustrative purposes (but no sensitivity is performed).
FIGURE 3-106 — FLOW-BASED DOMAINS: FIXED RAM SENSITIVITIES AND WORKING DAY PEAK AND NONWORKING DAY DOMAINS FOR 2026
3.6.4.2. Investments in the transmission grid in Europe
European transmission grids are continuously being developed. New interconnectors are constructed, existing cross-border links are reinforced, and transmission grids internal to the bidding zones must be upgraded in order not to create internal bottlenecks. The latter is especially key given the context of EU Regulation 2019/943, and the agreements concluded related to the Core capacity calculation region.
Cross-border transmission capacities are obviously key parameters for assessing the adequacy of an interconnected system. The base assumption applied throughout this study contains the timely realisation of all planned grid projects as communicated to ENTSO-E by all concerned TSOs. Many of these projects have not been confirmed yet, and even in cases when they have, several events could lead to delays, such as permitting issues.
Additionally, and in line with the legal arrangements described above, focus is placed on the elimination of bottlenecks which are internal to a bidding zone. As further cross-border reinforcements generally increase potential internal bottlenecks, TSOs could be incited to delay interconnector projects in order to first reinforce their internal grids.
- Ireland – United Kingdom – 750 MW MARES interconnector (project ID: 349);
- France- Ireland – 700 MW Celtic interconnector (project ID: 107).
For 2034, the grid for the Core region stays the same but some links from/to Core are reduced by 4,100 MW:
- Switzerland – Germany – 700 MW Beznau – Tiegen line (project ID: 231);
- France – United Kingdom – 1,400 MW France-Alderney-Britain interconnector (project ID: 253);
- Netherlands – United Kingdom – 2,000 MW interconnection (project ID: 260).
Capacity Reductions Taken Into Account
BE net position towards Core + external AHC links [MW]
Similar to the illustration for 2026, Figure 3-107 illustrates the 2030 sensitivity domains in comparison with a working day peak domain and a non-working day domain. One can notice that the import capacity of the two domains illustrated are within the 70% fixed RAM and the 100% fixed RAM.
FIGURE 3-107 — FLOW-BASED DOMAINS : FIXED RAM SENSITIVITIES COMPARED TO DOMAIN WORKING DAY PEAK AND NON WORKING DAY FOR 2030
Some of the projects already assumed for the different time horizons have not yet been started. Recent history has indicated that some projects were delayed for diverse reasons.
In order to assess the risks that might arise for Belgium’s security of supply, a ‘XB-Delayed’ sensitivity was applied (as part of the ‘EU-SAFE’ scenario) on the set of planned transmission grid investments. This sensitivity was constructed for 2030 and 2034 and is illustrated in Figure 3-108.
For 2030, a 10,650 MW reduction in cross-border capacity between Core and non-Core bidding zones:
• the planned internal and cross-border reinforcements as well as the minimum RAM applied with in Core are left untouched, hence these correspond to the same assumptions as in the EU-BASE scenario;
• some of the planned increases in cross-border capacity between the Core bidding zones and the other regions are reduced. The reduction is based on links and projects which are supposed to be commissioned between 2025 and 2030 (with their corresponding TYNDP ID):
- Lienz – Venice province – 500 MW between Austria and Italy North (project ID: 375);
- Germany – Switzerland – 500 MW line between Bickigen and Chippis (project ID: 1103);
- Switzerland – Italy north – 1,000 MW Greenconnector project (project ID: 174);
- Germany – Sweden – 700 MW Hansa Power Bridge I interconnection (project ID: 176);
- Germany – Great Britain – 1,400 MW Neuconnect interconnector (project ID: 309);
- France - Spain – 2,200 MW for the Biscay Gulf interconnector (project ID: 16) and the Navarra-Landes interconnector of 1,500 MW (project ID: 276);
- France – Great Britain – 1,400 MW GridLink interconnection (project ID: 285);
3.6.5. UNCERTAINTIES REGARDING TRANSMISSION GRID INVESTMENTS IN BELGIUM
In Belgium, several infrastructure projects can also impact the adequacy requirements of the country.
The central assumption applied throughout this study includes the timely realisation of all planned grid projects as communicated in the Federal Development Plan 202434 approved by the Minister of Energy in May 2023. Several events could lead to delays, such as permitting or construction delays.
In terms of the Belgian backbone the study investigated possible delays to two projects which could have a major impact on adequacy in the coming decade, as outlined below.
• In order to integrate new offshore wind farms located in the North Sea into the grid, two onshore grid reinforcement projects are a prerequisite: ‘Ventilus’ and ‘Boucle du Hainaut’.
The Boucle du Hainaut project will link the Courcelles and Avelgem substations together. These projects are required to evacuate the offshore wind generated in the new Princess Elisabeth Zone and transport it across the upcoming additional interconnector with Great Britain (Nautilus).
A delay in the realisation of these projects will reduce the contribution that offshore wind and Nautilus can make to
Belgian adequacy. This sensitivity studies the impact of a 2-years delay in the realisation of the Boucle du Hainaut project (and therefore of Nautilus and of the additional offshore wind generation as well) on Belgium’s adequacy.
• The Gramme-Rimière project will allow the new CCGT unit of Flémalle (contracted as part of the CRM Y-4 auction for the 2025-26 delivery year) to be connected to the grid. Any delays related to its permitting or construction will have a direct impact on the availability of the new CCGT unit. This sensitivity assesses the impact of the CCGT unit of Flémalle not producing electricity by 2025 on Belgium’s adequacy.
With regard to cross-border projects:
• Nautilus* is assumed to be available from winter 2030-31 onwards in the CENTRAL scenario. A sensitivity assessing the impact of a delay in the realisation of Nautilus on adequacy is studied;
• TritonLink* is assumed to be available from winter 203233 onwards in the CENTRAL scenario. Similarly, a sensitivity assessing the impact of a delay in the realisation of TritonLink on adequacy is studied.
3.7. ECONOMIC ASSUMPTIONS
Economic parameters need to be defined to perform economic dispatch simulations (using variable costs). In addition, the assumptions on fixed costs are also used for several aspects of this study, such as the economic viability assessment.
Firstly, the variable costs of generation are determined. These are based on three components:
• the fuel costs needed to generate electricity in thermal units – Section 3.7.1;
• the cost of emissions to be accounted for depending on the fuel – Section 3.7.2;
• the variable operation & maintenance costs (VOM), which are costs associated with the operation of the unit that are proportional to its generation output– Section 3.7.3. Secondly, the fixed costs (split between the fixed operation & maintenance (FOM) costs and the investment costs or CAPEX) of the different technologies are estimated. These are used to assess the cost of a given scenario and the economic viability of existing and new capacity and are detailed in Section 3.7.4. The section also includes the hurdle rate (consisting of an industry-wide weighted average cost of capital or WACC, and a technology-specific hurdle premium) used in the EVA, quantified both for a market design with and without the implementation of a CRM.
3.7.1. FUEL COSTS
General methodology
To simulate the dispatch of the different thermal units, fuel costs need to be determined. For coal, oil and nuclear, the prices are assumed to be the same for all countries. For the gas price, a distinction is made between Great Britain, Italy, and the rest of Europe, given the differences observed in historical and forward prices. Lignite costs are very country specific and are therefore defined on a country-by-country basis. This is in line with the best practice in ENTSO-E studies (such as the ERAA or the TYNDP) and other studies that can be found in the literature.
As the prices for the long term are based on the most recent ‘World Energy Outlook’ (WEO [IEA-2]) published by the IEA at the end of 2022, and with prices in real terms for 2021, an inflation rate of 9.6% is applied to convert these prices into real term prices for 2022. This inflation rate is the one published by the Federal Planning Bureau [FPB-1].
All fuel prices are expressed in HHV (Higher Heating Value) terms and in ‘Euros end-2022’. For each year, the yearly calendar prices are taken as fixed for the entire year. As the years examined in this study run from 1 September to 31 August of the following year (see Section 2.1), this means that (for example) for the simulated year 2026-27, the prices of 2027 are taken into consideration.
Market price cap assumptions used in the economic dispatch model and in the EVA are detailed in Section 3.7.5. Finally, revenue streams other than selling electricity in the wholesale market are detailed in Section 3.7.6.1 for balancing revenues and in Section 3.7.6.2 for revenues from steam and heat
It is important to note that the figures in this section are the reflection of a literature review that covers publicly available information. They were put out for a public consultation in November 2022. They might not reflect the specificities of a particular unit. The future projections of prices are exclusively based on public sources. Several sensitivities are carried out to assess the impact of different assumptions on the results.
All cost figures in this study are provided in real terms in ‘Euros end-2022’.
Assumptions for gas, oil and coal fuel costs
Fuel costs typically make up the biggest part of the variable cost of fossil fuel technologies. Variations in fuel prices (coal, gas, oil) depend on worldwide or regional supply and demand, geopolitics, and macroeconomic indicators.
In the short-term (a few years ahead), forward prices for different fuels are available on some markets. The prices for these forward contracts are used where available until 2025 at least. Forward prices were consulted on 28/02/2023.
Long-term prices are defined using the WEO. In the WEO, fuel price forecasts are available for three scenarios (Stated Policies, Announced pledges and Net Zero) for the years 2030 and 2050. Out of these three scenarios, Announced Pledges is used to determine the prices used in the present study. This scenario was included in the documents put out for public consultation and no suggestions were received for the use of an alternative source. In addition, this scenario corresponds to the essence of the scenario used for Europe and Belgium in this study, accounting for announced ambitions by the different countries that are modeled in this study. In addition, several sensitivities are also performed on carbon and gas prices to capture the impact on the results.
Figure 3-109 provides an overview of the assumed prices for gas for Europe (except Italy and Great Britain) in the present study. For gas prices, three sensitivities are defined. Firstly, a low and a high sensitivity are defined based on the CENTRAL prices by decreasing the base case value by 50% and doubling the base case value respectively. For coal, only one scenario was defined following the forward prices and an interpolation to the WEO prices for 2030. Figure 3-110 provides an overview of the assumed prices for coal in the present study.
Crude oil
The prices for heavy and light oil are derived from the crude oil prices as follows:
• heavy oil prices are based on the historical difference between crude oil and heating oil; this corresponds to an increase of approximately 5% in the crude oil price;
• light oil prices are based on the historical difference between crude oil and gasoline; this corresponds to an increase of approximately 28% in the crude oil price.
Given the absence of public trade data relating to these different oil derivatives in Europe, EIA data is used to calculate these historical averages. Further information can be found in [EIA-1]. The same approach is used by ENTSO-E for its TYNDP and ERAA studies.
Evolution
of lignite
And Nuclear Fuel Costs
Lignite and nuclear fuel prices are taken from TYNDP 2022 and ERAA 2022 and updated for inflation using a rate of 9.6% based on Federal Planning Bureau data [FPB-1]. These prices were assumed to remain stable until 2034:
• Nuclear: 1.87 EUR/MWh;
• Lignite in Bulgaria, Greece, Czechia: 5.51 EUR/MWh;
• Lignite in Slovakia, Germany, Poland, Ireland, Northern Ireland, Bulgaria: 7.09 EUR/MWh;
• Lignite in Slovenia, Romania, Hungary: 9.36 EUR/MWh;
• Lignite in Greece and Turkey: 12.24 EUR/MWh.
3.7.2. CARBON PRICE General methodology
The price of CO2 is a key component of the variable cost for several fossil fuel technologies. The more CO2 a unit emits, the higher the contribution of the cost of emissions, which will affect its place in the merit order. The CO2 price considered for the simulations does not represent the ‘societal carbon price’, but instead reflects the carbon price the different generation units would need to pay for their emissions. Indeed, it is the price traded on the market that will determine the cost of emissions and hence the unit’s position in the European merit order. The greenhouse gas emissions from the power sector are managed by the EU Emissions Trading System (ETS) and prices are set by the supply/demand of carbon allowances. Other sectors such as commercial aviation or energy-intensive industries are also part of the ‘cap and trade’ system.
In the short-term, forward contracts are used for the EU ETS until 2026. These forward prices were consulted on 28/02/2023. No forward prices were found for the UK CO2 market, so an average of 2022 based on historical data is used [EMB-1], which is then interpolated to the earliest available year for which a WEO forecast is available.
Carbon prices are presented in real terms in ‘Euros end-2022’/ tonne of CO2
Assumed future evolution
Estimating the carbon price for future years is a complex exercise, as it is not only based on market evolutions but also on policy changes or interventions from policymakers. During the public consultation period relating to the scenario to be used for this study, only one scenario was provided as a basis (‘Announced Pledges’ from the WEO 2022). Given that the WEO expresses prices in real terms for 2021, an inflation rate of 9.6% was applied to convert these prices to real terms for 2022. This inflation rate is taken from the Federal Planning Bureau [FPB-1].
Following comments received from stakeholders about the uncertainty regarding future CO2 prices and recent changes in the carbon market, high and low CO2 price sensitivities are defined. To obtain the low CO2 price sensitivity, the CENTRAL prices are reduced by 50%. Inversely, for the high CO2 price sensitivity, the CENTRAL prices are increased by 50%.
Figure 3-111 provides an overview of the assumed prices for CO2 in the present study.
3.7.3. VARIABLE OPERATION AND MAINTENANCE COSTS OF TECHNOLOGIES
The Variable Operation and Maintenance (VOM) costs of units are costs that are linked to the electrical output of a generation facility (excluding fuel, carbon emissions and personnel costs). The VOM costs are taken from a study performed by the Joint Research Centre of the European Commission for CCGT and OCGT units to which inflation since 2013 is applied [INF-1]. The VOM costs for other technologies are derived from the ENTSO-E common data [ENT-4] used for the TYNDP and ERAA studies. The same inflation rate is applied as they have not been updated in several years. An inflation rate of +20% is therefore applied to the VOM costs of all technologies. This corresponds to the increase of the HICP index for Europe over the same period. The VOM costs of hydrogen-fired units are considered to be 40% higher than their equivalent gas-fired unit of the same type.
3.7.3.1. Activation costs of demand flexibility and storage
For non-thermal technologies which are also dispatched by the model, no additional variable costs are considered. Hydro storage or other storage capacities are dispatched by the model to minimise system costs. More information on the way they are dispatched is provided in Appendix F. For storage a round-trip efficiency is considered, amounting to 85% for battery storage (large-scale batteries, small-scale batteries or V2M). The initial value proposed (90%) in the public consultation documents was updated to 85% based on a study from NREL [NRE-3]. For pumped storage, this amounts to 75%.
For demand response, an activation cost is considered for certain types, as follows.
Classic (ST, bio fired…) 3.6 ENTSO-E with inflation
Oil 4 ENTSO-E with inflation
Coal 4 ENTSO-E with inflation
Lignite 4 ENTSO-E with inflation
Nuclear 10.8 ENTSO-E with inflation
• Market response’ / Demand response for existing usage of electricity is modelled as ‘demand shedding’, with prices ranging from €300 per MWh to €3,000 per MWh in Belgium. In other countries where such technologies are defined, the prices are based on the assumptions taken in the ERAA 2022. For new demand side response shedding used in the Economic Viability Assessment in the BEnoCRM and noCRM scenarios (see Chapter 5) the activation price was set to €300 per MWh (the lowest activation price considered for DSR) which produced the most optimistic view of economic viability for such type of capacity.
• Flexibility in EV charging or HP usage is optimised by the simulation to minimise the total costs of the system. No additional variable costs are considered to activate those flexibility options. These can be seen as ‘demand shifting’ technologies as the needed energy consumption is shifted within a day.
• Demand response from additional electrification from industry, data centres and electrolysis are considered and some of the processes are linked to a certain activation price as explained in Section 3.3.5.3.
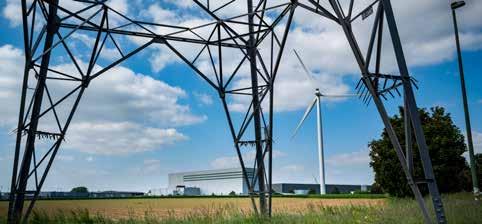
3.7.3.2. Overview of variable costs for thermal technologies
The variable cost computation is presented in the equation below:
Variable cost [€⁄MWh]=Variable O&M cost [€⁄MWh]
+ CO2 emission factor [tons⁄GJ] x 3.6 [GJ/MWh] efficiency [%]
+ Fuel price [€⁄GJ] x 3.6 [GJ⁄MWh] efficiency [%]
The dispatch decision will be linked to the place of the unit in the merit order. It is common practice to describe a scenario by the relative position of coal and gas units in the merit order. If gas units are cheaper to run than coal units, this is commonly described as a ‘gas before coal’ scenario, and vice x CO2 price [€⁄tCO2] versa. In order to illustrate the variable costs of coal and gas units in the past and future years (based on the assumed future prices in the CENTRAL prices scenario), Figure 3-112 shows the variable costs calculated for new and existing gas and coal units for the CENTRAL price scenario.
Figure 3-112 focused on the evolution of the short run marginal cost over time. It is also possible to visualise the merit order in a figure for a certain year. The international merit order for 2024 is provided in Figure 3-113. This only includes thermal generation capacities. It is also important to note that certain units are subject to ‘must run’ constraints and hence their marginal cost is not the only driver for their dispatch. The shape of the merit order and hence the position of each unit is a key parameter that will influence its revenues from the electricity market.
3.7.4. FIXED COSTS OF EXISTING AND NEW CAPACITIES
1 In the past, given low carbon prices, gas and coal prices, coal units had lower marginal costs than gas-fired units. This is commonly called a ‘coal before gas’ set-up. Due to very low gas prices and relatively high carbon prices, the merit order was switched several times in 2019 and 2020, making gas units cheaper to run than coal units. This is commonly called a ‘gas before coal’ set-up.
2 Given the very high gas and coal prices during the 2021-2022 period, coal generation (including old units) was cheaper to run than gas generation. This led to more generation by coal-fired capacities during 2021, 2022 and most probably 2023. The marginal cost of recent gas units was higher than 200 €/MWh; these levels had never been observed in the past. OCGT units were pricing at more than €350 per MWh. Such high marginal costs also explain the high electricity prices observed during that period, given that gas generation is usually the marginal unit on the electricity market.
3 The next three to four years (2023 to 2027) are based on forward market prices for all fuels. Note that new or recent coal capacities could still be cheaper to run than new/recent gas capacities. This would not be the case anymore for less efficient coal units which would fall after new/recent gas units in the merit order. The marginal cost of the different fossil-based technologies remains high when compared to levels before 2021. Recent/new CCGT units would price above €100 per MWh and OCGT units above €150 per MWh.
4 In the longer run, based on the assumptions taken in the CENTRAL price scenario, gas-fired generation is expected to have lower variable costs than coal and lignite generation. This can be explained by decreasing gas prices and increasing carbon emission prices assumed in the base scenario. The marginal cost of gas units also remains high (around €100 per MWh) compared to levels observed before 2021.
Fixed costs can be split into two categories:
• Fixed Operation and Maintenance (FOM) costs are expenses needed to operate or to make any generation, storage, or demand side response capacity available; these costs do not depend on the output of the unit;
• the Capital Expenditures (CAPEX) for new capacities or existing capacities, which require investments to extend their lifetime.
In addition, in order to evaluate the economic viability of existing and new capacities, other economic parameters related to the fixed costs need to be defined:
• the WACC and hurdle premium;
• the economic lifetime of each investment.
For each type of capacity considered in the economic analysis, the above parameters are used to determine the economic viability of existing and new capacities in the electricity market.
Given that it is impossible to determine the exact costs for each new or existing capacity individually, a central value is used based on several sources. These values were put out for consultation and adapted after feedback had been received from stakeholders and new information or studies had been published. Indeed, material costs increased significantly over the past few months, as well as inflation rates, both of which were accounted for by Professor Boudt. The values for the WACC and hurdle premiums have also been updated based on the latest information for the present study. The report can be found on Elia’s website [BOU-2] [BOU-3].
BOX 3-12 — INCREASED PRICES AND INFLATION RATES
Since the publication of AdeqFlex’21, major events have impacted the fixed costs of power plants. The recovery period following the COVID-19 pandemic increased the demand for materials and other products. Energy prices increased due to the ‘energy crisis’ in 2022, increasing transport costs but also labour costs. All product prices increased. In addition, the increase in sustainability targets in several countries will lead to a higher demand of certain materials and components. As depicted in Figure 3-114, some raw materials (metals), have gone up by more
FIGURE 3-114 —
than 50% since the beginning of 2021. General inflation in Europe has gone up by 20% since the beginning of 2021, also increasing labour costs. Key components of generation units such as turbines, pumps, transformers… went up by a similar amount, leading to a general increase in the cost of new power plants requiring those components and materials. The same holds for maintenance or other fixed costs which are usually linked to labour costs, components that need to be replaced, etc
OF SOME RAW MATERIALS, COMPONENTS, AND INFLATION
3.7.4.1. Existing thermal capacities
The assumptions for FOM (Fixed Operation and Maintenance) costs are derived from multiple sources, which were also put out for public consultation. These costs play a vital role in assessing the economic viability of existing capacities, as owners may opt to close or temporarily shut down facilities if projected revenues fall short of FOM costs. Furthermore, the level of FOM costs directly impacts the economic viability of new capacities in the market, as investors in these capacities also take these costs into account.
For existing CCGT, OCGT, Turbojet and PSP capacities, the FOM costs were based on the update of the AFRY study carried out in 2022 in the context of the CRM [ELI-19] to take into account recent cost increases. The FOM costs for existing DSR and CHP capacities are taken from AdeqFlex’21 and updated for inflation.
For capacities requiring an extension to their lifetimes, the costs include the different works and parts of installations that need to be replaced to extend their lifetime. Only existing CCGT and OCGT units that will be older than 25 years for a given target year are assumed to require a lifetime extension (excluding the CCGT unit of Seraing which is assumed to require no lifetime extension costs for the simulated horizon).
All other existing capacities (storage, demand side response, CHP, turbojets, etc.) are assessed without considering additional refurbishment costs (which might not be the case in reality).
Ranges for CCGT and OCGT refurbishment costs are based on past public figures for the Belgian market. Those are the same as in AdeqFlex’21, where an increase of 20% was applied to account for the increase in labour and material costs. However, it should be noted that actual costs may vary depending on the maintenance policy of the unit, its operating mode, the number of starts, the specific technology, etc.
3.7.4.2. New thermal capacities
Investment costs for developing and constructing a new capacity are quantified in the CAPEX figures. In addition, FOM costs are also defined (as already explained in the previous section).
For new generation and storage capacities, the CAPEX represents the total investment costs (engineering, procurement, and construction (EPC), construction works, acquisition of land and other costs for the owner). Several sources are used to quantify these costs for new capacities, resulting in a range of values. These are depicted in Figure 3-115 for a large CCGT. The different sources and studies are compared in Euros2022 by applying general inflation based on the study publication date. The value assumed for new CCGT (>800 MW) in this study amounts to 700 €/kW, which falls within the range of the values found.
The feedback received during the public consultation was accounted for. It mainly related to the costs of new gas-fired units. The same CAPEX cost is assumed over the entire time horizon of the study, but a distinction is made in accordance with the size of each unit, since for larger units there are economies of scale when expressing the costs per unit of installed capacity.
In addition, ‘IC gas engines’ are removed from the list of candidates, since to date no known projects of this type are being developed or planned in Belgium. As a replacement, ‘hydrogen fueled CCGT and OCGT’ are introduced as alternative investment options from 2030 onwards. For the costs, based on a literature review, the CAPEX of both technologies (running on 100% hydrogen) would be increased by 15% to 30% (based on Bloomberg and academic estimates [IJH-1]). An increase of around 25% is therefore considered for both CCGT and OCGT if running on hydrogen.
The present study incorporates the increase in these cost components by increasing the different variable and fixed costs of new and existing capacities. In order to ensure that all cost data are consistent with each other, all prices are expressed in the same reference of ‘Euros End-2022’.
In general, the following approach was applied:
• the VOM costs are inflated to take into account the fact that the reference used was published in 2013;
• the FOM costs are also higher than in the previous study to account for the increase in labour and material/components costs (around 20% as demonstrated above);
• the CAPEX costs have been reviewed more extensively, in line with a literature review; inflation adjustments are applied to ensure comparability among sources, considering the publication dates of the respective sources.
3.7.4.3. Fixed costs for storage and RES capacities
In terms of large-scale batteries, given the feedback provided, the costs are updated with the most recent estimations from NREL. This leads to 1,200 EUR/kW for the first 5 years considered in the study, for a battery system with 4h of storage capacity. The figure taken from the latest NREL study confirms this estimation [NRE-1]. This is further illustrated in Figure 3-116.
Regarding pumped storage only indicative costs are provided as these can vary significantly based on the location and required engineering work for these types of technology. Based on NREL, the costs are estimated to be between $1,999 to $5,505/kW; the International Hydropower Association mentions estimates of $2,046/kW. 2,000 EUR/kW is therefore proposed as a basis.
Concerning the fourth type related to existing usages of electricity, also called ‘market response’ (or DSR from existing usages), existing capacities are taken into account in the CENTRAL scenario and additional new capacity potential is defined for each future horizon (see Section 3.3.2.2). Market response/existing usage DSR is modelled as a demand shedding unit. This means that a certain amount of capacity can be reduced when a certain electricity price is reached.
As consulted upon, additions in demand side response in the form of ‘market response’ (on top of the already assumed flexibility of newly electrified processes and existing market response from existing usages) are possible for each country (including Belgium). These are considered based on the results of the EVA. In order to evaluate the costs associated with new demand side response, a stepwise fixed cost merit-order is assumed as illustrated in Figure 3-117. Each new block of 300 MW capacity is assigned a yearly fixed cost. This fixed cost is to be considered as an annualised cost of the CAPEX and other costs that such capacity would need to cover to be available in the market. The choice to express it as a yearly fixed cost and not as CAPEX is based on the sources (detailed in this section) used as a reference where such an approach was also adopted. Indeed, calculating only one CAPEX cost for demand side response is complex and subject to uncertainty or misrepresentation, given the very different types of consumers and processes which could offer such a type of service.
anism [CRE-1]. Despite the fact that they were developed for the French market, these documents are considered reliable and relevant. Another source used was published by Compass Lexecon for the Polish market: ‘Assessment of the impact of the Polish capacity mechanism on electricity markets’ [PCL-1]; a similar approach was used involving steps of around 800 MW with several price steps. This confirms that the proposed approach for DSR based on yearly fixed costs is common practice.
If one were to simply transpose the values found for the French market onto the Belgian context (by taking into account the fact that France has a peak demand which is 6 to 7 times higher than in Belgium), this would lead to even lower values in terms of capacity blocks assumed (here blocks of 300 MW were assumed for Belgium with a given fixed cost). Therefore, the cost evolution proposed for demand side response can be seen as optimistic for Belgium; as per direct projection, the investment costs for the same capacity volume would be higher than the one proposed here for this study.
3.7.4.5. Construction periods
To define the construction periods for different types of new capacities, the values from the CONE calculations for Belgium are used [FPS-5]:
• <1 year for PV and DSR;
• 1 year for batteries, wind onshore;
• 2 years for OCGT and CHP;
• 3 years for CCGT and wind offshore.
For the types of capacities not included in the document mentioned above, the following values were used:
• 3 years for biomass;
• 4 years for pumped storage.
3.7.4.6. WACC and hurdle rate
The hurdle rate is the threshold that the internal rate of return (IRR) needs to equal or exceed for a project to be economically viable, in line with the methodology developed by Professor K. Boudt (see reference to Appendix K for more details). The hurdle rate equals the sum of an industry-wide reference WACC and a hurdle premium. All capacities (related to any technology) are subject to the same WACC, whereas the hurdle premium is different depending on the technology (and is determined according to the identified risks and uncertainties and the assumed market design). For this study, two different sets of hurdle rates are created: one for the energy-only market (EOM) setting; and another for a market design with CRM.
1) Reference WACC: a reference industry-wide WACC is calculated, in line with the non-binding principles set in European methodology.
2) Hurdle premium: the hurdle premium makes up for price risks going beyond the typical factors and risks covered by a standard WACC calculation and is based on the study from Professor K. Boudt, as detailed in Appendix K. Table 3-9 provides a summary of the proposed hurdle rates (composed of the WACC and the hurdle premium) per technology for both an energy-only market setting and a market design with CRM.
The update to Professor K. Boudt’s study can also be found on Elia’s website.
i More information on the WACC and hurdle rates can be found in Appendix K.
The CAPEX for wind onshore, wind offshore and PV capacities is also provided in Table 3 9. These values are not used in the EVA of this study, since these units are assumed to be eligible for subsides if required and are therefore excluded from the viability assessment. The assumptions for the CAPEX and FOM costs are also based on several sources as depicted in Table 3-9 (such as IRENA, IEA…). The CAPEX is expected to decrease over time with technological improvements, increases in efficiency/size and improvements in the supply chain.
3.7.4.4. Costs related to new demand response capacities
There are four types of demand response capacities defined in this study. These are further explained in Section 3.3.1. Regarding newly electrified processes (heating, transport and industry), several sensitivities are performed on the amount of demand response and flexibility they can provide. No costs are associated with the development of the flexibility and no EVA is performed.
The sources used to corroborate such an approach are studies performed for France or Poland, for which such cost assumptions were made. Indeed, no sources were found that covered the Belgian market. Three different studies from institutions abroad are used. The first one is from the Agence de l’Environnement et de la Maitrise de l’Energie, a French public institution providing expertise in the areas of the environment, energy and sustainable development [ADE-1]. The second document used is one which the Commission de Régulation de l’Energie, the French regulator for gas and electricity, published on their website based on a document made by the French TSO (RTE) for the French capacity mech-
3.7.4.7. Overview of the fixed costs for the different technologies assumed in this study
Table 3-9 provides an overview for new and existing capacities per technology of the assumed:
• CAPEX costs;
• FOM costs;
• construction period;
• investment economic lifetime;
• hurdle rate in both EOM and CRM context
• main sources used.
The details regarding the assumptions and sources used are also provided in previous sections.
3.7.5. MARKET PRICE CAP ASSUMPTIONS
The market modelling used for this study requires a price cap to be set. This price cap represents the maximum electricity price at which the modelled market can clear. Although the prevailing day-ahead price cap is currently set at 4,000 €/MWh, the rules governing this price cap also foresee that it could increase over time via an automatic adjustment mechanism. On 10/01/2023, the new SDAC/SIDC Harmonised Maximum and Minimum Clearing Price methodology (HMMCP) was approved by ACER. This new methodology has been implemented since 11/01/2023. In particular, when in one of the concerned markets a price of at least 70% of the prevailing price cap is reached during two different Market Time Unit (MTUs) on different days within a 30-day rolling period, the price cap increases by €500 per MWh. An event that triggers a price cap increase is known as a ‘triggering event’. After the completion of such a ‘triggering event’, a 4-week transition period is started, during which no changes are made to the price cap. In theory, the price cap could increase over time until it is high enough to cover the VoLL. Estimations of the VoLL vary greatly but could easily reach between €10,000 to €20,000 per MWh and beyond, depending on the estimations and the applied methodology. Note also that VoLLs are nationally set (in line with a common ACER defined methodology), while the price cap is set at EU level. In order to reflect this key aspect of the electricity market, the price cap in this study is determined as outlined below.
For the simulations where the GAP is filled (adequate economic simulations), an initial price cap per horizon is set, based on the average number of price cap increases found in the simulations starting from 2023, where it corresponds to the European harmonised maximum clearing price for the day-ahead market in Belgium and all other modelled markets as set according to a decision from ACER following a proposal by the NEMOs (i.e. the power exchanges), in accordance with Art. 41 of the CACM guidelines [ENT-6] [NEM-2]:
• as from 2023, it is set to a minimum of 4,000 €/MWh;
• as from 2028, it is set to a minimum of 4,500 €/MWh;
• as from 2030, it is set to a minimum of 4,500 €/MWh;
• as from 2032, it is set to a minimum of 5,000 €/MWh. For all time horizons, the maximum final price cap is set to €20,000 per MWh as a proxy for the VoLL. When simulating the expected lifetime revenues of a capacity, price cap increases are triggered dynamically over the lifetime of the unit. Starting from the initial price cap, if a ‘triggering event’ (as defined by [NEM-2]) is observed, the revenues of the unit are adapted to take into account these increases. These price cap increases are applied through an ex-post approach, meaning it cannot be applied during the simulations themselves but the revenues are corrected to account for the increase each time a ‘triggering event’ is observed according to the methodology. Multiple increases per simulated year are allowed if the triggering event happens outside of the four-week transition period as defined in the methodology. More detailed information about the methodology applied in this study can be found in the methodology Appendix K. Figure 3-118 shows the evolution in the price cap as observed in the CENTRAL/EU-BASE scenario when Belgium is calibrated to 3 hours of LOLE. Along with the average price cap for the given year, the standard deviation of the observed price caps and some sample price cap evolutions are presented.
3.7.6. ADDITIONAL REVENUE STREAMS
3.7.6.1. Ancillary service revenues
As explained in more detail in the methodology Appendix K, the consideration of revenues related to ancillary services relies mostly on the following assumptions:
• net revenues considered relate to the provision of following balancing services: FCR, aFRR, mFRR;
• net revenues are limited to those stemming from the capacity auctions: it is assumed that no net revenues are booked from the provision of activation of such services, since technologies participating in them perfectly arbitrage between the provision of balancing services and are present on the day-ahead commodity market.
Overall, reservation costs from balancing products (FCR, aFRR, mFRR) have increased in comparison with AdeqFlex’21. The expected cost of these services for the period 2024-2034 is shown below in Figure 3-119.
Of course, the costs highlighted in Figure 3-119 only represent the potential maximal gross revenues which can be earned with the provision of these different products across all actors participating in these services. Such gross revenues cannot be compared directly with the simulated inframarginal rents coming from the economic dispatch model, since they are based on extrapolated historical data. How the actual revenues earned from the provision of ancillary services is calculated (going from gross revenues to net revenues) is explained in more detail in Appendix K.
The estimation of net balancing revenues is based on the current methodology used for the yearly calibration exercise of the CRM and is also complemented by the forecasted future costs of the different balancing products. Finally, it is also worth noting that the cross-border reservation of ancillary services is excluded from this assessment.
The revenues earned from the provision of balancing services are split per balancing product and technology: FCR
Although the FCR volumes which need to be covered in the Belgian LFC block are rather small, the revenues arising from FCR capacity auctions increased in comparison with past revenues and represent a non-negligible amount of net revenues. It is assumed that these net revenues were captured by batteries only. These net revenues are estimated based on the initial FCR reservation costs. The reservation costs (considered gross revenues) are refined to net revenues through two calculations:
- a 60% factor accounting for the arbitrage being made by batteries between the provision of commodity and balancing markets; and aFRR:
- a factor of 85% to account for the roundtrip efficiency of batteries.
After applying these factors, the level of net revenues for the provision of FCR is estimated at a level of €122.9 for a kW of participating battery to cover the FCR need per year in 2024 and is expected to decrease and converge in the longer term towards a value of 89.4 €/kW in 2034. The decreasing trend is linked to an expected convergence of FCR prices with cross-border prices. In terms of net total revenues considering all relevant capacity needed to meet the FCR needs, €11.9 million in 2024 to €8.7 million in 2034 are to be split across the capacities providing the FCR service.
After applying such factors, the level of net revenues for the provision of aFRR for batteries is estimated at a level of 275.7 €/ kW of battery capacity participating to cover the aFRR need per year in 2024 and is expected to decrease over the years to reach a net revenue of around 105 €/kW per year in 2034. The main factor behind this decrease over time is the decrease in gas prices, although other aspects may exert an upward/ downward pressure on aFRR costs in the future: an increase in wind farms and batteries likely to deliver aFRR in comparison to gas units; a switch of the pricing rule from Pay-as-Bid to Pay-as-Cleared; the connection to EU balancing platforms, etc. With regard to net total revenues, €6.9 million in 2024 to €7.1 million in 2034 are to be split across the batteries providing the aFRR service: the absolute increase in total revenues is explained by an increasing volume of batteries expected to participate in the provision of aFRR with a relative decrease in costs.
Given that large volumes of batteries are expected to come into service on the Belgian grid in the coming years, Elia has proposed to introduce an additional sensitivity where all revenues coming from the provision of aFRR would be attributed to batteries as of 2028. In other words, batteries would represent the sole technology providing aFRR capacity by then.
The effects of this sensitivity in terms of Economic Viability Assessment are highlighted in Chapter 5. Given that large volumes of battery projects are being developed in Belgium an additional sensitivity in which batteries would provide all aFRR up volumes as of 2028 is taken into account in the EVA. This means that they would capture all the revenues from the provision of aFRR up. The effects of this sensitivity (combined with other assumptions) in terms of economic viability are highlighted in Chapter 5. In practice, generation units (including renewables), storage (batteries…) and demand side response will be in competition for delivering aFRR volumes in the future. Finally, it is worth adding that this additional sensitivity does not assess the impact, in terms of costs for the aFRR product, of the full takeover of the provision of aFRR up capacity by batteries as of 2028.
The estimation of these revenues is mainly associated to 2 different technologies: CCGTs and batteries. It is assumed that no net revenues are earned by CCGTs on top of the revenues earned on the commodity markets when they decide to participate in the provision of aFRR instead of running on the commodity markets. Consequently, no additional (net) revenues are derived from the provision of aFRR for CCGTs. Batteries are the other technology assumed to deliver aFRR. The net revenues applicable again to batteries for the provision of aFRR are estimated based on the initial aFRR reservation costs (considered gross revenues) devoted to batteries on which two different percentages are applied:
• a 60% factor accounting for the arbitrage being made by batteries between the provision of commodity and balancing markets; and mFRR:
• a factor of 85% to account for the roundtrip efficiency of batteries.
The estimation of these revenues is mainly associated with the following technologies: OCGTs, Turbojets and DSM. The expected revenues per technology evolve as well in line with the share of technology expected to deliver mFRR over the longer term. All net revenues are estimated based on the product mFRR Standard, given the very limited volumes of the mFRR Flex product, as outlined below.
• For OCGTs: the net revenues for OCGTs coming from the provision of mFRR are estimated based on mFRR reservation costs (considered gross revenues) on which a percentage is applied:
- A 35% factor accounting for the arbitrage being made by OCGTs between the provision of commodity or balancing markets is applied.
After this factor is applied, the level of net revenues for the provision of mFRR is estimated at a level of 22.5 €/kW for a kW of OCGT participating to cover the mFRR need per year in 2024 and is expected to decrease slightly over the years to reach 20.8 €/kW in 2034.
• For turbojets: the net revenues for turbojets coming from the provision of mFRR are estimated based on mFRR reservation costs (considered gross revenues) on which a percentage is applied:
- A 60% factor accounting for the arbitrage being made by turbojets between the provision of commodity or balancing markets is applied.
After this factor is applied, the level of net revenues for the provision of mFRR is estimated at a level of 38.6 €/kW for a kW of turbojet participating to cover the mFRR need per year in 2024 and is expected to decrease slightly over the years to reach 35.7 €/kW in 2034.
Both turbojets and OCGTs can also be considered together as thermal units providing mFRR and represent an amount of net revenues equal to €8.2 million in 2024 and €11.2 million in 2034, to be split between thermal capacities providing the mFRR service. The increase in total net revenues is linked to the expected increase in mFRR volume to be auctioned, despite a relative decrease in costs for providing such service.
• For DSM: the net revenues for DSM coming from the provision of mFRR are estimated based on mFRR reservation costs (considered gross costs) on which a percentage is applied:
- A factor of 50% accounting for the arbitrage being made by DSM between the provision of commodity or balancing markets is applied.
After this factor is applied, the level of net revenues for the provision of mFRR is estimated at a level of 32.2 €/kW for a kW of DSM participating to cover the mFRR need per year in 2024 and is expected to decrease slightly over the years to reach 29.7 €/kW in 2034. In terms of net total revenues, €12.1 million in 2024 to €21.2 million in 2034 are to be split across the DSM capacities providing the mFRR service: the absolute increase in total net revenues is explained by an increasing volume of DSM expected to participate in the provision of mFRR in comparison to thermal technologies.
It is important to highlight that the net balancing revenues for mFRR used in this exercise do not take into account the effect of partial procurement (as of 2028). Its effect would reduce the amount of MWs reserved for mFRR capacity in the future and would therefore reduce the estimated net balancing revenues arising from the reservation of balancing mFRR capacity for the technologies participating in it. The implementation of partial procurement as of 2028 will therefore result in a negative impact on the EVA of those units (compared to the values mentioned in this study).
It is worth noting that the net balancing revenues estimated above must still account for a major element which is likely to impact them when participating in the provision of balancing services: the probability of winning in the capacity auction.
Indeed, the level of balancing needs to be fulfilled (approx. 1 GW) on a day-to-day basis in Belgium is fairly limited in comparison to the total installed capacity available across Belgium potentially competing to provide such service. The arrival of new capacities on the market competing with an already significant amount of installed capacity may greatly increase the degree of competition faced in balancing capacity auctions, leading to a dilution of the overall revenues for a certain balancing product over a larger asset base.
In other words, the revenues of a capacity to be selected in a capacity auction to provide a balancing service is likely to decrease, all other things being equal, along with increased competition between units participating to this auction. This competition effect is taken into account in the final EVA exercise which is undertaken to assess the profitability of existing/new capacities in the market and is likely, all other things being equal, to impact the estimated net revenues coming from the provision of balancing services downwards.
3.7.6.2. Revenues from steam and heat
In order to assess the additional revenues that CHP units could generate from heat or steam, the method applied by Fichtner in the study entitled ‘Cost of Capacity for Calibration of the Belgian Capacity Remuneration Mechanism’ published in April 2020 [FIC-1] is applied. Such a method - which is called ‘CHP credit’ - considers a reduction in the variable costs of the CHP units for their dispatch decision in the electricity market. By reducing the variable cost at which the unit is dispatched, this increases the margin that such units would make (based on electricity market revenues and the decreased variable costs), which mimics the additional revenues they would get from selling heat or steam.
The CHP credit is built upon the logic that heat needs to be generated for a certain process and that if it is not provided by the CHP, it is provided by a gas boiler. The benefit in marginal cost for the CHP is therefore the ‘avoided’ cost of generating the same amount of heat with a gas boiler. In order to calculate these avoided costs, the following assumptions are made:
• boiler efficiency: 99%;
• overall efficiency: 90%.
Depending on the gas and carbon prices, the ‘CHP credit’ is calculated and then subtracted from the CHP marginal cost. The heat and steam revenues are therefore taken directly into account in the ‘electricity market’ revenues calculated by the economic dispatch simulation.
Even if such an approach takes into account the benefits of combining heat and power generation, the detailed gains will greatly depend on the supplied process (heat generation, steam generation, industrial process, heat/steam profile required…) and, on a case-by-case basis, the resulting benefits could greatly vary.
As also observed when analysing historical dispatch decisions made by CHP units (see Appendix C), there is quite a number of CHPs still running when electricity prices are low (below their marginal costs). During such moments, it is possible that these units might not make any profit – and may even present losses.
3.8. SHORT-TERM FLEXIBILITY ASSUMPTIONS
This chapter details the assumptions regarding the assessment of short-term flexibility. This section should be read along with the flexibility characteristics as specified in the ‘Assumptions’ workbook of this study.
3.8.1. PREDICTION DATA
Predictions made about the total load and renewable generation are based on the results of forecasting tools which are published on a real-time basis on Elia’s website. Although the flexibility needs of the system are driven by the predictions and operational decisions of market players, this forecast data is assumed to be representative of the tools which are used by market players.
• Time series for the estimated real-time total load, real-time onshore wind and solar power generation as well as the other distributed generation are based on measurements, monitoring and upscaling by Elia. The corresponding time series of forecasted values (day-ahead, intraday and last forecast) are obtained from external service providers. Note that a correction is made to the forecast error when Elia activates decremental bids on these units.
• The measured real-time offshore wind power generation and the corresponding forecasted values in this study are based on time series which are used in Elia’s latest study on the system integration of a second wave of offshore generation in Belgium. Within this framework, these time series are modelled by the Technical University of Denmark to represent the real-time generation and forecasts for the projected wind power plants in 2020 (2.3 GW), 2029 (3.0 GW), and 2030 (5.8 GW). This allows the estimated technology and topology of the future offshore wind power fleet to be taken into account. Furthermore, these time series also represent higher resolutions (up to 5 minutes) which are used to study the effect of fast variations. For these reasons, this data is selected over Elia’s measurement and forecast data. More information regarding the modelling of the offshore data can be found in the material presented on 24 June 2022 to the Task Force Princess Elisabeth Zone; this report is
3.8.3. TECHNOLOGY CHARACTERISTICS
due to be put out for public consultation in Q4 2023. In order to take a representative dataset into account, two subsequent full years (2020 and 2021) are selected. The choice of years is driven by the availability of offshore wind power time series modelled by the Technical University of Denmark. Due to planned offshore developments, which will more than double the installed generation capacity, the advantage of having more accurate offshore generation and forecast projections outweigh the use of the latest measurement and prediction data from 2022.
Total load, real-time onshore wind and solar power generation as well as the other distributed generation forecasts are corrected with forecast improvements towards 2034. An average cumulative improvement factor of 1% per year is taken into consideration between 2020-21 and 2034. This means that the forecast error is corrected to 99.00% of its value towards 2022, 98.01% for 2023 by means of a factor (1 –0.01)y (in which ‘y’ is the year for which the forecast errors are calculated). This results in the original forecast errors from 2020-21 being reduced to 87.8% of their original value in 2034. These improvements made to forecasting accuracy are attributed to forecast methodology improvements and increasing geographical dispersion, which further smooths out prediction errors. Besides this yearly improvement factor, some improvement in the prediction of extreme weather conditions might be expected. Furthermore, the integration of new technologies such as electric vehicles, heat pumps and other decentralised capacity are expected to result in new patterns which increase the complexity of forecasting algorithms.
3.8.2. FORCED OUTAGE CHARACTERISTICS
The forced outage probability of power plants and HVDC interconnectors is based on the historic amount of forced outages per year presented in Table 3-6 and is used to determine the forced outage risks accounted for in the flexibility needs. The methodology to determine the amount of forced outages per year is specified in Section 3.4.4 and is consistent with the forced outage rate and forced outage duration used in the adequacy assessment: the parameter is determined per technology type based on the historical records of power plant outages and HVDC interconnector outages.
No forced outages for renewable generation, decentralised ‘must run’ generation (e.g. combined heat and power) or demand side response are accounted for. Demand side response volumes are typically based on aggregation and it is assumed that the forced outage probability is taken into account when determining the available capacity. The forced outages of renewable generation and decentralised ‘must run’ generation units are implicitly taken into account in the prediction and estimated generation profiles.
The technical characteristics concerning flexibility are based on a literature review, Elia’s expertise and feedback received from stakeholders during the previous consultations held on input data. A detailed overview of the technical characteristics of each technology can be found in the excel workbook with input data. An overview of this is included in Figure 3-123. The upward (downward) arrows depicted in the figure correspond with the upward (downward) direction in which the flexibility can be delivered. When the arrow is depicted in orange, the flexibility is not included in the calculations and the results due to uncertainty (e.g. as with nuclear generation units, where the flexibility depends on several technical constraints), but can be considered as additional flexibility which might be available under exceptional conditions.
Firstly, the ability to provide flexibility is determined by the operational characteristics (minimum up/down time; hot/ warm/cold startup time; transition time from hot to warm/ warm to cold; minimum stable power; rated power; and the ramp rate). In general, these constraints are particularly relevant for thermal power plants.
Secondly, where relevant, an energy limit is taken into account to represent the maximum duration a technology can be used to provide flexibility at its rated power. Although this is in general only relevant for non-thermal units (storage, demand side response), it may also apply to combined heat and power.
Thermal generation
Nuclear power units have been shown to provide flexibility, but this flexibility is subject to several technical limitations; for example, only some units are flexible and the flexibility of these units is limited in power, duration and frequency and depends on technical constraints such as the position in the fuel cycle. This makes it difficult to quantify the flexibility in a structural way and these units are therefore considered as non-flexible in the calculations. However, one can indeed assume that when assessing the results of the flexibility means, it is not unlikely that additional downward flexibility could be provided by the nuclear units.
Conventional thermal units are considered flexible and can deliver each type of flexibility when dispatched. The main constraint stems from the difference between the day-ahead schedule and their minimum stable power (downward flexibility) and the difference between the day-ahead schedule and the rated power (upward flexibility). However, most units require a startup time and cannot deliver fast or ramping flexibility (i.e. old, recent and new CCGT) when not already dispatched. Other types such as new and existing OCGT, turbojets and diesel generators can deliver fast upward flexibility from standstill due to their fast startup times. The ramping flexibility is only provided by units which are effectively dispatched, and is limited by the maximum ramp rate of the unit.
Combined heat and power (CHP) units are considered as two different types, i.e. ‘individually modelled’ and ‘profiled’. The latter is considered to be ‘must run’ and not considered as being able to participate in flexibility yet. The individually modelled type can be based on CCGT and OCGT units, which are assumed to have the same technical characteristics in terms of flexibility as if they were CCGT or OCGT without CHP capabilities. Additional constraints are that they can only deliver downward flexibility (considered as ‘must run’) with an energy limit (considering that other processes cannot last a long time without steam). However, various applications exist for CHP and such a generalisation may be a simplification of reality. FIGURE
Thirdly, some particular technology assumptions are used to limit, where necessary, the maximum flexibility which can be taken into account for each type of flexibility needs considered in this study: ramping flexibility (able to be activated within minutes); fast flexibility (able to be activated within 15 minutes); and slow flexibility (able to be activated within 5 hours). In general, this constraint is based on the difference between the scheduled output of the adequacy simulations and the maximum rated power / minimum stable power of the technology unit.
Renewable generation
When assessing variable renewable generation, the main contributor in Belgium today is wind power It is generally considered to be able to provide downward flexibility (capabilities for upward flexibility are considered to be limited as their generation is driven by weather conditions) if they are equipped with appropriate communication and control capabilities. This is only the case for larger installations and this falls within their contractual obligations with Elia. It is assumed that these technologies will mainly provide fast and slow flexibility, although some units may also provide ramping flexibility if properly equipped.
The potential flexibility of wind power is capped to 65% of the scheduled output for offshore power and 90% for onshore power, based on the day-ahead forecast error (the capacity that is considered to be available in real time at least 99.0% of the time following a certain predicted capacity). While no further limits are assumed for fast and slow flexibility, it is assumed that part of the offshore wind power installations can provide up to 400 MW (18% of the current park) and up to 525 MW (through the Princess Elisabeth Zone) of ramping flexibility. This value, representing 21% of the initially foreseen 4.4 GW, is extrapolated towards the current ambitions of increasing offshore wind power up to 5.8 GW. Note also that large solar power installations, i.e. larger than 25 MW, are assumed to contribute to downward flexibility. For this reason, this capacity is accounted for, similar to onshore wind power, in fast and slow downward flexibility, by taking into account a cap set to 90% of the scheduled output.
In addition to variable renewable generation, biofuel units are assumed to provide all types of downward flexibility (assuming they are always scheduled at maximum power following generation support mechanisms). To provide downward flexibility, they are subject to the same type of technical constraints as conventional thermal units.
Technologies with energy limits
Large batteries and pumped hydro storage are the most relevant storage technologies for Belgium. Large-scale batteries can deliver all types of flexibility in both directions without ramp rate limitations. This even means a potential inversion from full offtake to full injection. However, they do face an energy limitation depending on their energy storage capacity, which is assumed to be limited at one hour generation or offtake at full capacity. In contrast, while pumps and turbines in pumped-storage units can also deliver ramping flexibility, this is only assumed to be the case when the pump or turbine is dispatched. The energy limit of pumped hydro storage is assumed to be 4.5 hours at full capacity
Electrolysers (power-to-gas technologies) can in principle provide all types of flexibility if properly equipped for it. However, most value is expected to be held in long-term storage (e.g. seasonal) rather than in the intra-day and balancing time frames. For this reason, these units are only accounted as upward fast and slow flexibility during periods when the assets are scheduled for gasification (and electricity offtake can be reduced by shutting down the process). In such cases, it is assumed that fast and slow upward flexibility increases can be delivered by reducing offtake without any technical constraints.
Demand side response (demand shedding) can also deliver ramping, fast and slow flexibility, typically only in an upward direction (reduction in consumption). The reaction times depend on the application. For the demand shedding applications, it is assumed that a total share of around 100%, 40% and 10% of installed market response can participate in slow, fast and ramping flexibility respectively. The energy limit is related to 5 categories (no limit; 1 hour; 2 hours; 4 hours; and 8 hours).
End consumer flexibility (home batteries, smart electric vehicle charging, vehicle-to-grid, smart heating) are assumed to deliver ramping, fast and slow flexibility through electrification, digitalisation, an enhanced market design while relieving several barriers (amongst others related to metering, interoperability and consumer engagement). Home batteries are assumed to face an energy limitation of 2 hours at full capacity. Electric vehicles are assumed to provide downward flexibility (temporarily reducing consumption through smart charging) and in some cases even also upward flexibility (vehicle-to-grid). Note that besides the energy constraint, a modulation profile is taken into account in which demand can be increased or reduced (e.g. less modulation possibilities during the day than during night). The energy constraint is set at 8 hours for smart charging and 3 hours for vehicle-to-grid. Heat pumps are only assumed to provide upward flexibility. A modulation profile limit is also taken into account to limit the impact on end consumer comfort. Energy limits are set at 7 hours for water heating applications and 5 hours for space heating applications. Note that the share of available heat pump flexibility which can provide ramping flexibility is set at 50%, and fast flexibility is set at 70%. More information about how these assumptions are made can be found in Appendices D, E and F, based on the results of DELTA-EE.
Cross-border flexibility
Cross-border flexibility is assumed to be constrained by the remaining available interconnection capacity (ATC) after day-ahead trading. This is estimated based on the hourly import/export schedule following the adequacy simulations, which are compared with a reference representing the maximum import/export schedules. Note that to simplify the process, this maximum is fixed at 7,500 MW (import) and 8,000 MW (export) for the investigated period between 2024 and 2034, but that in reality, these values can vary on hourly basis.
The available cross-border flexibility also depends on the liquidity in cross-border intra-day and balancing markets It is possible that not all required flexibility is available in other regions, since this flexibility might also be constrained, or already used to deal with unforeseen variations in these countries. For slow flexibility, a liquid intra-day market is assumed and full capacity is taken into account, unless prices below 0 €/MWh and above 300 €/MWh indicate a regional excess or shortage (respectively), and limit the available capacity in intra-day and the balancing time frame.
For fast and ramping flexibility, the only cross-border flexibility currently in place is through FRR reserve sharing and imbalance netting (iGCC). From 2024 onwards, the European balancing energy platforms will facilitate cross-border balancing energy exchange for aFRR and mFRR. Unfortunately, no estimations or projections are available regarding the expected liquidity on these balancing energy platforms and TSOs depend on a return on experience after implementation. To address this uncertainty, a sensitivity analysis is conducted to explore the potential impact of cross-border flexibility. This analysis involved comparing two scenarios: one without cross-border flexibility and another with varying levels of liquidity in the balancing energy platforms for aFRR and mFRR. By examining these scenarios, insight can be gained into the significance of cross-border flexibility on the available flexibiltiy of the system.
Note that it is far from certain that the current cross-border capacities considered as ‘firm’ will increase, since optimising the use of the grid during day-ahead and intra-day may leave less capacity available for the balancing time.
3.8.4. RESERVE CAPACITY PROJECTIONS
As explained in Section 2.3.3, part of the flexibility needs are explicitly modelled in the adequacy simulation requirements by means of ‘capacity reservations’ on available generation, storage and demand response assets. In line with the ERAA methodology requirements, this capacity is limited to the reserve requirements held by the TSO to balance residual system imbalances following forced outages and prediction errors of demand and renewable generation. Note that, given the scope of the adequacy simulations, only upward FCR and FRR capacity is taken into account while FRR capacity is limited to the dimensioning incident, i.e. 1,039 MW (Doel 4). This accounts for the fact that renewable prediction risks are expected to be lower during scarcity risk periods.
• FCR needs are determined by extrapolating the current value of 88 MW in 2023, calculated by ENTSO-E in 2022 based on its yearly assessment method. While current FCR needs in continental Europe amount to 3,000 MW, the projections take into account that this is expected to increase to 3,300 MW in 2024 following the implementation of a new probabilistic methodology as for the calculation of the FCR needs for 2024. As the allocation of this capacity to LFC blocks (cf. Elia LFC block) is based on comparing the total share of load and generation with the total share across the synchronous area of continental Europe, projections for the future could be made based on estimations of future generation and consumption. This approach results in an increase in the FCR needs towards 97 MW by 2027. The FCR needs are assumed to remain stable thereafter as there is no visibility on large shifts in generation / demand ratio compared to other LFC blocks.
• Total upward FRR needs are currently dimensioned by Elia through a ‘dynamic dimensioning’ methodology which determines the FRR needs for the next day based on the risks of LFC block imbalances and expected system conditions. One observation is that the FRR needs currently varies around 1,039 MW - the rated power of the largest nuclear unit. Simulations carried out within the framework of the integration study on the 2nd wave of offshore wind demonstrated that the average capacity is expected to increase in a reference case towards 1,591 MW in 2030, and 1,659 MW in a CENTRAL scenario with market reforms facilitating the contribution of end user flexibility.
• The split of the upward FRR needs in aFRR needs and mFRR needs is currently determined by Elia through the use of a static methodology, where the aFRR needs are ‘statically’ determined at 117 MW. Elia foresees the implementation of a new methodology in Q4 2024, following which the average upward capacity is expected to increase to 171 MW in 2026, after which it is foreseen to remain relatively stable as improved market performance asmoothen variations. The mFRR needs projections are derived from the difference between the total FRR needs and the aFRR needs.
This evolution of the FCR and FRR reserve needs are depicted in Figure 3-124. The figure also shows how the reserve capacity requirements explicitly modelled in the economic dispatch simulations are limited to the sum of the ‘static’ FCR values and the FRR needs during periods related to scarcity risks and therefore limited to 1,039 MW, i.e. the size of the largest nuclear generation unit (Doel 4). This results in a stable capacity ‘reserved’ on generation, storage and demand assets of around 1,135 MW.
3.8.5. CENTRAL SCENARIO AND SENSITIVITIES
Figure 3-125 provides an overview of the main scenario and sensitivity studies. The flexibility needs are analysed for 2024, 2026, 2028, 2030, 2032 and 2034. This includes all assumptions in the CENTRAL scenario for demand growth and the installed capacity of onshore and offshore wind, photovoltaics and ‘must run’ generators. The installed thermal generation fleet, based on existing and planned units, contributing to forced outages, are taken into account. Of course, the decision to enter or leave the market and the choice of technology and capacity is decided by the market. A sensitivity relating to the demand (high / low demand) and installed renewable capacity (High / Low RES) is conducted.
To analyse the available flexibility means, the same years as above are analysed with focus on 2034. A sensitivity relating to the available flexibility brought by end consumers is conducted (High / Low FLEX). A sensitivity is also conducted relating to additional capacity to cover the additional adequacy needs after 2025.

