2 minute read
FINDING MENTAL DISORDERS WITH MATH
Predicting Alzheimer’s progression
Often called the “long goodbye,” Alzheimer’s disease afflicts more than 5 million people in the U.S. Guo used fMRI data from the Alzheimer’s Disease Neuroimaging Initiative to track how brain connectivity changes over time. She compared brain images from people with Alzheimer’s, those with mild cognitive impairment, and those in a normal control group at baseline, six months, and 12 months. She was able to identify connectivity decreases between the sensorimotor and auditory networks and also between the default mode and auditory networks among the Alzheimer’s patients.

Guo and her team used those findings to build a predictive algorithm that can help forecast the rate of connectivity decline among various brain regions. “Our model takes into account each subject’s unique brain features, so it is individualized for each patient,” says Guo. “This tool could help forecast the progression of the disease, which could be useful in treatment planning.”
Merging disparate data
In recent years, researchers have started using multiple types of neuroimaging—sMRI, fMRI, DW-MRI—in an attempt to get a more complete picture of a mental disorder. Traditionally, each separate type of scan required a separate analytical tool to parse the data, but mental disorders are not so neatly contained.
“A mental disorder may impact the brain in different ways,” says Guo. “It may affect functions, but it may also affect structural and anatomical aspects of the brain. If we could combine the information from more than one type of scan, it would have the potential to reveal so much more.”
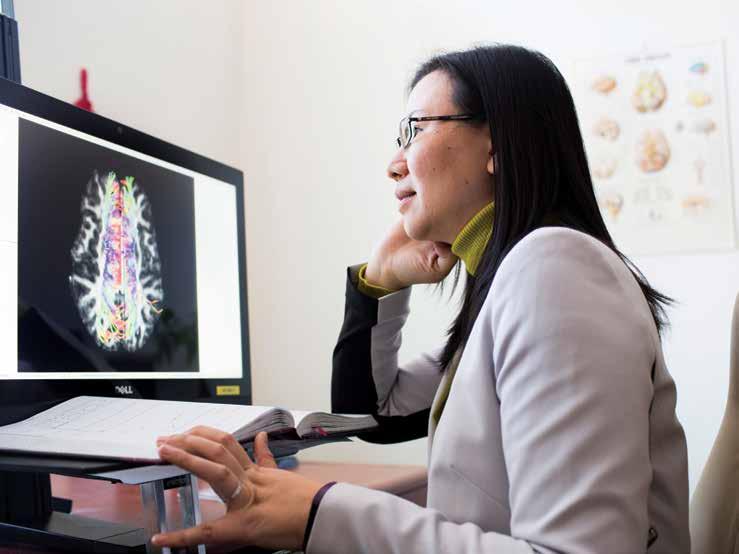
Toward this end, Guo and her colleague Jian Kang are working to develop a novel statistical tool that can analyze more than one type of scan, or in biostatistical parlance, multi-modality imaging. Then those scans could be jointly analyzed on that unified platform, something akin to the overhead projectors of old, where one transparency showing the body’s muscular system, for example, might be laid on top of one showing the skeletal system, resulting in a single image depicting the relationship of the two.
Guo is using scans from the rich imaging database of Emory neurologist Helen Mayberg, who has been studying brain-based subtypes of depression for many years, to test the new analytical tool. “Studying the brain is not linear or straightforward,” says Mayberg. “My group has a lot of well-characterized data, and Ying is able to use that to develop unique statistical tools. In turn, those tools may allow our data go to the next level and to say more than we originally anticipated.”
Guo also is working with Ki Sueng Choi in Mayberg’s lab to see if they can use multi-modality imaging to identify biomarkers for different stages of depression and to predict how well patients will respond to particular treatments.
“Innovative forms of scanning data have great promise, but they need equally innovative analytic tools to deliver on that promise,” says Waller. “Ying’s research aims to, and does, provide those tools.” n


