INTER (CONNECTED)NET (WORK)
The Internet, once a network limited to linking only a few universities in the United States, now connects over 4.57 billion people across every continent only 50 years later. Now more than ever people rely on the Internet for everything including socializing, entertainment, shopping, banking, and employment. As the number of people connected to the internet is increasing, the number of “things” connected is expanding as well, including light bulbs, motion sensors, smartphones, watches, and kitchen appliances, totalling to 50 billion in 2020.
However, across the globe not all countries have equal access to these advancements with various internet adoption barriers preventing it. Within the population, Internet use may be low due to unaffordability, low perceived benefit, and lack of capability with technology. To address this, we first need to tackle the supply issue: the insufficient access to mobile internet coverage and fixed broadband, as well as the electricity that powers the internet infrastructure. We must first provide the population with the Internet at low costs, for them to build the skills to take advantage of the digital realm and thus to create relevant content for themselves. Therefore this digital divide between countries is primarily an infrastructure divide.
Currently the concentration of Internet infrastructure and connectivity is between North America and Europe, with the rest of the world paying huge fees to access their data centers and IXPs through lengthy submarine cables to those distant countries. How can we improve the current internet infrastructure system which currently benefits first world countries, to better serve towards the advancements of developing countries? Can we design solutions for the Internet that are affordable and accessible, and will benefit the country on a whole?
In order to reach the user, Internet infrastructure begins at the “first mile”, where the submarine cables enter the country or continent at the shore. Submarine cables transfer 99% of all data and so we start by studying the root to redefine the system. By locating other elements of internet infrastructure such as the data center in the realm of the ocean, we start to see many opportunities arise such as reducing the cooling loads for the equipment, proximity to renewable marine energy, creating an ecosystem to encourage marine life, and reduced latency with over half of the world population is living within 200km from the ocean.
Certain developing countries have unstable social, political, and economic landscapes that dictate their lack of internet penetration. In contrast, the Internet is a universal and ubiquitous force that is rarely confined to borders or boundaries. By having Internet infrastructure as a neutral entity, owned and funded by the collective global whole to be located in international waters where it is free and open to all mankind, it becomes a public project for universal access rather than a profit oriented capitalist venture.
Locations with virtually no Internet infrastructure currently is an opportunity to rethink the current methods of connectivity. A new typology arises: the universal relay station in the ocean, integrated across the globe with the submarine cable network, acting as a sustainable marine energy generation station, a vibrant marine habitat, and a data center servicing countries affected by internet access inequality.
Julianne Guevara Rogier Tamminga Yanchen Wang
INTER(CONNECTED)-NET(WORK)
TABLE OF CONTENTS
RESEARCH
The Digital Divide
The Infrastructure Divide
The First Mile
The Undersea Environment
DESIGN
Re-wired First Mile and a New Paradigm for the Digital Future
RESEARCH
THE DIGITAL DIVIDE
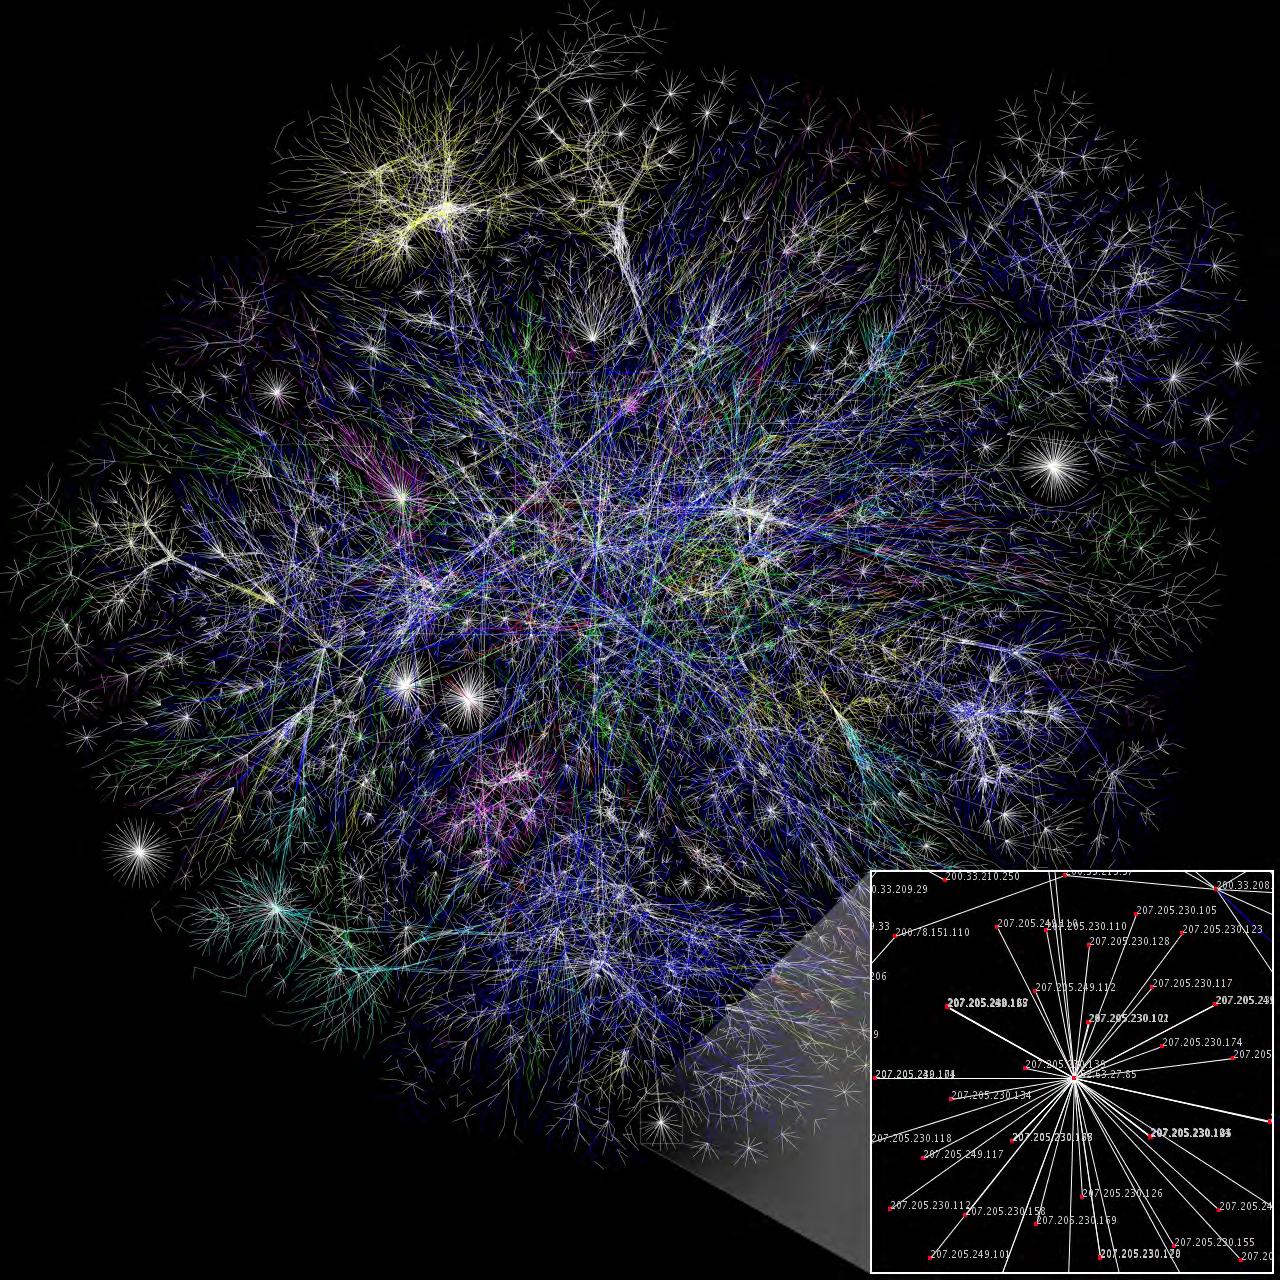
THE EXPANSIVENESS OF THE INTERNET The Opte Project Barrett Lyon (2003)
41% of the population is still left in the dark
THE UBIQUITY OF THE INTERNET AND THE DIGITAL DIVIDE
Although 4.57 billion people were active internet users as of April 2020, encompassing 59 percent of the global population, this means that still 41% of the population hasn’t accessed the internet, and uneven internet distribution exists in the world.
DIGITAL REPORT 2020
Mankind has entered a new age of information technology application, and the ubiquitous network society is a new feature of this era, in which information technology will be highly developed and infinitely integrated.
People can access things through the network, and correspondingly, the network system can access people associated with things through the label, such as e-commerce, digital wallet, e-government, etc. At the same time, people can also contact each other through the Internet without the restriction of the physical environment; and with the development of IoT (Internet of Things), interoperability between things, through the network to achieve the exchange of information between things, such as car navigation, logistics tracking, smart housing…


The era of big data is changing our information environment, allowing us to connect to the world and participate in society. However, not everyone has the opportunity to enter the Big Data era.
By and large; the digital divide refers to inequality in access to, or ability to use, information and communication technologies. Such a divide may exist between populations and geographic areas in a given country or between countries. The global digital divide, often refers to the fact that the internet has not spread evenly throughout the world.
“4.57 billion people were active internet users as of April 2020, encompassing 59 percent of the global population.”
The idea of the “digital divide” refers to the growing gap between the underprivileged members of society, especially the poor, rural, elderly, and handicapped portion of the population who do not have access to computers or the internet.
TIMELINE


The history of the internet starts in 1967, when Arpanet is founded in the USA. Since then, a few important moments further shape the internet. In 1988, for the first time an email crosses the ocean and arrives in Europe. In 1989, this leads to the world wide web, based on the communication and storing system that was developed by scientists in Cern. From 1993 until 2000, the few companies that now dominate the world were founded. In the year 2000, the internet bubble collapsed. In 2004, the way the internet was used changed enormously. While previously the internet was mainly used for communication, the internet became a platform itself. It changed from the means to the end goal. Nowadays, there are a few big companies who have a large market share in the internet. These are Google, Amazon, Facebook, Alibaba and Tenscent.
1960 1970 1980 1990 2000 2010 2020 2030 25% 50% 75% 59% Google 17.9% Amazon 17.9% Facebook 11.4% Alibaba 11.1% Tenscent 9.0% Others 32.7% 1967 ARPAnet 1974 TCP/IP 1982 EUnet 1978 1st spam 1986 1st malware 1993 Lycos 1st search engine 1988 Transatlantic 1999 Banking 1989 WorldWideWeb 1997-2000 dot-com bubble 2007 Mobile revolution Iphone 2010 2019 Market share of the six biggest internet companies Internet in outer space 2004 Web 2.0 “Web as platform” INTERNET PENETRATION
INTERNET OF THINGS
Today, the Internet is a ubiquitous force. An increasing amount of Things are being connected to the Internet every year in addition to people, and even more so. This reached to 50 billion Things in 2020.
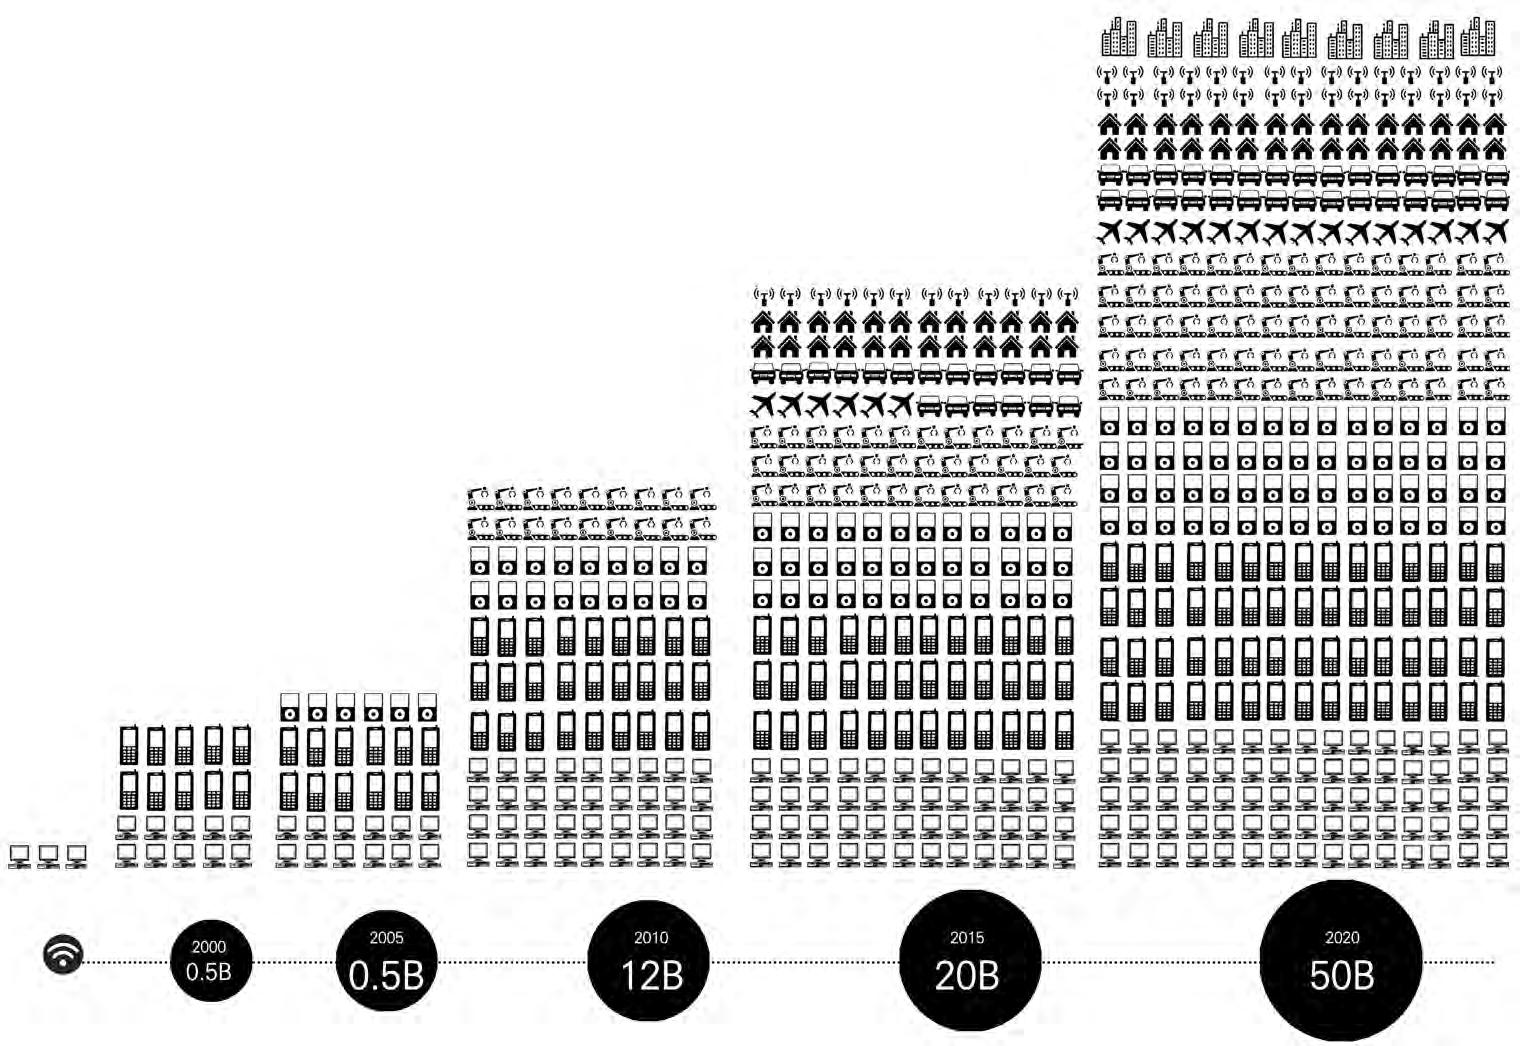
“The new rule for the future is going to be, anything that can be connected, will be connected.”
Jacob Morgan, Forbes 2014
INFORMATION SOCIETY
We live in an information society where the Internet is an incredibly vital form of human engagement and connection today; a society where every single minute there are 190 million emails being exchanged across the globe.
190.000.000
Emails sent
59.000.000 Messages sent
764.000 Hours watched
1.100.000 Dollars spent online
2.500.000
Snaps created
694.444 Scrolling Instagram
194.444 People tweeting
1.300.000
Logging in
19.000.000
Texts sent
400.000 Apps downloaded
4.100.000 Search queries
1 minute on the Internet
1.600.000 Swipes
1.400 Downloads
1.200.000 Views
2.500.000 Images viewed
4.700.000
Videos viewed
305 Smart speakers shipped
Since the first Covid-19 death in the US on February 29th, the Internet usage across multiple platforms have skyrocketted. This is due to the increase of people staying home while needing to connect to people outside, as well as having more free time for entertainment. During this time more than ever, it is evident that the Internet has become a necessity rather than a choice in order to function in society.
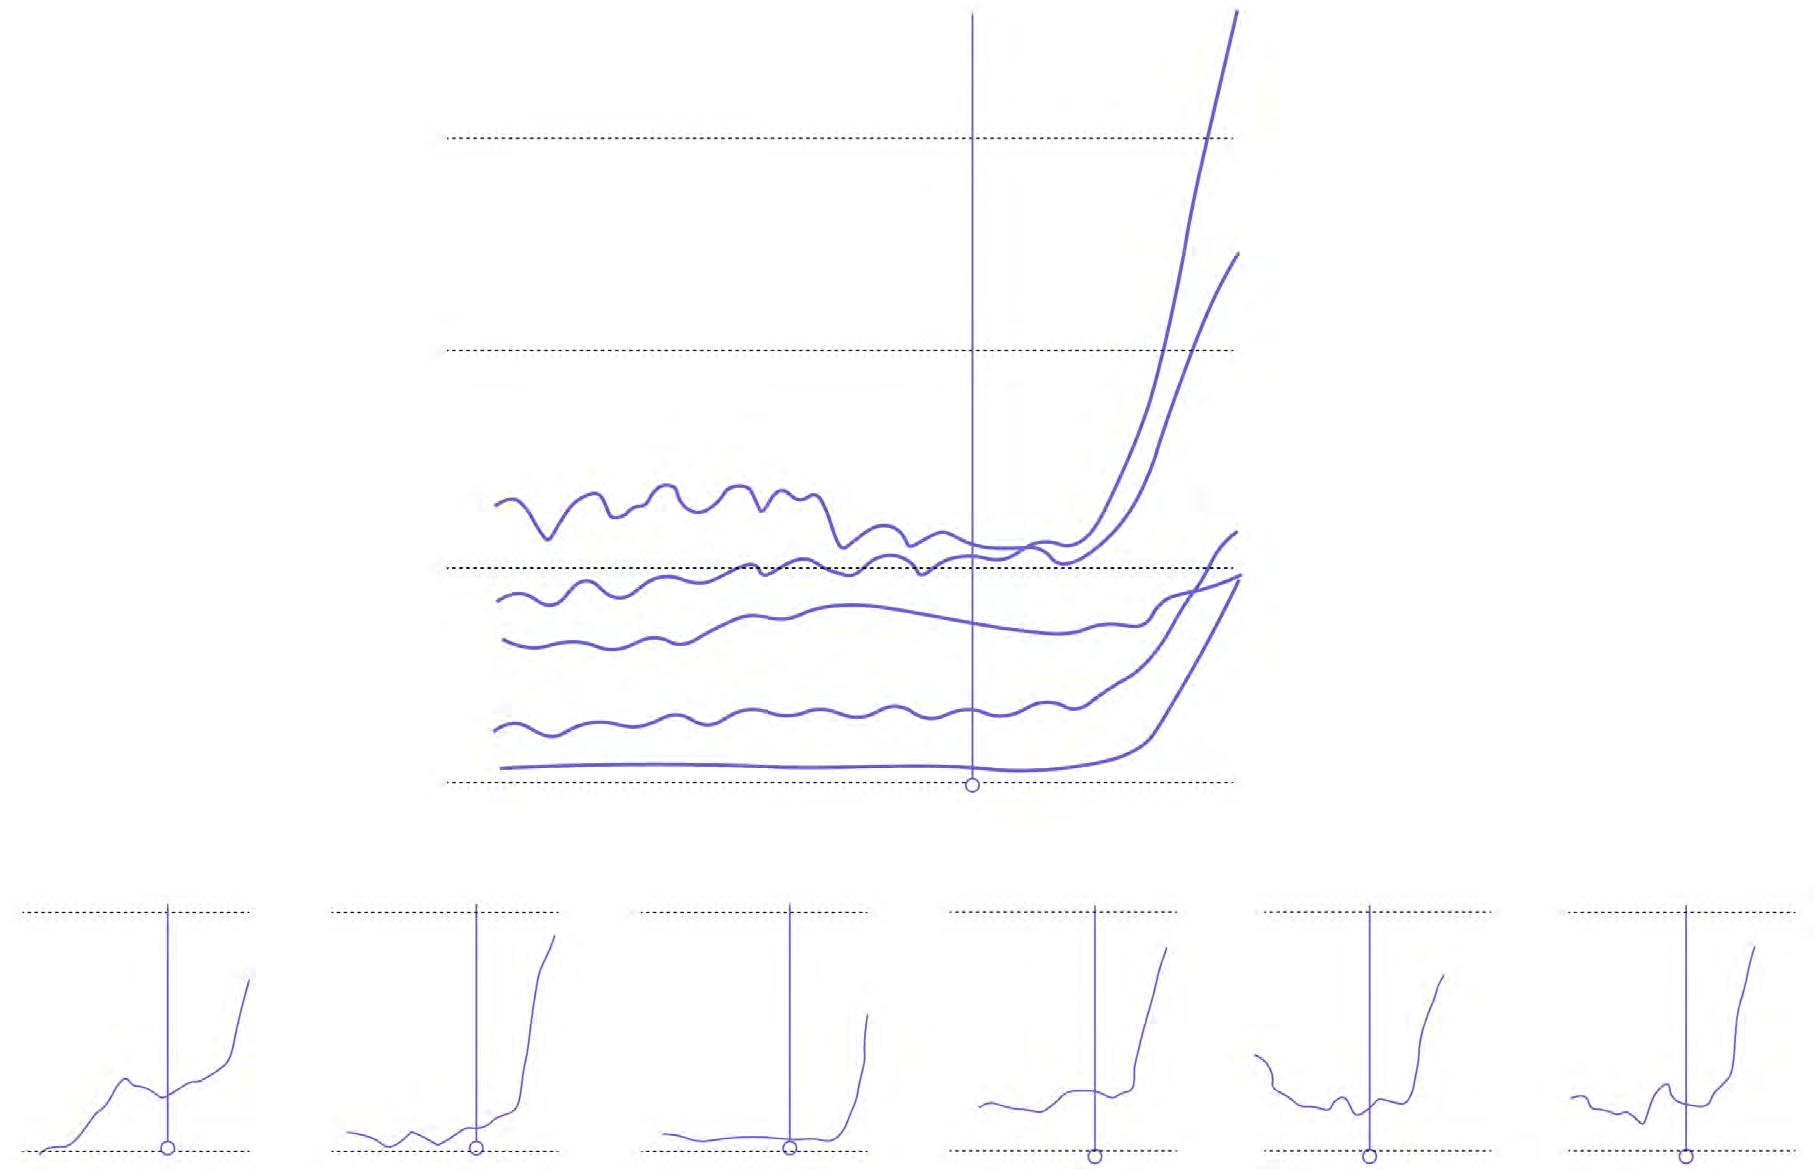
6M 4.8M 5.0M 1.8M 4.1M 3.5M 0.6M 4M 2M 0 Daily app sessions for popular remote work apps Google Duo Nextdoor.com Houseparty +12.4% +73.3% +79.4% Zoom 170M 26M 200M 120M 16M 160M Feb. 29 First U.S. Covid-19 death Google Classroom Microsoft Teams VPN Super Unlimited Proxy Hangouts Meet by Google Facebook.com Netflix.com Youtube.com +27.0% +16.0% +15.3%
COVID-19
GLOBAL INTERNET PENETRATION AND BANDWIDTH MAPPING

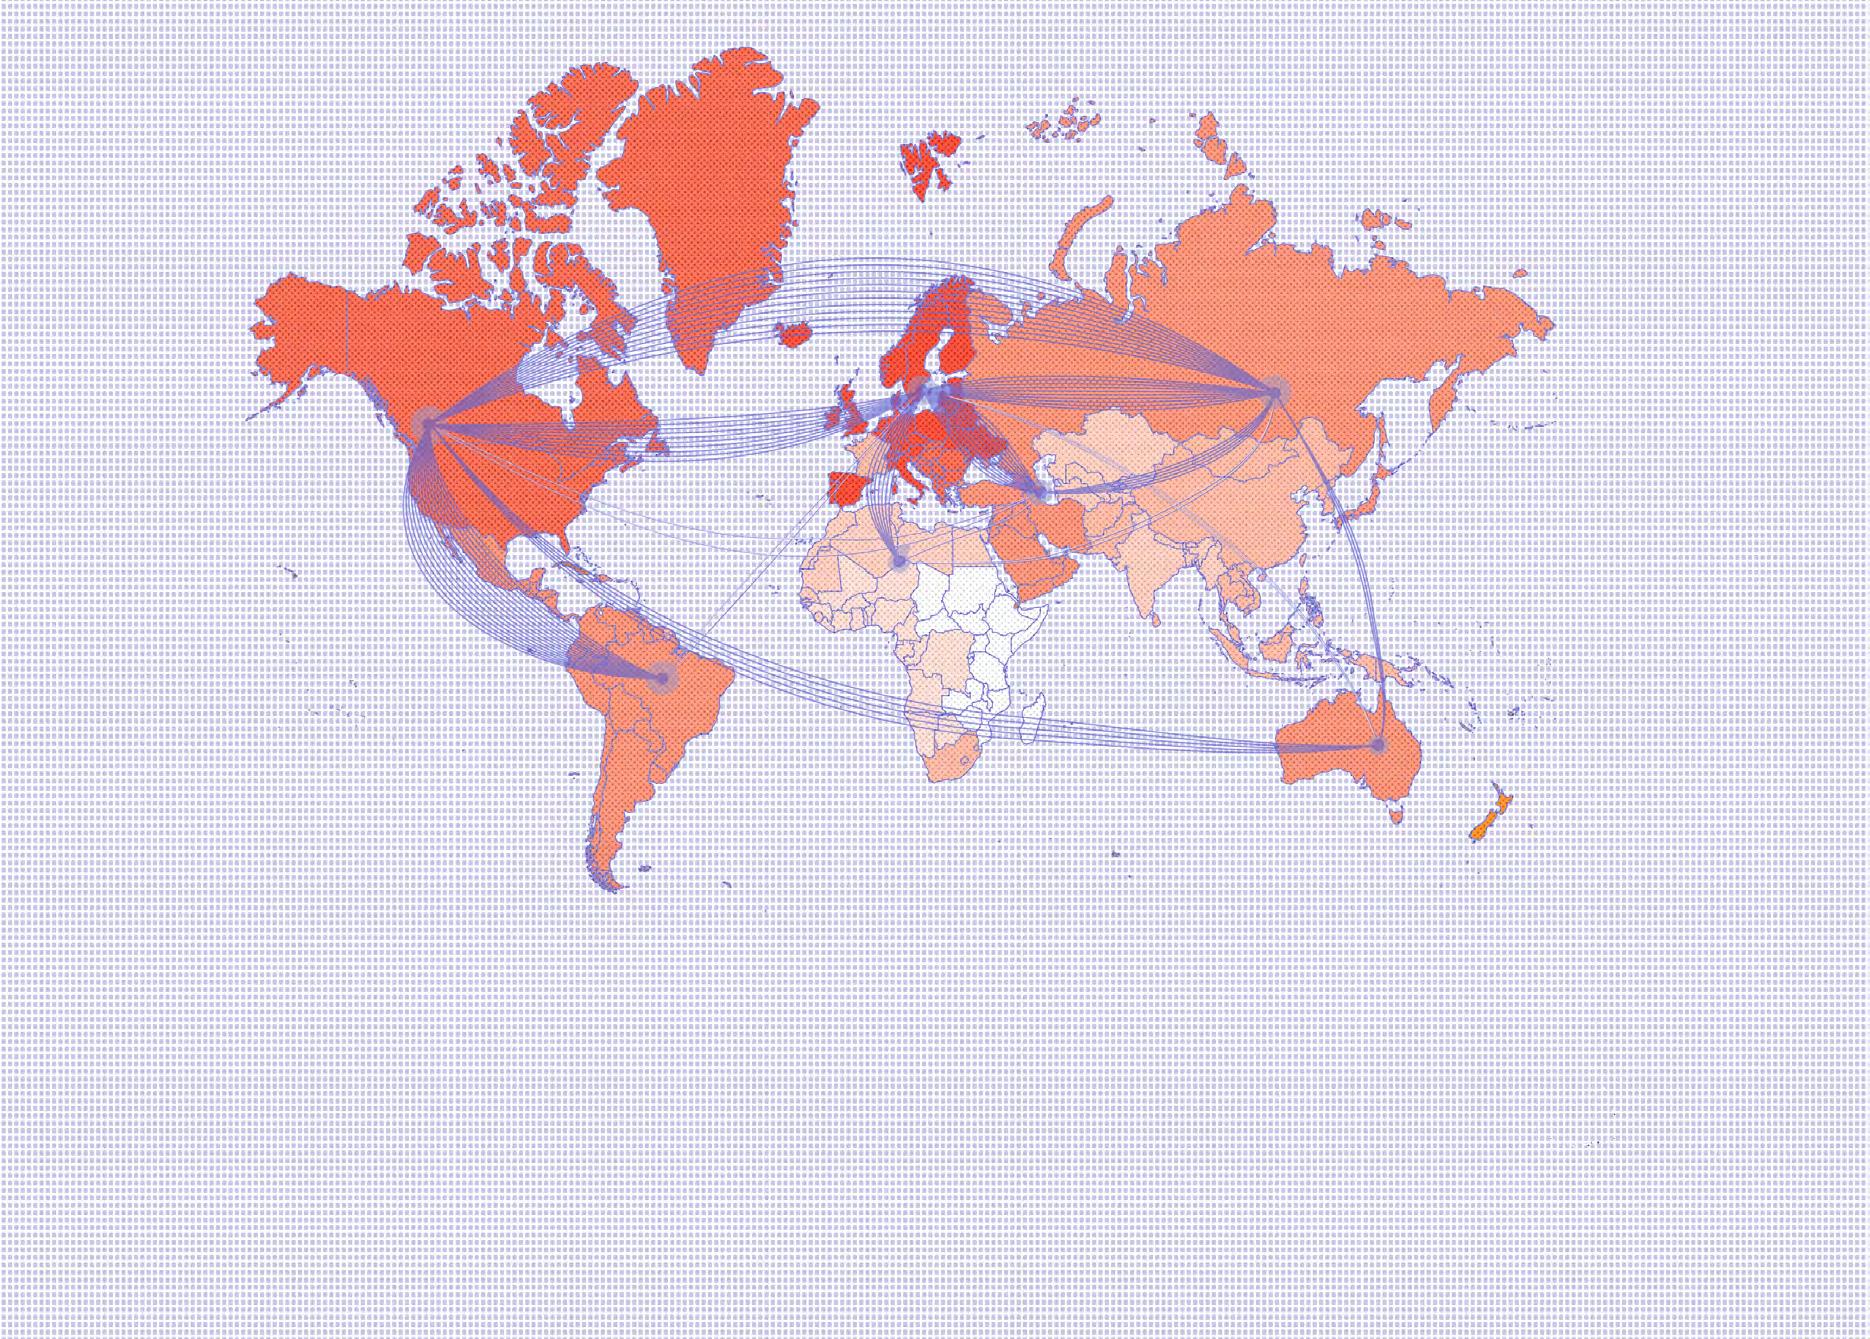
Looking at the current state of the digital divide, although the number of Internet users have steadily increased over time, the map highlights regions of inequality where the bandwidth and Internet penetration levels remain especially low, such as several countries in Africa.
Global Internet Penetration & User Growth
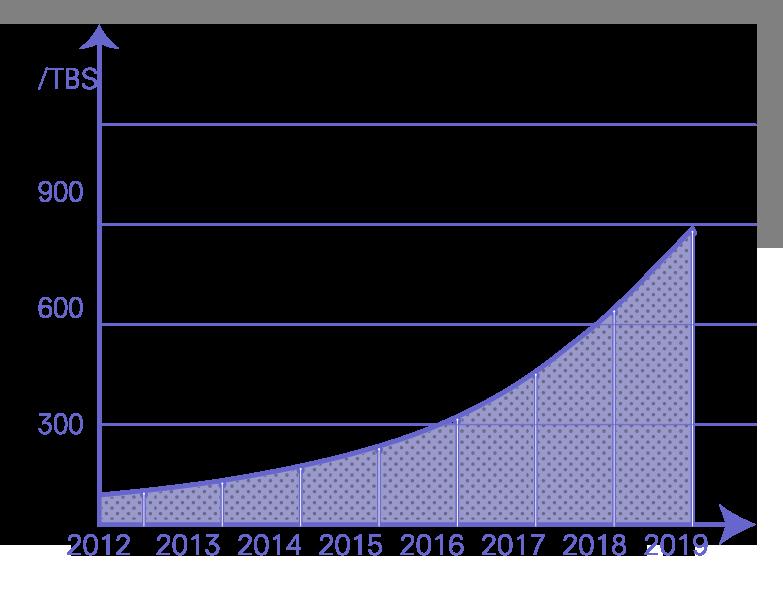
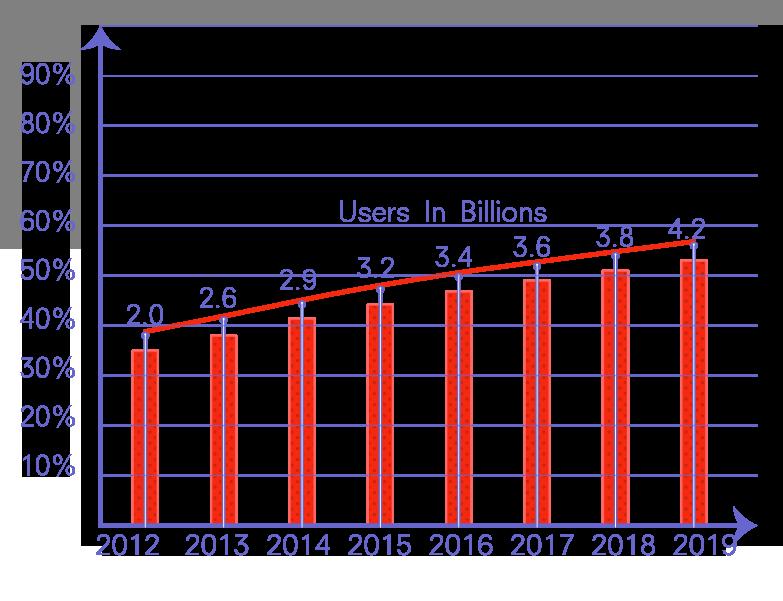
Global Used International Bandwidth Bandwidth Internet Penetration 10.000 5000 2500 500 (Gbps) 20% 100%
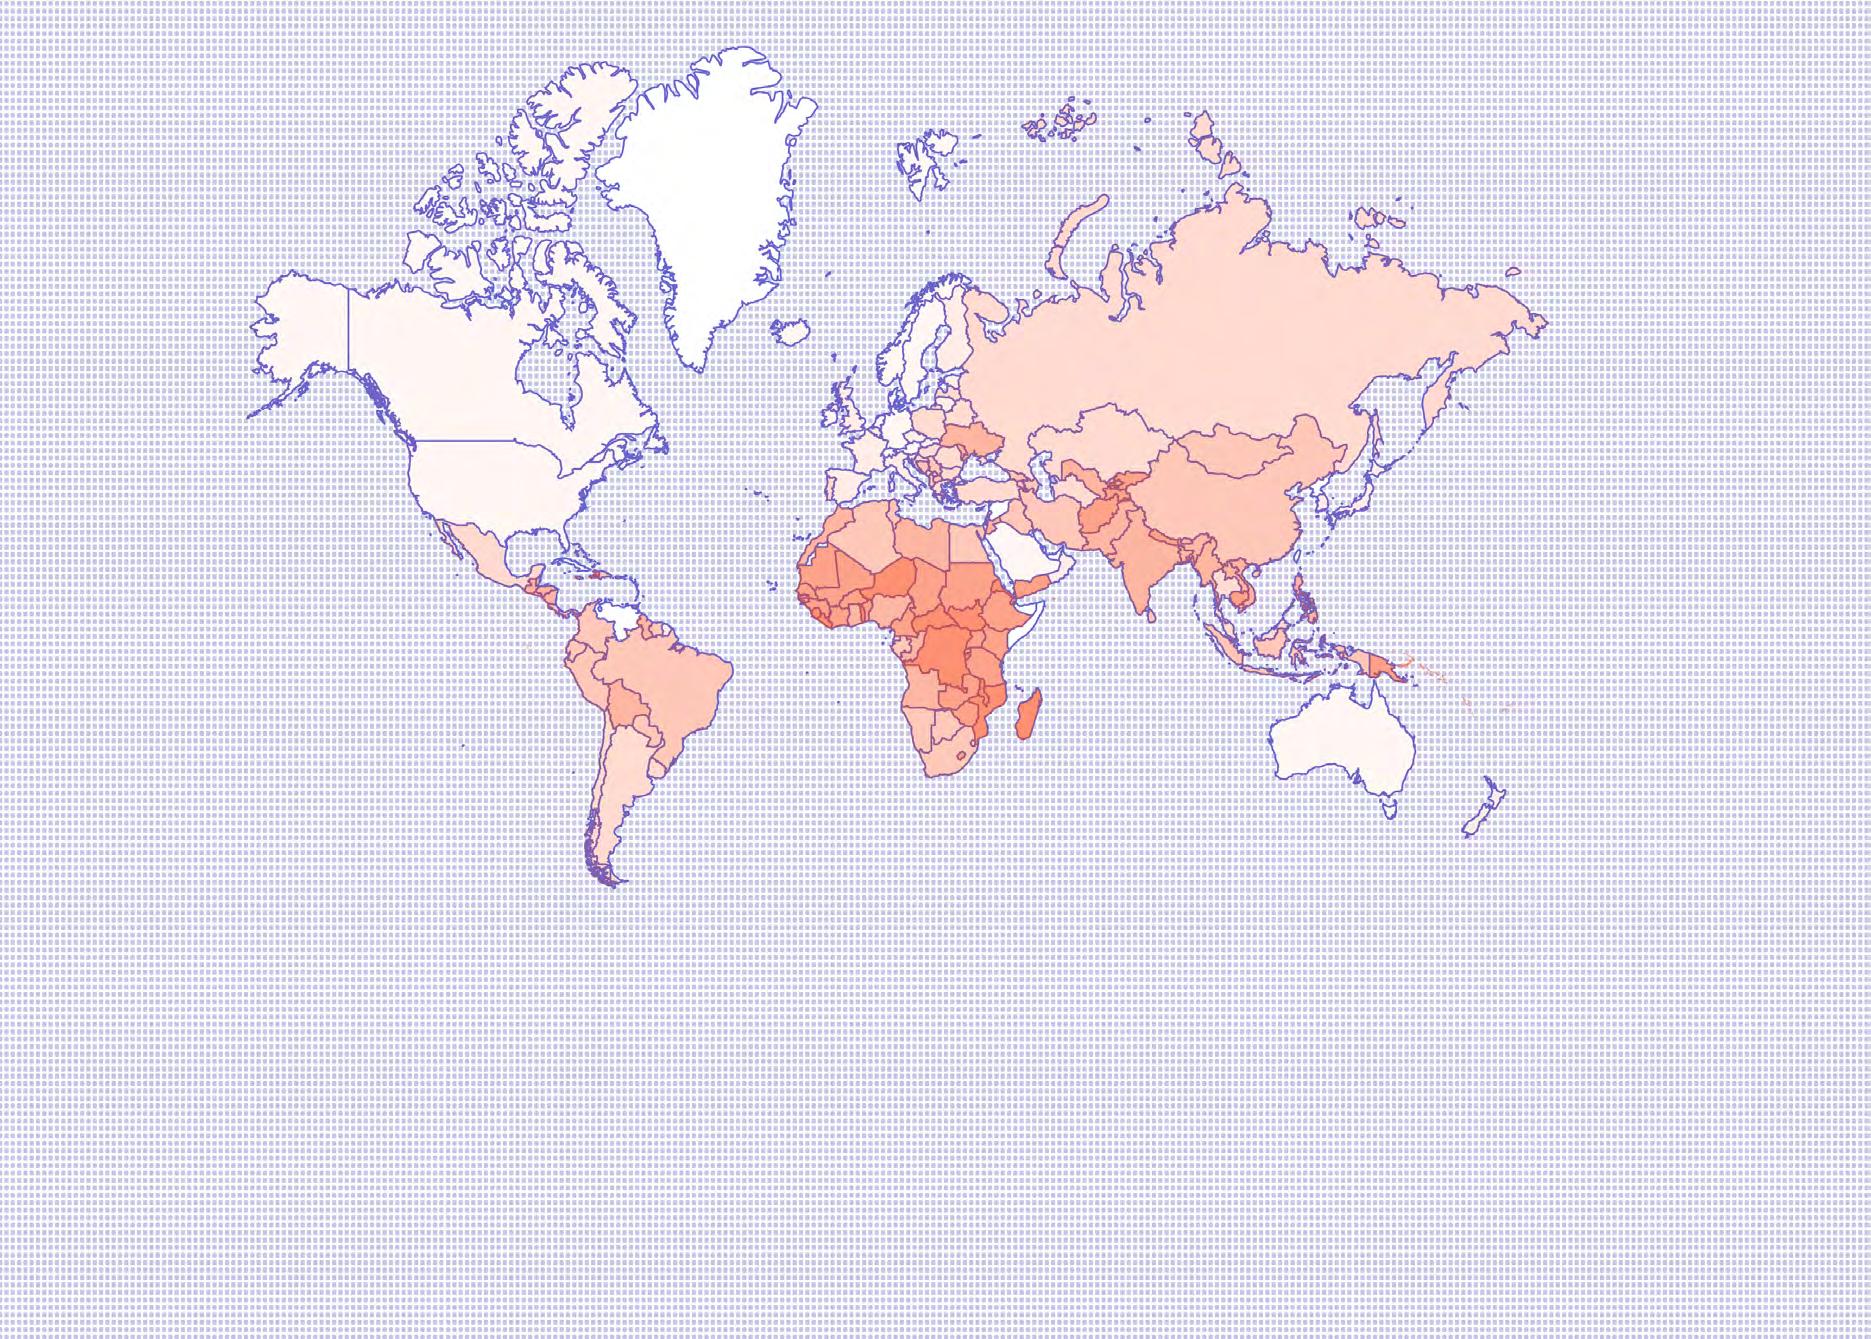
INTERNET ADOPTION BARRIERS
A large proportion of the global population remains unconnected today, with each region facing unique challenges, some more than others. At the user level, barriers toward Internet use include affordability, relevance, and capability. However, one of the underlying causes of those issues would be poor access to supply, addressed through Internet infrastructure (including the electricity that powers it).
The Americas
Affordability
Cost of end-user devices, services, access and ancillary costs.
Low income levels.
Commonwealth of Independent States Asia-Pacific Africa & Arab States
DEMAND
SUPPLY
Relevance
Low perceived benefit, trust, and interest with being online.
Lack of relevant content, services, or apps.
Capability
Infrastructure
Insufficient access to mobile Internet coverage and fixed broadband.
Lack of supporting infrastructure such as electricity.
Europe
GDP (PPP) per capita
Low level of literacy and education. Lack of proper information and communications technology (ICT) skills. high low
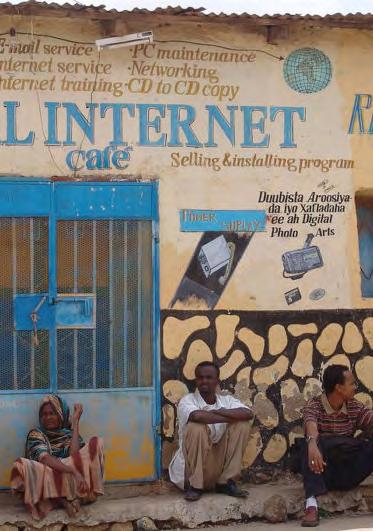
“In a society where increasingly we are defined by access to information and what we earn is what we learn, if you don’t have access to technology, you’re going to be left in the digital dark ages. That’s what the digital divide is all about.”
William Kennard, the Chair of the FCC
REAL INTERNET
Jigjiga, Ethiopia
Photo: Charles Roffey
THE INFRASTRUCTURE DIVIDE
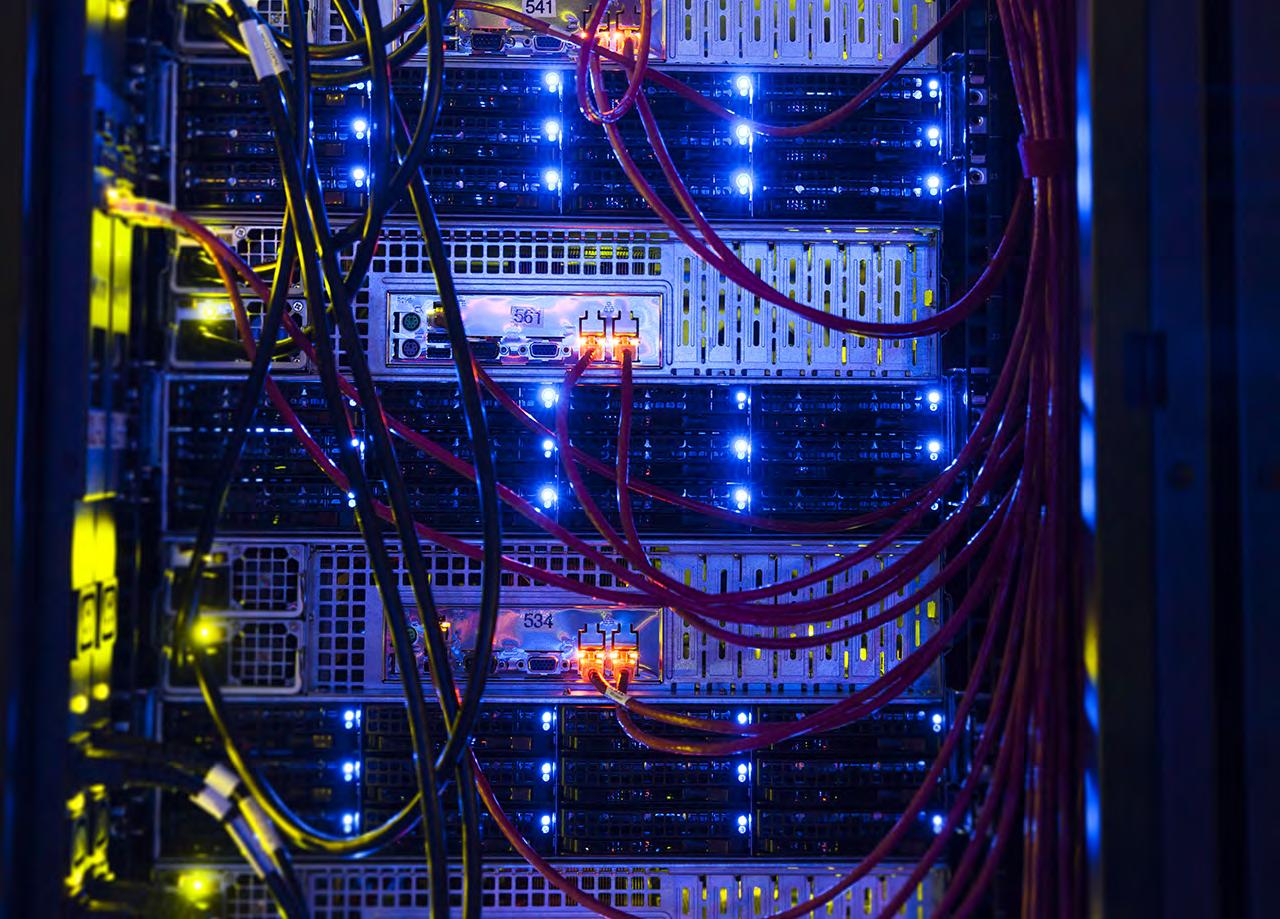
DATTO DATA CENTER
Photo: https://imgur.com/gallery/C8kAQ
THE DIGITAL DIVIDE IS AN INFRASTRUCTURE DIVIDE
 Robert G. Rogers, Executive Director, Global Information Infrastructure Commission
Internet infrastructure is usually defined as the collection of hardware and software required to enable Internet applications. Critical software services like the Domain Name System (DNS), Email, website hosting, authentication and authorization, storage systems, and internet servers are considered critical components. And the digital information we receive is stored in every data center and transmitted
over physical cables and fibers, or over the satellite wireless propagation. Other types of hardware that support the Internet include routers, servers, cell phone towers, wireless transmission via satellite. Radios, smartphones, and other devices.
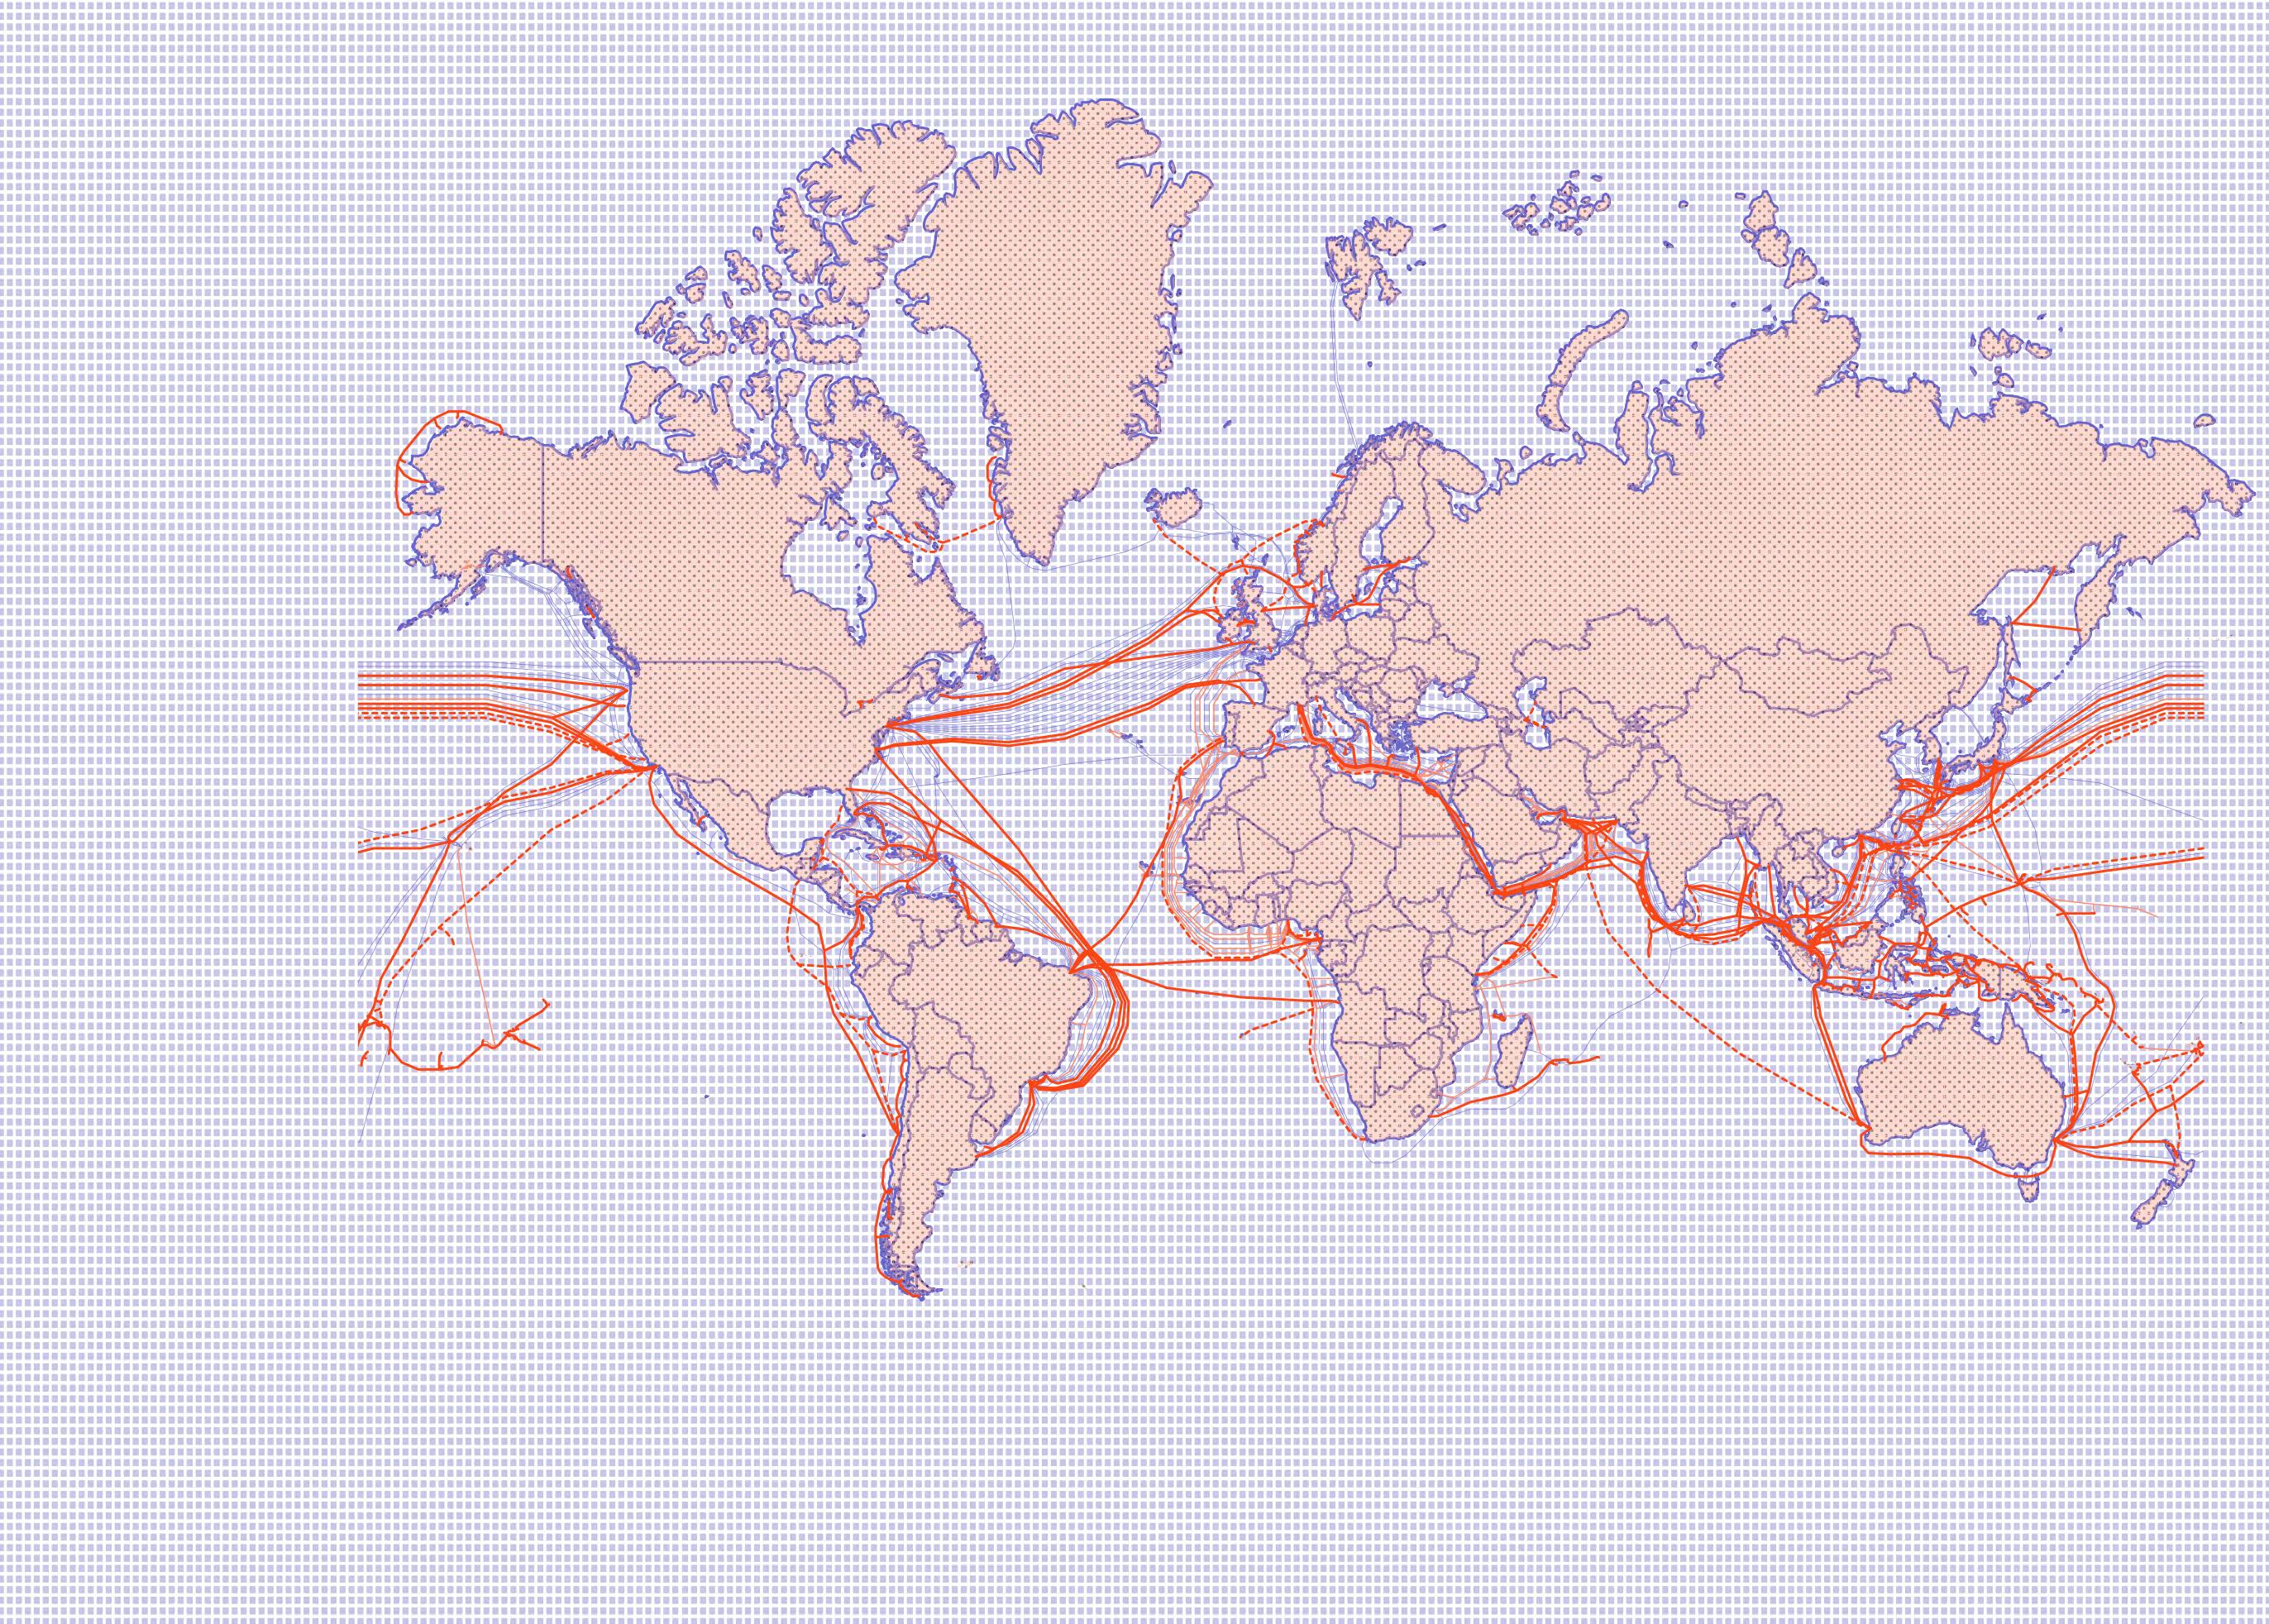
Since the first undersea telegraph cable was laid in 1850 between England and France, then it extended to across the Atlantic Ocean in 1866, the most powerful continents were connected. With the development of communication technology. In the early Web era, the internet is regarded as a force for achieving knowledge equality, a way for the poor and the marginalized to gain power. However, the internet is creating a new divide in our society, between those who are part of the new economy and those who are not able to join in it.
Until today, where the level of economic activity is low, the distribution of Internet infrastructure remains relatively small and access levels relatively low. The number of submarine cables and communications satellites and the speed of broadband are also vastly different in developed and third world countries. the uneven distribution of Internet infrastructure creates and exacerbates the digital divide.
Internet infrastructures connect together in many different ways to form the digital network and have become linked to geographical economic development and social well-being. Large numbers of data centers and efficient submarine cables and satellites are in the hands of Internet giants and developed countries, leaving countries that cannot afford internet infrastructure in the digital dark or delayed networks.
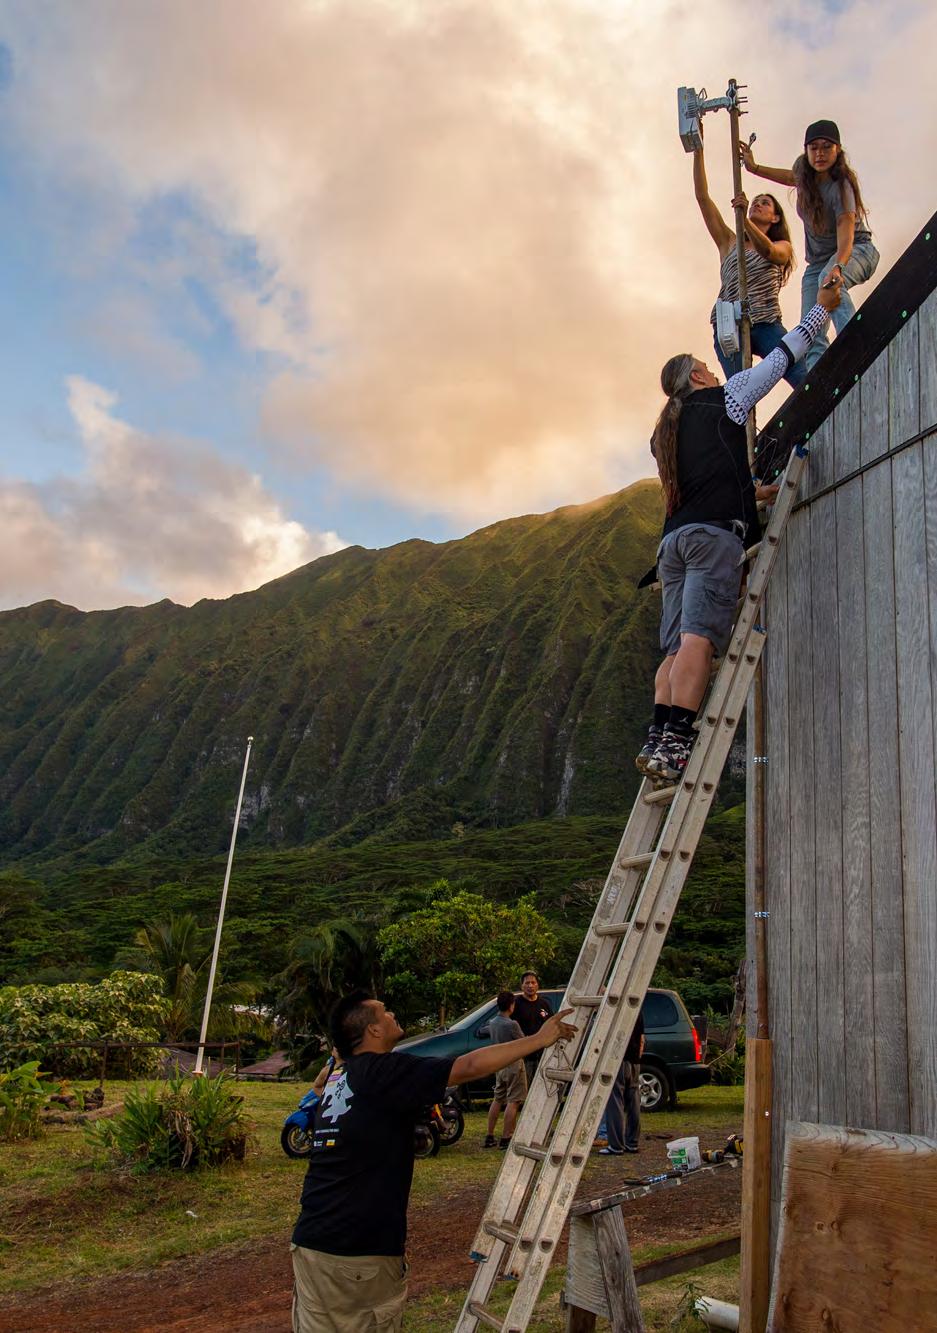
Maka‘awa‘awa, Matt Rantanen, Triggs and Darrah Blackwater help the Nation of Hawai‘i set up a community broadband network.
Photo: Christopher Mitchell
“So, if the Digital Divide is anything, it is first an infrastructure divide. It has next to nothing to do with a shortage of information appliances and almost everything to do with the unglamorous, gritty, siltencrusted, and costly mélange of wires, conduits, poles, switches, and other assorted gear that make up the underbelly - or nervous system - of the much-touted ‘information society.’”
INTERNET “MILES”
In relation to the country, we can categorize the infrastructure at 3 main levels: the first mile is where the Internet enters the country, the middle mile is where it passes through the country, and the last mile is where it reaches the end users. There is also the invisible mile which includes virtual elements that ensure the integrity of the network.

INFRASTRUCTURE NETWORK
In the physical environment, the traditional flow of data begins at the submarine cables, meets at the landing station, passes through a data center and IXP, then finally reaches our homes.

Users > 95% < 5%
1. Send request
Light signals Electrical signals Electromagnetic wave Light signals Users Browsers DNS ISP in Data Centre Submarine Cables Satellite Satellite Terminal Routers in Home Internet Cables Laptop Phone Cell Towers
2. Corresponding
SATELLITES VS SUBMARINE CABLES
Many wrongly assume that internet mainly travels via satellite when in fact 99% of data travels by submarine cables. When comparing data transfer between satellites and submarine cables, cables are much faster due to higher capacity and shorter communication distance. In addition, satellites are often inhibited by unpredictable weather conditions
250 Tbps
Starlink by SpaceX
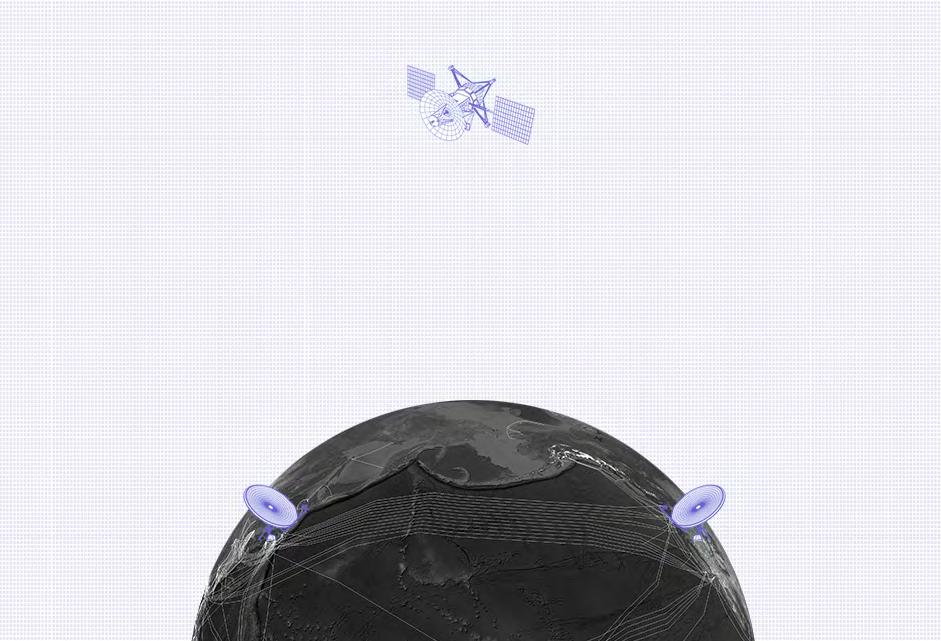
24 Tbps
36.000 km
9.000 km
Dunant by Google
POPULATION DENSITY
Population density and internet infrastructure have a positive correlation. However, it is also evident that there are regions with high population density that still lack many of these essential Internet infrastructures.
PointsSubmarine CablesTerrestrial Cables
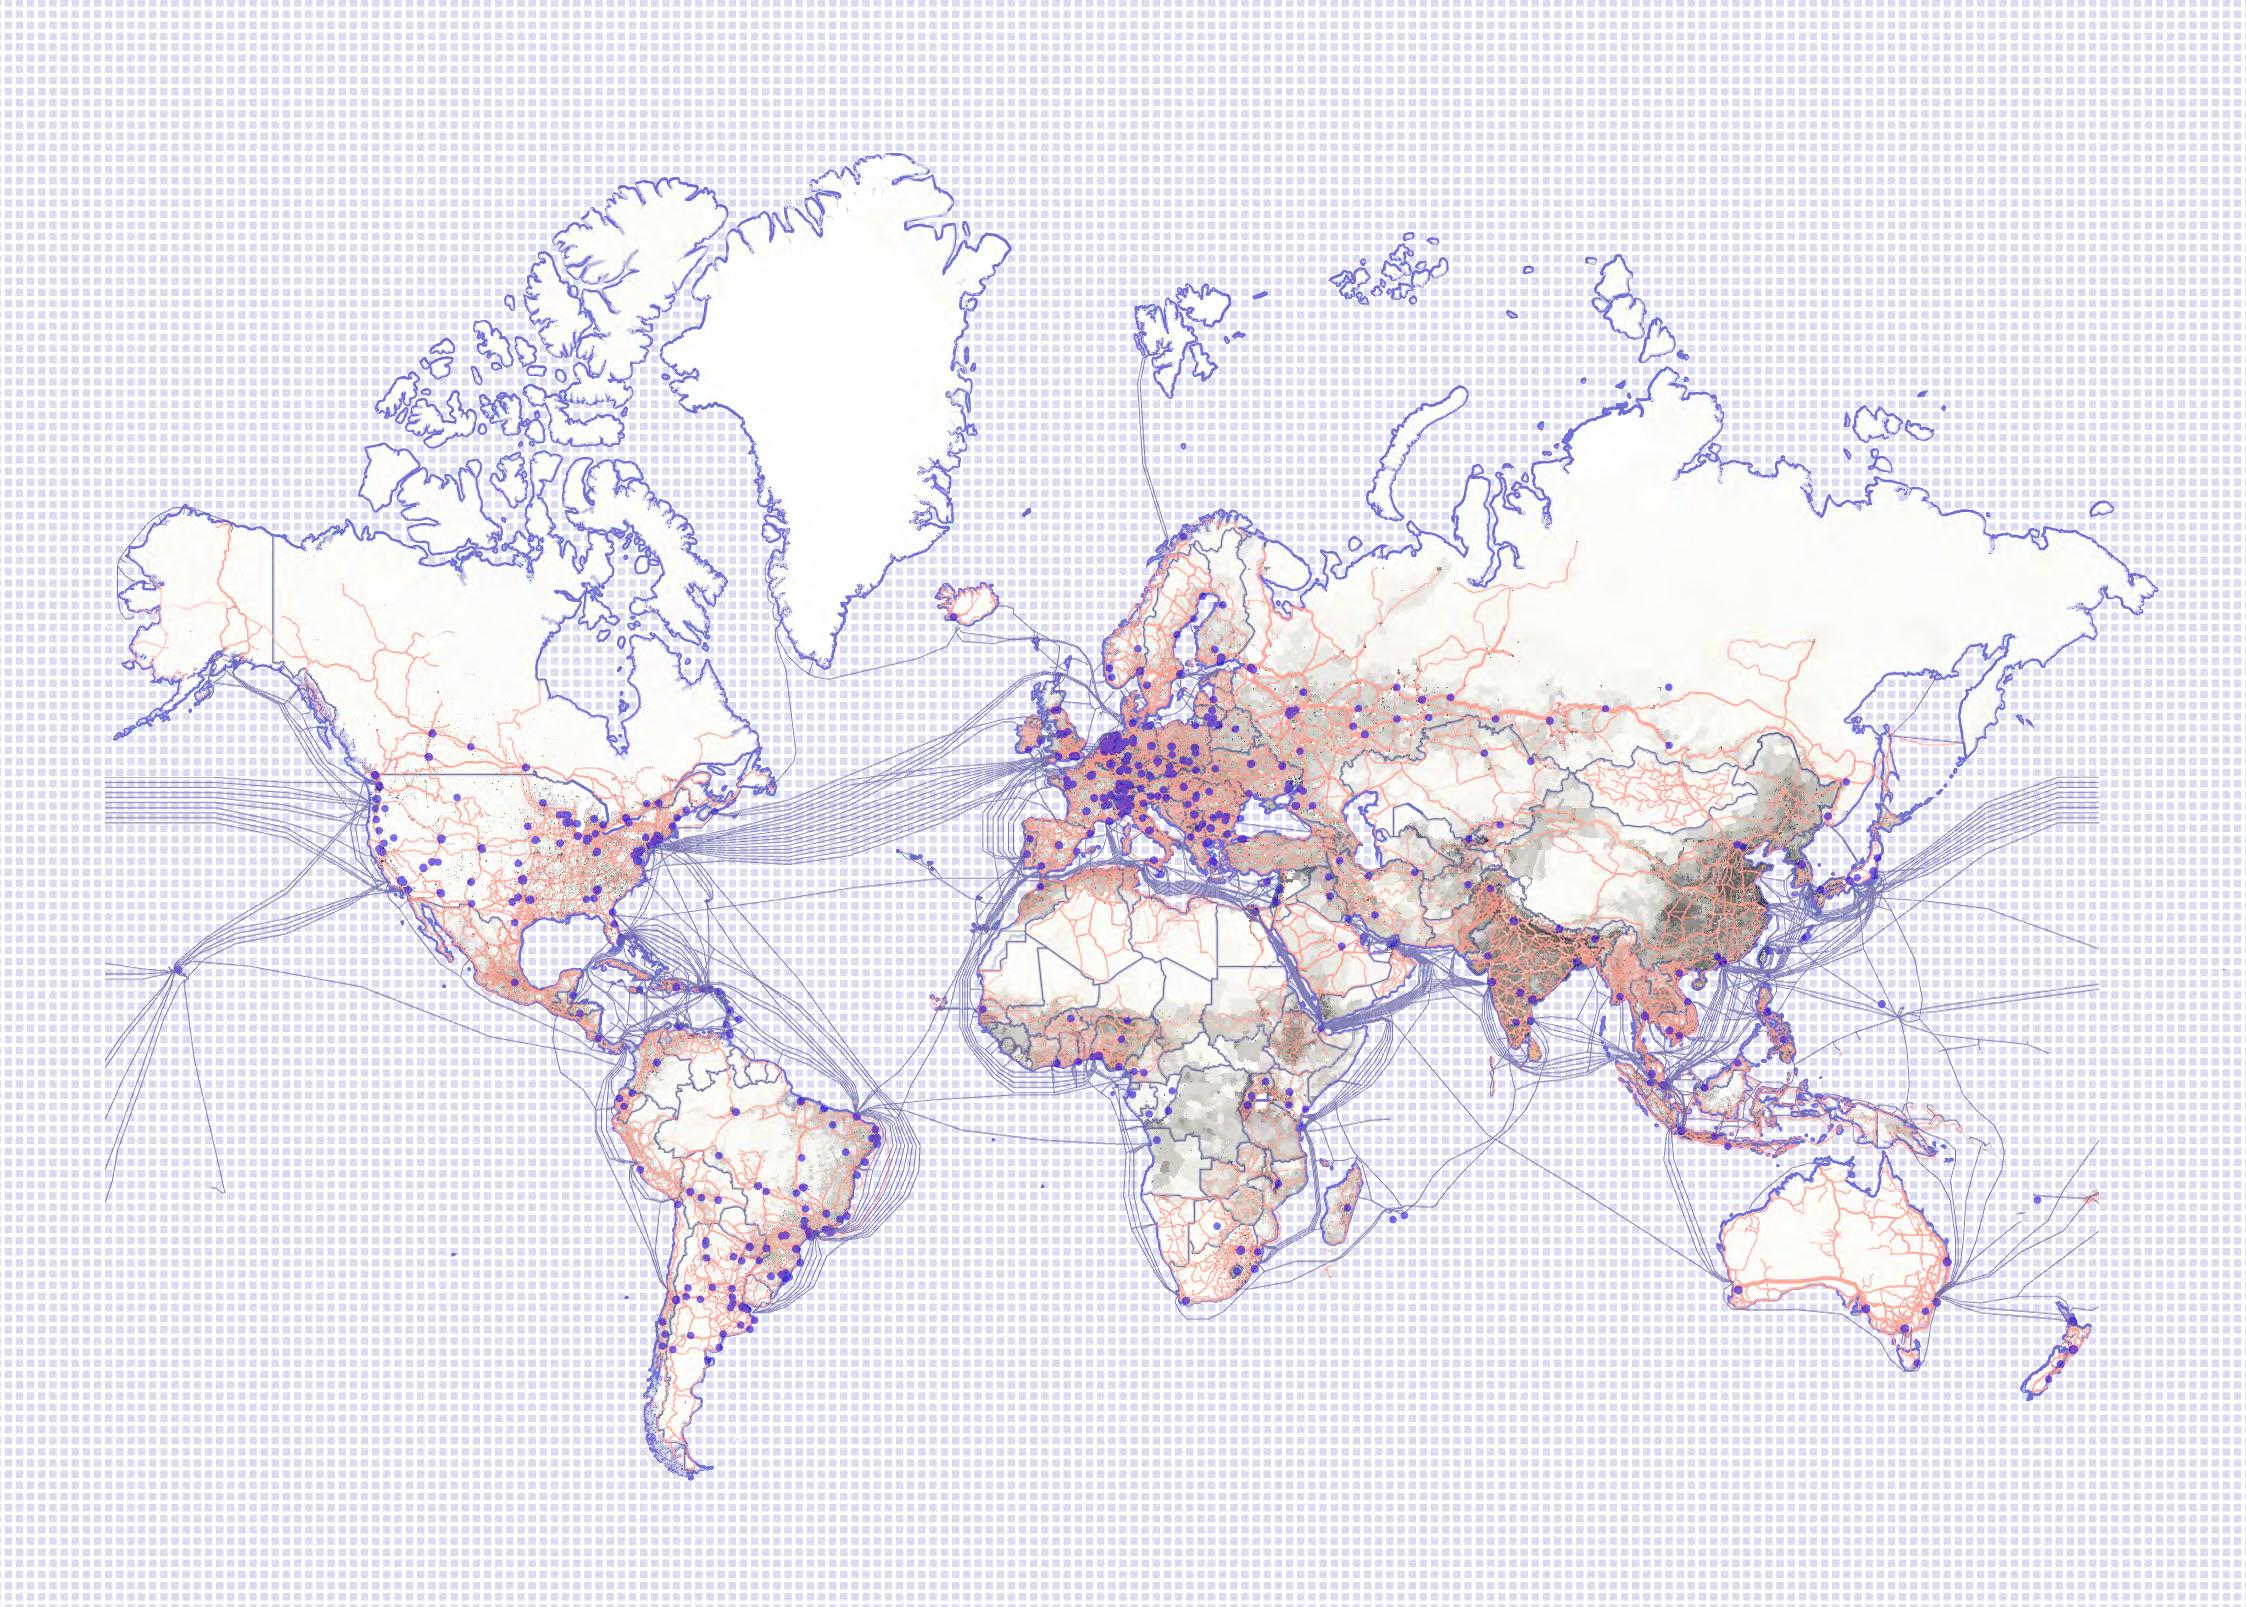
Internet
Exchange
0 >1000 Population Density (persons per sqkm)
GDP (PPP) PER CAPITA
Similarly, regions with higher GDP tend to have more comprehensive Internet infrastructure networks. The regions with the lowest GDP are severely lacking in connectivity, for example, central Africa.
Internet Exchange PointsSubmarine CablesTerrestrial Cables
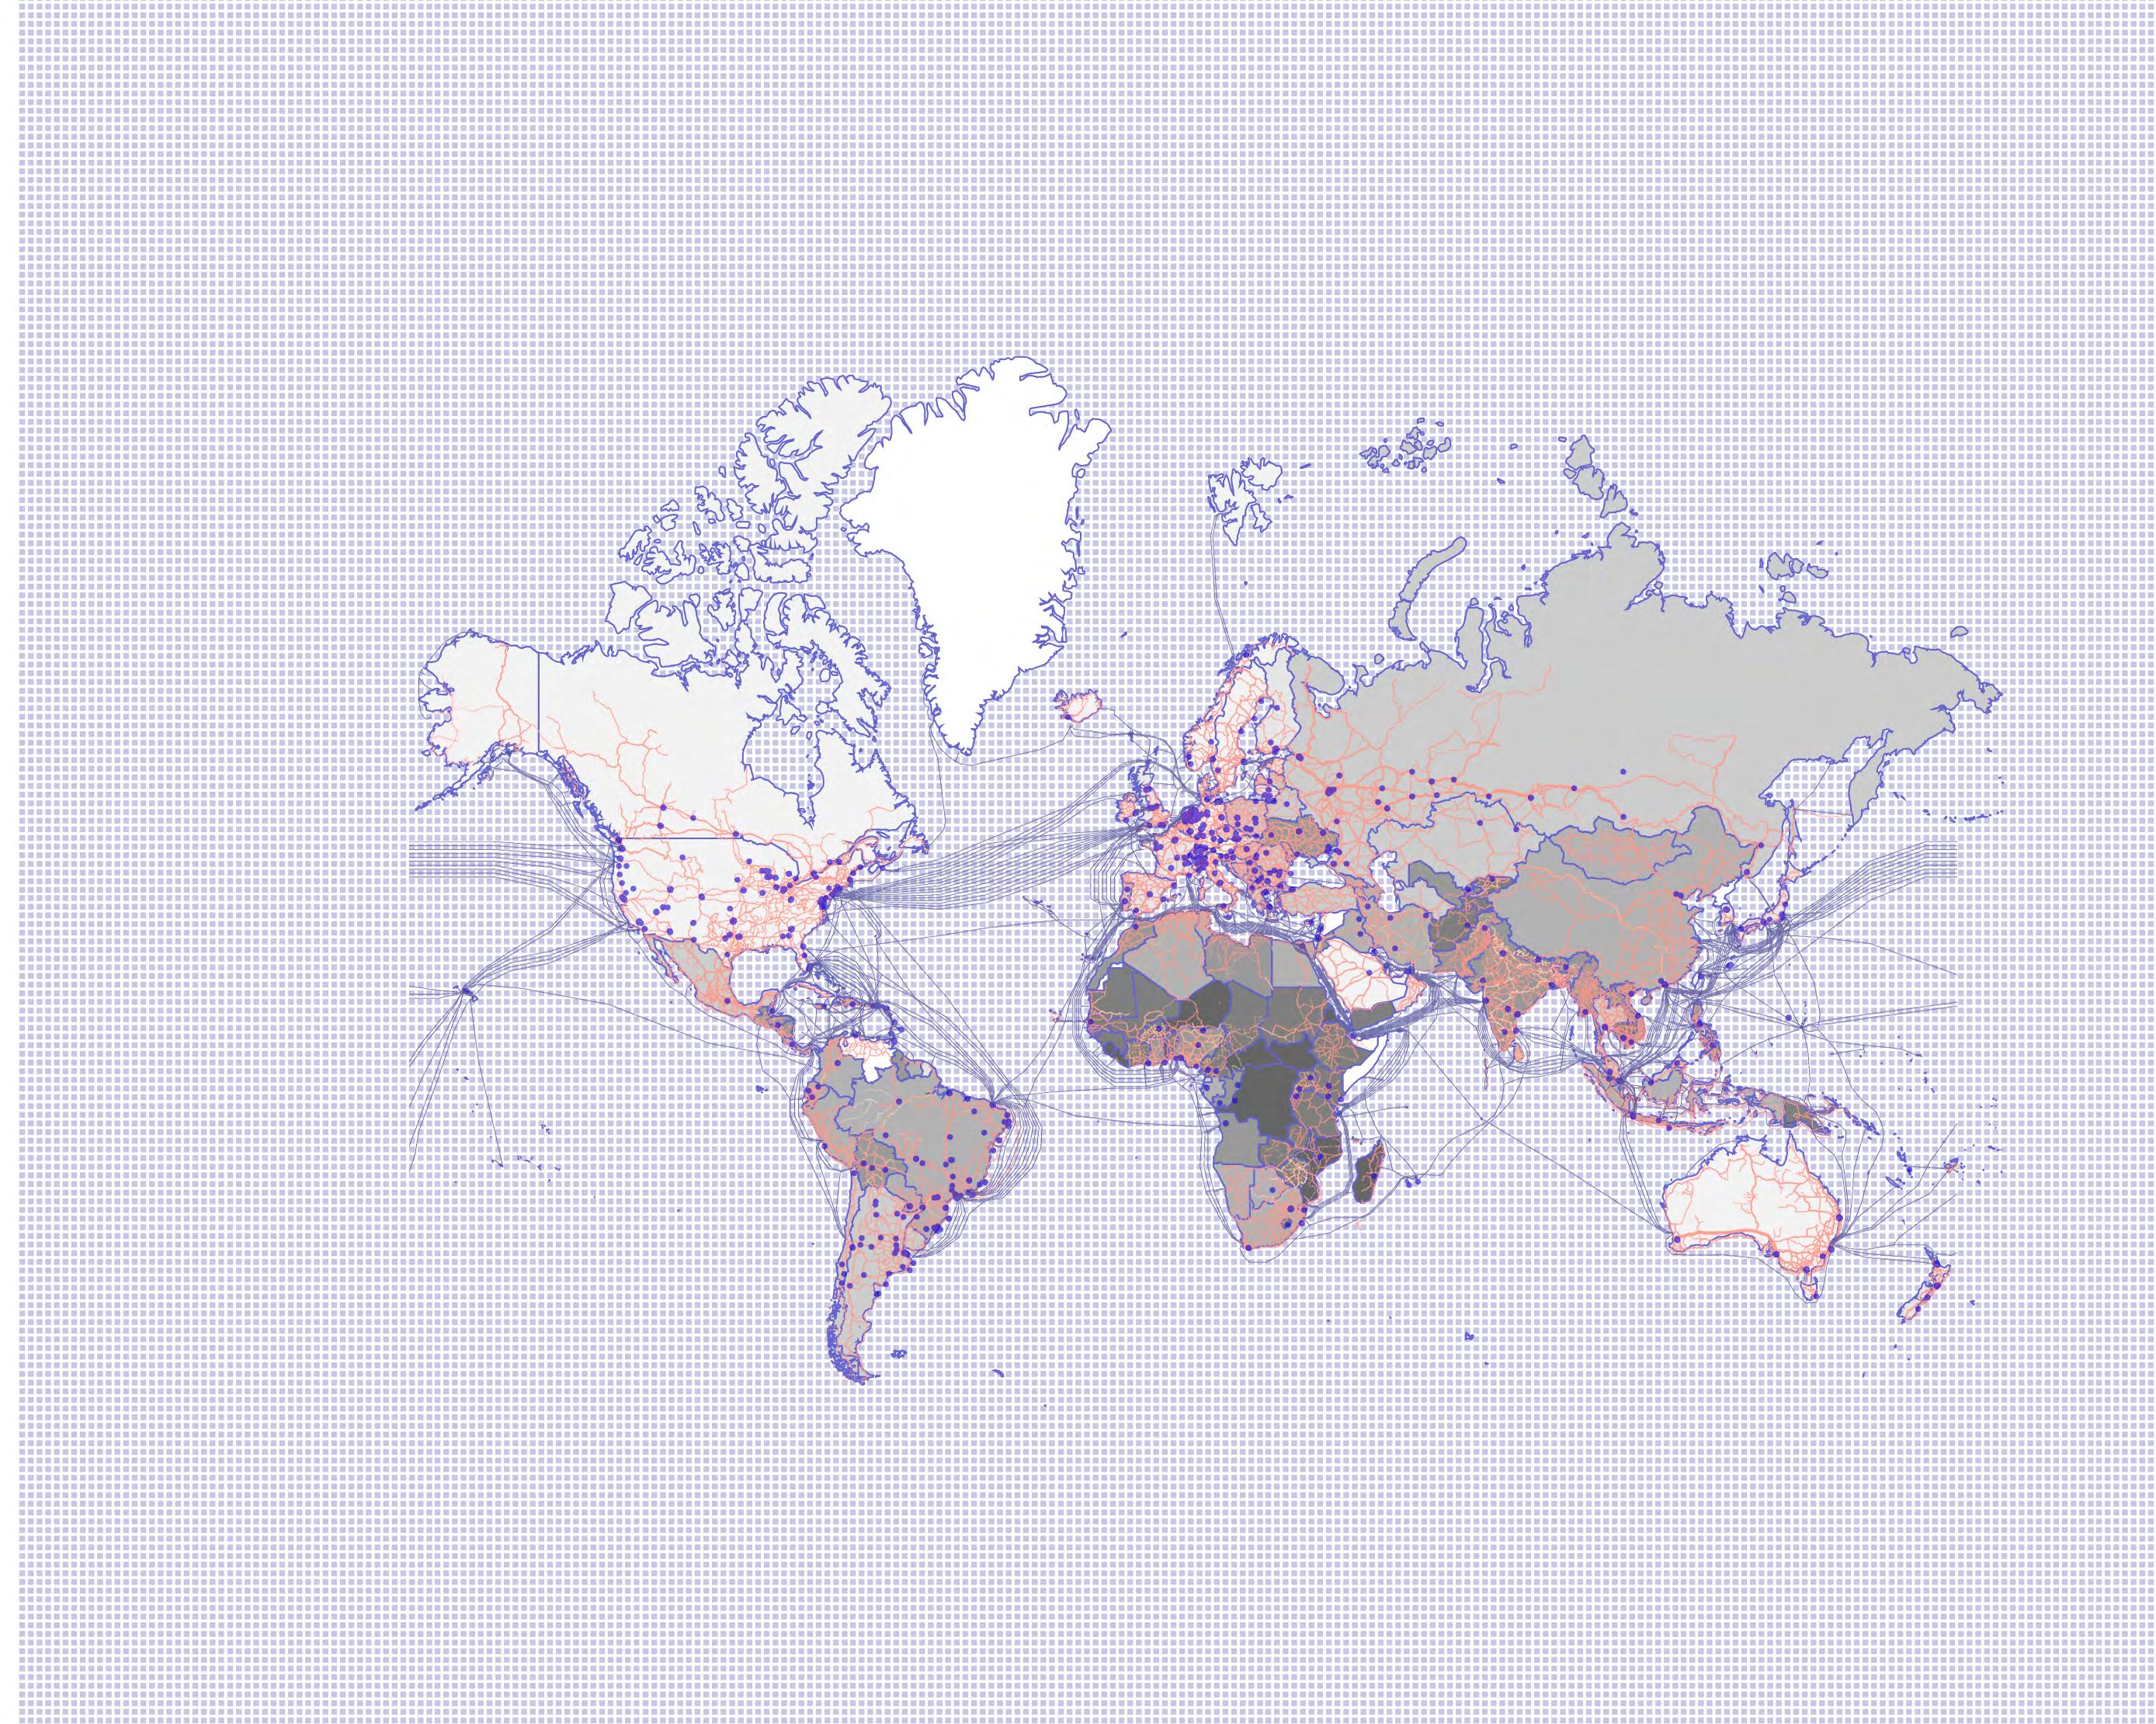 >50.00035.000-50.00020.000-35.00010.000-20.0005.000-10.0002.000-5.000<2.000unknown GDP (PPP) per captia in Int$
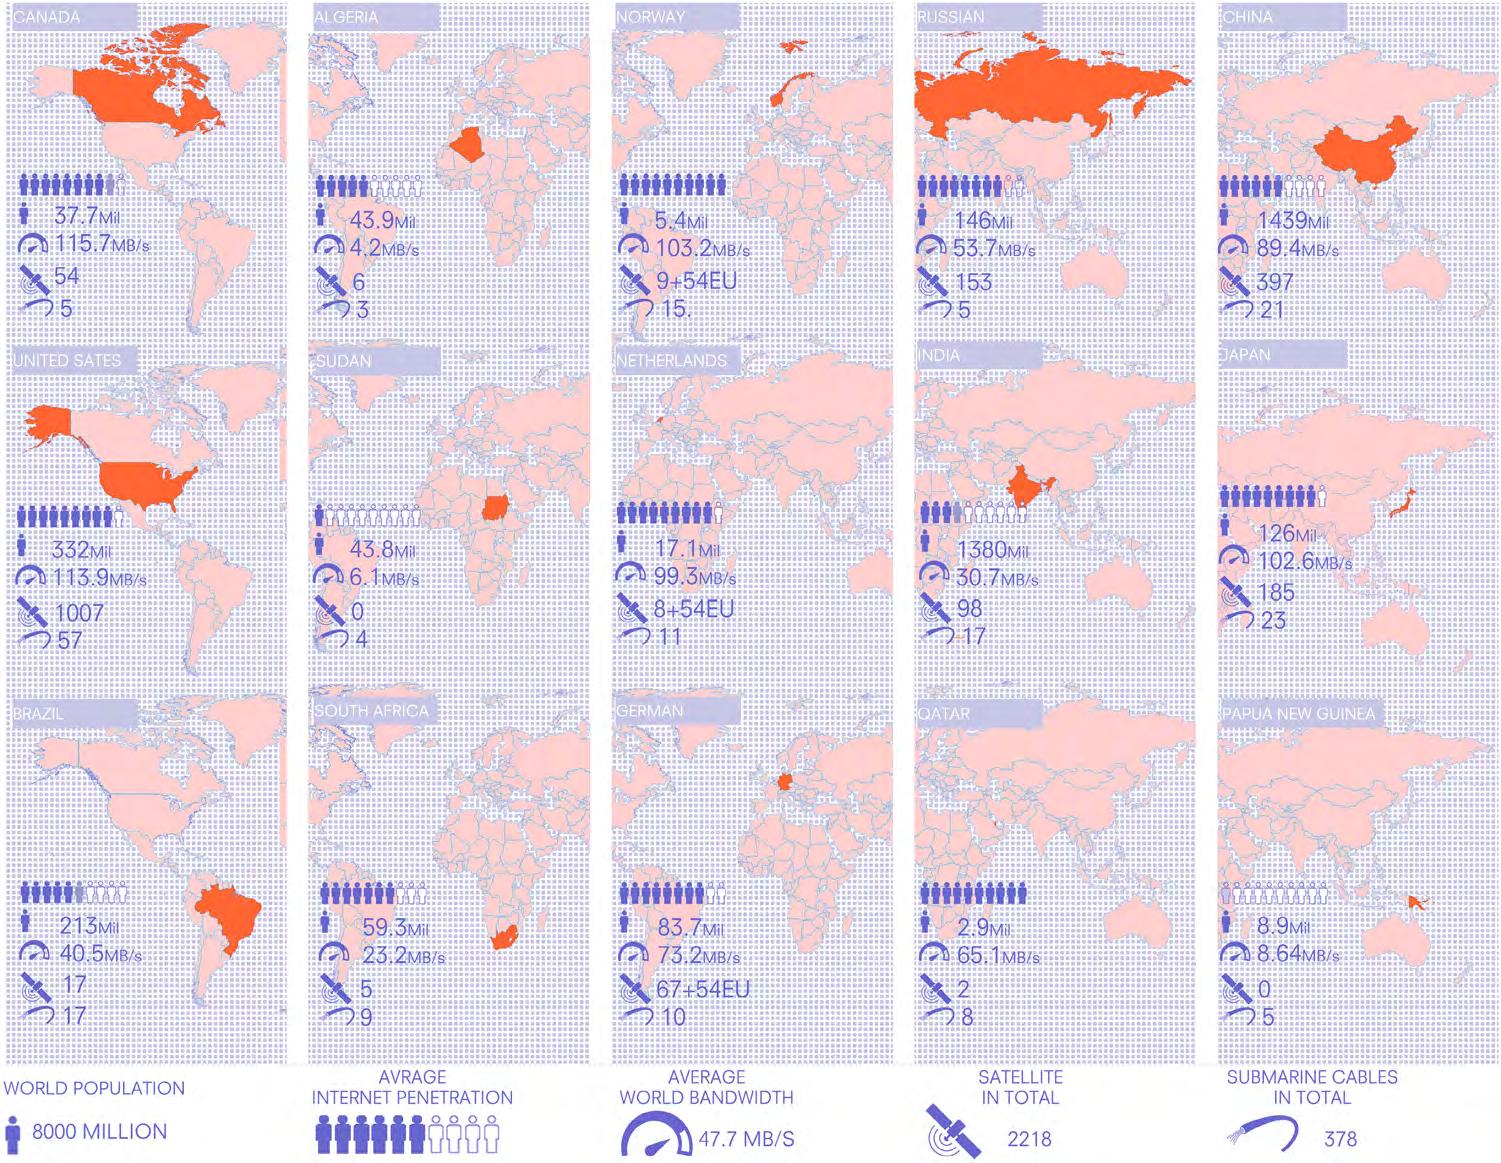
COUNTRY COMPARISON
Even within geographic proximity, there is an Internet divide between different countries. North America and Europe have an adequate number of satellites and cables and have the best Internet connections. African countries have lower numbers and lower connection rates. In general, network penetration and broadband speeds in different countries are related to the number of communication facilities, especially submarine cables.
ENERGY PRODUCTION
An underlying requirement for Internet connectivity that is extremely essential is sufficient energy production. Looking at the global energy production levels clearly shows the international electricity disparity.
“70 percent of the population of subSaharan Africa has no access to an electric grid. So if you want to build a data center to bring cloud services closer to such a population, you’d probably need to provide electricity for it, too.”- Sarvesh Mathi
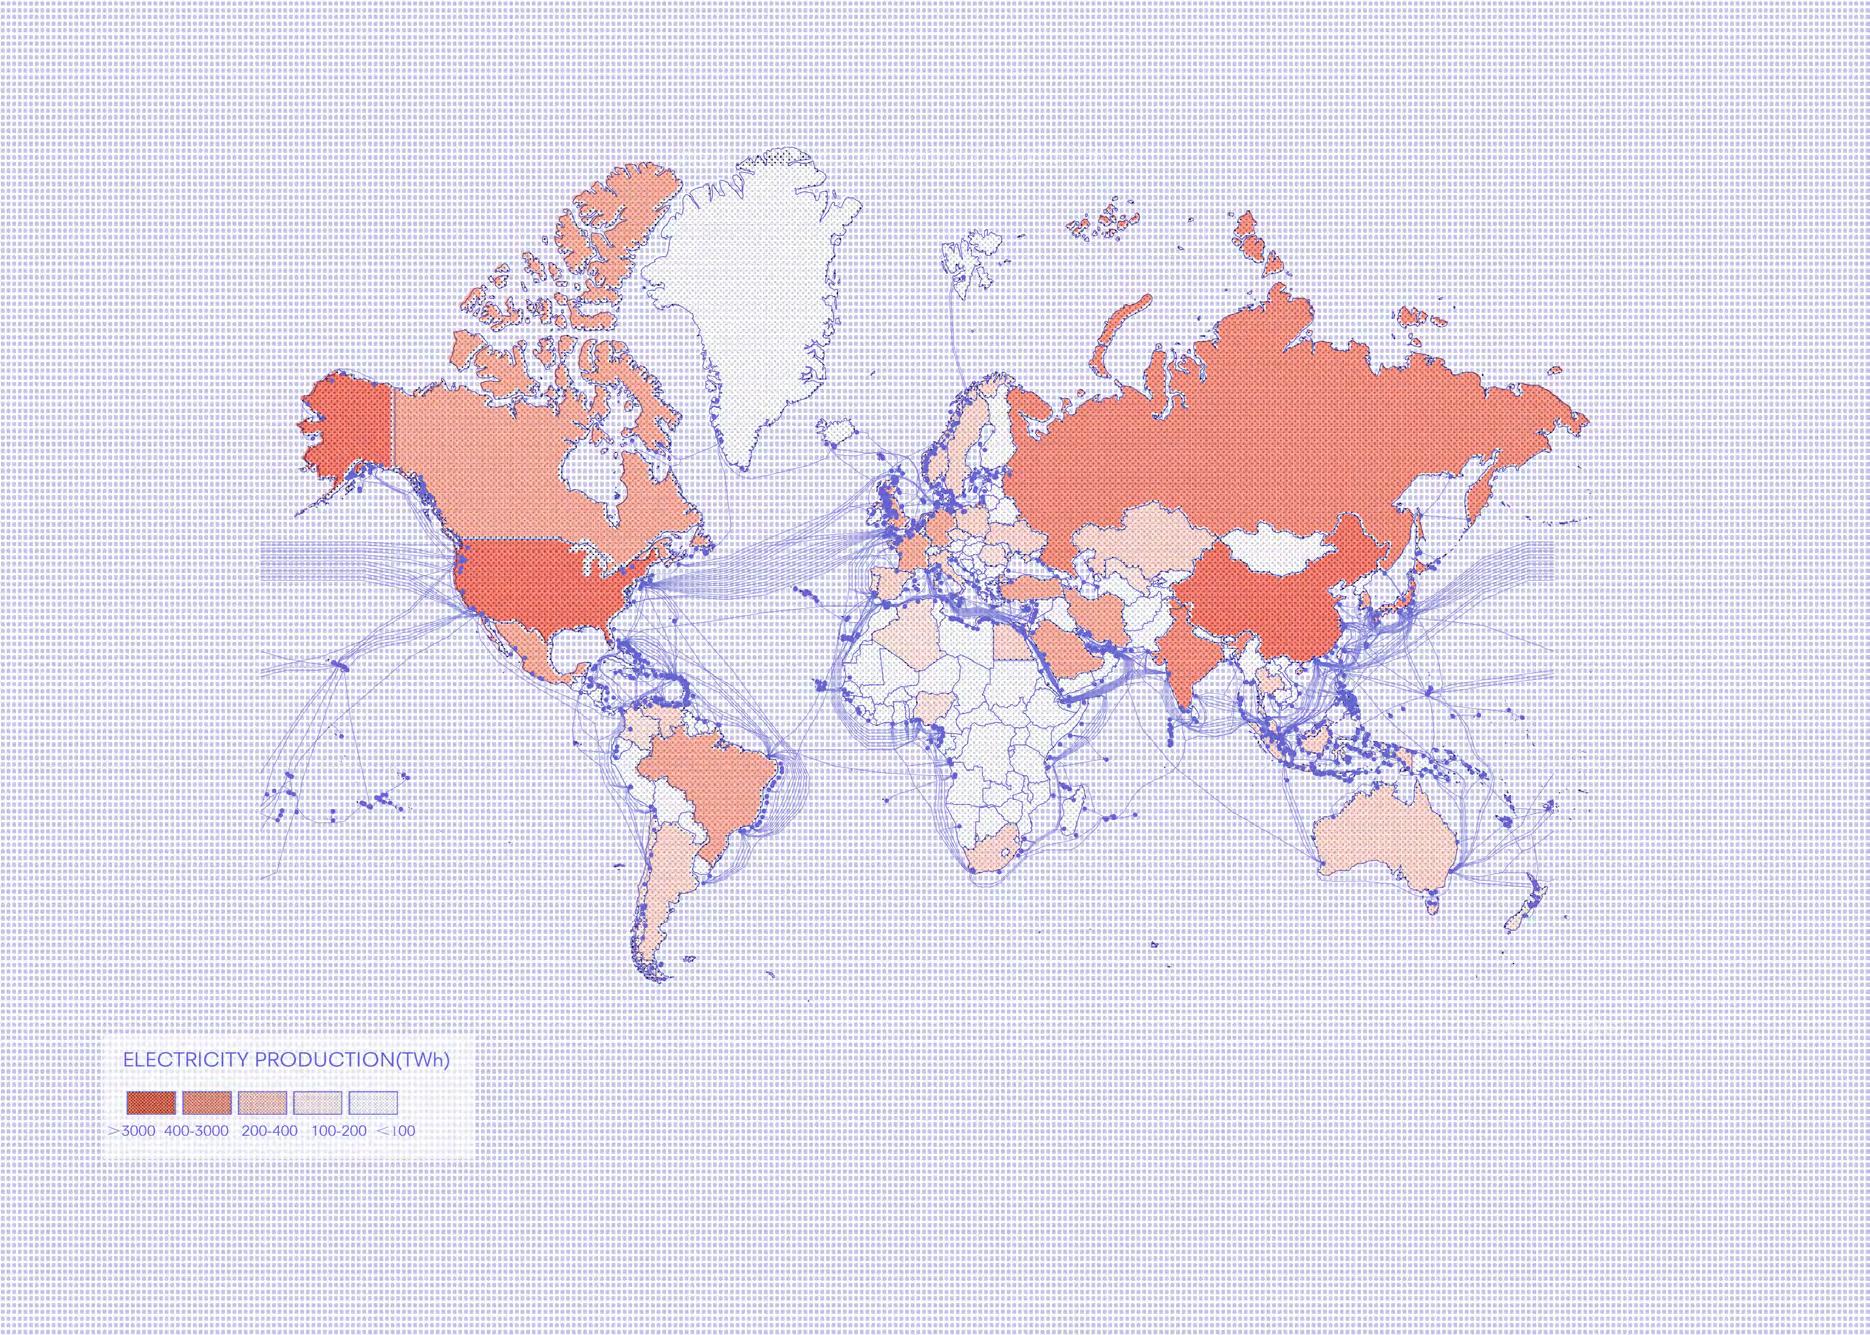
“Electricity is the lifeblood of our digital age, but, ironically, it has lagged behind our connected times.”
Tomas Kellner
ENERGY CONSUMPTION
Right now, the energy consumption of the whole internet infrastructure is responsible for 11% of the global energy consumption. The biggest chunk of this infrastructure, being the datacenters, consumes almost six times as much energy per year than the whole of the Netherlands. This is only going to get more, in a worst case scenario the internet infrastructure will be responsible for over half of the total energy consumption.
Energy consumed by the internet opposed to total energy consumption
Data Centers Wired Networks WIFI THE NETHERLANDS Mobile Networks Laptops & PC’s Smartphones & Tablets 25 2020 2030 expected 2030 worst-case scenario 96 100 119 189 422 667 11% 21% 51% 2857 TWh/year 26260 TWh/year Energy usage, TWh/year
TRADITIONAL DATA CENTERS
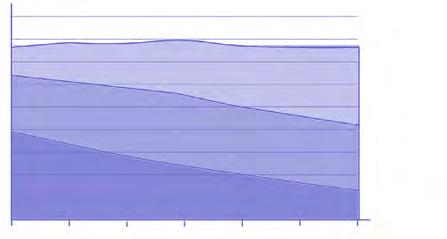
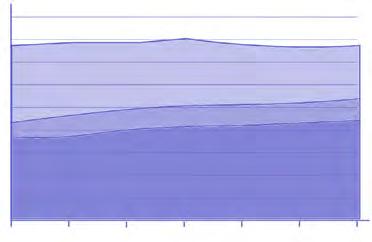
The design of land-based data centers heavily revolve around the human presence. Recent data centers have been moving more towards AI-operation in order to reduce the requirement of these human spaces.

Electrical Room Security Room Office Server Room Hot/Cold Aisle Rasied Floor Cooling Equipment Server Rack Cable Tray Infrastructure Hyperscale Storage Cloud (Non Hyperscale) Servers Traditional Global data center energy demand by end use 2015 2016 2017 2018 2019 2020 20212015 2016 2017 2018 2019 2020 2021 TW/h 250 200 150 100 50 TW/h 250 200 150 100 50 Energy Demand By Data Center Type Server Closets 10m ² Small 101-500m ² Server Room 11-100m ² Medium sized 501-5000m ² Large 5000-10000m ² Hyperscale 10000m ² +
18.034.04
Global
12.229.735
Global Gross Power
kw
White Space
m²
THE FIRST MILE
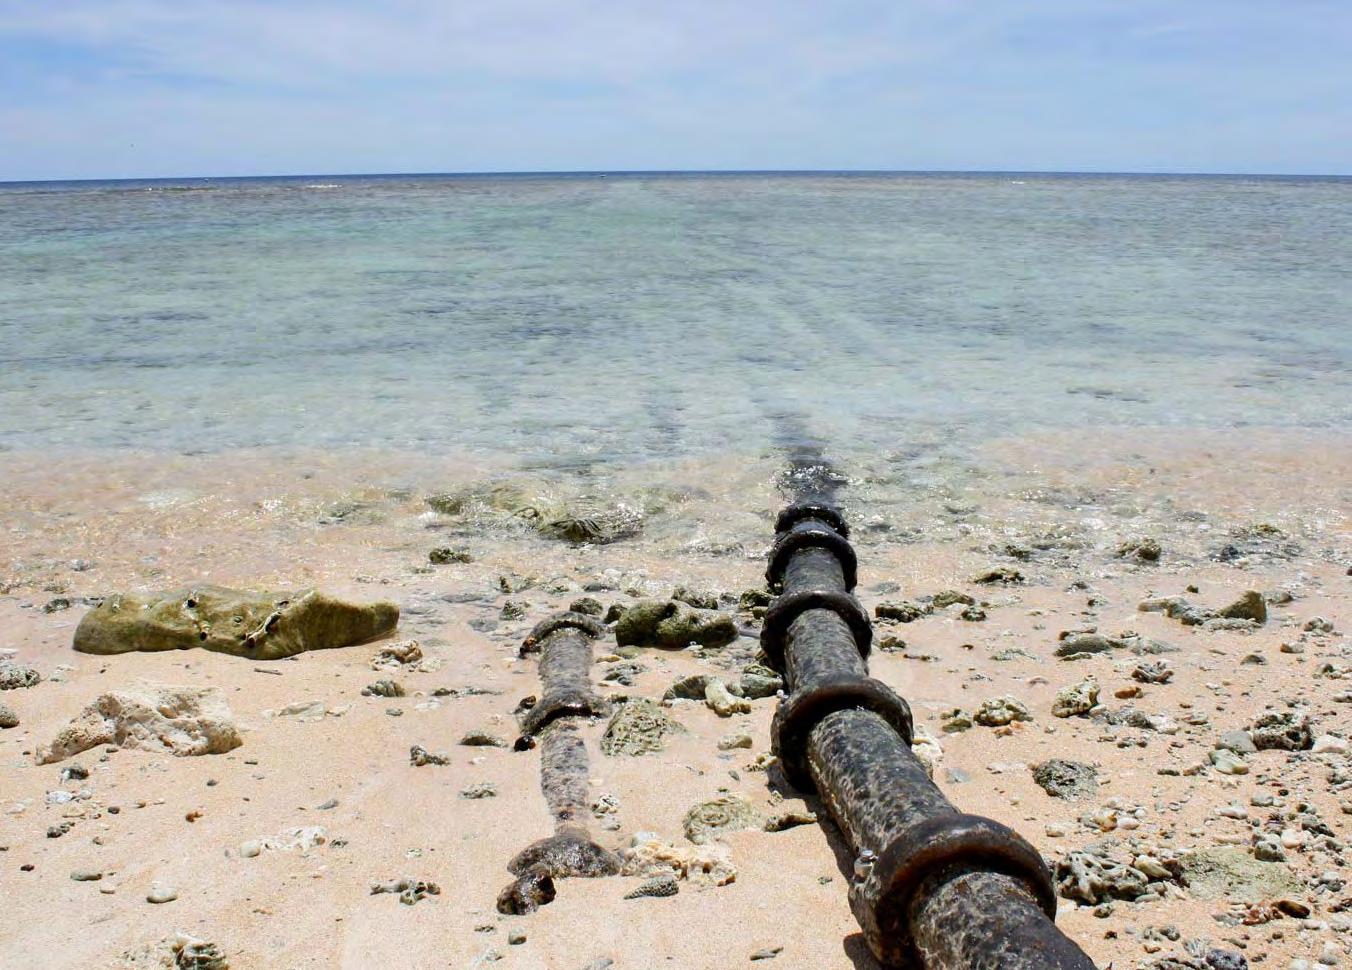
CABLE LANDING SITE
Guam
Photo: Nicole Starosielski
SUBMARINE CABLES
Articulated cast iron shells that protect, ballast, and stabilize subsea conducts (cables, pipes, etc.).
THE FIRST MILE: SUBMARINE CABLES
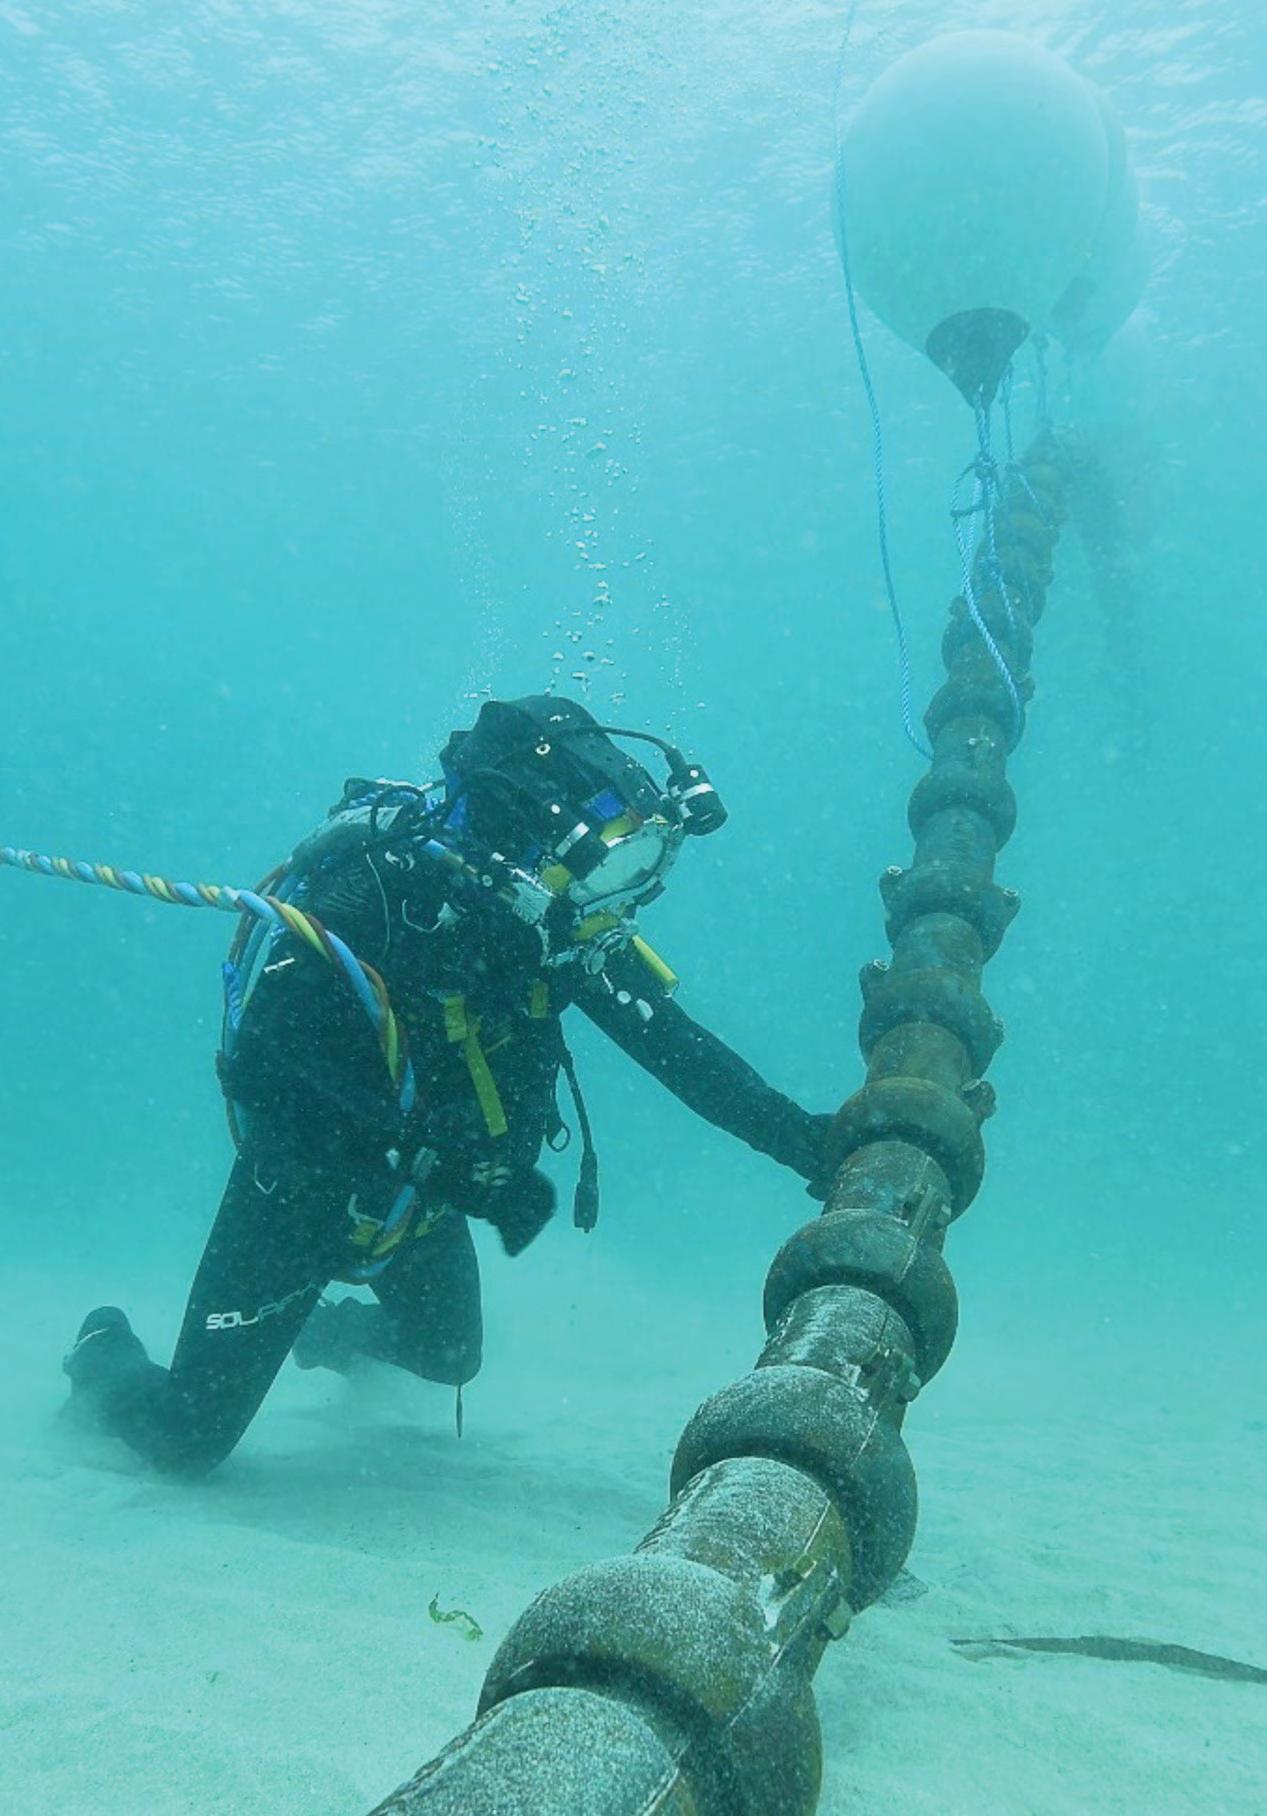
Thus, there are several stages in the internet penetration in any country. Data centers, IXP’s, ISP’s, cell towers, satellite receivers and cable landing stations are all connected to each other. They are divided in different ‘miles’: a first mile, a middle mile, a last mile and an invisible mile. These names are corresponding to in which place in the whole system the infrastructure plays a part. Satellites and submarine cables bring the internet to a country, but while satellites are far away from the earth, cables are the fastest and most reliable option.
The infrastructure divide immediately becomes clear when looking at the map of internet infrastructure. There is a huge difference in infrastructure density between Europe and the USA on the one hand, and Africa and South America on the other. The difference in GDP is also clear, but the difference in population is not related to this: there are areas with a large population and no internet infrastructure. This internet infrastructure becomes extra hard to manage when taking into account the energy infrastructure: the countries with a low energy production do not have a good internet infrastructure, and cannot set up a good internet infrastructure. The internet already consumes a large share of the global internet production. It becomes clear that data centers consume the most energy of all the internet infrastructure.
While all these are important, it starts with the first mile: submarine cables. Most data travels through these cables: they are the most effective means of communicating over long distances and their quality is in direct relation with the internet penetration, and the internet penetration growth of a country. The next part will further research the different aspects of these submarine cables: the cables themselves, how they are laid down, and how they are connected to the land network.
Photo: FMGC
“But when we think of the internet, many wrongly assume that satellites in space keep us connected with different parts of the world. In reality, 99 percent of the data travels between countries and continents through undersea cables.”
Sarvesh Mathi
SUBMARINE CABLES AND INTERNET PENETRATION GROWTH
It is evident in various countries that an implementation of high speed cables saw an increase in internet penetration levels. By looking at the the internet penetration in four different areas and the submarine cable connection of these areas, there seems to be a correlation between the two. With a better cable connection, the internet penetration grows. Without these, the internet penetration stays at a very low point.
The Netherlands
South Africa Sudan
25% Internet penetration as%ofpopulation 56% 50% 75% 100% 340 Gbit/s 440 Gbit/s 640 Gbit/s 4.72 Tbit/s 24 Tbit/s ~100 Tbit/s* 25% Internet penetration as%ofpopulation 95% 50% 75% 100% 1 Mbit/s 10 100 10 100 10 100 1 Gbit/s 1 Tbit/s 1 Pbit/s Internet speed through cable 1990 2000 2010 2020 2030 9.38 Tbit/s 5.2 Tbit/s 20 Tbit/s 18 Gbit/s 25% Internetpenetration as%ofpopulation 95% 50% 75% 100% 1 Mbit/s 10 100 10 100 10 100 1 Gbit/s 1 Tbit/s 1 Pbit/s Internetspeed throughcable 1990 2000 2010 2020 2030 9.38 Tbit/s 5.2 Tbit/s 20 Tbit/s 18 Gbit/s 25% Internetpenetration as%ofpopulation 56% 50% 75% 100% 1 Mbit/s 10 100 10 100 10 100 1 Gbit/s 1 Tbit/s 1 Pbit/s Internetspeed throughcable 1990 2000 2010 2020 2030 560 Mbit/s 340 Gbit/s 440 Gbit/s 640 Gbit/s 4.72 Tbit/s 24 Tbit/s ~100 Tbit/s 25% Internetpenetration as%ofpopulation 31% 50% 75% 100% 1 Mbit/s 10 100 10 100 10 100 1 Gbit/s 1 Tbit/s 1 Pbit/s Internetspeed throughcable 1990 2000 2010 2020 2030 1.28 Tbit/s 2.56 Tbit/s 4.72 Tbit/s 25% Internetpenetration as%ofpopulation 1.3% 50% 75% 100% 1 Mbit/s 10 100 10 100 10 100 1 Gbit/s 1 Tbit/s 1 Pbit/s Internetspeed throughcable 1990 2000 2010 2020 2030
Eritrea
The first undersea telegraph cable was laid in 1850 between England and France. It then extended across the Atlantic Ocean in 1866. Other countries relied on the technical expertise and naval resources of the British. They formed many early systems with colonial transportation and trade routes. The cable station became a space to declare their foreign domination
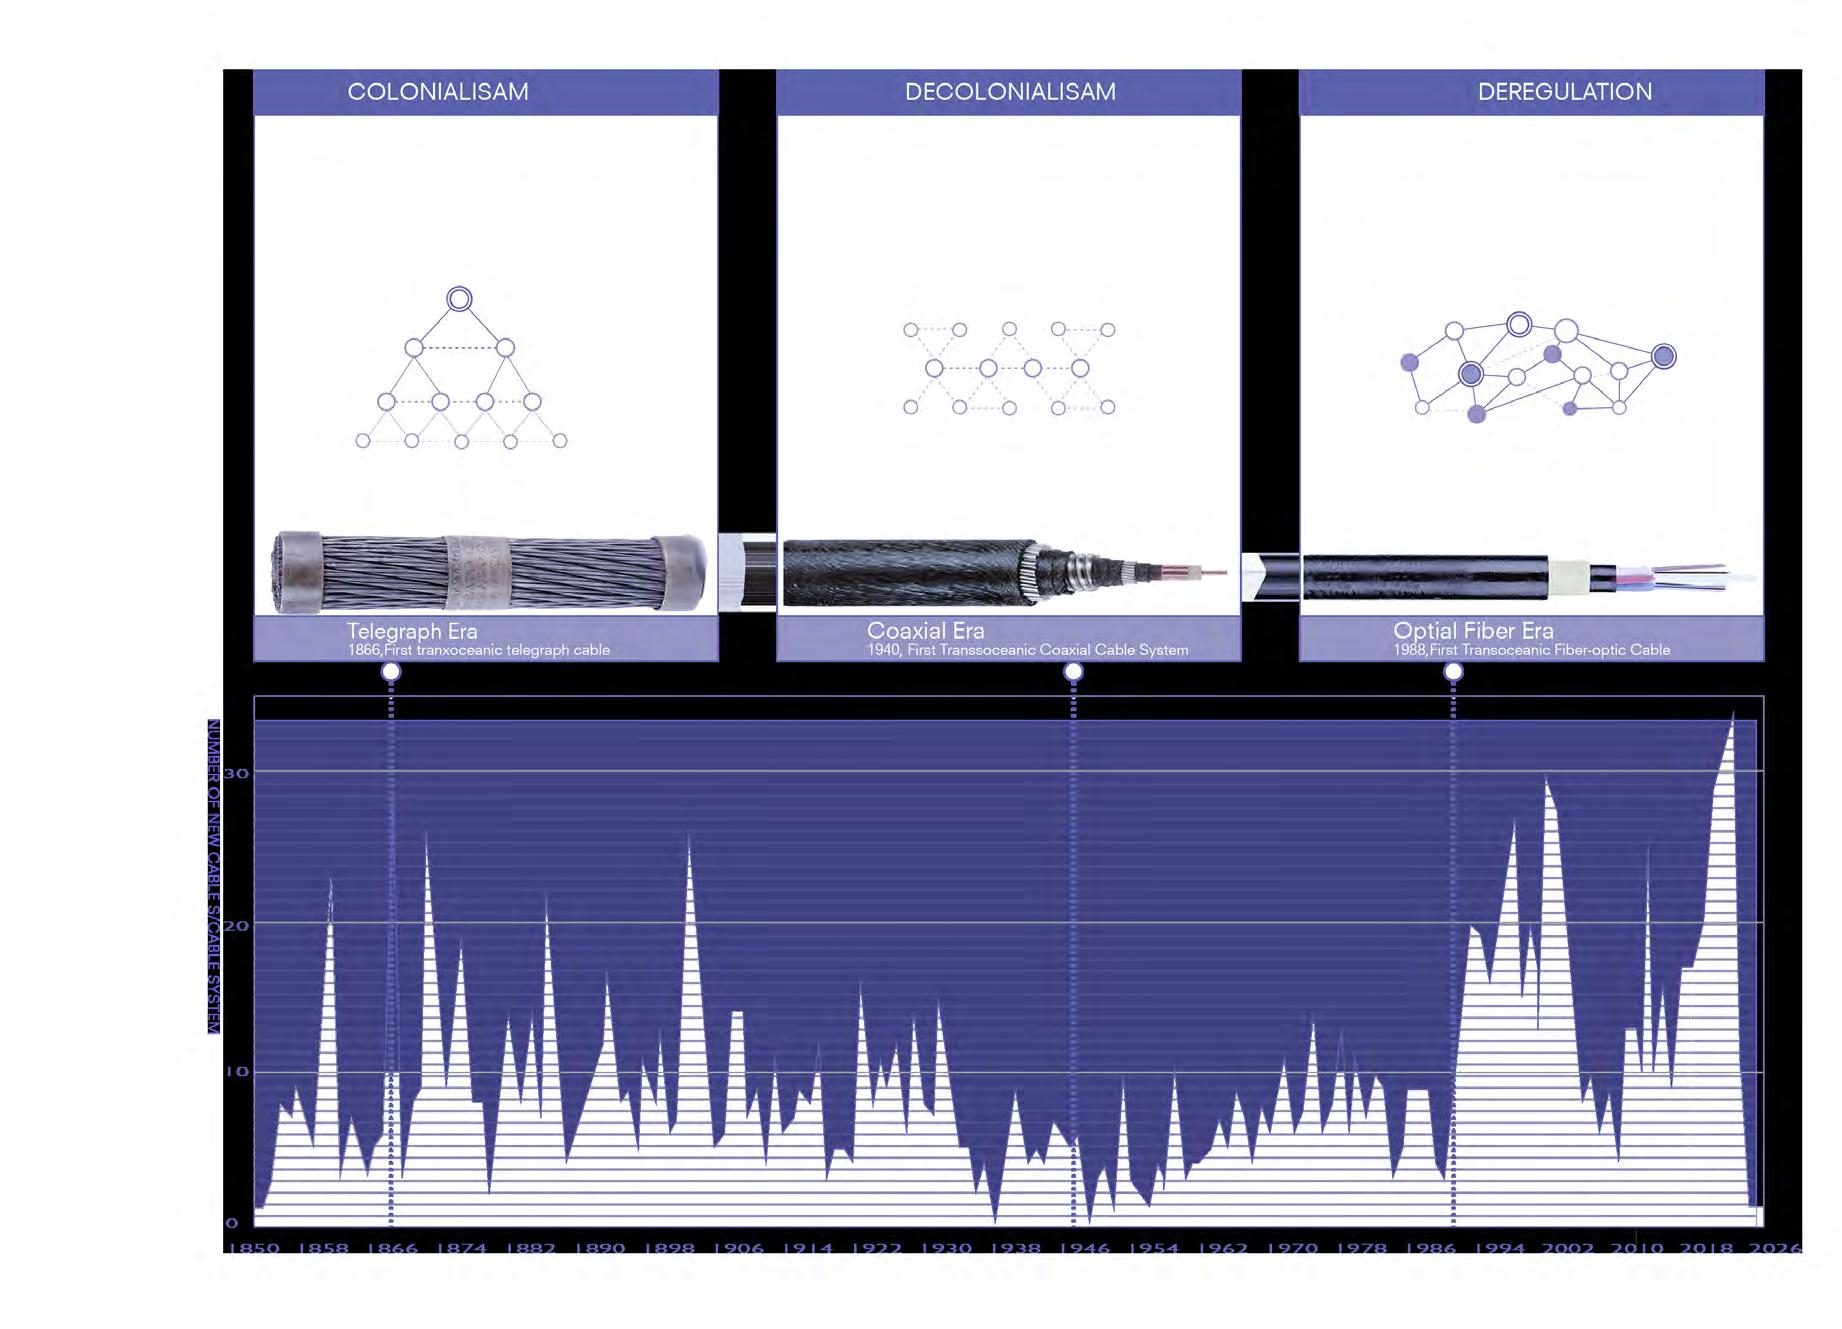
The situation of cable colony changed in the coxial cable era, with the independence of former colonies. What is remarkable is that the cable stations were reconfigured as gateways to new nations. However, the existing system still could be perceived as a continuing intrusion of foreign power. In the 1960s, anti-British rioting in Indonesia cut communications to Malaysia and forced staff members to move.
In the fiber-optic era, the world situation is peaceful, the various countries begin to cooperate to develop the economy, and the globalization trend begins. Thus the undersea network field expands. “Law relating to the high seas,” affirmed the right of all States to lay submarine cable. Meanwhile the Government-owned and affiliated telecommunications companies were broken up, creating opportunities for new players to enter the industry.

THE CABLE HISTORY
AGING CABLES
Separating by date of service start, it is evident that a majority of submarine cables are relatively new. The majority of potential capacity on major cable routes will come from systems less than 5 years old. Although many old cable systems have an abundance of untapped potential capacity, few have spare fiber pairs for bandwidth buyers to own exclusively. Additionally, older cables are becoming too expensive to maintain and cannot beat the economics of the modern systems. Thus the question arises, what will happen to all these aging submarine cables sitting at the bottom of the ocean?

Europe-Asia via Egypt Planned 0-5 years 6-10 years 10+ years 31% 26% 14% 44% 55% 18% 18% 57% 36% 14% 7% 2 % 8% 41% 29% 19% 21% 61% Intra-Asia US-Latin America Trans Pacific Trans Atlantic Varying cable age on various routes
Planned 0-5 years 6-10 years 10+ years
CABLE OWNERSHIP
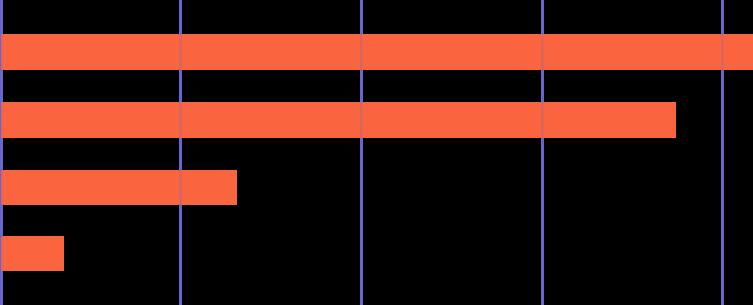
The majority of submarine cables are owned by a consortium of telecom companies based in the various countries the cables serve. However, in recent years content providers are investing more in sole and part ownership of cables. Content providers use over half of international bandwidth, so it is obvious that they wish for exclusive access through submarine cables. Content provider networks have displaced internet backbones as the largest source of used international bandwidth. Google has the largest share in cable ownership out of any other content provider, and is the only one with sole ownership of multiple cables.
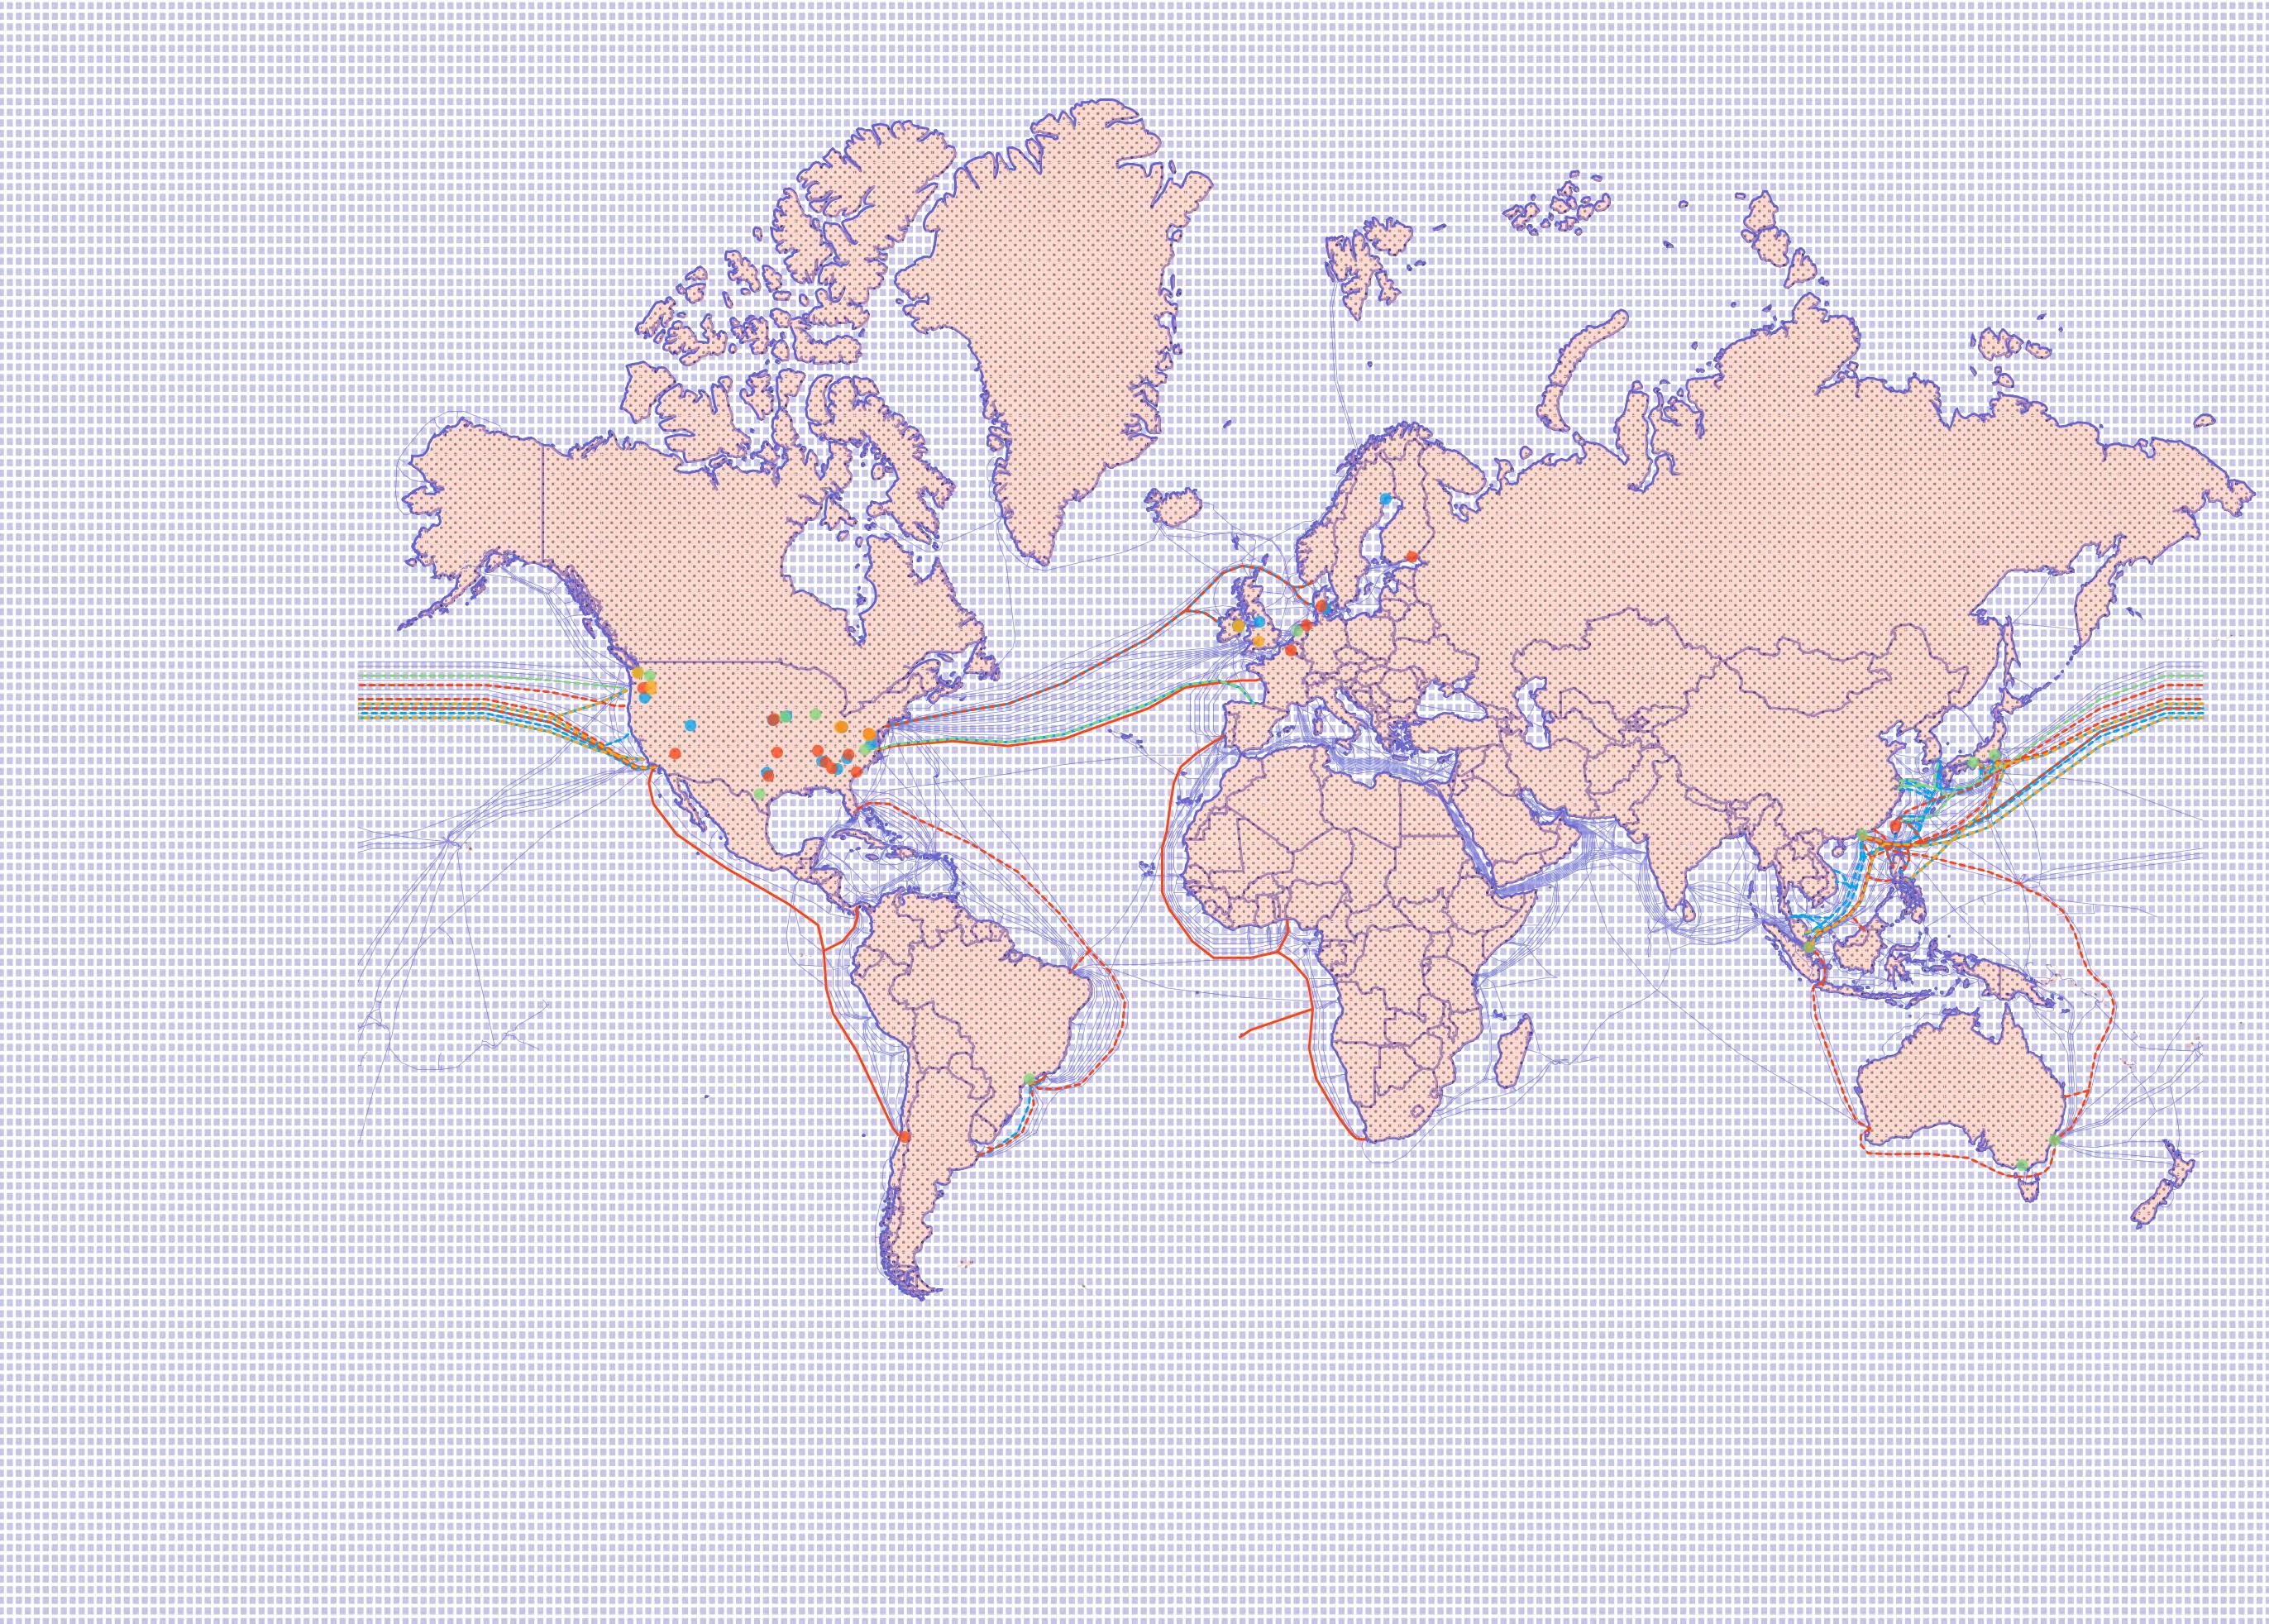
Bandwidth consumers

Comparison of content provider cable shares
54% 2018 2017 2016 Content Providers Internet backbone providers Other 2015 2014 2013 2012 40% 6%
Planned Submarine Cable Submarine Cable Data Center Google Facebook Amazon Microsoft 0 25.000 50.000 75.000 100.000 6.605 km 30.557 km 91.859 km 102.362 km
SUBMARINE CABLES
Submarine cables transfer data as light through optical fibers, which are encased in various protective layers. The level of armor required decreases once further from the shore. Along the length on the cable, repeaters are needed to continually amplify the signal.
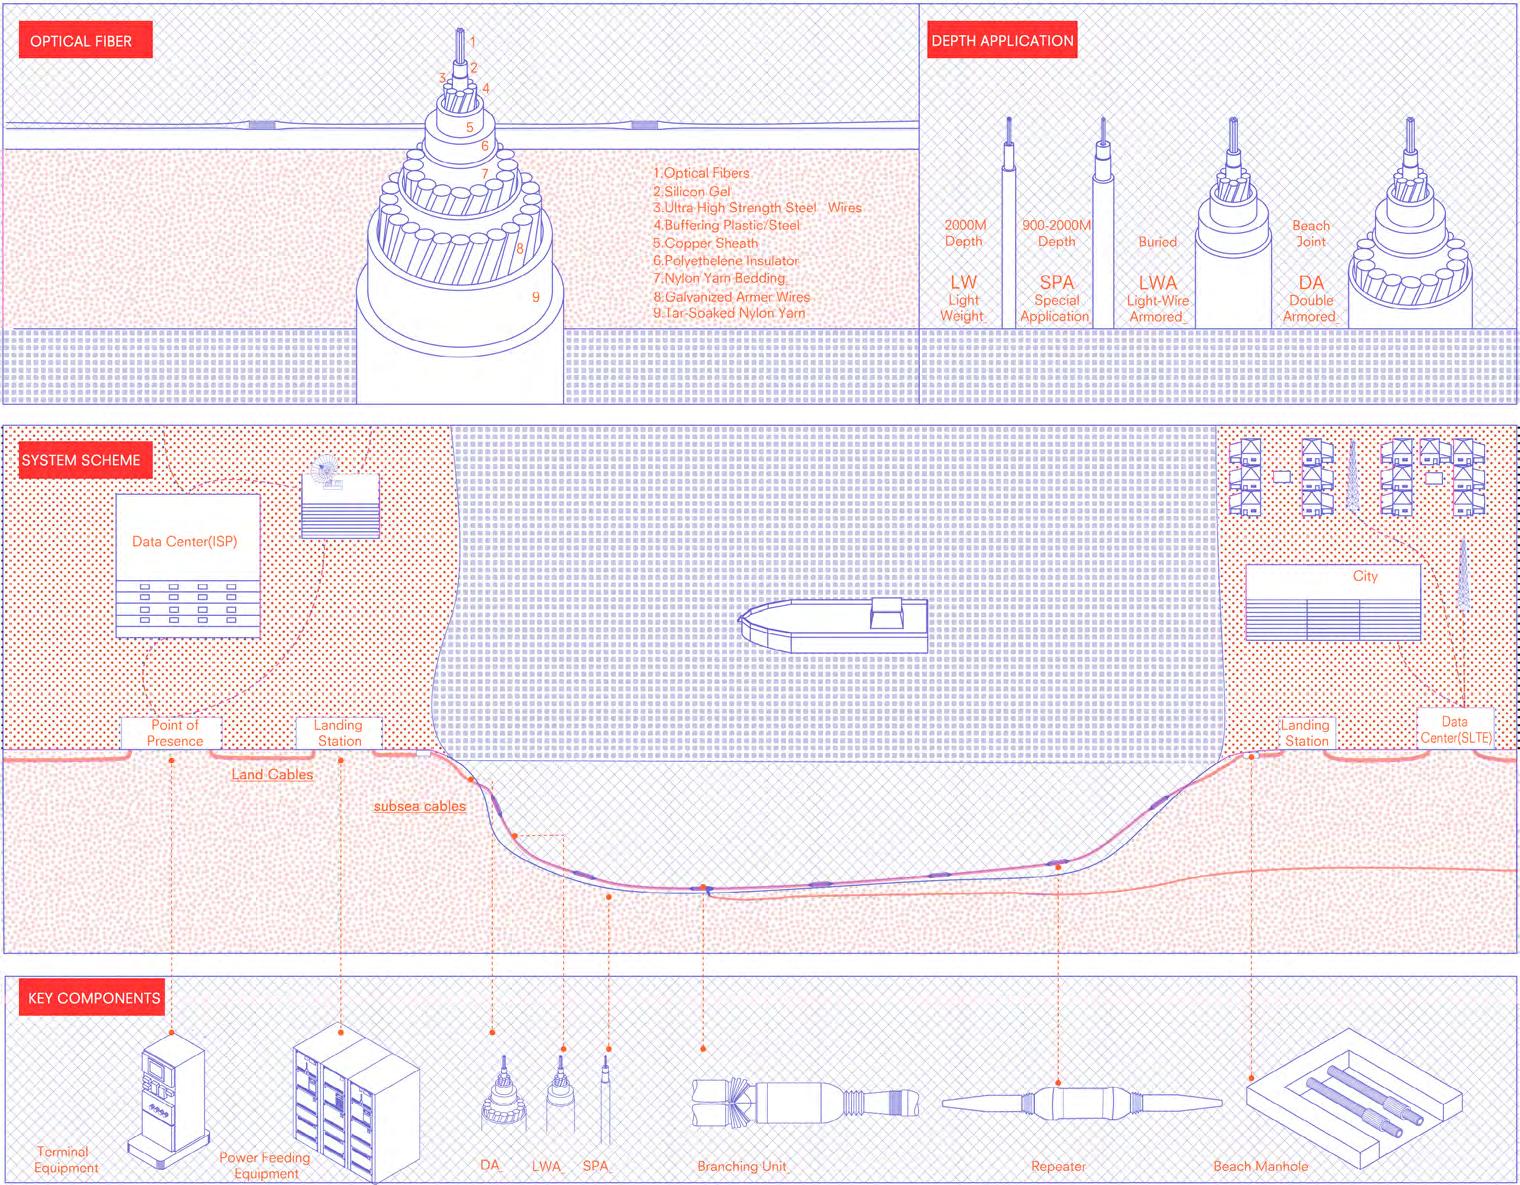
CABLE LAYING SHIP
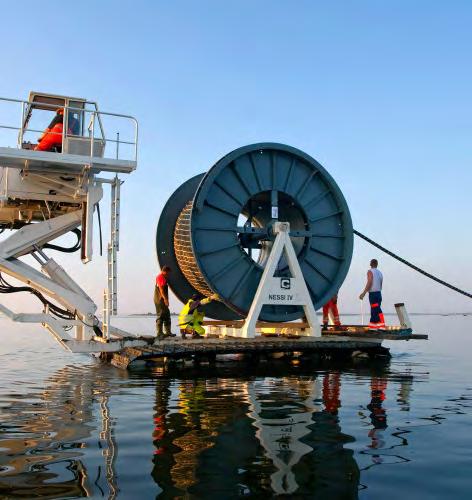
Cable laying takes an immense amount of resources including time, personnel, and money, with projects costing up to $350 million. The cable ship featured below, the Subcom Reliance, was first deployed in 2001.
80 crew members on board
Supplies for 60 days

200 loaves of bread
100 gallons of milk
500 cartons of a dozen eggs
800 pounds of beef
1200 pounds of chicken
1800 pounds of rice
300 rolls of paper towels
500 rolls of toilet paper
700 bars of soap
600 pounds of laundry detergent
140 m
Sea Plow Bridge
Cable drums and linear cable engine
Able to bury cable up to 3 m below the ocean floor. Handling machinery includes two 30 ton cable drums and a 20 wheel pair linear cable engine.
Houses the latest technology in navigation, dynamic positioning and communication
Remotely Operated Vehicle
Underwater robot used for various installation and repair tasks up to 2500 m depths.
Bow Thrusters
Provides propulsion and maneuverability with 360 degree rotation.
Stern Thrusters
Provides propulsion and maneuverability with 360 degree rotation.
Diesel Engine Generators
5 generators provide enough electrical power to propel the ship at a speed of 14 knots.
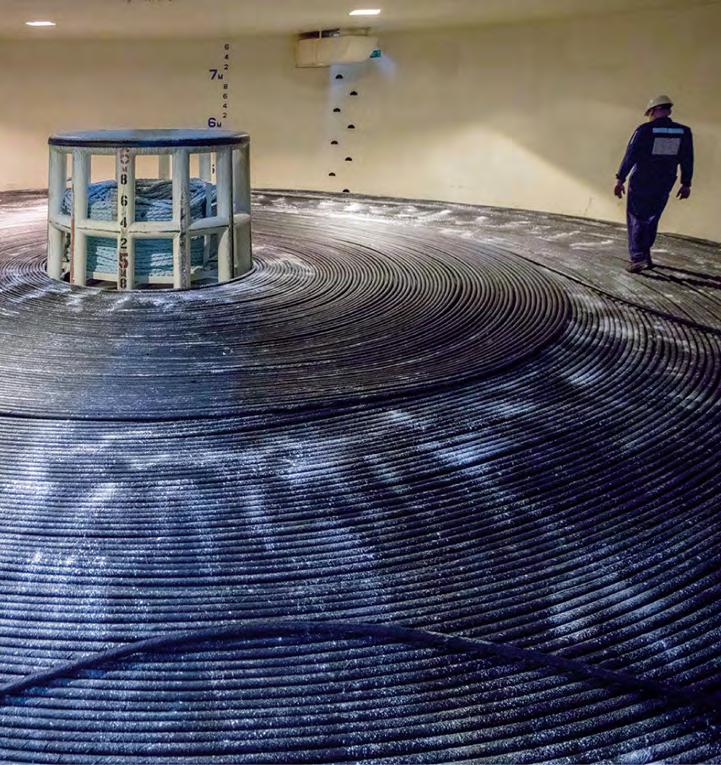
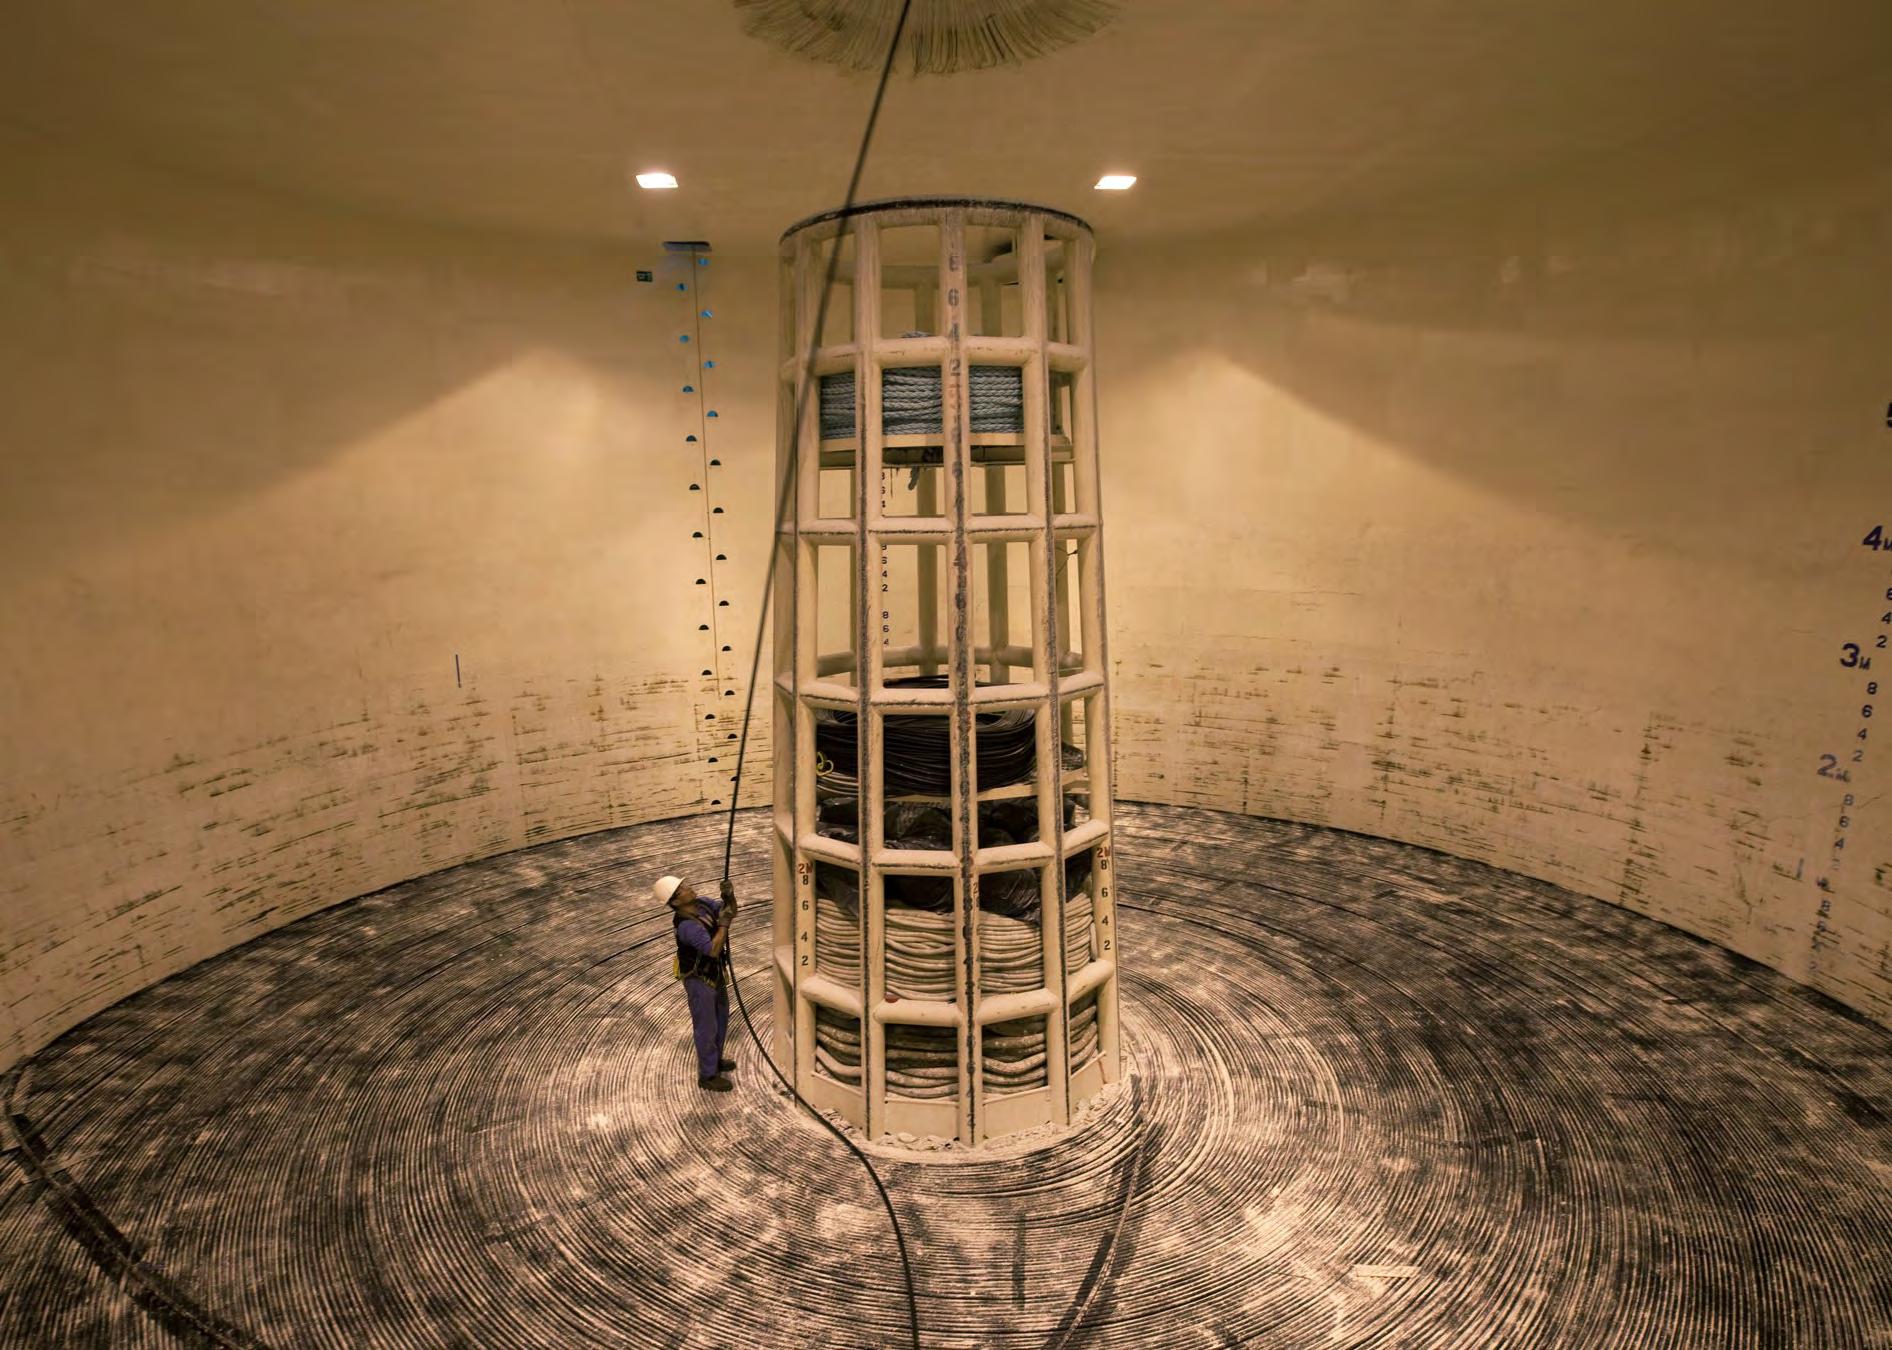
Cable Tanks
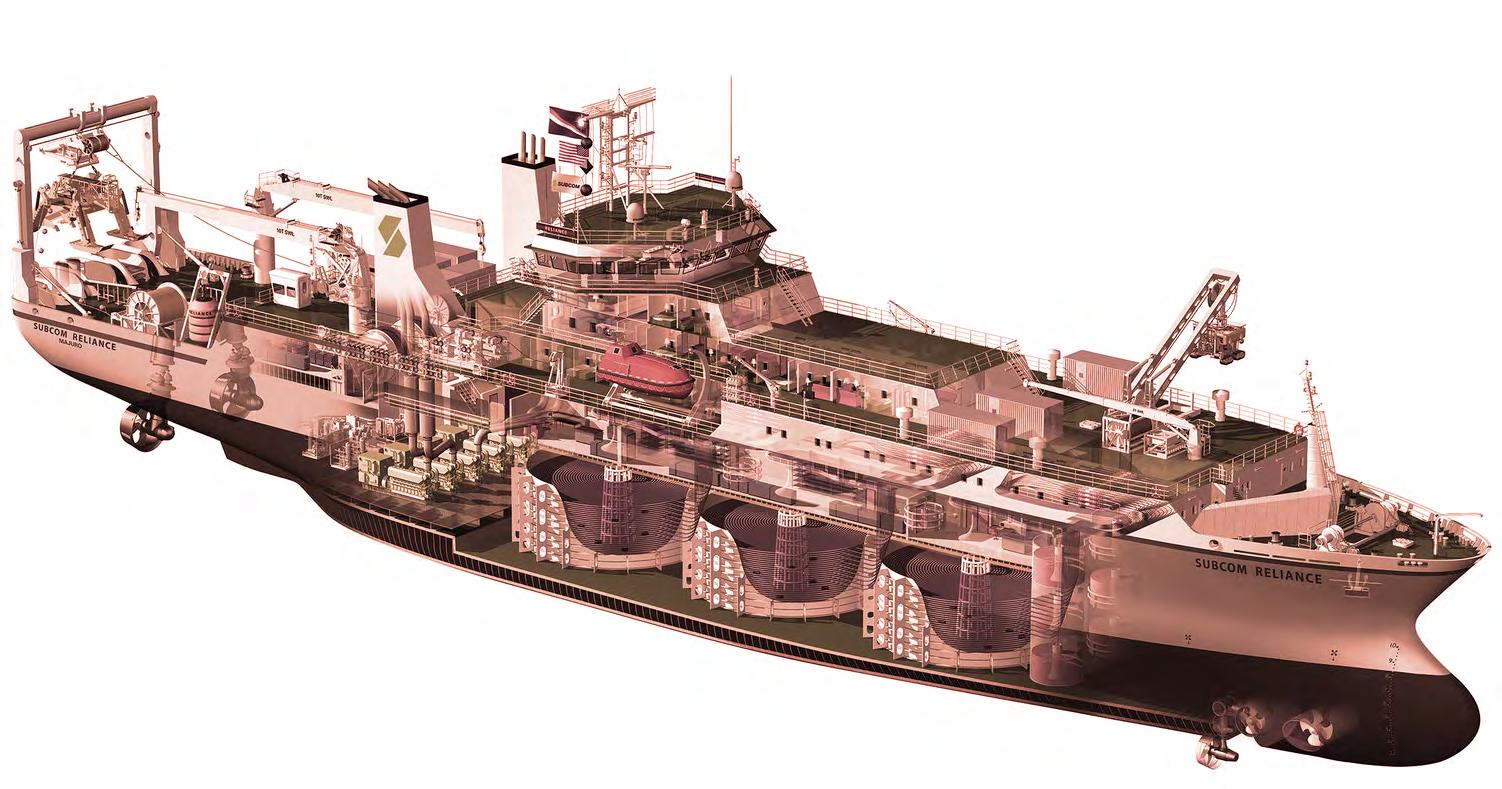 3 tanks hold over 5000 tons of cable, enough to cross the Atlantic Ocean.

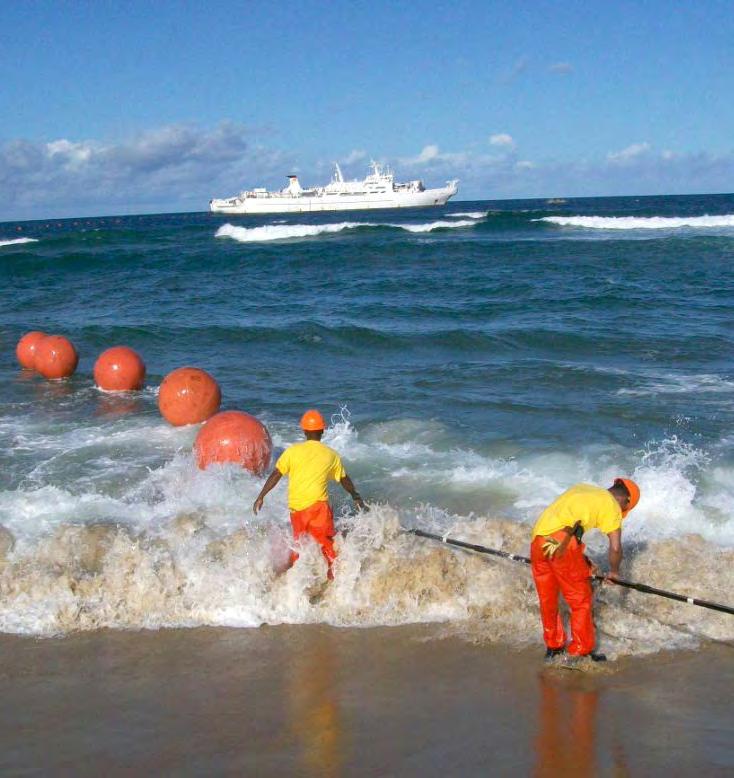
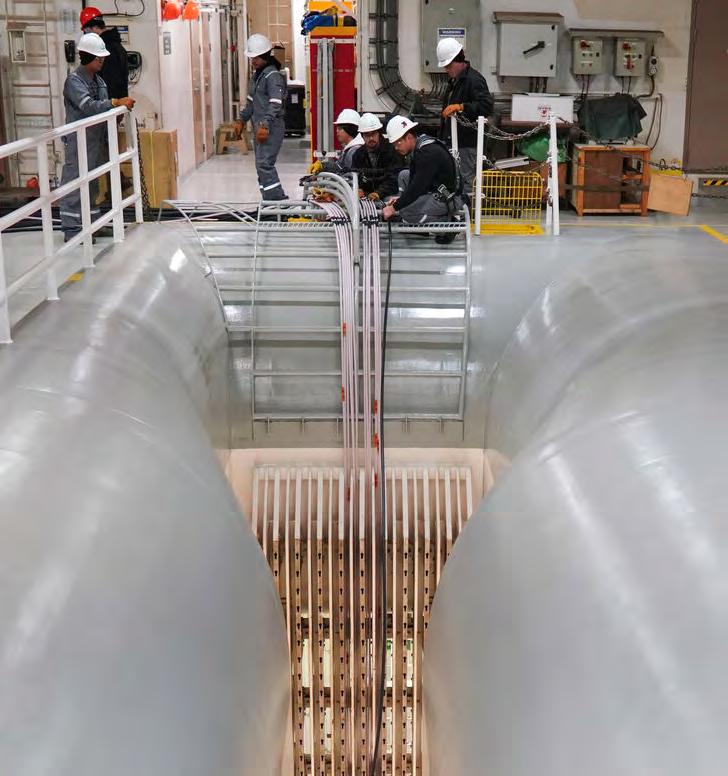
 CABLE TANK INTERIOR
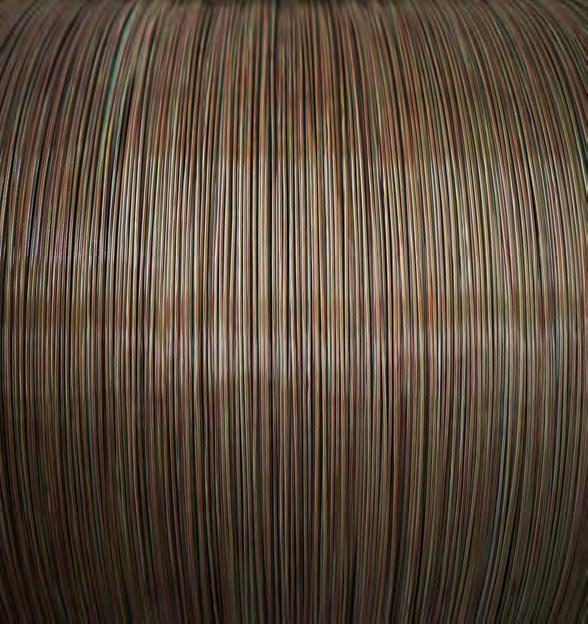
Fiber-optic cable being loaded onto a ship owned by SubCom, which is working with Google to build the world’s fastest undersea data connection.
Photo: Bill Gallery
CABLE LAYING
When planning the route for a submarine cable there are many factors to be considered. A thorough survey scan of the seafloor topography is done to create a 3D model that then accurately places the submarine cable is the safest position. Multibeam echo-sounding can gather information from a swath of seabed 3-5 times the water depth. Cables must be carefully routed to avoid underwater landslides, currents, shipwrecks, and coral reefs.
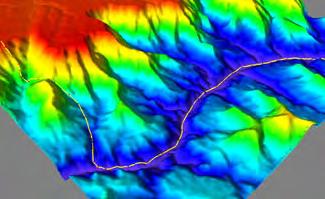
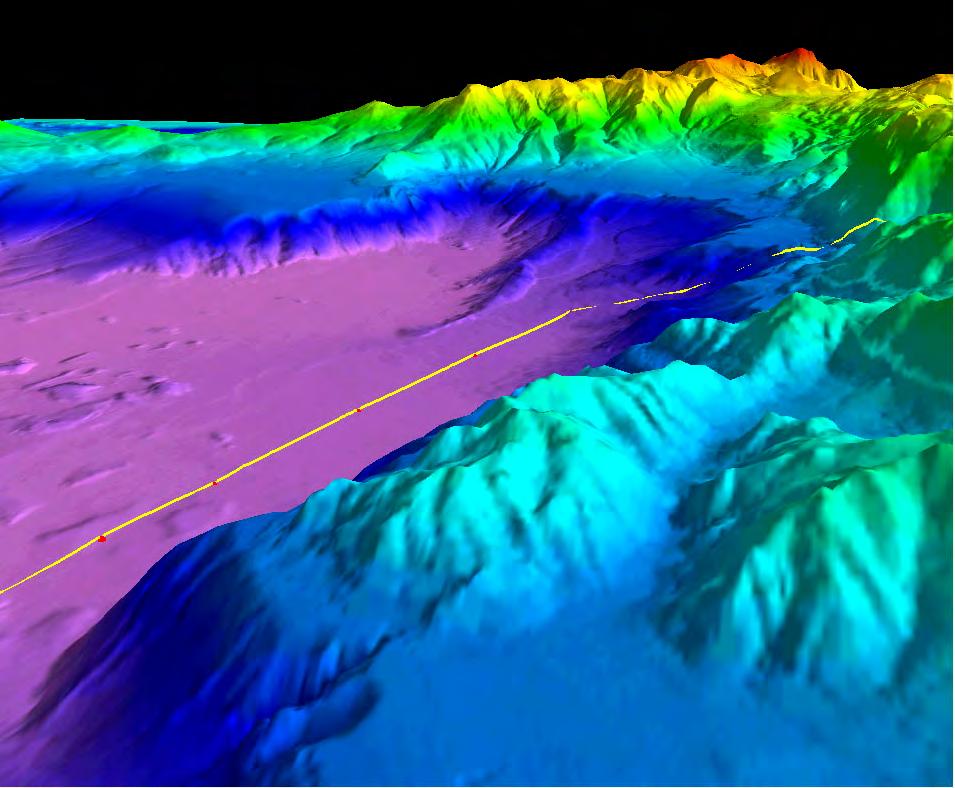
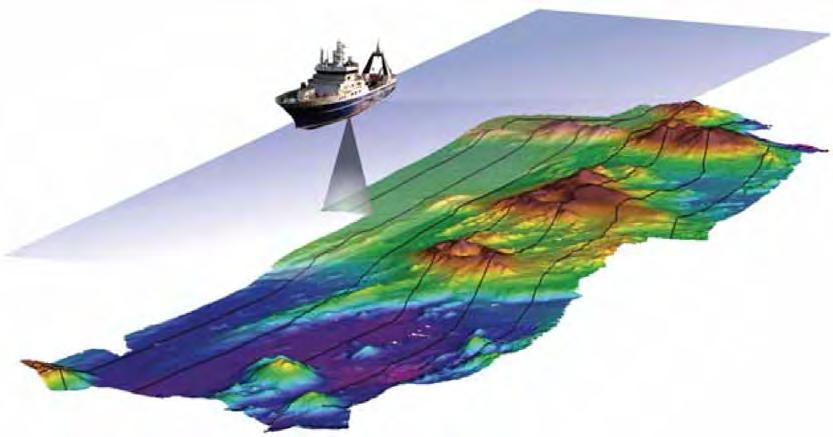 Photos: Makai Ocean Engineering
CABLE FAULTS
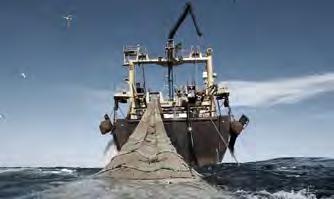
Each submarine cable is designed to last 25 years, however repairs are often required throughout it’s lifetime. Approximately 100 cable faults occur annually world wide and tend to be located near land.
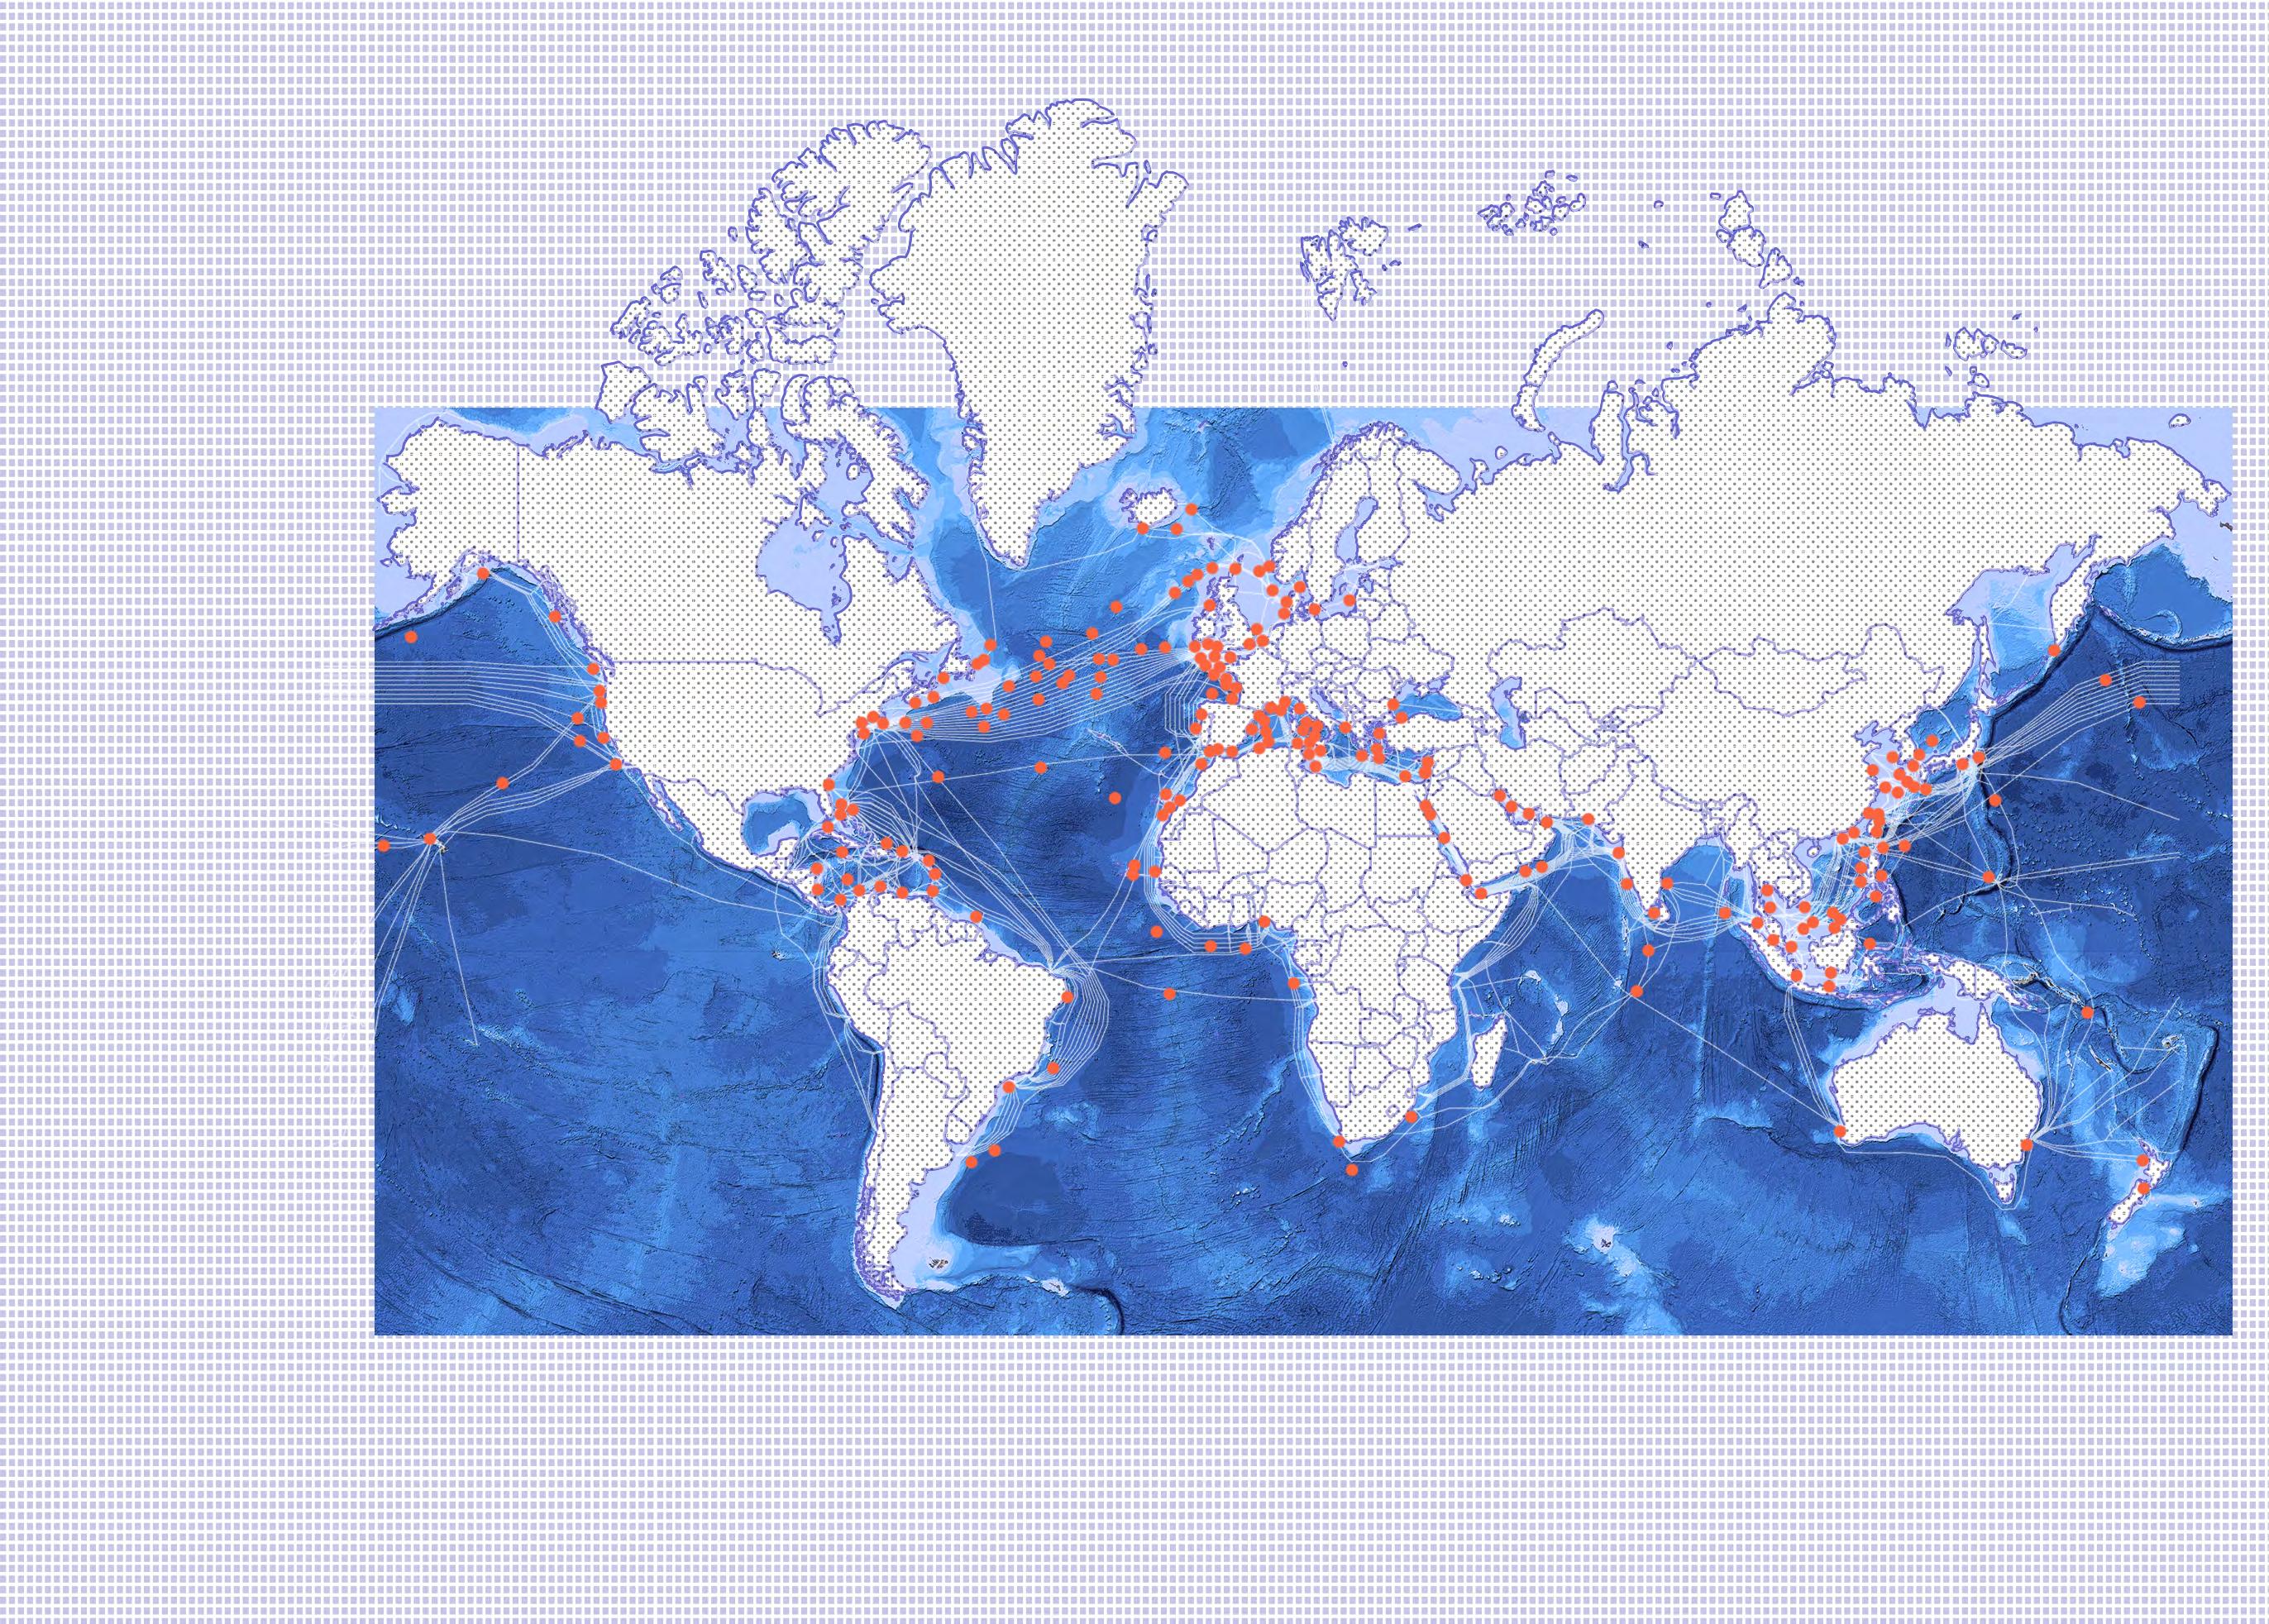
Fishing 44.4%
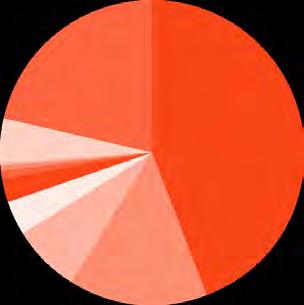 Proportion of cable faults by cause, from a database of 2162 records spanning 1959 - 2006.
Anchor 14.6%
Component 7.2%
Abrasion 3.7%
Geological 2.6%
Dredge/drill/ pipeline 0.9%
Fish bite 0.5%
Iceberg 0.1%
Other 4.8%
Unknown 21.3%
Cable Fault Locations, 1959 - 2006 Submarine Cables
The exact location of the cable landing station is determined by several aspects. The left chart show the submarine cables close to land and the marine activity in these areas. The right chart shows the soil type at the location of the cable landing station. Minimal marine activity and a sandy soil are the ideal circumstances for a cable landing station.



High activity Medium activity Low activity
MINIMAL MARINE ACTIVITY
NORTHEAST ENGLAND
CABLE+LAND INTERFACE
SANDY SOIL
Leamy soil over rock Leamy or clayey soil Peaty surface and/or soil Sand dune soil Cable landing station Submarine cable
NORTHEAST ENGLAND
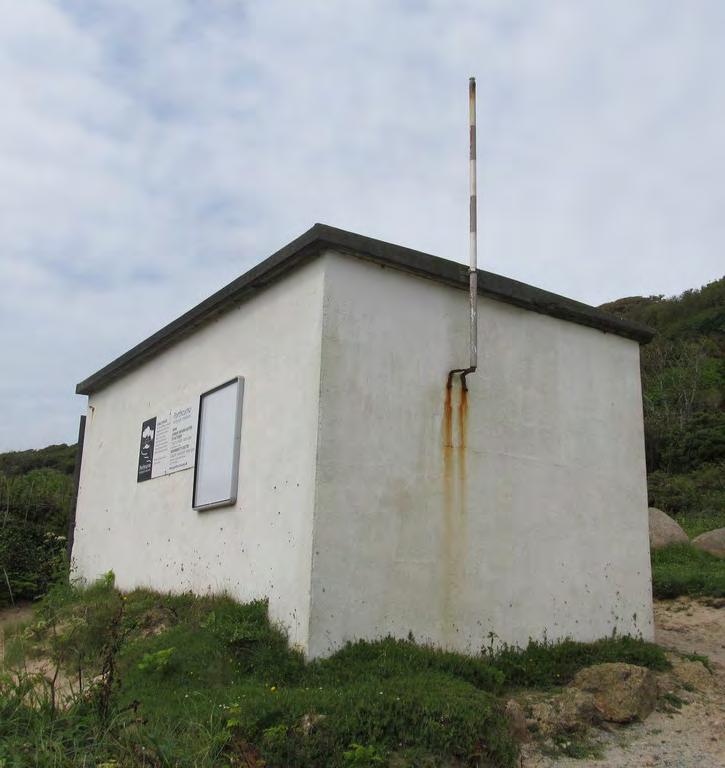
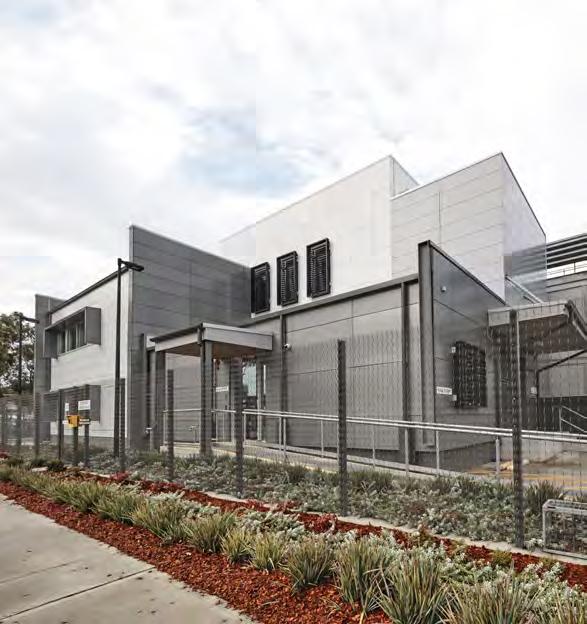
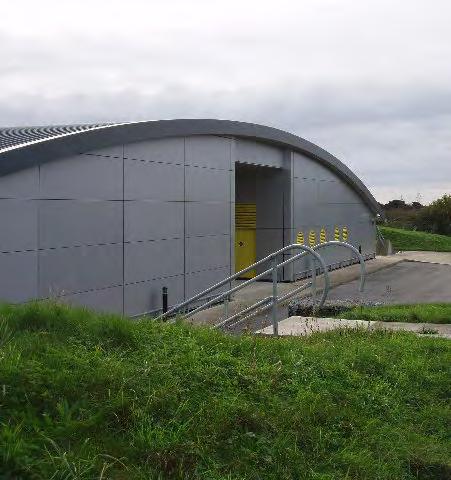
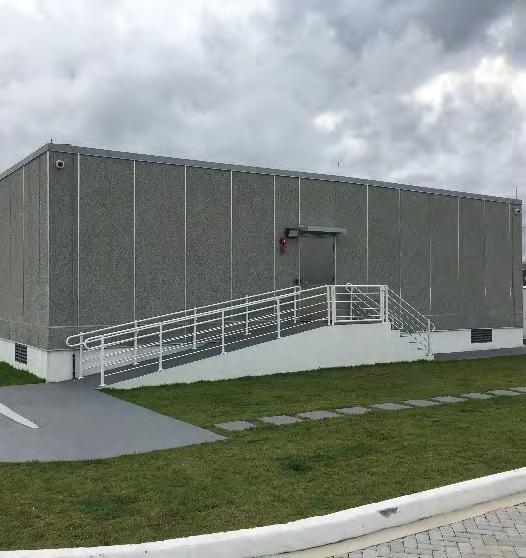
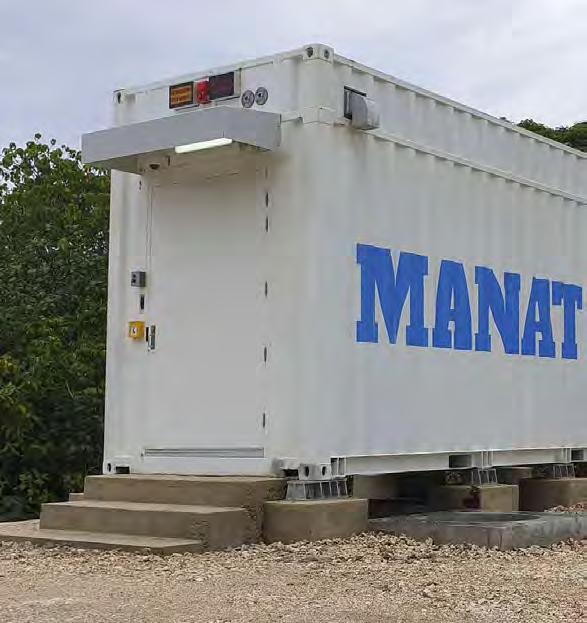
CABLE LANDING STATION COMPONENTS
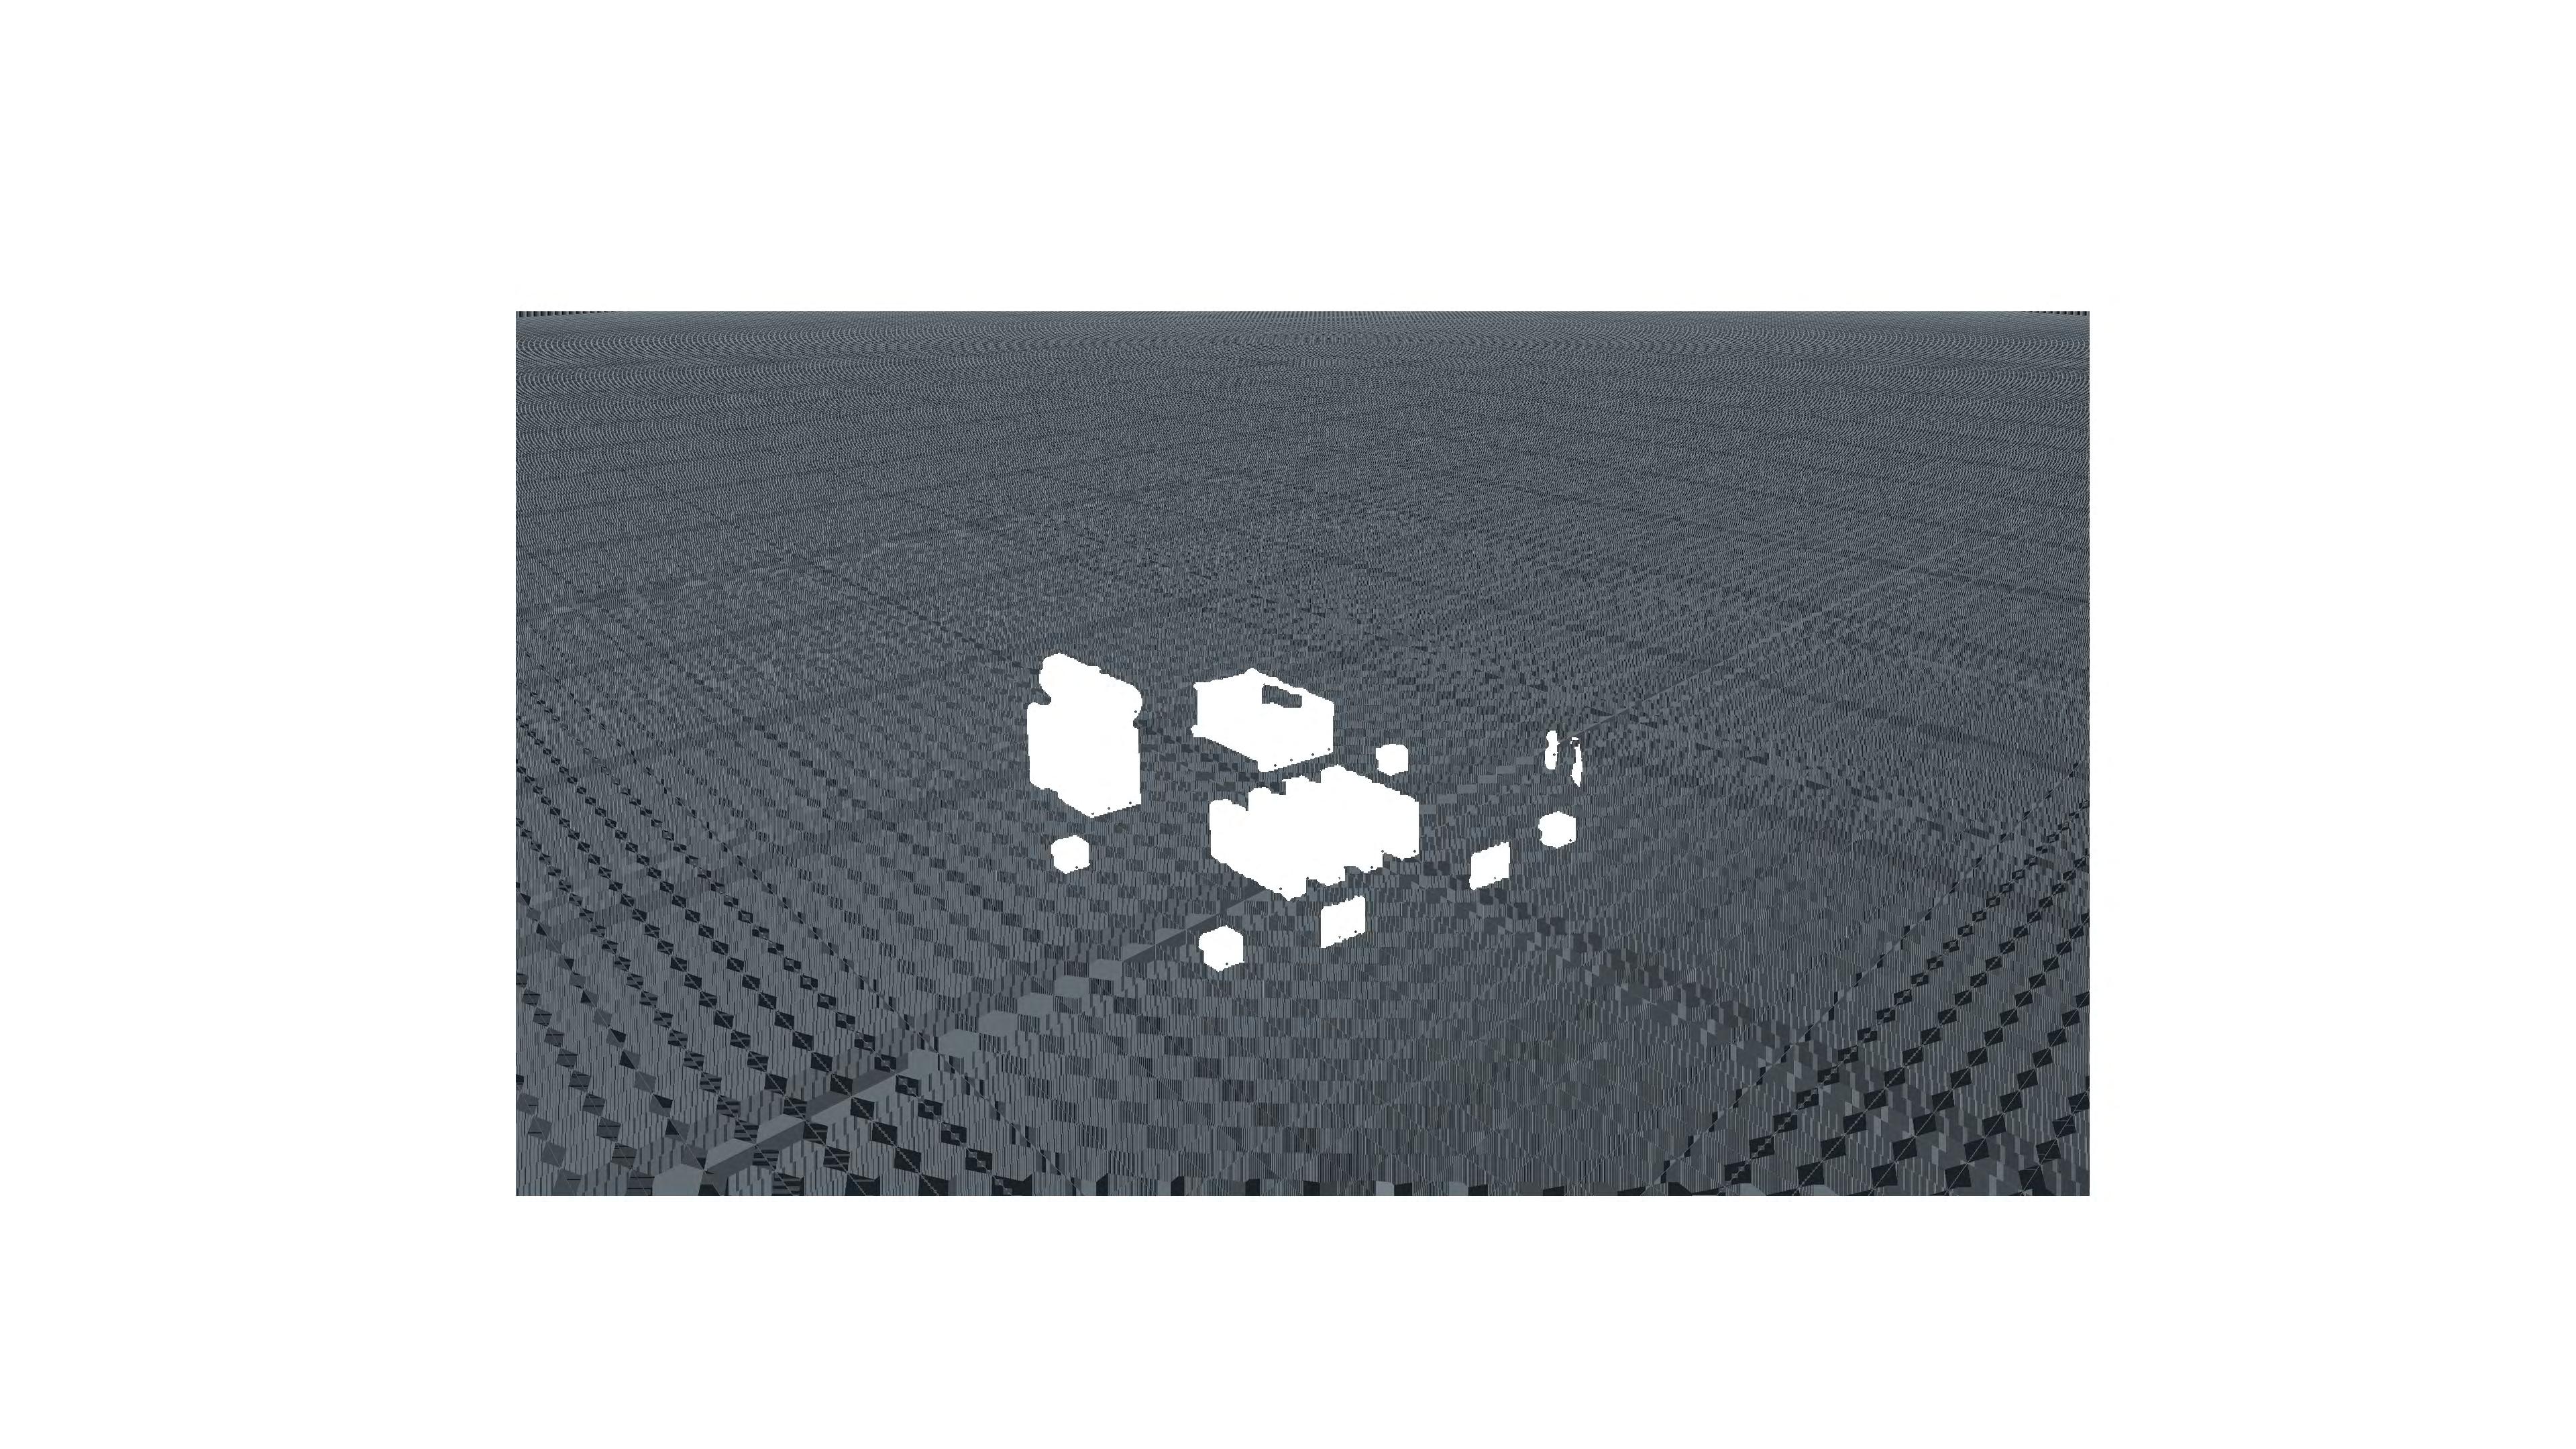
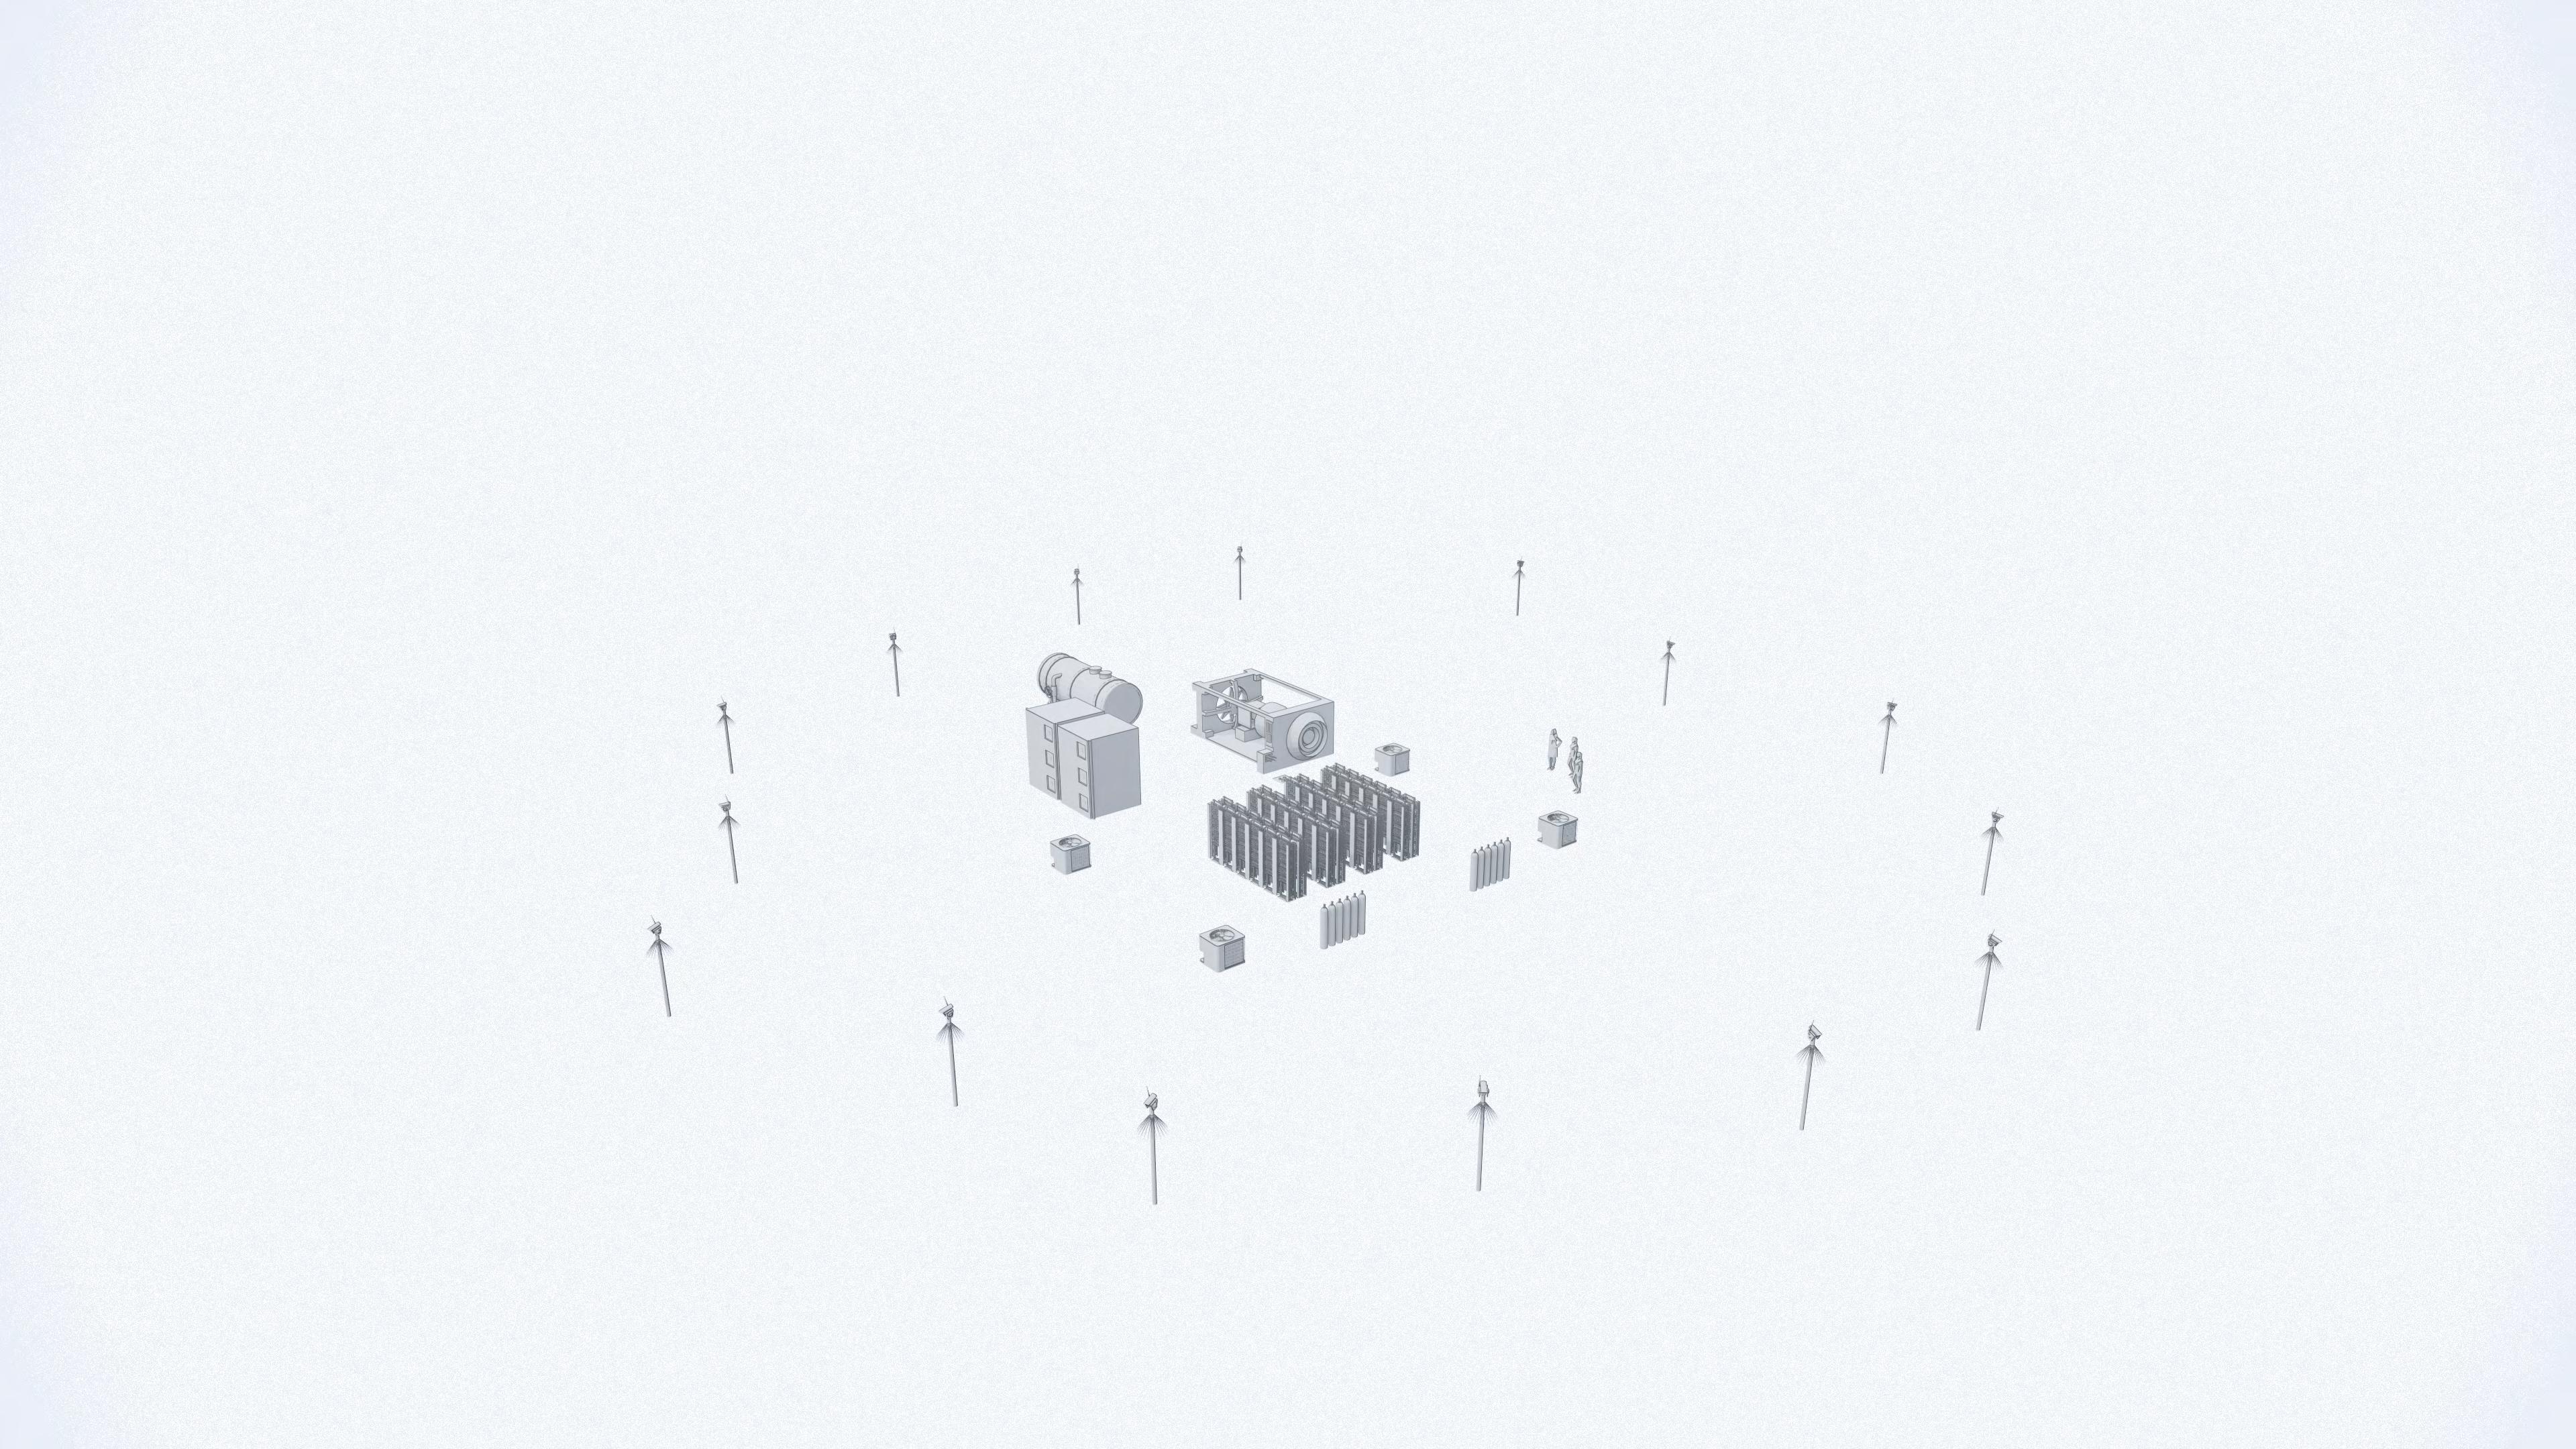
The cable landing station itself consists of several parts. The most important part are the telecommunication racks, these are responsible for the connection between the land and the sea network. These are powered by power generators, back-up power generators and back-up batteries. These power generators maintain the racks to work, but also power the repeaters along the submarine cable. The rooms are very well regulated and secured, both from accidents like fire, but also for outsiders trying to break into the space.
Back up batteries
Ventilation units
Submarine cable network
Power generator
Fuel tank
Telecommunication racks
Land cable network
Control room
Fire extinguishers, working with gas

THE UNDERSEA ENVIRONMENT

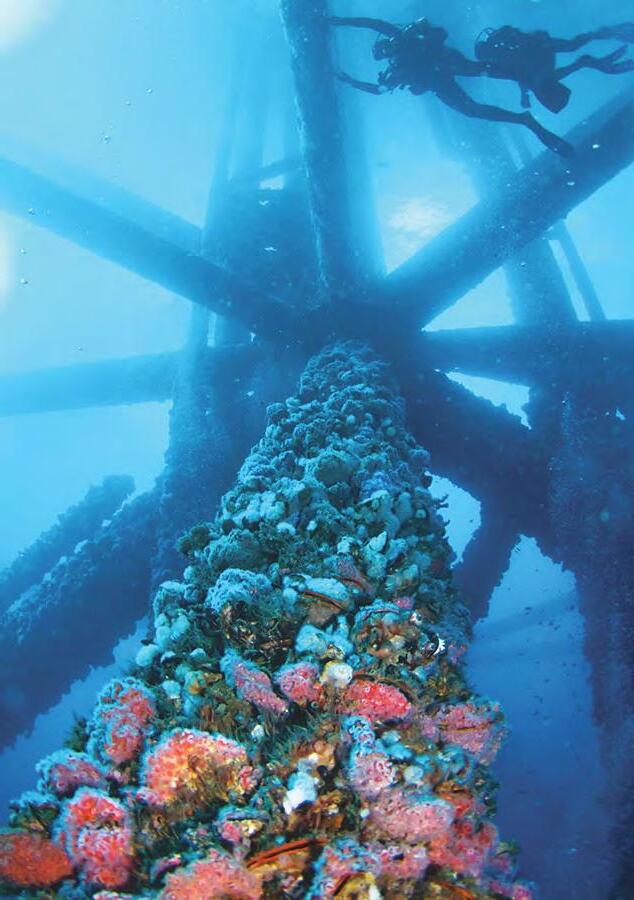
MARINE LIFE IN AN OFF-SHORE OIL RIG
Photo: Joe Platko
THE UNDERSEA ENVIRONMENT
The submarine cable network is extensive, and includes the labour of many people. Both by laying down the cables on the seafloor, as well as controlling the many cable landing stations that are located all over the world. While this system has to deal with the undersea environment, the undersea environment also has to deal with the cable system. The cable system have an impact on the oceans.
Nowadays, oceans still form a largely undiscovered part of the world. In the next part these oceans will be further examined. What can be discovered about these oceans? It dives into the different elements of the ocean environment, the natural processes, the depth, but also to the political situation. It then
shows opportunities for combining this ocean environment with the internet infrastructure. It is the prelude of our design concept: cherishing this important part of the world, and at the same time take the opportunity it offers.
“When it comes to the ocean, the vast majority of it is not just unmapped, but unknown”
Vicki Ferrini
“The ocean economy employed 31 million people full-time and generated $1.5 trillion each year. Maps – or the lack thereof – play a role in nearly every critical ocean issue, from sea level rise to ocean acidification to biodiversity.”
MARINE LIFE IN AN OFF-SHORE OIL RIG
Getty Images
OECD
Photo:
UNDERSEA ENVIRONMENT ATLANTIC
SUBMARINE CABLES
Much of what we know about the ocean today can be attributed to the strong effort towards cable laying in the early 20th century. As crews traversed the oceans environment in order to design cable routes, they also learned about its depths and helped develop a body of oceanic knowledge. Cable workers would send samples to marine scientists and helped compile an archive of the seafloor’s composition (Starosielski 2015).
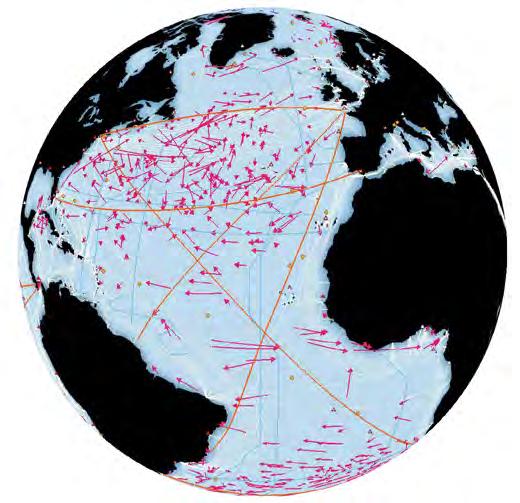
PLATE TECTONICS
Major earthquakes and volcanic eruptions since 1990 are shown on this world map. Fifteen huge plates of ocean and continental crust move slowly but constantly around the surface of the Earth. Their movements and collisions create most of the world’s volcanoes and earthquakes along their boundaries.
(National
MARINE LIFE
An effort called Census of Marine Life is documenting life found in the world ocean. The number of different species found, so far, in each area is indicated on this map – red/ orange meaning many ranging to dark blue/purple being few. The real message here is that discovery of life species in the ocean depends on the amount of research done, and most remote ocean areas still have little or no data. Scientists expect to find millions more species of life in the ocean. In fact, a major portion of the diversity of life on Earth probably lies undiscovered in the ocean depths.
(National Geographic)
GLOBAL OCEAN OBSERVING SYSTEM NETWORK
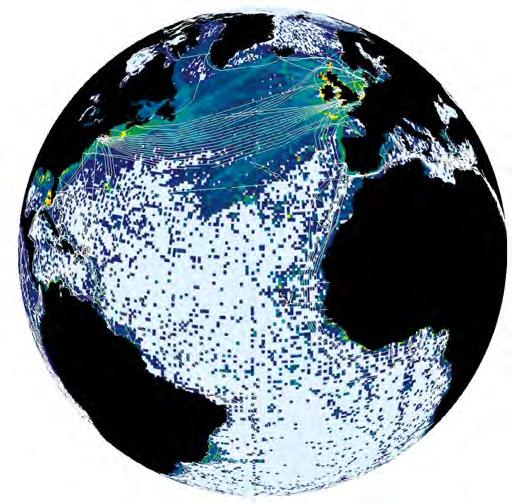
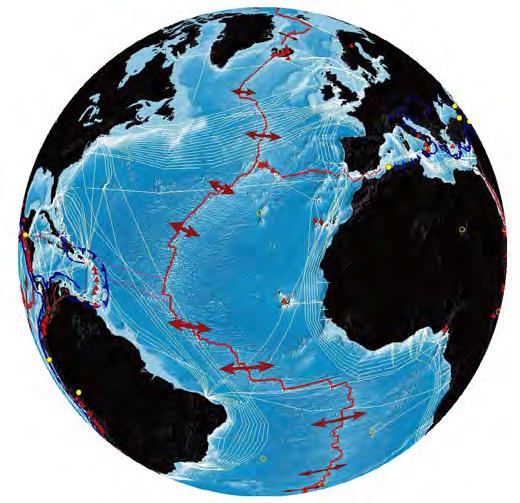
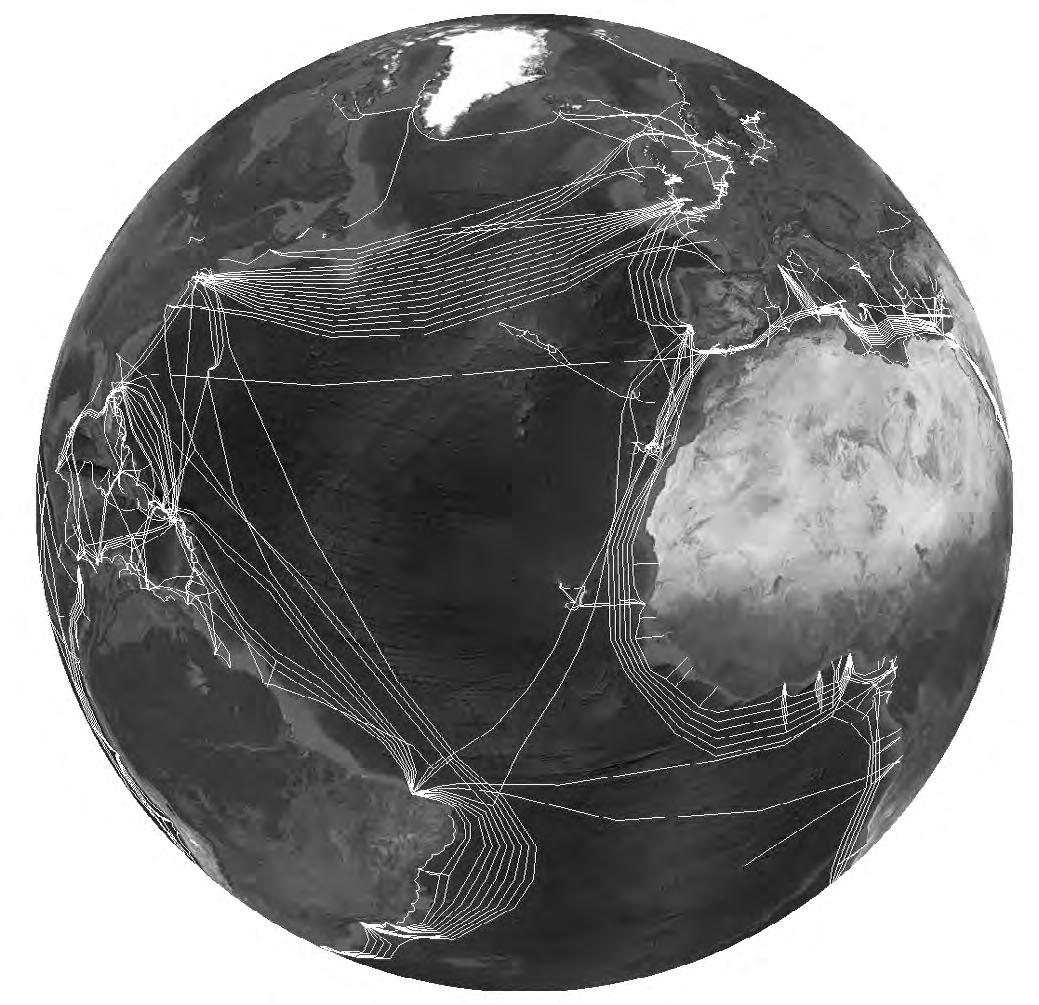
International efforts to study the ocean are expanding, with an increasing number of data collecting systems – measuring water temperature, salinity, currents, tides, and weather -- being deployed worldwide. Such global observation systems will help predict El Nino and similar events, and provide evidence for global climate change.
(National Geographic)
Geographic) Submarine cable Spreading boundary Hot spot Volcanic eruption Divergent plate motion
Surface drifters Expendable BathyThermographs Repeat hydrography Data buoys 0 4.000 8.000 12.000 16.000 19.600 Number of species observed No data
UNDERSEA ENVIRONMENT ATLANTIC
OCEAN CURRENTS
Major ocean currents dictate the flow of ocean water around the globe, generally moving in a single direction around the coast of various land masses that surround the North and South Atlantic Oceans. These currents are constant and predictable.
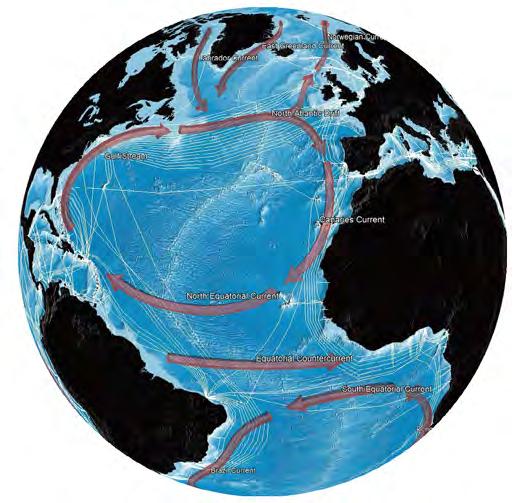
Currents
HUMAN IMPACT
A rigorous analysis published by Benjamin Halpern and his colleagues in Science in 2008 assessed impacts on the ocean from 17 human activities – including pollution, fishing, shipping, oil and gas, development, climate change – on various types of coastal and ocean areas. They found the highest impacts in coastal areas, but also found that no part of the world ocean, however remote, is free of negative human impacts.
(National Geographic)
Level of impact
low high
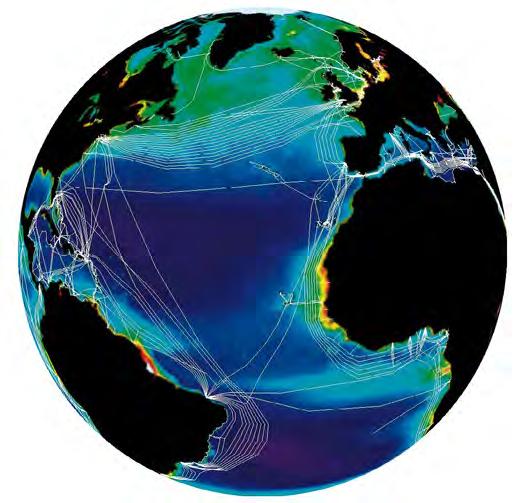
CHLOROPHYLL LEVELS
Chlorophyll concentrations show the density in surface waters of tiny organisms called phytoplankton that convert sunlight into food for the rest of the ocean’s creatures. Phytoplankton are limited by the availability of nutrients in surface waters. The highest chlorophyll concentrations worldwide are seen along coastlines, but winds and currents provide nutrients for moderate levels along the equator, along western continental coastlines, and in the polar regions during their summer months. Lowest levels of chlorophyll are typically seen in remote regions of the South Pacific gyre near Easter Island.
(National Geographic)
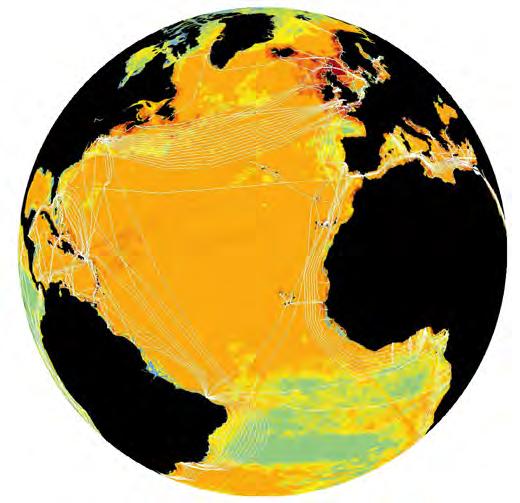
SEA SURFACE TEMPERATURE
Sea surface temperature varies with seasons and climate. Warmest surface waters (red/orange) always occur around the Equator which receives direct sunlight; coldest (purple) at the Poles where sunlight is more indirect. Surface ocean currents then redistribute the ocean’s heat -- seen as cooler waters moving toward the Equator along the west coasts of North and South America, and in the bright orange jet of warm waters being moved north by the Gulf Stream along the east coasts of the U.S. and Canada.
(National Geographic)
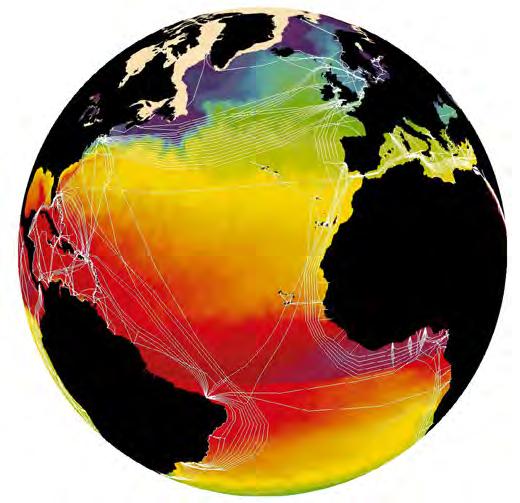
-1 4 9 14 19 24 29 34
surface temperature (oC) 0,01 0,03 0,1 0,3 1 3 10 30 60 Chlorophyll (mg per m3)
Sea
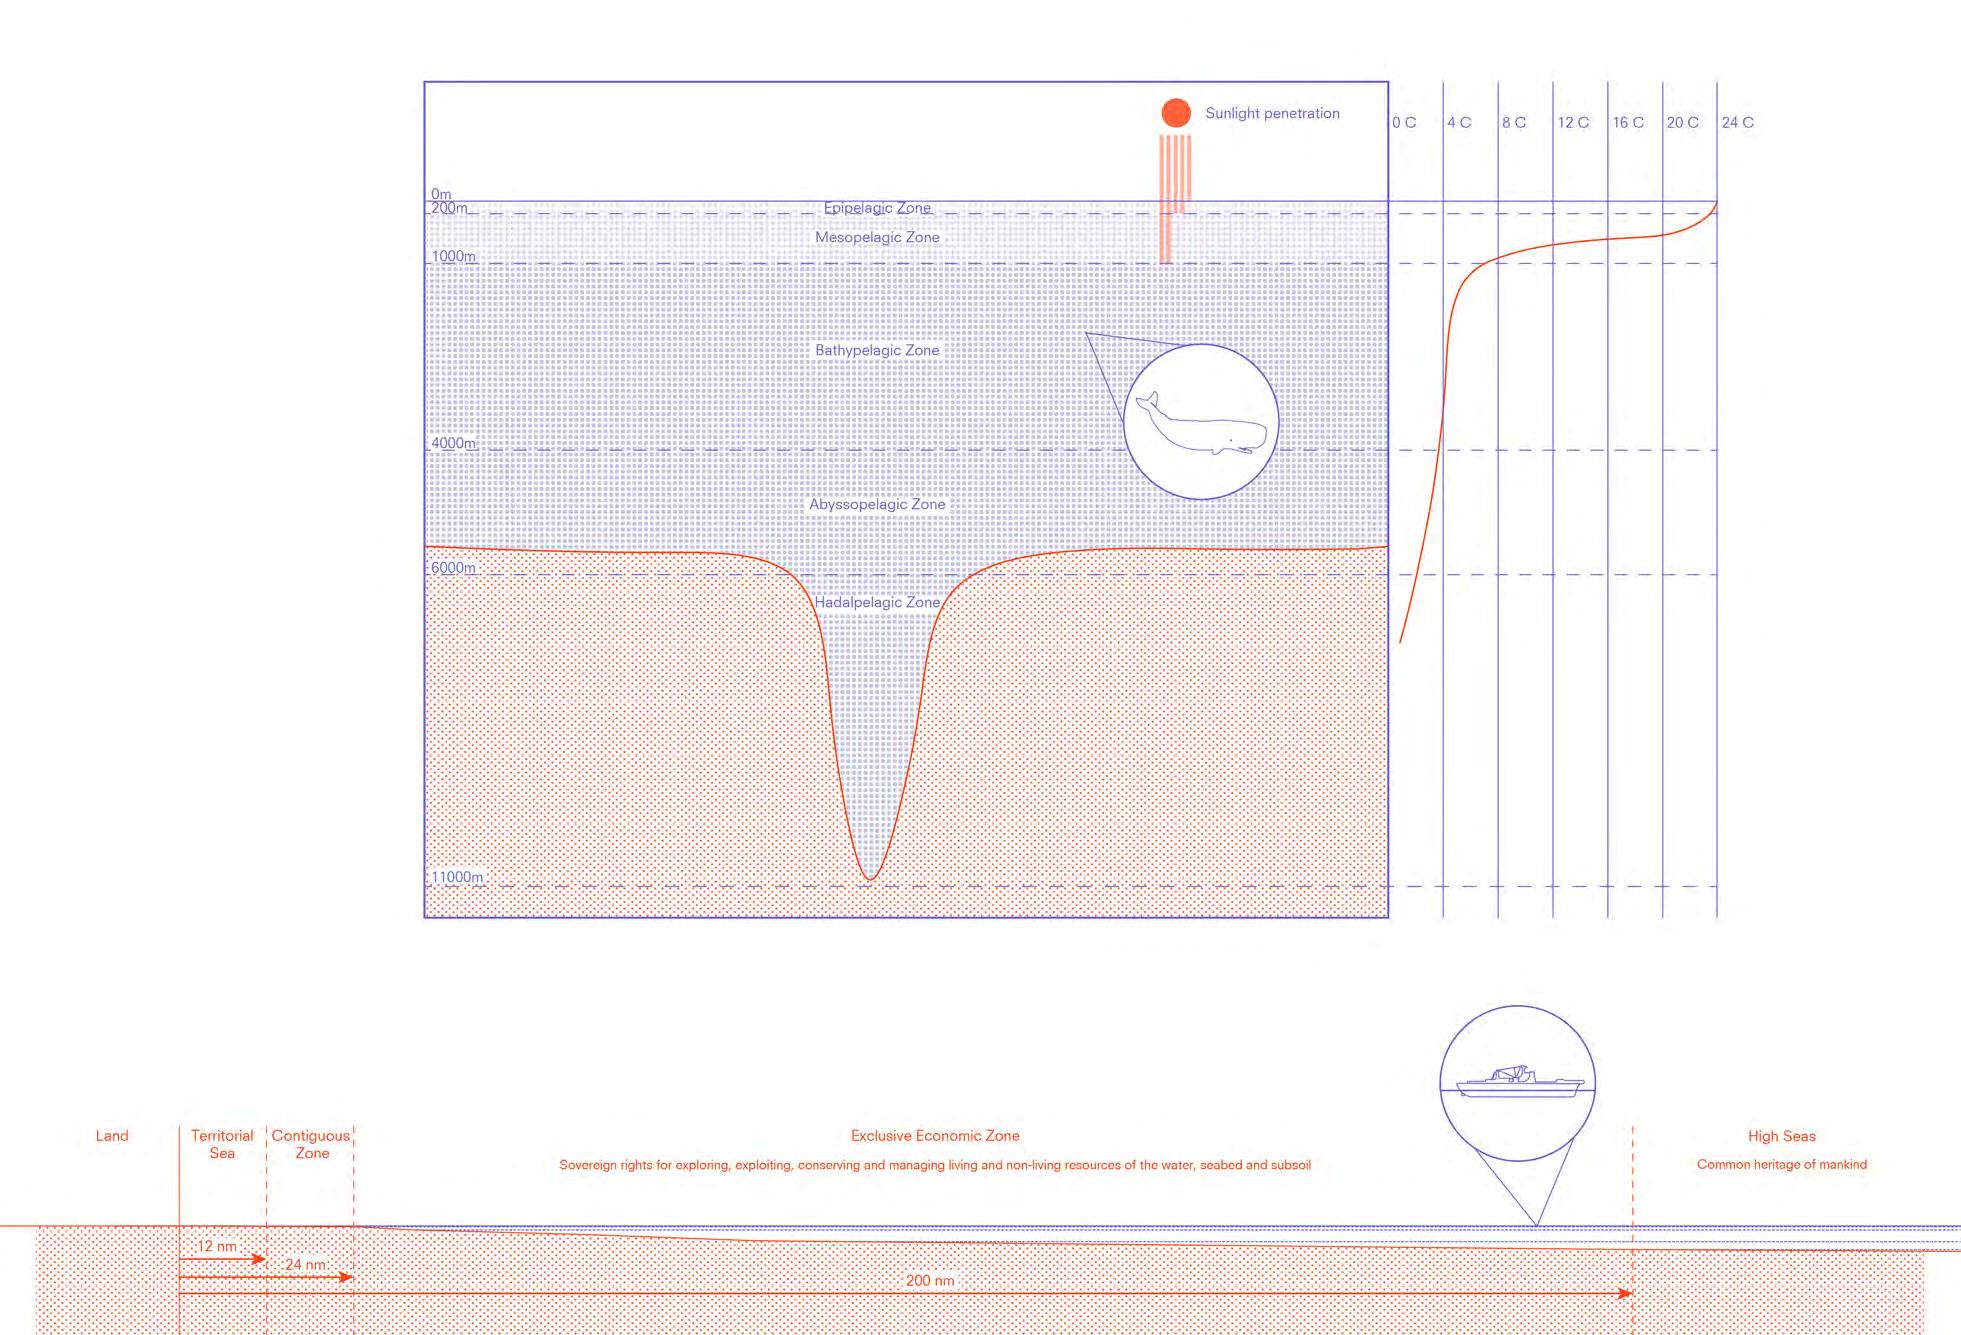
OCEAN DEPTHS
The ocean depths are home to an abundant and diverse marine ecosystem. The species found in the ocean change with depth as the temperature of the water and the sunlight penetration changes.
Characteristics
Marine Habitats
Ample light for photosynthesis. Large concentration of plants and animals such as plankton, floating seaweed, jellyfish, tuna, sharks and dolphins.
Swordfish, squid, cuttlefish, many bioluminescent fish.
Anglerfish, giant squid, dumbo octopus, sperm whales. No living plants.
Very few creatures, many which are transparent and eyeless. Cold temperatures and high pressures.
Rare ocean trenches.
Temperature Change

ENVIRONMENTAL IMPACT
Submarine cables have minimal environmental impact. Cables in operation are buried by sand and become indistinguishable from the natural seabed within 2 years. The total magnetic field associated with the operating cable showed a variation of <1% of the natural field as measured 5 m above the cable.
In some cases, submarine cables can even have a positive environmental impact, and generate new habitants for marine life. Coils of old undersea cables have been used to build artificial reefs and promote marine habitats. Through the biofouling process, hard surfaces can become encrusted by marine species similar to those inhabiting the natural reef—that process occurring within 3.5 years.
Particles
Dissolved organic matter is adsorbed onto the material surface, creating a conditioning film.
A complex, multispecies microbial biofilm is formed onto the organic layer.
Secondary colonizers arrive. Frequently they are attracted by chemical cues produced by the microbial community.
2 3 4 Hours Days Weeks Months
Eventually the substrate is colonized by invertebrate larvae. Algae and invertebrates grow and develop a community of macroscopic individuals. Macroscopic fouling
film
Submerged hard surface
Conditioning
Biofilm
Minutes
colonizersTertiary
of organic matterPrimary colonizersSecondary
colonizers
Macroscopic fouling community
1
Biofouling Process
REFERENCES
Books
Servon, L. J. (2002). Bridging the digital divide: Technology, community, and public policy. Malden, MA: Blackwell Pub. Starosielski, N. (2015). The undersea network. Durham: Duke University Press.
Kennedy, P. M. (2014). The War plans of the great powers, 1880-1914 (RLE The First World War). Routledge.
Burnett, D. R., Beckman, R. C., & Davenport, T. M. (2014). Submarine cables: The handbook of law and policy. Leiden: M. Nijhoff.
Muschert, G. W., & Ragnedda, M. (2015). The digital divide: The internet and social inequality in international perspective.
Carter, L., Burnett, D., Drew, S., Marle, G., Hagadorn, L., Bartlett-McNeil, D., & Irvine, N. (2009) Submarine cables and the oceans: connecting the world. UNEP-WCMC Biodiversity Series No. 31. ICPC/UNEP/UNEP-WCMC.
Journals
Article 87 - Freedom of the High Seas (III). (n.d.). United Nations Convention on the Law of the Sea, 72-86. doi:10.1163/ ej.laos_9789041100351_072-086
Carter, L., & Burnett, D. R. (2015). Subsea Telecommunications. Routledge Handbook of Ocean Resources and Management, 349-365. doi:10.4324/9780203115398-24
CCDCOE (2019). Strategic importance of, and dependence on, undersea cables.
Eyupoglu, C., & Ali Aydin, M. (2015). Energy Efficiency in Backbone Networks. Procedia - Social and Behavioral Sciences 195: 1966-1970. Elsevier Ltd.
Pärssinen, M., Kotila, M., Cuevas, R., Phansalkar, A., Manner, J. (2018). Environmental Impact Assessment of Online Advertising. Environmental Impact Assessment Review 73: 177-200
Andrae, A.S.G., & Edler, T. (2015). On Global Electricity Usage of Communication Technology: Trends to 2030. Challenges 2015, 6, 117-157; doi:10.3390/challe6010117
OECD (2016) The Ocean Economy in 2030. OECD Publishing, Paris. DOI:https://dx.doi.org/10.1787/9789264251724-en
Websites
Kai Hsin Hung Posted in future scenarios reports. (2017, March 09). Global Digital Divide & Solutions in 6 Graphics. Retrieved June 30, 2020, from https://technologyatwork.itcilo.org/global-digital-divide-solutions-in-6-graphics/
Lavallée, B. (2019, February 05). The cable landing station is critical infrastructure. Retrieved June 30, 2020, from https://www.totaltele. com/502079/The-cable-landing-station-is-critical-infrastructure (n.d.). Retrieved June 30, 2020, from https://web.stanford.edu/class/msande91si/www-spr04/readings/week1/Howstuffworks.htm
Bernard, S. (2011, August 08). Crossing the Digital Divide: Bridges and Barriers to Digital Inclusion. Retrieved June 30, 2020, from https://www edutopia.org/digital-divide-technology-access-inclusion
About Carmen Steele Coming from a technical background. (2018, December 04). How to Bridge the Digital Divide. Retrieved June 30, 2020, from http://www.digitaldividecouncil.com/how-to-bridge-the-digital-divide/
Electric power consumption (kWh per capita). (n.d.)https://data.worldbank.org/indicator/EG.USE.ELEC.KH.PC
Global Energy Statistical Yearbook 2019. (n.d.). Retrieved from https://yearbook.enerdata.net/
Buterin, V. (2017) The Meaning of Decentralization. Retrieved from https://medium.com/@VitalikButerin/the-meaning-of-decentralizationa0c92b76a274
Sadowski, J. (2017) Why do big hacks happen? Blame big data. The Guardian. Retrieved from https://www.theguardian.com/ commentisfree/2017/sep/08/why-do-big-hacks-happen-blame-big-data
Mitchell, D. (2018) Evolution of Data Centers. Rack Simply LLC. Retrieved from https://racksimply.com/evolution-of-data-centers-a-look-at-howdata-centers-have-evolved-over-the-past-50-years/
Coors, L. (2016) A Brief History of Data Centers. Interxion. Retrieved from https://www.interxion.com/blogs/2016/09/A-brief-history-of-datacentres
Woods, J. (2014) The Evolution from the Data Center : Timeline from the Mainframe to the Cloud. SiliconANGLE Media Inc.. Retrieved from https://siliconangle.com/2014/03/05/the-evolution-of-the-data-center-timeline-from-the-mainframe-to-the-cloud-tc0114/
Albaugh, D. (2020) Biggest data breaches in history. Retrieved from https://www.comparitech.com/blog/information-security/biggest-databreaches-in-history/
Brainbridge (2018) From 1G to 5G: a brief history on the evolution of mobile standards. Retrieved from https://www.brainbridge.be/news/from1g-to-5g-a-brief-history-of-the-evolution-of-mobile-standards
Glanz, E. (2012) Power, Pollution and the Internet. The New York Times. Retrieved from https://www.nytimes.com/2012/09/23/technology/datacenters-waste-vast-amounts-of-energy-belying-industry-image.html
Rauscher, K. (2010) Rogucci ,The Report. Proceedings of the reliability of global undersea communication infrastructure. IEEE Communications Society.
Philbeck, I. (2017). Connecting The Unconnected. International Telecommunication Union. Retrieved from https://broadbandcommission.org/ Documents/ITU_discussion-paper_Davos2017.pdf
The State of Broadband: Broadband as a Foundation for Sustainable Development. (2019). International Telecommunication Union. Retrieved from https://www.itu.int/dms_pub/itu-s/opb/pol/S-POL-BROADBAND.20-2019-PDF-E.pdf
Connecting Africa Through Broadband: A strategy for doubling connectivity by 2021 and reaching universal access by 2030. (2019). International Telecommunication Union. Retrieved from https://www.broadbandcommission.org/Documents/working-groups/ DigitalMoonshotforAfrica_Report.pdf
Images and Information for Graphics
Internet Minute
https://www.allaccess.com/merge/archive/31294/infographic-what-happens-in-an-internet-minute
Global Internet Infrastructure https://www.itu.int/itu-d/tnd-map-public/
Cable Catalog
https://www.visualcapitalist.com/global-fiber-optic-network-explained/ https://www.submarinenetworks.com/en/systems
https://github.com/telegeography/www.submarinecablemap.com/tree/master/public/api/v2/ready-for-service https://submarine-cable-map-2019.telegeography.com/
Cable Laying Ship
https://www.nytimes.com/interactive/2019/03/10/technology/internet-cables-oceans.html
Cable Ownership
https://blog.telegeography.com/telegeographys-content-providers-submarine-cable-holdings-list https://broadbandnow.com/report/google-content-providers-submarine-cable-ownership/ https://www.google.com/about/datacenters/locations/ https://www.datacenters.com/providers/facebook
https://www.datacenters.com/providers/amazon-aws https://www.datacenters.com/providers/microsoft
Cable Landing Station https://xsitemodular.com/critical-infrastructure/#design-build-process
Cover Photos https://www.moma.org/collection/works/110263 https://www.flickr.com/photos/charlesfred/2348769827 https://www.wired.com/2015/10/undersea-cable-maps/ https://www.windsystemsmag.com/the-latest-advancements-in-submarine-cables-protection/ https://www.wired.com/story/google-cramming-more-data-new-atlantic-cable/ https://imgur.com/gallery/C8kAQ https://www.makai.com/cable-software/dtm-module/ https://www.lamag.com/culturefiles/offshore-oil-rigs-to-reefs/ https://news.microsoft.com/features/under-the-sea-microsoft-tests-a-datacenter-thats-quick-to-deploy-could-provide-internet-connectivityfor-years/


 Robert G. Rogers, Executive Director, Global Information Infrastructure Commission


 >50.00035.000-50.00020.000-35.00010.000-20.0005.000-10.0002.000-5.000<2.000unknown GDP (PPP) per captia in Int$


 3 tanks hold over 5000 tons of cable, enough to cross the Atlantic Ocean.


 CABLE TANK INTERIOR
Fiber-optic cable being loaded onto a ship owned by SubCom, which is working with Google to build the world’s fastest undersea data connection.
Photo: Bill Gallery


 Photos: Makai Ocean Engineering

 Proportion of cable faults by cause, from a database of 2162 records spanning 1959 - 2006.
Anchor 14.6%
Component 7.2%
Abrasion 3.7%
Geological 2.6%
Dredge/drill/ pipeline 0.9%
Fish bite 0.5%
Iceberg 0.1%
Other 4.8%
Unknown 21.3%
Cable Fault Locations, 1959 - 2006 Submarine Cables


