35 minute read
Exploring the Frontiers of Space in 3D: Immersive Virtual Reality for Astronomy Outreach


Research & Applications
Exploring the Frontiers of Space in 3D: Immersive Virtual Reality for Astronomy Outreach
Advertisement
Chris Impey
Steward Observatory, University of Arizona cimpey@as.arizona.edu
Keywords
exhibition, virtual reality, immersive, outreach, observatory, space telescope, telescope
Alexander Danehy
Steward Observatory, University of Arizona adanehy@arizona.edu
An immersive, virtual exhibit of large telescopes and space missions is described. The exhibit aims to overcome the difficulty members of the public have in appreciating the scale and complexity of modern astronomical research facilities. Using detailed 3D models, ground- and space-based telescopes that are impossible to visit in person can be explored by moving through a virtual space. The exhibit was created using Unreal Engine, a tool developed by Epic Games. Users wear Oculus Quest virtual reality headsets and traverse the 3D exhibit using Xbox game controllers. CAD models were gathered from open access sources and with the help of the staff of major observatories. The first version of the exhibit highlights telescopes and planetary missions with major involvement of the University of Arizona, but it can be customised to include any major telescope or space mission. Visitors can experience the 6.5-meter MMT, the twin 8.4-meter LBT, the 24.5-meter GMT, the 25-metre Very Large Array radio dish, NASA’s Hubble Space Telescope and James Webb Space Telescope, the Phoenix Mars lander, and the OSIRIS-REx spacecraft alongside a 3D model of the asteroid Bennu. The exhibit was successfully debuted at an outreach event hosted by the University of Arizona in Washington, DC.
Introduction
The Rise of Virtual Reality
Virtual reality (VR) promises a transformative user experience, although that promise has not always been fully realised. It is a computer-generated simulation of a three-dimensional (3D) image or entire environment, in which the user can view the artificial world, move around, and interact with objects within it (Greengard, 2019). The modern origin of virtual reality lies in the video game industry (Stanton, 2022). In 1984, when Atari closed its research lab, two of its laid-off researchers, Jaron Lanier and Thomas Zimmerman, started a company called VPL Research that created several technologies that are still central to the virtual reality experience (Lanier, 2017). However, within a decade, the first wave of virtual reality fizzled out. The technology was cumbersome, expensive, and often failed to deliver a fully immersive experience. Headsets could lead to eye fatigue, and computers were not fast enough to render head movements in realtime, often resulting in nausea (Kiryu & So, 2007) The renaissance of virtual reality started about a decade ago, in the 2010s. Wellfunded start-up companies developed faster graphics, lower-cost motion tracking, and lighter screens with higher resolution that used less power (Drummond, 2014). Exponential increases in computational speed and power improved the user experience. Facebook bought Oculus, the maker of one of the best headsets on the market, as rated by technology websites like CNET and PC Gamer, and Google provided a virtual reality capability to the hundreds of millions of people who own Android phones (Harris, 2020). The first wave of applications for virtual reality in the 1980s and 1990s was confined to medical diagnostics, flight simulation, car design, and military training. The new capabilities enabled an enormous set of possibilities across scientific research, science education, and outreach. VR headsets span a wide range in quality and cost, from cardboard units for $30 to highend devices for $800 or more (Robertson, 2022). VR for Astronomy Education and Outreach
Astronomy has a strong tradition of 3D visualisation. This is not the same as virtual reality since the user does not navigate in a virtual space directly analogous to their real, physical space. However, it shares with virtual reality the characteristic of rendering data in three dimensions so that it can be explored and manipulated (Kent, 2019). 3D visualisation plays a valuable role in modern astronomical research, allowing researchers to extract new knowledge from complex datasets (Hurt et al., 2019). The data used for visualisations can be sophisticated, such as results from 3D hydrodynamic simulations (Orlando et al., 2019). Researchers have used Unreal Engine, the software used to create the popular video game Fortnite, to render an entire mock universe in real-time (Marsden & Shankar, 2020) and to render aspects of the entire history of the universe back to the quantum gravity era (Hamieh, 2021). It is noted that these applications are sophisticated visualisations, but research using VR and astronomical data has also begun to take off (Baracaglia & Vogt, 2019; Jarrett et al., 2021).
Once a 3D visualisation is created, it has the potential to be used for education and public outreach (Crider, 2020), and the use of VR headsets for education has increased rapidly in the past few years (Cankaya, 2019). The most capable platform for both purposes is the WorldWide Telescope, which can deliver data to museum exhibits, virtual reality headsets, and planetarium domes (Rosenfield et al., 2018). WorldWide Telescope incorporates many astronomy data sets; it lets users create scripted “tours,” and it is open-source software with a web client. NASA provides a large, free collection of VR experiences for download. They include 360-degree videos from Mars missions and 3D models of various Solar System objects (NASA, 2022). A dozen virtual tours can be found on the website of the European Southern Observatory (European Southern Observatory, 2022). Despite this work, there have been relatively few virtual reality projects aimed at the public. Examples include interacting with a supernova remnant (Arcand et al., 2018; Ferrand & Warren, 2018), creating a virtual galaxy (Borrow & Harrison, 2017), a tour of the ALMA Observatory (Hiramatsu et al., 2021), and exploring the science of NASA’s James Webb Space Telescope (Space Telescope Science Institute, 2018). There have been even fewer studies of the design principles that guide good virtual reality learning experiences (Kersting et al., 2020; Kersting et al., 2021). This is the first paper to describe a virtual reality tour of multiple major telescopes and planetary sciences space missions.
Creating the Virtual Exhibit
Software and Hardware
For this project, we selected the most popular tools for creating virtual reality experiences. In doing so, we were confident that the development experience would be as smooth as possible. On the software side, we chose Autodesk’s 3ds Max – a 3D and CAD design and modelling application – and Epic Game’s Unreal Engine 4.24 (UE4), and on the hardware side, we used Facebook’s Oculus Quest 2 (OC2) headset.
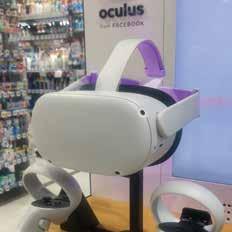
Autodesk is the leading creator of computeraided design (CAD) software; their most widely known title is AutoCAD. Their 3ds Max software is best-suited for rigid models like buildings and cars and is often used to create cinematic special effects. Due to Autodesk’s market dominance, they have come to decide what “standards” exist in the 3d development world. As such, it is easy to use 3ds Max to create a model and any relevant animations, which can be used in Unreal Engine directly. The other software choice was easy since UE4 is a freely available state-of-the-art gaming engine used extensively for visualisations and animations in architecture, medicine, and many fields of science (Shannon, 2017). For hardware, the choice required more thought, as displays for virtual reality experiences are improving rapidly (Zhan et al., 2020). While it has been claimed that there is no substantial difference between the VR experience using an Oculus Rift headset (a more powerful device than the Oculus Quest we used) and a lower-cost smartphone headset, that only applied to the Titans of Space app, while the telescope exhibit described in this paper is much more demanding computationally (Papachristos et al., 2017) . The OC2 is a portable, relatively lightweight, and affordable (about $300) headset capable of delivering a medium-quality VR experience (Figure 1). To provide the very highest quality experience, we would have needed an Oculus Rift or an HTC Vive headset. Both of these are higher resolution and higher framerate than the OC2, but they each require a full gamingclass computer to drive them and cost approximately twice as much as an OC2
Figure 1. Oculus Quest 2 virtual reality headset and hand controllers, used to navigate an immersive experience of large telescopes and space missions Credit: KKPCW/Wikipedia Creative Commons without the computer. All VR headsets are far more affordable than a CAVE virtual reality room, which typically runs $50,000. The OC2 can deliver a novel and exciting experience to non-gamers and anybody who does not regularly play video games; gamers are highly attuned to nuances in rendering and gaming performance and will easily be able to discern quality differences between top-tier hardware and the mid-range OC2. Also, gamers tend to experience VR through a tethered headset connected to a powerful computer. In contrast, we opted for untethered headsets, with a subsequent loss in bandwidth and visual quality but much greater flexibility and convenience for multiple users. The sense of immersion does not arise from the fine details but from the fact that a 3D environment is being rendered in realtime. Developing for the OC2 is a more constrained process than developing for the Rift or Vive. Staples of modern “eye candy” such as global illumination, real-time shadows, and reflections are too much for the OC2 to handle and must be dispensed with. Also, high-resolution models cannot be used. Not only does the OC2 struggle to render so many 3D elements at once, but the entire programme – including images, sounds, models, and code – is limited in size to 2GB. However, by trimming down the complexity of 3D models, we were able to deliver a satisfying user experience with the OC2, as we discuss in the next section.
The Development Process
The first development round was bottom-up. We put our models into a world, textured and illuminated it, and then tried to run it in a VR environment. Many off-the-shelf models come with extreme detail, especially if they are based on engineering (CAD) models. Often, they include every wire, bolt, pipe, and internal structural components, such as beams and rebar. These are necessary for engineering and construction, but they are often unseen and unnecessary in a game. Despite this, the game engine must include such components in every calculation, needlessly hampering performance.
“Mesh” is the term used to describe a 3d model – every 3d model is a collection of vertices and edges which combine to create triangular surfaces. When
viewed without surfaces (transparent or “wireframe”), it looks like a mesh fabric. The number of vertices (and therefore edges) defines the resolution of a mesh. More vertices yield higher resolution but also require more processing power to render correctly. Lowering the number of vertices lowers the number of real-time calculations a game engine is required to make – this is called “mesh optimisation”. In the context of 3d rendering software, a true sphere technically has “infinite faces”, but that is an impossible task for a computer to render. A sphere can be passably represented with a low, finite number of faces – typically 240 – without looking “low-poly” (low polygon count or jagged edged) to the user. When optimising meshes for our VR experience, we lowered the numbers of vertices in our models multiple times until they began to look low-poly, then used the previous iteration. This process enabled us to remove superfluous edges that only served to worsen the in-game experience without improving the visual quality of the model.
After many iterations of removing or meshoptimising the components or lowering their resolution, the application functioned on the headset, but it was slow and visually unappealing. It also only worked while connected directly to the development computer (tethered), which was untenable for our needs. The major hurdle at this stage came from the fact that Oculus applications are technically just Android applications, distributed as APK files. APKs have a strict size limitation of 2GB. Importing models or meshes (3D models made of polygons) with UE4’s default settings ended up being very costly, as it automatically imported textures for each model and then automatically created unnecessarily large materials for each texture. By the time we exceeded the 2GB limit, we had added less than half of the models we wanted to use. A 3D model that was very challenging to incorporate into the world and then animate was a 5-centimetre resolution model of the 500meter diameter asteroid Bennu (Figure 2; Bennett, 2021).
Therefore, we started over with a topdown approach, importing bare-bones models and compiling basic shaders one at a time. A shader is extra code that can alter visuals by changing how textures and lighting are displayed. Then we built the application (compiled all the elements into an Oculus-friendly format) after each step. In this context, a shader is what defines what an object looks like in 3D space. Shaders combine colours, images, and mathematics to create a “material” or “surface” that is applied to a mesh (a 3D model). For example, shiny and matte red paint start with the same colours and images but utilise different linear algebra to create the final, different effects. Since most telescopes have the same kind of materials (white-painted steel, reflective red metal, mirrors), we were able to save significant space by creating single materials for reuse or using UE4’s Material Instance object: a method for creating new materials based on existing ones, so common information is not duplicated. It takes much longer to do this as materials have to be applied to surfaces manually and individually, but in the long run, it is a more efficient process.
3ds Max was not necessarily required for this project, but we did not make all the models in-house. Despite working for a major (25%) partner on the Large Binocular Telescope, we could not obtain CAD models and had to purchase a mesh from a 3D model supplier called TurboSquid for $350. The model we bought of the LBT was so detailed it appeared to have originated directly from the internal CAD files, which meant that it included engineering information. Behind the walls were plumbing, wiring, individual bolts, and other utilities that would ultimately slow our application down significantly and take up unnecessary space. We used 3ds Max to remove those elements and keep the portions we wanted. We also purchased 3D models of the Bennu asteroid, the NASA Hubble Space Telescope, and an animated model of the NASA James Webb Space Telescope from TurboSquid. OsirisREx provides a free 3D model on their website, but it is far too low-resolution to be used in our application. It looks decent from a large in-game distance, but it does not pass close inspection, instead looking like a many-metres wide ball of clay. For some other models, optimisation was required. By default, the GMT mirrors each contained 28,000 triangular faces, but the same visual effect could be achieved with 36 faces per mirror. That componentlevel optimisation can only be done within an application like 3ds Max (or a free alternative such as Blender).
One method for importing and texturing meshes in a game development context is to break each model into smaller components and import them individually. For instance, a radio dish telescope might have the dish, yoke, and base as separate components. This would make texturing easier – one material per model – but it would require joining them back together inside the game engine, which is timeconsuming and imprecise. The best way to work with complex, textured meshes is to keep the model intact as a single mesh and apply material groups for each individual texture: mirrors as one group, reflective
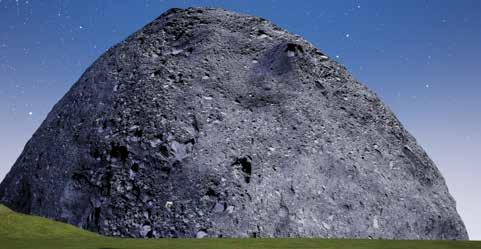
Figure 2. The near-Earth asteroid 101955 Bennu is represented in the virtual exhibit using a 3D model with 5-centimetre resolution. The OSIRIS-REx spacecraft, currently delivering a sample of the asteroid to Earth, can be seen in front of the 500-metre-diameter asteroid at the lower left. Credit: Impey/Danehy/University of Arizona
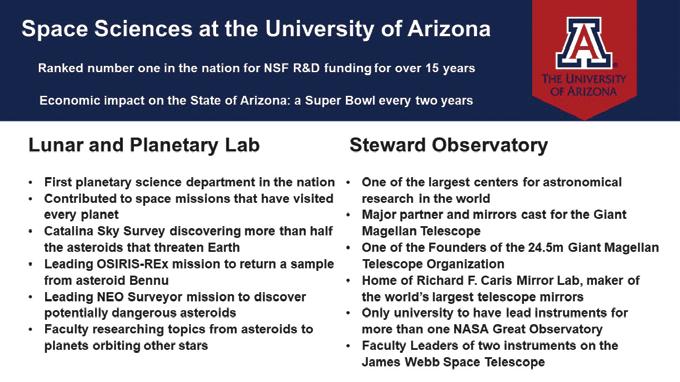
Figure 3. Space science research achievements of Steward Observatory and the Lunar and Planetary Lab at the University of Arizona. These items appear on a billboard at the entry point of the virtual exhibit. Credit: University of Arizona
red metal as the next, and so on. These material groups can only be assigned in an application like 3ds Max or Blender.
Building an APK for distribution or use on an OC2 cannot be done with UE4 (or Unity) alone. An external compiler is needed. Luckily, Google freely distributes such a compiler with their Android Studio IDE. Android Studio (or just the compiler) must be installed on the build system, and UE4 must be made aware of its location on the system. Without this, even tethered development builds will not work. Oculus specifically does an excellent job of documenting this process, but despite that, it is very sensitive to even the smallest changes. We recommend that once a system is stable and functional, no updates be made to the development software. The hardware side of the project is much more straightforward. Meta’s Oculus Quest 2 headsets come with controllers in the box. To test the development builds using these controllers without needing to publish to the Oculus store first, the headset had to be put into developer mode. This is as simple as creating a free developer account with Oculus and using the companion app to enable developer mode on the headset. No further modifications need to be made. The computer that developed this project was a top-of-the-line, custombuilt, gaming-class workstation, costing approximately $5,000. It contained a 24-core, 4.5 GHz AMD Ryzen Threadripper 3960X, 128GB of RAM, and an nVidia 2080 SUPER GPU. This computer was more than capable of handling the development process. Working with multiple 3D assets, high-resolution images (for textures and materials), and multiple compiles requires significant computing power. Any computer for a project like this must be considered a “gaming class” or “workstation class” to handle this workload. Compiling the code requires substantial CPU power to be accomplished in a reasonable amount of time. Developing the game requires a modern GPU and a large amount of RAM. Doing all those things at once requires more than off-the-shelf hardware.
Astronomical Facilities
The virtual reality exhibit discussed in this paper was designed to highlight astronomy and space science research at the University of Arizona (UA) for nontechnical and public audiences. The research is the product of the faculty and staff in the Department of Astronomy/ Steward Observatory and the Department of Space Sciences/Lunar and Planetary Laboratory. Steward Observatory is one of the largest centres for astronomical research in the world, and it makes the world’s largest telescope mirrors. The Lunar and Planetary Lab was the first planetary science department in the United States, and it has contributed hardware to space missions that have visited every Solar System planet (Figure 3).
A major goal of the VR exhibit was to give non-expert visitors a sense of the scale of frontier astronomical facilities. The biggest ground-based telescopes cannot all be toured by the public or are in remote locations, and planetary probes and space telescopes are impossible to see up close. In the exhibit, visitors walk among the “giants,” seeing details of the construction and watching some of them display animated motions, such as telescopes slewing. For example, OSIRISREx was launched in 2016 and is currently heading back to Earth carrying a sample of the near-Earth asteroid Bennu, with a return due in 2023 (Lauretta et al., 2017). Visitors see the spacecraft in front of a slowly spinning, full-scale rendering of the
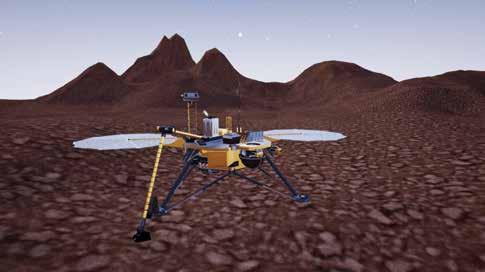
Figure 4. A 3D model of the NASA Phoenix lander that reached Mars in 2008 and conducted experiments on the presence of water and the potential habitability of Mars. Credit: Impey/Danehy/University of Arizona
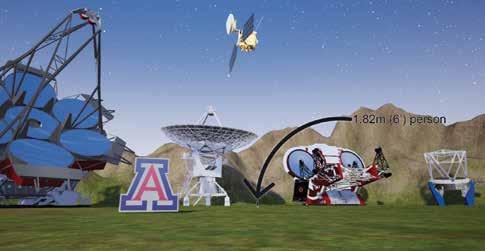
Figure 5. Telescopes in the virtual exhibit include (from left to right) the 24.5-meter Giant Magellan Telescope, a 25-metre radio dish from the Very Large Array as a stand-in for one of the dishes of the Event Horizon Telescope, the twin 8.4-metre Large Binocular Telescope, and the 6.5-metre MMT. Credit: Impey/Danehy/University of Arizona
500-metre diameter asteroid. Part of the 3D landscape is converted into a patch of Martian terrain. Here, visitors can inspect the Phoenix lander, which in 2008 studied the history of water in the Martian arctic and assessed the biological potential of the ice-soil boundary layer (Renno et al., 2009; Figure 4). In the sky above the Martian terrain is HiRISE, a camera attached to a satellite called the Mars Reconnaissance Orbiter, which has been mapping the entire planet at metre-scale resolution since 2006 (McEwan et al., 2007).
Optical telescopes in the exhibit are all partnerships involving the University of Arizona, where the mirrors were fabricated at the Richard F. Caris Mirror Lab (Martin et al., 2016). The smallest telescope on view is the 6.5-meter MMT, a joint venture of the University of Arizona and the Smithsonian Institution, located on Mount Hopkins in Southern Arizona (Williams et al., 2016). Nearby is the Large Binocular Telescope (LBT), which houses two 8.4-metre mirrors on a common mount, equivalent to one 11.8-metre telescope. The LBT is run by an international consortium located on Mount Graham in Southern Arizona (Hill et al., 2014). The largest telescope in the exhibit is still “virtual,” as it is still under construction at Las Campanas Observatory in Chile. The Giant Magellan Telescope (GMT), an international consortium of thirteen leading universities and research institutions representing five countries, will have seven 8.4-metre mirrors combining to give the collecting area of a 24.5-metre telescope and a resolving power ten times greater than the Hubble Space Telescope (Fanson et al., 2018).
We additionally included a single radio telescope. The dishes used in the Event Horizon Telescope are diverse, ranging from 12 metres to 50 metres in diameter. We used a 25-metre dish from the Very Large Array (VLA) as an exemplar of radio dish design. The Event Horizon Telescope (EHT) is a global network of synchronised telescopes whose signals are combined interferometrically to make a radio image with extremely high angular resolution (Ricarte & Dexter, 2015). The Event Horizon Telescope made front page headlines in 2019 with the first image of the shadow created by the event horizon of a supermassive black hole (Akiyama et al., 2019), followed in 2022 with an image of the black hole at the centre of our galaxy (Akiyama et al., 2022). Animated 3D models mean the optical telescopes are shown gently slewing across the sky (Figure 5). For the LBT, lasers shine out from the telescope into the sky, part of an adaptive optics system that gives the telescope superior resolving power to the Hubble Space Telescope (Rabien et al., 2010).
Two space telescopes are suspended in the sky of the exhibit. The first is the venerable Hubble Space Telescope (HST). Launched in 1990, HST is the most productive scientific experiment in history (Apai et al., 2010), which is even more remarkable since it is not one of the seventy largest telescopes. The exhibit features images made with NICMOS, the near-infrared instrument on HST (Schneider, 2004). The second is NASA’s James Webb Space Telescope (JWST), the successor to HST and the largest and most expensive space telescope ever built (Kalirai, 2018). JWST was launched in late 2021 and released its first science images in mid-2022 science operations (Rigby et al. 2022). JWST will be the flagship observatory for astronomy from space for the next decade (Figure 7). An animated 3D model for the JWST shows the 18 hexagonal gold-covered mirrors unfolding and the 15 x 20 metre,
tennis-court-sized solar shield unfurling, illustrating the complexity that makes the telescope such an enormous engineering challenge (Feinberg, 2018).
Designing the User Experience
At the project’s outset, it was clear that visitors to the VR exhibit would be selfguided. This is because reactions to this type of immersive experience vary widely. The dominant factors in user satisfaction with mobile VR headsets are usability or user control, sickness, and wearability (Choi et al., 2019). However, there are many methods for measuring user experience, with no clear research methodology on what the best methods are in any particular application (Weinrich, 2018). With half a dozen headsets in operation simultaneously, the choice was between shepherding everyone through the VR experience like a tour guide or letting everyone go at their own pace. Visitors were likely to find some facilities more interesting than others, and a single pace for a tour might be too fast for some and too slow for others, leading to the decision to make the experience self-guided. The decision was validated during the inaugural event because few users needed or sought guidance.
That, in turn, meant the exhibit needed signposts and some explanatory material. Users launch the app from the Oculus Quest store – a virtual-reality version of
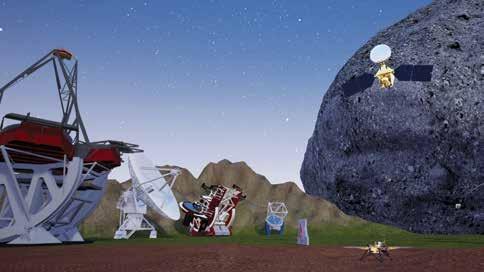
Figure 6. A panorama in the virtual exhibit shows most of the telescopes and space missions, with the 500metre asteroid Bennu giving a sense of scale. Credit: Impey/Danehy/University of Arizona
Apple’s App Store or Google’s Play Store, found on iPhones and Android phones, respectively – and enter the exhibit near the centre of a roughly rectangular patch of virtual land. A starry sky realistically mimicking a location above the American Southwest is rendered above them. A user-generated plugin called Data Driven Starfield is the only realistic sky that works on Oculus. In front of the user are a rotating University of Arizona logo and a large billboard with short bullet points giving the high research points at Steward Observatory and the Lunar and Planetary Lab (Figure 3). Telescopes line one side of the landscape, with a mountain range behind them. At one end of the set of telescopes, the mountains turn into foothills and a reddish Martian terrain. At the other end, they taper off to reveal the asteroid Bennu (Figure 6). Opposite the telescopes, hovering above a transparent platform so that stars can be seen above and below, are the two space telescopes (Figure 7). Since the sky we added is rendered over 360 degrees, it can be seen below the platform that holds all the telescopes. Each facility has a billboard next to it that presents a high-impact image of a science highlight with a one-sentence description, and those with a UA principal investigator have a headshot billboard located nearby.
Disorientation and safety issues are real possibilities with VR headsets, so visitors were seated in swivel chairs rather than standing with the freedom to move around. Navigation used a standard Xbox joystick; the side-to-side motion was possible either using the joystick or by swivelling in the chair. Normal forward motion was equivalent to a slow walking pace, with one controller button enabling a running speed to traverse the exhibit more rapidly. There was also a “jump” button which users were advised to use judiciously. It elevated them to the equivalent of sixty metres giving an aerial view of the entire exhibit. Two facilitators were at the exhibit at all times to give users guidance as needed on navigation. The final ingredient in the experience was soothing ambient music, which also helped cocoon users from background noise.
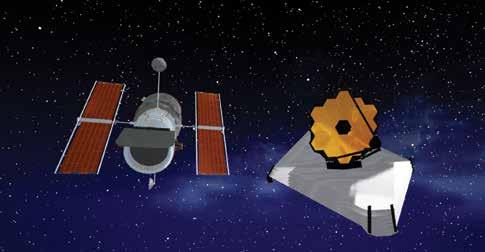
Figure 7. Space telescopes in the virtual exhibit are the Hubble Space Telescope, launched in 1990, and the James Webb Space Telescope, launched in 2021. Credit: Impey/Danehy/University of Arizona
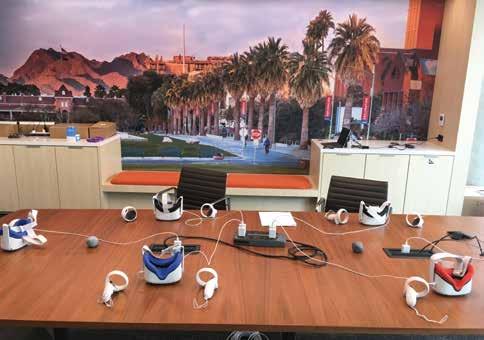
Figure 8. Conference room at the University of Arizona Center for Outreach and Collaboration, in a real-world image, where the virtual exhibit debuted in September 2021. We set up six visitor stations. Credit: University of Arizona
Launch and Next Steps
Development and testing of the virtual exhibit took approximately six months. It debuted in September 2021, during the opening week of the University of Arizona’s Center for Outreach and Collaboration, located in Washington DC, about two blocks from the White House (University of Arizona, 2022). The Center aims to highlight University of Arizona research and let faculty and senior administrators connect with State and Congressional legislators, alumni, donors and potential donors, and representatives of federal funding agencies and foundations. The exhibit was given a dedicated space in the Center for 90 minutes on each of the two first evenings of the opening week (Figure 8). About 150 people were present for each of those evenings. The mix was about 1/3 university faculty, staff, and administrators, 1/3 alumni, and 1/3 members of the general public, including journalists and guests of university employees.
Due to the continuing impact of Covid19, protocols were established to clean and sanitise the VR headsets and game controllers after each use. This was facilitated by the removable face neoprene face shields we purchased for the headsets. The view in each headset was situated at the central entry point of the exhibit to avoid users having to load the app from the Oculus store. Two staff from the Center were there to guide people into the conference room where the hardware was set up and to sanitise headsets and controllers. They also provided simple instructions on how to navigate using the game controllers. Three people acted as “experts” to answer technical questions about any of the space science facilities: the lead author of this article and the Directors of Steward Observatory and the Lunar and Planetary Lab. The second author was also available live online for troubleshooting in case of technical difficulties, however, we did not encounter any.
The dynamic nature of the opening week event, with people moving throughout the Center and not lingering anywhere long, meant it was too challenging to administer surveys or questionnaires. As a result, we only have anecdotal data to evaluate the user experience based on notes the lead author took during the event. An approximate headcount over the two evenings was sixty-five visitors. The average time spent in the exhibit was five minutes, ranging from one to fifteen minutes. People took off the headsets when they had seen enough, not because they were confused or frustrated. There were no complaints about the image quality or responsiveness of the VR. Most people could navigate the exhibit with minimal coaching; for anyone accustomed to video games, it was trivial. Only one person said they felt uncomfortable or disoriented; they removed the headset after a minute. Visitors included a number of UA officials: two members of the Board of Regents, two Vice Presidents, two Deans, and four Department Heads. Spoken comments by visitors to the lead author were overwhelmingly positive. Many affirmed the original motivation behind the VR exhibit: users gained a new sense of surprise and appreciation of the massive scale of modern telescopes. One headset and its controllers remained at the Center for use by anyone who visits the facility.
The next step for the VR exhibit is to deploy it in more controlled settings at the University of Arizona to gather data. It will be used both with student groups and members of the public. There will be installations in the lobby of Steward Observatory and the atrium of the Lunar and Planetary Lab. Discussions are underway for additional installations in the lobby of the UA Flandrau Science Center and Planetarium (Flandrau Science Center and Planetarium, 2022) and the visitor centre of Biosphere 2, located just outside Oracle, Arizona (Biosphere 2, 2022). We will administer short surveys within the virtual space to gather feedback efficiently, and software will be used to track user movements to see which facilities attract the most visits and the longest dwell times (Kloiber et al., 2020). We will also experiment with a VR headset driven by a powerful laptop computer, a setup that will have increased resolution and decreased latency (Viitanen et al., 2018). Our exhibit is freely available at the Oculus Quest app store (https:// vr.as.arizona.edu/telescopes). Finally, the concept of this exhibit is adaptable. With suitable 3D models, and guidance on software, hardware, and the development process, any observatory could develop a tour of their facilities.
Conclusions
Immersive 3D virtual reality has enormous potential for science education and outreach. Frontier astronomical facilities are located in space or at remote observatories, giving the public no
opportunity to appreciate their scale and complexity. We have developed a virtual exhibit using Unreal Engine and Oculus Quest headsets, untethered to any computer and getting their data from the Internet. With modestly priced hardware, it is possible to render large telescopes and space missions in detail. A single engineer built the entire project. He used his computer and a headset we purchased to create the entire experience, including 3D modelling (and optimisation), art asset creation (shaders, materials, and sounds), level creation, and build/ compilation. While the exhibit described here features only facilities with the involvement of the University of Arizona, the same mechanisms could be used to give virtual tours of any observatory. Detailed CAD models must have some of their complexity stripped away to allow the exhibit to compile and give users a high-resolution and seamless experience. Initial experience with the VR exhibit at a University of Arizona outreach event showed that it met its goals of providing an appealing user experience and informing the public about space science tools and research.
References
Akiyama, K., et al. (2019). First M87 Event
Horizon Telescope Results. I. The shadow of the supermassive black hole. The
Astrophysical Journal Letters, 875, L1-L18. https://doi.org/10.3847/2041-8213/ab0ec7 Akiyama, K., et al. (2022). First Sagittarius A*
Event Horizon Telescope results. I. The shadow of the supermassive black hole at the center of the Milky Way. The
Astrophysical Journal Letters, 930, L12-L33. https://doi.org/10.3847/2041-8213/ac6736 Apai, D., Lagerstrom, J., Reid, I. N., Levay, K.
L., Fraser, E., Nota, A., & Henneken, E. (2010). Lessons from a high-impact observatory: the Hubble Space Telescope’s productivity between 1998 and 2008.
Publications of the Astronomical Society of the Pacific, 122, 808-826. https://doi. org/10.1086/654851 Arcand, K. K., Watzke, M., Jiang, E., Sgouros,
T., Price, S., & Edmonds, P. (2018). Walking through an exploded star: rendering supernova remnant Cassiopeia A into Virtual
Reality. CAPjournal, 24, 17-24. https://www. capjournal.org/issues/24/24_17.pdf Baracaglia, E., & Vogt, F. P. A. (2019).
E0102-VR: exploring the scientific potential of Virtual Reality for observational astrophysics. Astron. Comp., 30, 100352. https://doi.org/10.1016/j.ascom.2019.100352 Beichman, C. A., Rieke, M., Eisenstein, D.,
Greene, T. P., Krist, J., McCarthy, D., Meyer,
M., & Stansberry, J. (2012). Science opportunities with the Near-IR Camera (NIRCam) on the James Webb Space
Telescope (JWST). SPIE Proceedings
Volume 8442, Space Telescopes and
Instrumentation 2012: Optical, Infrared, and
Millimeter Wave. https://doi. org/10.1117/12.925447 Bennett, C. A., et al. (2021). A high resolution global basemap of (101955) Bennu. Icarus, 357. https://doi.org/10.1016/j. icarus.2020.113690 Biosphere 2 (2022). University of Arizona, https://biosphere2.org/ Borrow, J., & Harrison, C. (2017). Galaxy makers exhibition: re-Engagement, evaluation, and content legacy through an online component. CAPjournal, 22, 9-13. https://www.capjournal.org/ issues/22/22_09.pdf Çankaya, S. (2019). USE of VR headsets in education: a systematic review study.
Journal of Educational Technology and
Online Learning, 2, 74-88. https://doi. org/10.31681/jetol.518275 Choi, J., Lee, K. K., & Choi, J. (2019).
Determinants of user satisfaction with mobile VR headsets: the human factors approach by the user reviews analysis and product lab testing. Informs Journal of
Computing, 15, 1-9. https://doi.org/10.5392/
IJoC.2019.15.1.001 Crider, A. (2020). Astronomy education in virtual worlds and Virtual Reality. Astronomy
Education, Volume 2: Best Practices for
Online Learning Environments. https://dx. doi.org/10.1088/2514-3433/abb3ddch4 Drummond, K. (2014). The rise and fall and rise of Virtual Reality. The Verge. https:// www.theverge.com/a/virtual-reality/ European Southern Observatory (2022). Virtual
Tours. https://www.eso.org/public/products/ virtualtours/ Fanson, J., et al. (2018). Overview and status of the Giant Magellan Telescope project.
SPIE Proceedings Volume 10700, Ground-
Based and Airborne Telescopes VI. https:// doi.org/10.1117/12.2313340 Feinberg, L. D. (2018). An engineering history of the JWST telescope. SPIE Proceedings
Volume 10698, Optical, Infrared, and
Millimeter Space Telescopes. https://doi. org/10.1117/12.2506183 Ferrand, G., & Warren, D. (2018). Engaging the public with supernova and supernova remnant research using Virtual Reality.
CAPjournal, 24, 25-31. https://doi. org/10.48550/arXiv.1811.01542 Flandrau Science Center and Planetarium (2022). University of Arizona. https:// flandrau.org/ Greengard, S. (2019). Virtual Reality.
Cambridge, MA: MIT Press. Hamieh, S. (2021). On the simulation hypothesis and its implications. Journal of
Modern Physics, 12, 541. https://doi. org/10.4236/jmp.2021.125036 Harris, B. J. (2020). The History of the Future:
Oculus, Facebook, and the Revolution That
Swept Virtual Reality. New York, NY: Dey
Street Books. Hill, J. M., Ashby, D. S., Brynnel, J. G.,
Christou, J. C., Little, J. K., Summers, D. M.,
Veillet, C., & Wagner, R. M. (2014). The
Large Binocular Telescope: binocular all the time. SPIE Proceedings Volume 9145,
Ground-Based and Airborne Telescopes V. https://doi.org/10.1117/12.2055218 Hiramatsu, M., S_Asagiri, Amano, S. G.,
Takanashi, N., Kawagoe, S. K., & Kamegai,
K (2021). Virtual ALMA tour in VRChat: a whole new experience. CAPjournal, 30, 18-27. https://www.capjournal.org/ issues/30/30_18.pdf Hurt, R., Wyatt, R., Subbarao, M., Arcand, K.,
Faherty, J. K., Lee, J., & Lawton, B. (2019).
Making the case for visualization. Astro 2020
White Paper. https://arxiv.org/abs/1907.10181 Jarrett, T. H., et al. (2021). Exploring and interrogating astrophysical data in virtual reality. Astronomy and Computing, 37, 100502. https://doi.org/10.1016/j. ascom.2021.100502 Kalirai, J. (2018). Scientific discovery with the
James Webb Space Telescope.
Contemporary Physics, 59, 251-290. https:// doi.org/10.1080/00107514.2018.1467648 Kent, B. R. (2019). 3D visualization in astrophysics. Astronomical Data Analysis
Software and Systems XXVIII, ASP
Conference Series Vol. 253, 3-12. http:// aspbooks.org/publications/523/003.pdf Kersting, M., Steier, R., & Venville, G. (2020).
Exploring participant engagement during an astrophysics Virtual Reality experience at a science festival. International Journal of
Science Education, Part B, 11, 17-34. https:// doi.org/10.1080/21548455.2020.1857458 Kersting, M., Bondell, J., & Steier, R. (2021).
Reflecting on design principles in the context of Virtual Reality learning experiences in astronomy and science education. Universe, 7. https://doi. org/10.3390/ECU2021-09264
Kiryu, T., & So, R. H. Y. (2007). Sensation of presence and cybersickness in applications of Virtual Reality for advanced rehabilitation.
Journal of Neuro-Engineering and
Rehabilitation, 4, 34. https://doi. org/10.1186/1743-0003-4-34 Kloiber, S., Settgast, V., Schinko, C., Weinzerl,
M., Fritz, J., Schreck, T., & Preiner, R. (2020).
Immersive analysis of user motions in VR applications. The Visual Computer, 36, 19371949. https://doi.org/10.1007/s00371-02001942-1 Lanier, J. (2017). Dawn of the New Everything:
A Journey Through Virtual Reality. London:
The Bodley Head. Lauretta, D. S., et al. (2017). OSIRIS-REx: sample return from asteroid (101955)
Bennu. Space Science Reviews, 212, 925984. https://doi.org/10.1007/s11214-0170405-1 Marsden, C., & Shankar, F. (2020). Using
Unreal Engine to visualize a cosmological volume. Universe, 6, 168. https://doi. org/10.3390/universe6100168 Martin, B., Hill, J., & Kin, D. W. (2016). 30 years of mirror making at the Richard F. Caris
Mirror Lab. in Frontiers in Optics 2016, OSA
Technical Digest, Optical Society of
America. https://doi.org/10.1364/FIO.2016.
FTu2A.1 McEwan, A. S., et al. (2007). Mars
Reconnaissance Orbiter’s High Resolution
Imaging Science Experiment (HiRISE).
Journal of Geophysical Research, 112. https://doi.org/10.1029/2005JE002605 NASA (2022). Museum and Informal Education
Alliance, NASA VR/360 Multimedia for
Planetarium Shows and Informal Education. https://informal.jpl.nasa.gov/museum/360video New Virtual Reality Experience Highlights
NASA’s Webb Space Telescope (2022),
News Wise. https://www.newswise.com/ articles/new-virtual-reality-experiencehighlights-nasa’s-webb-space-telescope Orlando, S., Pillitteri, I., Bocchino, F., Daricello,
L., & Leonardi, L. (2019). 3DMAP-VR: A project to visualize 3-dimensional models of astrophysical phenomena in Virtual Reality.
Research Notes of the AAS, 3, 11. https:// doi.org/10.3847/2515-5172/ab5966 Papachristos, M. N., Vrellis, I., & Mikropoulos,
T. A. (2017). A comparison between Oculus
Rift and a low-cost smartphone VR headset: immersive user experience and learning.
IEEE 17th International Conference on
Advanced Learning Technologies. https:// doi.org/10.1109/ICALT.2017.145 Rabien, S., et al. (2010). ARGOS: the laser guide star system for the LBT. SPIE
Proceedings Volume 7735, Adaptive Optics
Systems II. https://doi.org/10.1117/12.857210 Renno, N. O., et al. (2009). Possible physical and thermodynamical evidence for liquid water at the Phoenix landing site. Journal of
Geophysical Research, 114. https://doi. org/10.1029/2009JE003362 Ricarte, A., & Dexter, J. (2015). The Event
Horizon Telescope: exploring strong gravity and accretion physics. Monthly Notices of the Royal Astronomical Society, 446, 19731987. https://doi.org/10.1093/mnras/stu2128 Rigby, J. et al. (2022). Characterization of
JWST science performance from commissioning. NASA/ESA/CSA. https:// www.stsci.edu/files/live/sites/www/files/ home/jwst/documentation/_documents/ jwst-science-performance-report.pdf Robertson, A. (2022). The ultimate VR headset buyer’s guide. https://www.theverge.com/a/ best-vr-headset-oculus-rift-samsung-gearhtc-vive-virtual-reality Rosenfield, P., Fay, J., Gilchrist, R. K., Cui, C.,
Weigel, A. D., Robitaille, T., Otor, O. J., &
Goodman, A. (2018). AAS WorldWide
Telescope: a seamless, cross-platform, data visualization engine for astronomy research, education, and democratizing data. The
Astrophysical Journal Supplement Series, 236, 22-38. http://doi.org/10.3847/15384365/Aab776 Schneider, G. (2004). Highlights from HST/
NICMOS. Advances in Space Research, 34, 543-552. https://doi.org/10.1016/j. asr.2003.05.033 Shannon, T. (2017). Unreal Engine 4 for Design
Visualization: Developing Stunning
Interactive Visualizations, Animations, and
Renderings. London: Pearson Education. Space Telescope Science Institute (2018).
WebbVR: The James Webb Space
Telescope Virtual Experience. https://store. steampowered.com/app/891960/WebbVR_
The_James_Webb_Space_Telescope_
Virtual_Experience/ Stanton, R. (2022). A Brief History of Video
Games: From Atari to Virtual Reality. London:
Robinson. University of Arizona (2022). Center for
Collaboration and Outreach. https://dc. arizona.edu/ Viitanen, M., Vanne, J., Hamalainen, T. D., &
Kulmala, A. (2018). Low latency edge rendering scheme for interactive 360 degree
Virtual Reality gaming. IEEE 38th
International Conference on Distributed
Computing Systems, 1557-1560. https://doi. org/10.1109/ICDCS.2018.00168 Weinrich, C., Dollinger, N., Kock, S., Schindler,
K., & Traupe, O. (2018). Assessing user experience in Virtual Reality – a comparison of different measurements. Lecture Notes in
Computer Science Volume 10918. Cham,
Switzerland: Springer, 573-589. Williams, G. G., Ortiz, R., Goble, W., & Gibson,
J. D. (2016). The 6.5-m MMT Telescope: status and plans for the future. SPIE
Proceedings Volume 9906, Ground-Based and Airborne Telescopes VI. https://doi. org/10.1117/12.2233777 Zhan, T., Yin, K., Xiong, J., He, Z., & Wu, S.-T. (2020). Augmented Reality and Virtual
Reality displays: perspectives and challenges. iScience, 23. https://doi. org/10.1016/j.isci.2020.101397
Acknowledgements
We acknowledge a grant for Epic Games under their Megagrant program, which paid for the development of this exhibit. Additional support to complete the exhibit and launch it in Washington DC came from the UA President’s Office, the College of Science, the Director of Steward Observatory, and the Director of the Lunar and Planetary Lab. We are grateful to the Computer Support Group at Steward Observatory for the flexibility in managing Alexander Danehy’s workload to allow him to meet a very tight deadline. We are also grateful to Matthew Wenger for help with testing, for giving feedback that helped shape the exhibit’s design, and for providing real-time support during the inaugural event at the DC Center.
Biographies
Chris Impey is a University Distinguished Professor in the Department of Astronomy at Biography the University of Arizona. He does research on active galaxies and observational cosmology, and he has written 230 refereed papers and eight popular books on astronomy. He has won 11 teaching awards and has taught 350,000 adult learners in three massive open online classes, or MOOCs.
Alexander Danehy is a senior web developer and programmer in Steward Observatory at the University of Arizona. He got his B.Sc. in General and Applied Mathematics and Computer Science from the University of Arizona. After graduating, he worked as a Software Developer in the private sector. He has extensive experience in software development, design, and engineering, including DevOps for NASA.


