8 minute read
Project 5 – Energy Logger
In this project you will build a device that can be connected to your personal computer, and it will allow you to draw graphs of energy usage in real time. This will make it easier for you to measure and understand how long it takes to both harvest and consume energy. You will use this device to record some key measurements about the energy you are harvesting, so that the right design decisions can be made in the final project, based on the amount of light you have around you that can be harvested and stored.
Connecting Up
Page 22
Code for the Energy Logger (MakeCode)
The code for this project can be accessed here: https://makecode.microbit.org/_Avq2HMMfp2gp

How it works
The code loops round once per second and takes a reading from the P0 pin. This reading is sent via the serial port, which transfers the data over the USB lead to your computer. A reading will be somewhere between 0 (for 0V) and 1023 (for 3V), and the voltage at the P0 pin will change as the amount of stored charge changes. Button A and Button B are used to turn the output stage of the Solar Store off and on respectively, so that you can switch between charging and discharging. While you are doing this, you are capturing a history trace of the amount of energy stored in the Solar Store. You can use this information to work out how quickly the Solar Store charges and discharges in specific light conditions, and this information will be vital later to correctly configure the final intelligent project.
Page 23
Connecting to Your PC
MakeCode has a useful feature that allows you to stream live data from a micro:bit, and it will draw a live graph of that data. It also allows you to store the same data in a file that can be loaded and analysed in other programs.
Pairing Your micro:bit With MakeCode
To use the graphing feature, you first have to pair your micro:bit with MakeCode. Click on the pair device link on the MakeCode page and follow the on-screen instructions.
Note: If your micro:bit won't pair, you may need to upgrade the firmware stored on its USB interface chip. If so, follow the easy step by step instructions here: https://support.microbit.org/support/solutions/articles/19000019131-upgrade-thefirmware-on-the-micro-bit Finally, click download to micro:bit to flash the code directly to your micro:bit.

Showing the Device Console Graph
Now that your micro:bit is paired, it can send serial data over the USB lead to MakeCode, and you should see a new show console device button.
Press that button and then you should see a live graph of energy data displayed:
Page 24


Capturing Data From a Charge and Discharge Cycle
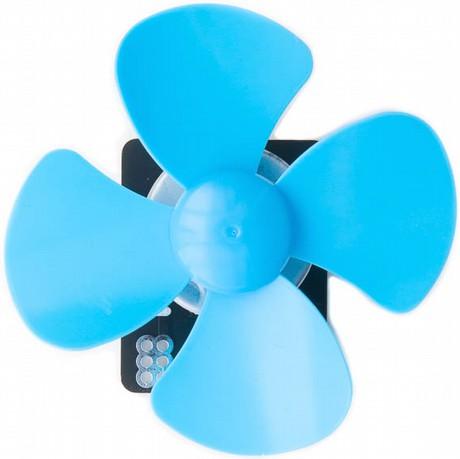
In order to work out the key parameters of your system, you need to do a complete charge and discharge cycle. 1. Charge your system up completely by arranging for the Solar Panel to be near a bright light or in sunlight. As the system charges up you will see the graph line in MakeCode increasing and the number at the top right of the graph will get bigger and bigger before it stops. On our system, the charging stopped at about 800. 2. Now discharge the system totally by pressing button B which turns the fan on, and you will see the graph line slowly decreasing and the number at the bottom right of the graph reducing. On our system, the fan stopped at about 218, but it might vary slightly on your system. 3. Because there might have already been some stored charge in your system when you did step 1, re-do step 1 again to fully charge the system, so you get a really accurate set of readings. You now have a complete data log containing the biggest and smallest stored charge readings (Top of Charge – TOC, and Bottom of Charge – BOC), how long it takes to charge up from your light source, and how long it takes to use all that energy by running the fan.
Downloading Data
To download the data file, first pause the capture so no more new data comes in, by pressing the red button at the top. Then press the little document icon at the far right of the graph to download the data into your normal downloads folder.
Page 25

Getting Data into a Spreadsheet Program
You can now open this file with either LibreOffice or Excel. Let's look at how to do that in LibreOffice, which is a free program that can be downloaded from: https://www.libreoffice.org/ (but the steps in Microsoft Excel will be similar). Open LibreOffice and choose FILE then NEW/SPREADSHEET, then FILE followed by OPEN from the menu. Find the downloaded microbit-data.txt file in your downloads folder. You will be presented with an import dialog, and the data from MakeCode is separated by tab characters, so tick the 'tab' checkbox then press the OK button to import the file.

Analysing the Data
Now that the data file is inside a spreadsheet you can do all sorts of analysis and graphing of it. The key parameters to calculate are the minimum and maximum readings, as these represent the Bottom of Charge (BOC) and Top of Charge (TOC) parameters of your system, which you will need later. You can scroll up and down the data in your spreadsheet to find the maximum and minimum readings. A quicker way might be to use the =MAX() and =MIN() functions of the spreadsheet to calculate these numbers from the range of data in column A for you, like this:
To calculate how long it takes to charge your system, look at the row number of the last reading, then scroll back until the reading is back at its minimum value. Because the program logs data once per second, taking away these two spreadsheet row numbers tells you how many seconds it took to charge. Finally, to calculate how long it takes to discharge your system, collect the row number of the value that was at the lowest value (the end of the discharge cycle), and scroll back until the value is at its highest again (the start of the discharge cycle). Take away these two spreadsheet row numbers, and it will tell you how many seconds it takes to discharge a fully charged system using the fan.
Page 26

Graphing the Data
A picture is always much easier to understand, so you can also use your spreadsheet to draw a graph of the data to help you visualise the charge and discharge cycles. Select column A in the spreadsheet then use INSERT/ CHART from the menu. Choose a line graph without points and press FINISH, and you will see something like this:
In the above graph, you can see a charge cycle, a discharge cycle, and a second charge cycle. In the experiment that we did, it was a bit shady outside the first time it charged, but the sun came out the second time, which is why it took longer for the first charge compared to the second charge.

Results
Parameter
Bottom of Charge reading (BOC)
Top of Charge reading (TOC)
Time from TOC to BOC
Time from BOC to TOC
Value Note
Range 0..1023
Range 0..1023
seconds
seconds
Page 27
Understanding the Data
So, why is all this data important? Remember, the numbers you calculate here will be unique to your environment and lighting conditions. The duty cycle of a system, refers to how long you are charging for, and how long you are discharging for. So a duty cycle of 50% spends half of its time charging, and half of its time discharging. When designing an energy harvesting system, you have to store enough energy in the charge cycle, in order to power your equipment for long enough in the discharge cycle. It is also important to balance the time it takes to charge, against the time it takes to discharge. If it takes 4 hours to charge a system and you can then only use the fan for 2 seconds, that is not a very well designed system. Think back to the garden light project, as long as there are enough sunlight hours in the day to store enough energy and the bulb is low power enough, the garden light will light the garden path for the whole night time. When designing a system, the designer can choose bigger solar panels, a bigger energy store, or a more energy efficient piece of attached equipment that uses the stored energy slower. They can also analyse the timing of the system so that there is always enough time to charge the energy store sufficiently, to power the attached equipment for long enough to be useful, before it can be recharged.
Understanding Duty Cycle
Duty Cycle is a term that describes what percentage of time is spent charging and discharging, and it is important to design a system with the correct duty cycle, so that it always works. If you don't store enough charge in your Solar Store, then your Bulb or fan won't run for long enough. Below is a graph that shows the duty cycle of two different systems:
In the left hand graph the duty cycle is 50%, which means it takes as much time to charge as it does to discharge. In the right hand graph, the duty cycle is 25%, which means it spends 3 quarters of its time charging, and a quarter of its time discharging. Any energy harvesting system can be fine tuned into a well balanced system by changing the rate of harvestable energy, the size of the store, how energy efficient the attached device is, how long it is expected to be charging and how long it is expected to be discharging.
Page 28


