SNAPSHOT


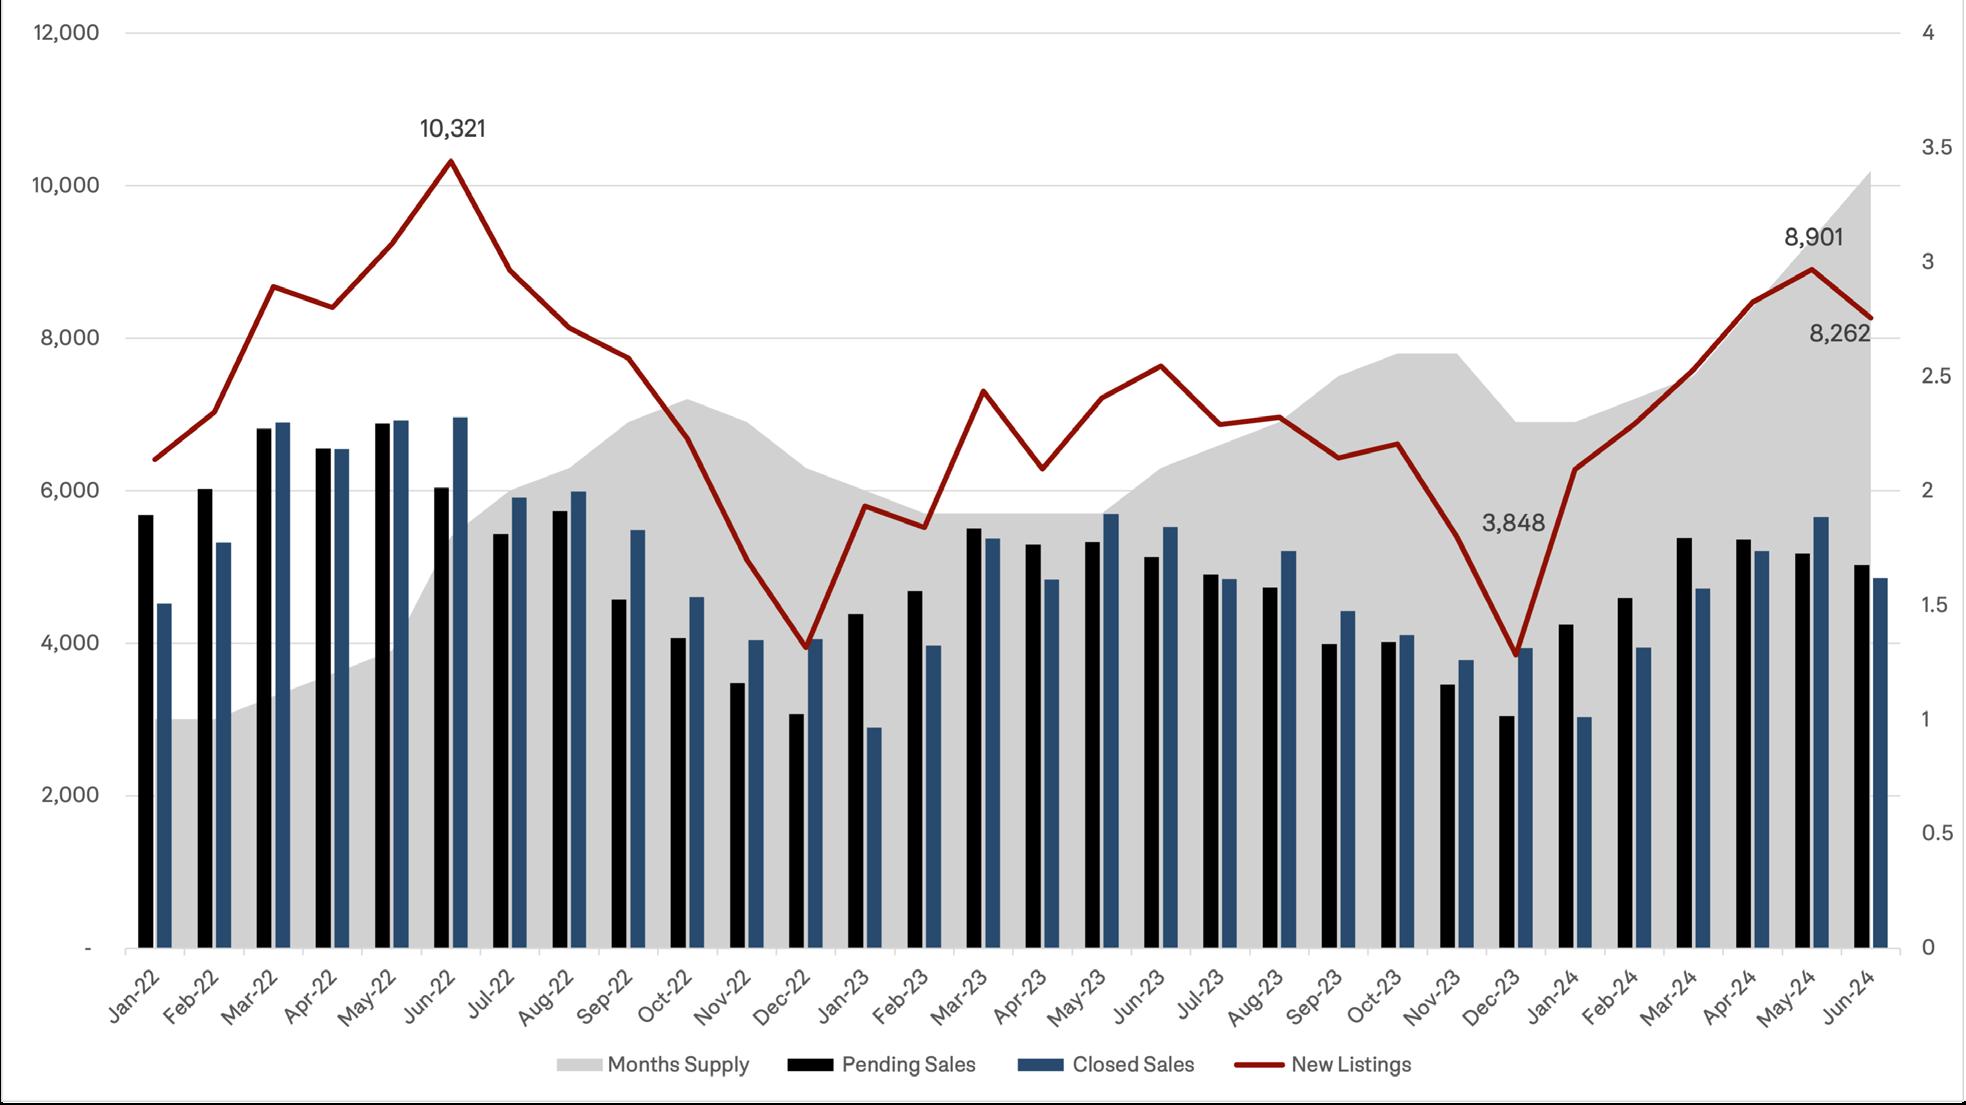
The beginning of Q2 2024 (Q2) marked the end of a brief 2024 Spring Market for Metro-Atlanta. Following substantial improvement in Pending Sales in Q1 2024 (Q1), Closed Sales in Q2 totaled 15,719 or 33.35% higher than Q1. Having reached their peak in March 2024, Pending Sales began to trail in April and for the quarter, were up a modest 11.61% to 15,559. New Listings increased by 24% and Active Listings increased by 26.76%. This increase combined with decreased consumption of inventory led to an inflection point in May where New Listings decreased and Months of Supply (MOS) continued to rise, leading to a 29.27% increase or 3.1 MOS by the end of Q2. Despite a decrease in market activity and increase in MOS, the Average Sale Price in MetroAtlanta rose by 8.57% to $546,842.
While New Listings and Mortgage Interest Rates (MIR) continue to be the main drivers of the market, seasonality became a third component and played a large part in the decrease in activity the MetroAtlanta market experienced in Q2.
Seasonality is not a new phenomenon for our market. Except for the outlier years during COVID, historically, summer seasonality begins in June, marked by a decrease in Pending Sales that continues to trail until December. This year, Pending Sales began their decline early in April. It
is no coincidence that this decline began as Mortgage Interest Rates reached their 2024 high of 7.22% in April. Historical data from the last 24 months has demonstrated the psychological thresholds that consumers have regarding MIR and as reported in our Q1 Market Snapshot, 7% became the new threshold in August 2023. In short, the increase in MIR in the heat of the spring market ushered in an early summer season.
15,719 Homes Sold Q2 2024 at a Glance
$546,842 Average Sale Price
3.1 Months of Inventory
29 Average Days On Market
Source: FMLS InfoSparks, Greater Atlanta Area (Cherokee, Clayton, Cobb, DeKalb, Douglas, Fayette, Forsyth, Fulton, Gwinnett, Henry, and Rockdale Counties) All home types, All price points, Rolling 3-months as of March 2024
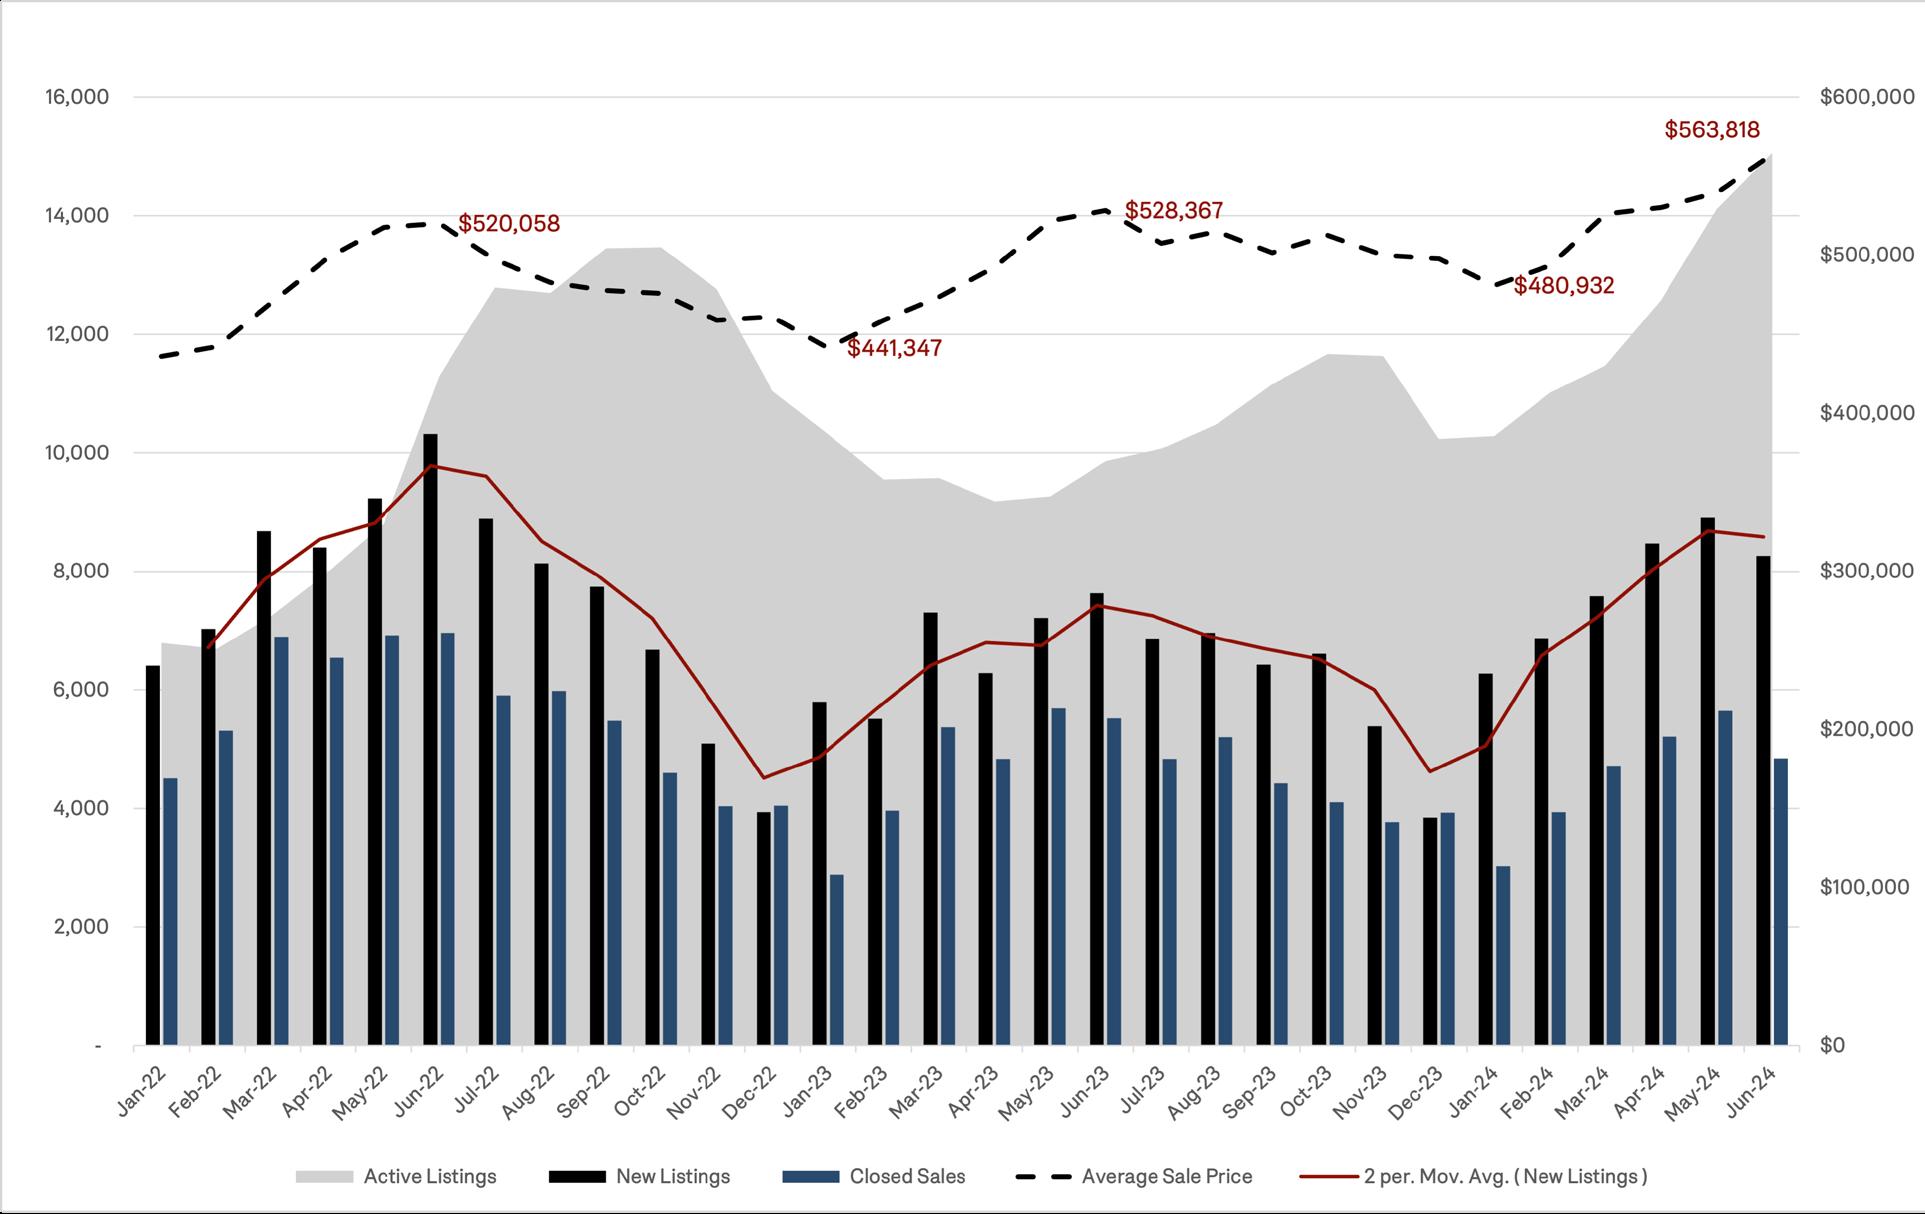
In the past, we have noted the correlation of an increase and decrease in New Listings, MIR and the Average Sale Price. This quarter proved no exception. As demonstrated in the Metro Atlanta New Listings Impact on Average Sale Price graph, as New Listings and Active Listing increased, the Average Sale Price quickly increased from $480,932 in January to $563,816 in June. As demonstrated in the Metro-Atlanta Pending and Closed Sales vs. Interest Rates graph, MIR moderation in January also fueled this rapid increase as Pending Sales rose and peaked in March with MIR crossing the 7% threshold. Based on historical behavior and the fact that MIR peaked at 7.22% in May and New Listings began declining in May, we can expect fewer Pending Sales, Closed Sales and an erosion of the Average Sale Price in Q3 2024.
So, what does this mean for Buyers and Sellers in MetroAtlanta? There are opportunities in every market and this market is no different. As inventory has grown and sellers face increased competition, Buyers are gaining more ability to negotiate terms. If the MIR becomes lower, more buyers will enter the market, competing for the same properties thus lowering their ability to negotiate terms in their favor. Sellers are beginning to face more competition in the market. As inventory increases and Buyers take more time to look at their
options, Sellers will need to adjust their expectations. Sellers should be prepared by ensuring their home is in exceptional condition for their market and must price it appropriately. Understanding that you get one chance in this market to make the best impression on Buyers is paramount. Buyers should be prepared by being fully approved for a loan and, understand all options that are available for use with potential incentives. The data is clear and demonstrates that market timing and realistic expectations of both Buyers and Sellers are more important now than ever for each to reach their real estate goals. Working with a seasoned Real Estate Advisor who can help monitor New Listings, Mortgage Interest Rates and Months of Supply can help either party find the right moment in time to buy or sell.
The rest of this report provides a snapshot of key metrics by home type (single-family homes, townhomes, and condominiums) and submarket, including neighborhoods and cities Inside the Perimeter (ITP) and Outside the Perimeter (OTP).
To learn more about homes selling in your neighborhood or your dream location, reach out to your Engel & Völkers Advisor for more detailed information about trends in your area.

Christa Huffstickler Founder & CEO Engel & Völkers Atlanta

q Down Quarter-Over-Quarter (QOQ) p Up Quarter-Over-Quarter (QOQ)
Source: FMLS InfoSparks, Greater Atlanta Area/City of Atlanta/ITP, All home types, All price points, Rolling 3-months as of June 2024 (Q2 2024 over Q2 2023 change compared to rolling 3-months as of June 2024)
Metro Atlanta Supply Dynamics Summary (January 2022 - June 2024)
Metro Atlanta New Listings Impact on Average Sale Price
Metro Atlanta Pending and Closed Sales vs. Interest Rates (January 2022 - June 2024)
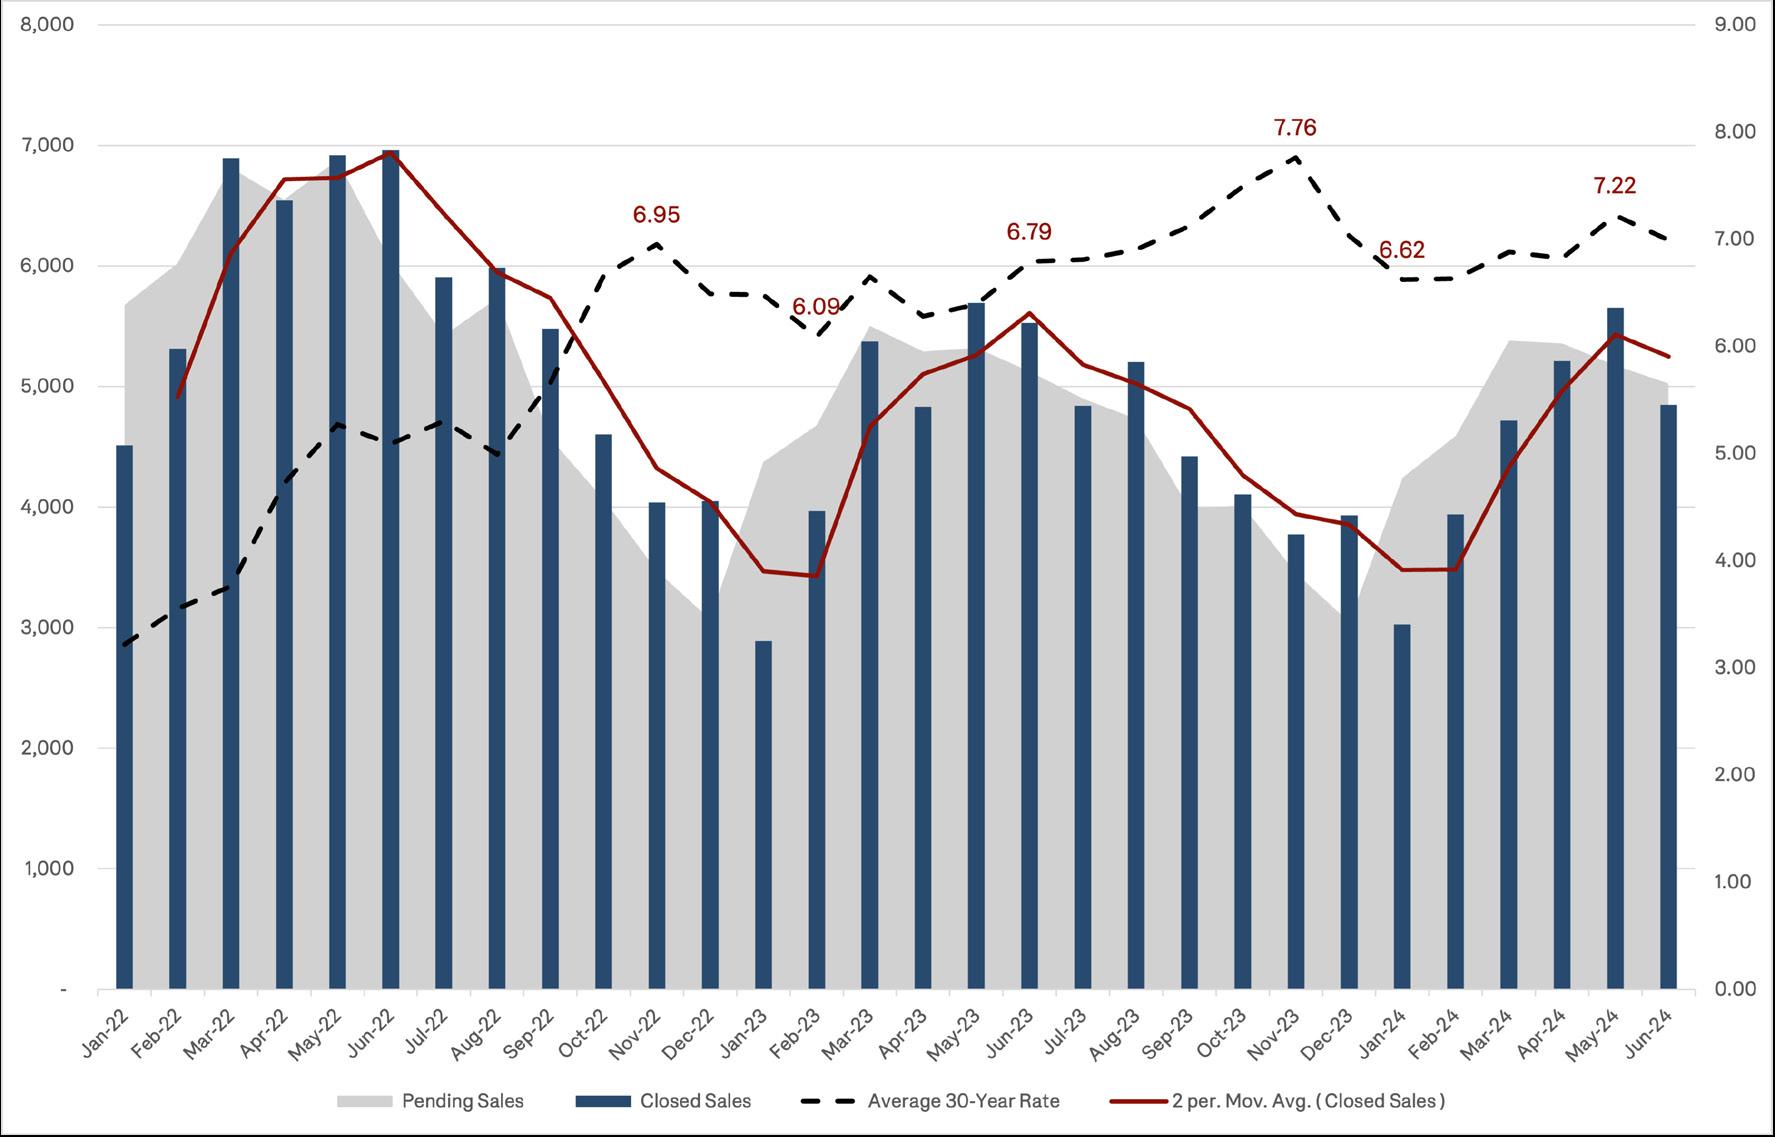
Atlanta Area, All Home Types, January 2022 - June 2024, Freddi Mac, Weekly Mortgage Interest Rates January 2022 - June 2024




$1,417,750




Source: FMLS, InfoSparks, Q2 2024 (4/1/24 to 6/30/24)


Source: FMLS, InfoSparks, Q2 2024 (4/1/24 to 6/30/24)




Source: FMLS, InfoSparks, Q2 2024 (4/1/24 to 6/30/24)




Source: FMLS, InfoSparks, Q2 2024 (4/1/24 to 6/30/24)


Source: FMLS, InfoSparks, Q2 2024 (4/1/24 to 6/30/24)


Source: FMLS, InfoSparks, Q2 2024 (4/1/24 to 6/30/24)





$663,000

Source: FMLS, InfoSparks, Q2 2024 (4/1/24 to 6/30/24)


Source: FMLS, InfoSparks, Q2 2024 (4/1/24 to 6/30/24)


Source: FMLS, InfoSparks, Q2 2024 (4/1/24 to 6/30/24)


Source: FMLS, InfoSparks, Q2 2024 (4/1/24 to 6/30/24)


Source: FMLS, InfoSparks, Q2 2024 (4/1/24 to 6/30/24)


Source: FMLS, InfoSparks, Q2 2024 (4/1/24 to 6/30/24)





Source: FMLS, InfoSparks, Q2 2024 (4/1/24 to 6/30/24)


Source: FMLS, InfoSparks, Q2 2024 (4/1/24 to 6/30/24)





Source: FMLS, InfoSparks, Q2 2024 (4/1/24 to 6/30/24)


Source: FMLS, InfoSparks, Q2 2024 (4/1/24 to 6/30/24)


Source: FMLS, InfoSparks, Q2 2024 (4/1/24 to 6/30/24)







Source: FMLS, InfoSparks, Q2 2024 (4/1/24 to 6/30/24)


Source: FMLS, InfoSparks, Q2 2024 (4/1/24 to 6/30/24)


Source: FMLS, InfoSparks, Q2 2024 (4/1/24 to 6/30/24)


Source: FMLS, InfoSparks, Q2 2024 (4/1/24 to 6/30/24)




Source: FMLS, InfoSparks, Q2 2024 (4/1/24 to 6/30/24)




Source: FMLS, InfoSparks, Q2 2024 (4/1/24 to 6/30/24)


Source: FMLS, InfoSparks, Q2 2024 (4/1/24 to 6/30/24)


Source: FMLS, InfoSparks, Q2 2024 (4/1/24 to 6/30/24)




Source: FMLS, InfoSparks, Q2 2024 (4/1/24 to 6/30/24)




Source: FMLS, InfoSparks, Q2 2024 (4/1/24 to 6/30/24)



Source: FMLS, InfoSparks, Q2 2024 (4/1/24 to 6/30/24)





Source: FMLS, InfoSparks, Q2 2024 (4/1/24 to 6/30/24)





$260,000

Source: FMLS, InfoSparks, Q2 2024 (4/1/24 to 6/30/24)


$409,500

Source: FMLS, InfoSparks, Q2 2024 (4/1/24 to 6/30/24)


$405,000

Source: FMLS, InfoSparks, Q2 2024 (4/1/24 to 6/30/24)


Source: FMLS, InfoSparks, Q2




Source: FMLS, InfoSparks, Q2 2024 (4/1/24 to




$294,125

Source: FMLS, InfoSparks, Q2 2024 (4/1/24 to 6/30/24)


Source: FMLS, InfoSparks, Q2 2024 (4/1/24 to 6/30/24)







Source: FMLS, InfoSparks, Q2 2024 (4/1/24 to 6/30/24)




Source: FMLS, InfoSparks, Q2 2024 (4/1/24 to 6/30/24)


Source: FMLS, InfoSparks, Q2




$230,000

Source: FMLS, InfoSparks, Q2 2024 (4/1/24 to 6/30/24)






$538,950
Source: FMLS, InfoSparks, Q2 2024 (4/1/24 to 6/30/24)






$615,000

Source: FMLS, InfoSparks, Q2 2024 (4/1/24 to 6/30/24)


Source: FMLS, InfoSparks, Q2 2024 (4/1/24 to 6/30/24)


$433,450

Source: FMLS, InfoSparks, Q2 2024 (4/1/24 to 6/30/24)


Source: FMLS, InfoSparks, Q2 2024 (4/1/24 to 6/30/24)


Source: FMLS, InfoSparks, Q2 2024 (4/1/24 to 6/30/24)




Source: FMLS, InfoSparks, Q2 2024 (4/1/24 to 6/30/24)




Source: FMLS, InfoSparks, Q2 2024 (4/1/24 to 6/30/24)






Source: FMLS, InfoSparks, Q2 2024 (4/1/24 to 6/30/24)




Source: FMLS, InfoSparks, Q2 2024 (4/1/24 to 6/30/24)


Source: FMLS, InfoSparks, Q2 2024 (4/1/24 to 6/30/24)


The following key indicators are used throughout this report to describe market trends:

Properties that are currently listed for sale on FMLS. Additional properties may be for sale at any given time— such as for-sale by owner homes or off-market listings— but are not included in the count of “active listings” in this report if they are not in the FMLS database.

New listings are those that have been added to FMLS in a given month. They do not include active listings that were entered in previous months.

Closed sales represent homes that have sold and transactions have been finalized. This indicator tends to lag market trends slightly because properties typically close one to two months after an offer has been accepted and buyers have locked their interest rates.

Pending sales are properties that have accepted an offer from a buyer and is in the due diligence period. The sales transaction has not happened yet. This is a leading indicator because it give us insight into how buyers and sellers are reacting to the most current market conditions.

The sale price is the final amount paid for a home. It is measured as either an average or a median, with the average price tending to be skewed higher by the highest priced homes. It does not reflect seller concessions, such as closing costs that may have been paid.

Days on market (DOM) measures how long it takes from the time a home is listed until the owner signs a contract for the sale of a property. This tends to vary based on the desirability of a given property, market conditions, and season.


The sale price to list price ratio (SP/LP) indicates if a home sold at (100%), above (>100%), or below (<100%) the listed asking price. The sale price to original list price ratio (SP/OLP) compares the sale price to the original asking price, as the current asking price may have reflected price changes.

Months of inventory indicates how long it would likely take to sell currently listed homes, if no new inventory were added. It is measured as a ratio of active listings to homes sold. 5 to 6 months of inventory is considered a balanced market. Less than 6 months supply tends to favor sellers, and more tends to favor buyers.

