34 minute read
INGENIERÍA INVERSA COMO MÉTODO DE INSPECCIÓN
INGENIERÍA INVERSA COMO MÉTODO DE INSPECCIÓN: CASO DE ESTUDIO EN LA INDUSTRIA AERONÁUTICA
Reverse Engineering as an Inspection Method: a Case Study in the Aeronautics Industry
Advertisement
Gustavo Javier Bonilla Lara¹*, Eric Leonardo Huerta Manzanilla¹
¹Universidad Autónoma de Querétaro
Autor de correspondencia *gus_bonilla@hotmail.com
Las empresas manufactureras se encuentran bajo presión para optimizar sus procesos productivos en un marco de tiempo corto debido a los retos constantes del ambiente económico. Sin embargo, algunas industrias, como el sector aeronáutico, no presentan un grado de repetibilidad en sus procesos productivos a tal grado que les permita controlar, medir y mejorar el sistema interno de calidad. La falta de altos volúmenes de producción no permite usar herramientas estándar debido a la carencia de datos iterativos y a la naturaleza manual de los procesos, lo que pospone las mejoras por un largo periodo de tiempo. Por estas razones, herramientas estadísticas que funcionan adecuadamente en otras industrias no pueden aplicarse en ambientes de bajo volumen como lo es la aeronáutica. Esta investigación contribuye con el análisis de diferentes perspectivas sobre cómo aplicar la ingeniería inversa para digitalizar, rediseñar y optimizar los componentes de una superficie 3D. Una nueva metodología es presentada para optimizar el sistema de medición para que contribuya a la obtención de dimensiones precisas de un componente físico. La implementación de un escáner óptico es requerida para capturar los datos, filtrar el ruido y realizar un estudio estadístico para mostrar la eficiencia de la tecnología.
Palabras clave: Ingeniería inversa, aeronáutica, modelación 3D, método de inspección.
ABSTRACT
Manufacturing companies are pushed to optimize their production processes within a short time frame due to the constantly challenging economic environment. However, some industries, such as aeronautics, do not present the degree of repeatability in their production processes to an extent that allows to control, measure, and improve the internal quality system. The lack of high volume production and iterative data, in addition to the manual nature of the processes, does not enable the use of standard methods. Statistical tools that work well in other industries cannot be applied in low volume businesses such as the aeronautics. This paper contributes to the analysis of different perspectives on how to handle the application of reverse engineering to digitalize, redesign, and optimize a component from a 3D surface. A new methodology is presented to optimize the measurement system so that it contributes to the gathering of accurate dimensions of a physical component. The implementation of an optical scanner is required to capture multiple data, filter the noise, and perform a statistical study to show the efficiency of the implemented technology on this aeronautical application.
Keywords: Reverse engineering, aeronautics, 3D modeling, inspection method.
INTRODUCTION
In the last decade, the digitalization of components has provided a significant benefit for some companies in the areas of Reverse Engineering (RE), Re-engineering (ReE), and Virtual Modeling (VM). Generation of 3D models based on a physical object has gained the attention not only from product designers but also from production engineers. This is attributable to the potential applications in the production lines in various domains of the industry. These applications are still being analyzed, and RE has not been fully applied in the production lines because the digitalization process takes a considerable amount of time and the accuracy of the method is still uncertain. The application of reverse engineering in the industrial sector aims to redesign a physical component while using a digitized 3D point cloud [1].
RE is defined as the geometry and dimensions extraction from a physical master sample to build a 3D Computed-Aided Design (CAD) model
[2], [3]. The main objective of RE is to extract accurate information from a physical object to reconstruct a parametric CAD model that is as exact and precise as the masterpiece [4]. All the RE applications pretend to satisfy a range of geometric constraints that are directly related to the physical object —such as parallelism, orthogonality, symmetry, concentricity, and angularity [5]— that can help to understand the real nature of the component. Once the real dimensions are extracted, they are used to create the CAD model that allows the optimization of the production process.
The available literature provides additional definitions of RE. For instance, [6] defines RE as the process to obtain a CAD model derived from a point cloud; this cloud has to be acquired by scanning the part without having any technical specification such as drawings, nor expected dimensions. The acquisition of the data must be made preferably by using high-precision technology to eliminate noise that affects the point cloud. According to [6], there are 2 methods to reconstruct the model: surface fitting, the method that uses the boundaries of the cloud; and model reconstruction, this last one checks the dimensions of the cloud in all the surfaces to reconstruct a high-quality surface.
In some cases, the digitalization process can be complicated because the obtained model can often be noisy and some data can be lost [1] due to many reasons. As [7] and [8] stated: the digitalization of any object is efficient if the surface is integrated with a limited amount of points without losing its definition [7] and the real nature of the piece. The correct technology and methodology selection is essential to obtain a consistent digital model. Inaccuracies might occur during the digitalization process due to the data acquisition method, type of technology, algorithms, segmentation, and noise removal process [5]. All these factors contribute systematically to the final 3D model to optimize the response variables that are under analysis: (1) total time spent in obtaining the 3D model (scanning + processing), (2) accuracy of the final model, (3) difficulty to remove the noise, (4) capacity to use this technique as an inspection method, and (5) possibility to use the CAD model to redesign the production process [9]. This scenario is one of the reasons why reverse engineering is still a challenging methodology for the industrial sector.
There are many important reasons to start using RE in different stages of the product–process development procedure in an industrial environment. When the 3D model of the object under analysis does not exist, and the CAD model is not available, RE is essential to recreate the surface model [10], which is to be used as a physical reference. The nominal dimensions of the object are extracted to have a performance comparison based on the original specifications stated in the drawings. In other words, all the physical tolerances are obtained via RE to construct the CAD model to use it as a real 3D reference instead of only having a 2D drawing. An additional application of RE is to start using this methodology as an inspection method, making sure that the technology is efficient, reliable, and it reconstructs the surface with the required precision. The primary purpose of any inspection method is determining the real deviation of a product from a set of defined specifications [11], and RE is an excellent opportunity to achieve this.
This paper describes a methodology to perform RE on an aluminum component whose shape is irregular. This part belongs to the aeronautical industry, and currently, it is in serial production following manual operations along the whole manufacturing chain. Due to the manual processes, most of the dimensions have considerable variation among each of the parts, creating the effect of having a production process out of
control. Moreover, the current measurement methods such as calipers, go-no-go, and rulers are not accurate, and it is impossible to know if the parts are OK or Not-OK with physical measurements. The reason to digitalize this part is that the 3D CAD model of the object is not available, having a 2D drawing as a unique reference; therefore, the main objective of this paper is to digitalize this component to obtain the 3D CAD model by using RE to optimize the manufacturing concept.
The 3D model is used to redesign the production process and start manufacturing the part via Computer Numerical Control (CNC) and using the 3D scanner as an inspection method by comparing the parts against the digital masterpieces obtained via RE. Capability analysis is performed to compare the current situation against the new method proposed in this paper. State of the art for this technology is to solve a specific problem, currently happening in an industrial environment. The purpose of this paper is to demonstrate the hypothesis that RE can be used as an inspection method by obtaining a 3D CAD model and using it as a masterpiece to measure, compare, and create statistical analysis to understand the natural variation of the current production process.
SPECIFIC OBJECTIVES
• Applying the state-of-the-art Reverse Engineering into the Aeronautics industry to solve a specific problem caused by the geometrical variation of a component.
• Obtaining the 3D CAD model of 4 production parts by extracting the point clouds of a masterpiece.
• Digitalizing 120 production parts to compare them against the obtained CAD model. • Understanding the real geometric variation among the serial production parts to take the corresponding actions to control the production system.
• Performing statistical analysis of the parts to understand where the variation is being originated.
LITERATURE REVIEW
The literature describing RE is vast, and many studies have been performed around Reverse Engineering (RE) in the last decades due to all the advantages that this technology provides to many scientific and industrial domains. According to [12], the automotive industry needs to quickly determine if the part is dimensionally under specification due to quality requirements. However, the traditional methods such as Coordinate Measurement Machines (CMM) get the precision of the part but not the correct time frame due to its long time-consuming method.
According to the literature, there are many applications of Reverse Engineering. The authors [2] define RE as the redesign of a product whether the product is destroyed, disassembled, analyzed, or tested to improve its functionality, form, or physical characteristics. This statement means that the process starts with a physical object and goes through all the product developing steps until achieving the specifications of the product; that means, in the opposite way [13].
The most used approach of RE is the reconstruction of a CAD model by extracting the real dimensions, geometry, and shape of a physical object. The definition of shape might be confusing based on the perspective; however, the one that this paper used is defined by authors [2]: geometrical information that describes the scale, dimensions, angles, and surfaces of any object. This last sentence means all the required characteristics to reconstruct the selected object.
Available methods include point cloud inspection shown in [11], whose primary goal is to compare an object with the design model by using the ICP (iterative closest point). This last research creates a technique to calculate the deviation between the point cloud obtained via laser scanner and the original model. Although they showed that there is a significant statistical deviation between object-model, they concluded that this deviation is reduced by increasing the point density of the scanning.
On the other hand, introducing a structured light scanning method to build a point cloud that is then processed as mesh and therefore compared with the original CAD model might be useful [14]. The idea behind this research was to construct a cost-effective solution for companies that cannot afford a high-tech scanning option. While developing this low-cost method, the repeatability of the scanning procedures has been successfully proven. The authors demonstrated that adimensional verification is possible when using optical acquisition systems, acquiring reliable information to create a quality inspection method.
The idea behind this study was to adopt optical technology to verify the correct geometry of a part, verifying the fit, form, and function of the part. In other words, to stop using traditional contact measurement techniques to inspect a component.
INDUSTRIAL CONTEXT
Regular engineering compared to reverse engineering
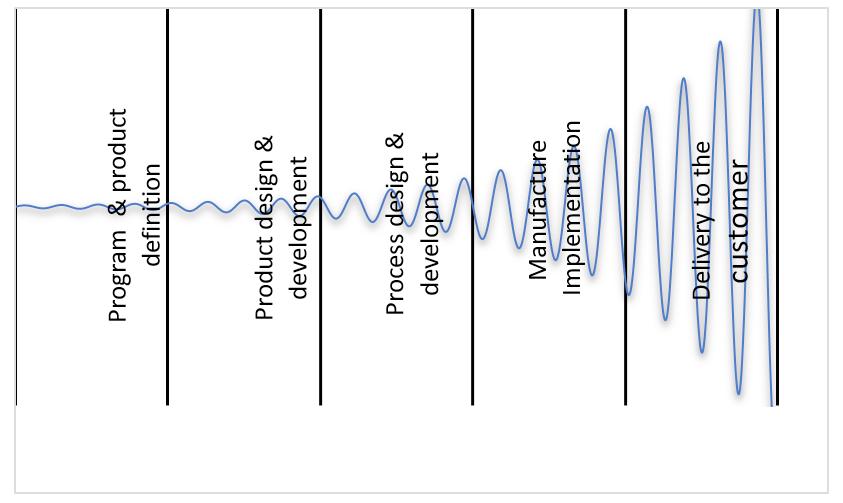
Trying to understand a manufacturing production system by just seeing the working stations at the factory is like trying to understand a living body by just looking at its skin. To comprehend the manufacturing concept of any production plant, it is necessary to go beyond its apparent processes and analyze the information deployment starting from the customer’s needs, product definition, product design, manufacturing concept strategy, and the implementation of quality tools throughout the supply chain. Any perspective not considered during the design phase of either the product or the process creates a bullwhip effect at the production plant as it is shown in Fig 1. The purpose of engineering tools such as Advanced Product Quality Planning (APQP) and Quality Function Deployment (QFD) is to link the customer’s needs and expectations to the conceptualization of the product and production process. This situation means that the normal engineering process looks to guide the design, manufacturing, and production by cascading the customer’s needs throughout the whole production chain.
Figure 1. Representation of the effort needed to implement changes through the product development phases.
A thriving manufacturing environment is the one that creates the requirements for high quality as early as the concept definition stage of the product. Creating a product and process description with constraints based on the customer’s expectations is less costly than changing a product that is already in the production phase, or still worse, that is already being delivered to the customer. A problem that might cost some dollars during the definition phase costs thousands or millions to fix during the manufacturing phase as is represented in Fig. 2. The product must
be fully designed and developed when the production experts are envisioning the process. All the tolerances, dimensions, specifications, and constraints must be unequivocal in such a way that there is no doubt of what is being expected to be produced. These tolerances must be defined at the correct timing; otherwise, modifying the whole manufacturing concept when there is the constraint to deliver parts to the customer is going to be an expensive and tough challenge.
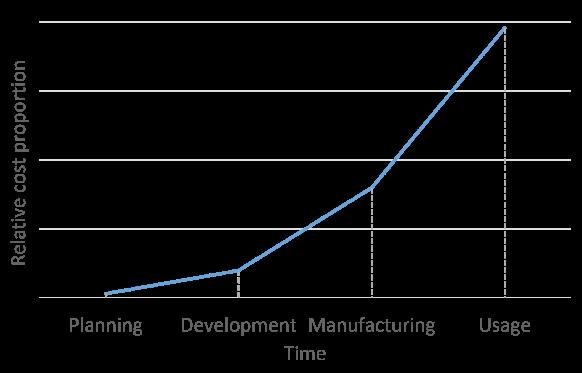
Figure 2. Representation of cost proportion needed to implement changes along with the production phases.
There are specific tools used by many sectors that are well known —and they have successful implementation cases in several industries— such as Quality Function Deployment (QFD) and Advanced Product Quality Planning (APQP). As mentioned before, the primary purpose of them is to deploy the customer’s needs along the production chain to gain the customer’s satisfaction. Many steps depend on the company and the complexity of the product, but most of them follow the standard engineering procedures. However, when some steps are omitted during the product-process conceptualization, and the product is under production, the engineering team must implement another kind of tools. The re-definition of the product must start from the high level of variation in the production floor to follow a reverse engineering procedure to re-design the production concept and extract the real dimensions, tolerances, and specifications of the product that the customer is expecting. In other words, the application of RE to refine the production method and the product itself.
Raw material
The method proposed in this paper is based on the application of RE to digitalize an aerospace component made from a metal sheet of wrought aluminum alloys, classified in the aerospace industry as the commercial part number LN9073. The thickness of the aluminum is 1mm, allowing the manipulation of the material to get the final form through the current production process, which will be explained in the following section. This material has been under serial production for a couple of decades; however, the production line was transferred from Europe to Latin America, where this research is taking place. Due to the internal policies of the company, further information cannot be disclosed, but enough information is described so that any person can replicate this methodology in case of experiencing a similar situation than the one observed in this company.
Current production process
The component to be analyzed throughout this research is currently under serial production to satisfy the demand of the commercial aircraft manufacturing industry. In Fig. 3 a photograph of the component is shown. The demand of the customer cannot be fulfilled, and the non-quality cost is high and increasing due to the vast dimensional variation of this component. This variation is coming from different sources, and some root causes had been identified but are impossible to control with the current production methods. The 3D model of the product was not available, and the 2D drawings are not detailed enough to clearly show the expected dimensions and tolerances. Subsequently, the DFMEA was not created, leaving behind all the risks that might occur if the tolerances are not met. These two problems impact on the manufacturing concept definition because the jigs, tools, and machines do not have the correct 15
dimensions to produce a part under specification, or in some cases the tooling is worn. Additionally, the production process is based on a manual operational system. The final effect of this is a non-capable production system that creates massive variation among all the parts. Every part that is being produced is entirely different, and a standardization method does not exist.
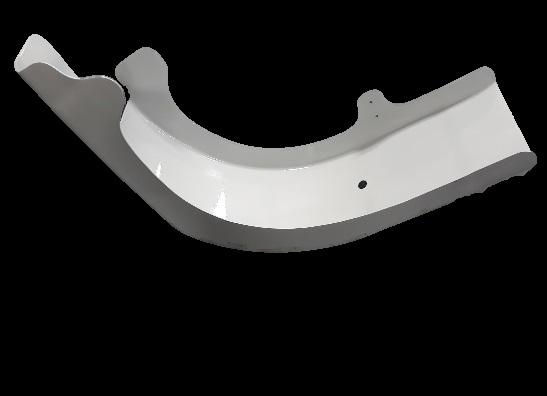
Figure 3. Aeronautical component under analysis.
The whole production process can be seen in Fig. 4, and it is explained as follows:
A metal aluminum sheet arrives at the plant where it is cut in a portal milling machine to have a specific and smaller shape making it easier for manipulation. The aluminum is heated for 2 hours to reach a temperature of 430 °C, and it follows a gradient down at a rate of 30 °C per hour. Then the material comes to a pressing machine where 200 KN press the part against a tooling to create the specific radius similar to the expected shape. To achieve the fine-tuning of the shape and radius, the operators use some hammers and hit the parts manually until it acquires the form of the jig. A hand-operated marking and cutting process follows, where the operator must draw the form of the component manually while using a jig and a marker and cuts the part by using a pneumatic moto-tool until it approximately achieves the final form of the part. The mechanical process arrives at an end where the component is adjusted manually throughout a conformal process. A considerable amount of failure modes happens repetitively due to the high likelihood of occurrence during production.
Figure 4. The Production process of the component under analysis.
To make sure that the product has the correct length, radius, and dimensions stated in the drawings, the quality team inspects 100 % of the parts with the use of manual measuring tools. Continuous variable instruments are used to examine specific dimensions; however, the production is irregular, and the repeatability and reproducibility (R&R) of the measurement is low. In some other cases, go-no-go attributes are responsible for determining if the part is under or out of specification; nevertheless, there is a lack of standardization within the inspection method among the quality members. For all these reasons, the measuring techniques are not robust enough to guarantee the specified part dimensions, creating type I errors (false positive) and type II errors (false negative) as part of the daily problems in the production line. Consequently, the failures detection method is not holding the not-OK parts at the early production stages.
The part is sent to an artificial aging, galvanic treatment, and painting processes, which are irrelevant to this study due to the scope of this research. Finally, the component arrives at the assembly production line where it is assembled with some other components. At this final stage of production, all the problems emerge because, in some cases, the different components cannot be assembled due to the incorrect dimensions of the components. Non-quality costs such as reworks, rejects, scrap, defects, and customer complaints are the only constant in this production environment. It is crucial to keep in mind that the root cause of the problem occurs at the early stages, but it is visible in the final assembly lines.
The lead time of the whole manufacturing process takes more than two weeks, making it very difficult to see the correlation between cause and effect and shifting the control gain to a long-time scale.
MATERIALS AND METHODS
Materials and Softwares
In this study an optical portable 3D scanner Handyscan 700 is used to obtain the surface points of the components. The Handyscan 700 is a versatile 3D scanner that uses dynamic referencing by cause of the optical reflectors that create a locked reference system, allowing the user to move the scanner around the part.It incorporates two cameras that capture 60 frames/s and 7 laser crosses with an additional cross for the hard to reach zones. One of the benefits of this technology is that it allows real-time visualization of the part in the computer, creating an automatic point mesh output that can be exported in different formats such as .dae, .stl, and .obj. The technical specifications of the Portable 3D Handyscan are listed next:
• Accuracy – 0.020mm + 0.060mm
• Measurement rate – 480,000 measurements per second
• Maximum resolution – 0.20mm
It is essential to use specialized software that can transfer the dimensions and coordinates of the real object into a point cloud that can simulate the 3D characteristics within a digital environment. The software VXelements is used to digitalize the physical part and extract the point clouds, and PolyWorks is used to create the planes, dimensions, and comparisons among meshes. The experimentation is performed thanks to the many tools that PolyWorks offers to the market.
Methodology
This research is divided into two different stages:
1. Application of RE in a real production environment to acquire the 3D model of 4 pieces based on the known specifications and drawings.
2. Using the 3D model to understand the statistical variation of the current production system by digitalizing 120 parts and comparing them against the obtained model.
It is important to remember that the main objective of this paper is to apply RE in a real production environment to optimize manual operations while trying to obtain a new production system. The digitalization of the part it is crucial to obtain a 3D model that is going to be used as the masterpiece. However, the focus of the paper is not based on the algorithm to digitalize the parts; on the contrary, it is based on the methodology to use reverse engineering as an inspection method. The method extracts the real dimensions of a masterpiece with the 3D scanner described
in the previous section. Once that the point cloud is obtained, the 3D solid is generated to use it as a reference to redefine the whole production process. The proposed method is divided into eight steps as shown in figure 5.
Resolution selection
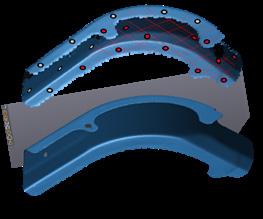
The first step of this research is configuring the scanner and selecting the correct parameters in the software. The independent variable is the resolution of the scanner (X1) and the variables under analysis are the border edge accuracy (Y1), scanning noise (Y2), and file extension (Y3) as it can be seen in Table 1. All these variables are taken as attributes depending on the obtained results. As can be seen in Fig. 6, the best resolution (X1) is 0.35mm; therefore, this configuration is used in the whole scanning process. Components digitalization
One of the most critical steps of this research is the digitalization of the components that were under analysis. An assortment of 120 components was selected from the regular production at the first stage in the assembly line.
These parts were randomly selected over almost 3 months to determine the normal variation of the production process over a considerable time frame; meaning that several batches were considered, avoiding a tendency to select only good or bad parts. To digitalize the parts, they must be prepared by attaching some positioning targets as shown in Fig. 7.
These targets help to maintain the reference of the scanner so that it can create a
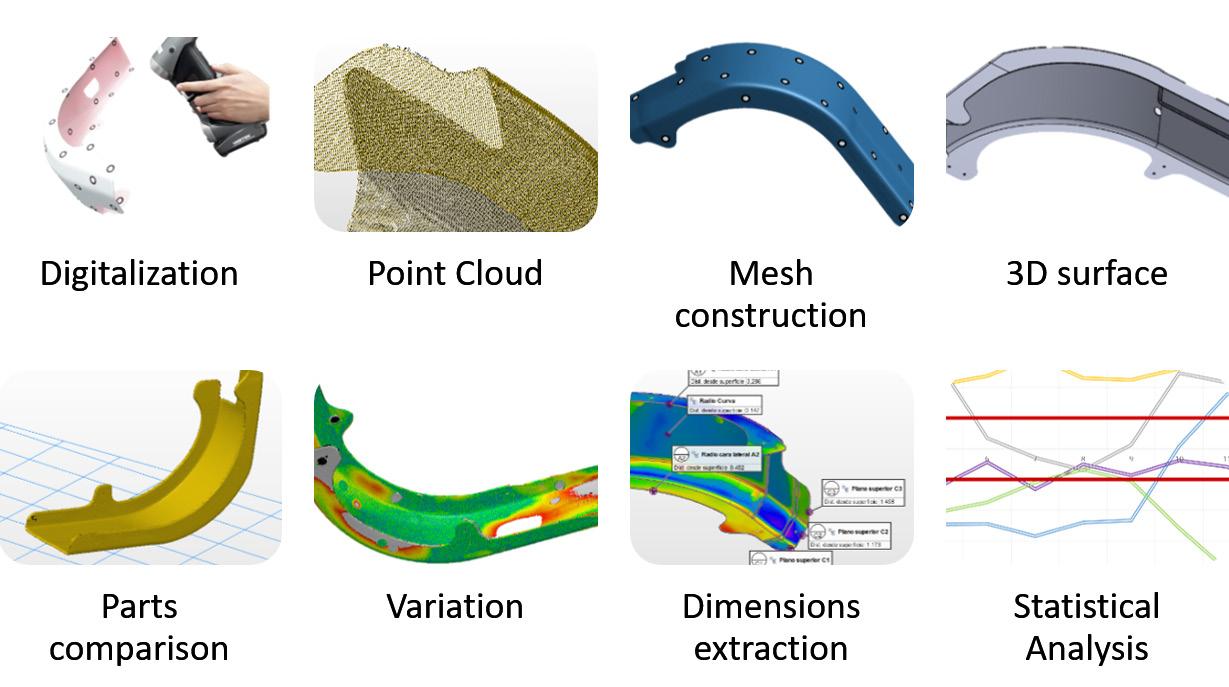
Figure 5. Methodology to obtain all the critical dimensions of the components to perform statistical analysis.
Table 1. Dependent variables (Y1, Y2, Y3) in function of the scanner resolution (X1).
Resolution (X1) Border edge accuracy (Y1) Scanning noise (Y2) File extension (Y3)
3.0 mm
1.0 mm
0.7 mm
0.35 mm
0.20 mm
Figure 6. Scans comparison generated with 3.00 mm and 0.35 mm of resolution.
cloud of points that is statistically equal to the physical part.
This means that the component is digitalized by creating a set of reference points that keep the real dimensions of the component.
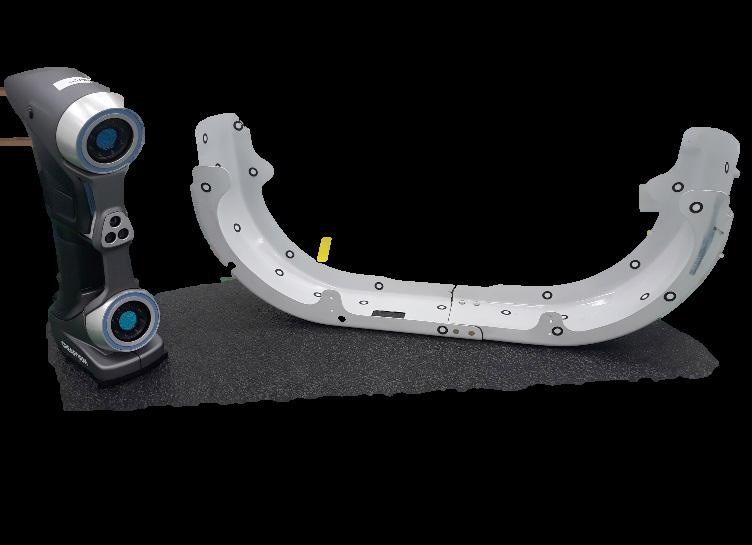
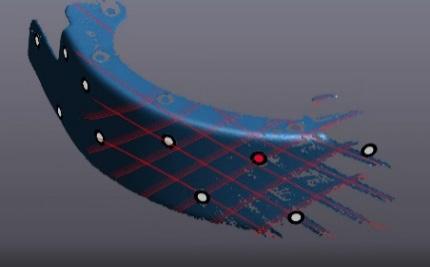
Figure 7. Scanning process to obtain the point clouds. Positioning targets are attached to the component as reference points for the scanner. Repeatability and Reproducibility study (R&R)
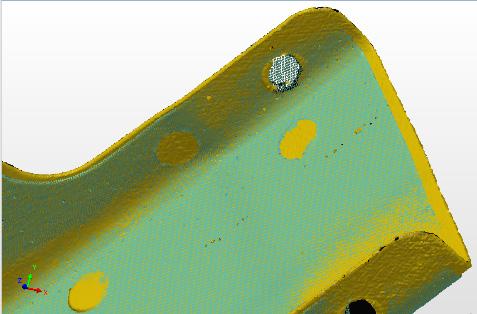
It is essential to validate that the technology used in this paper can measure the part with the respective accuracy to guarantee that the measuring variation is not statistically significant for the experiment. To achieve this, one part was selected to be measured under constant circumstances (shutter velocity = 60 ms, resolution = 0.35 mm); 5 replications of the same part (n=5) were obtained. These measurements can be considered as replication and not duplicates because the scanner was shut down and calibrated every time a new measurement started. Since the same part is being compared to itself, the variation is just coming from the measurement system. In other words, the validation of the resolution of the scanner is analyzed while the measurement error is compared. In Fig. 8, we can see a color mesh comparison between the 5 replications, observing that the variation is not representative.
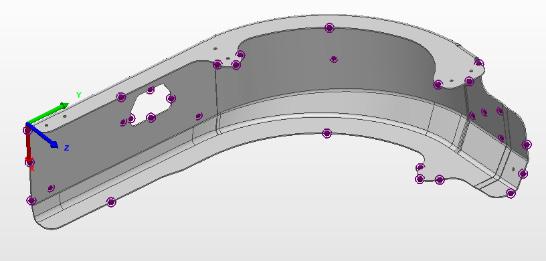
Based on the recurring dimensional problems that happen at the production line, and on the specification drawings, some critical characteristics were chosen to be monitored during this research. To achieve this, reference targets were attached to the 3D model to know the delta between the model and the point clouds that were digitalized in the previous sections. These references are the purple points shown in Fig. 9. The software extracts the standard dimensions from the 3D surface to the point cloud, obtaining the real dimensions of the mesh. However, both the 3D model and the mesh must be perfectly aligned; therefore, a coordinate system must be attached to the 3D model. Depending on the part to be analyzed, a set of 35 points were selected as variables along with the experiment. An example of this comparison is shown in Fig. 9 to represent the delta of dimensions between the 3D model and the digitalized part. The most important part of this research is obtaining the 35 critical characteristics specified in the previous section. This must be performed over the 120 digitalized parts under analysis. To give a clear idea of what this effort means, it takes approximately 20 minutes per part to obtain its dimensions; therefore, it took more than 40 hours to get the whole data. The sequence to obtain the data goes as follows: 1) Importing the 3D model. 2) Attaching a coordinate system to the model. 3) Setting the reference targets to the critical characteristics of the part. 4) Importing the point cloud. 5) Aligning the mesh to the model by several iterations until they converge. 6) Extracting the deltas of the mesh against the model. 7) Creating a color map to see the deviations visually. 8) Creating a database with all these values.
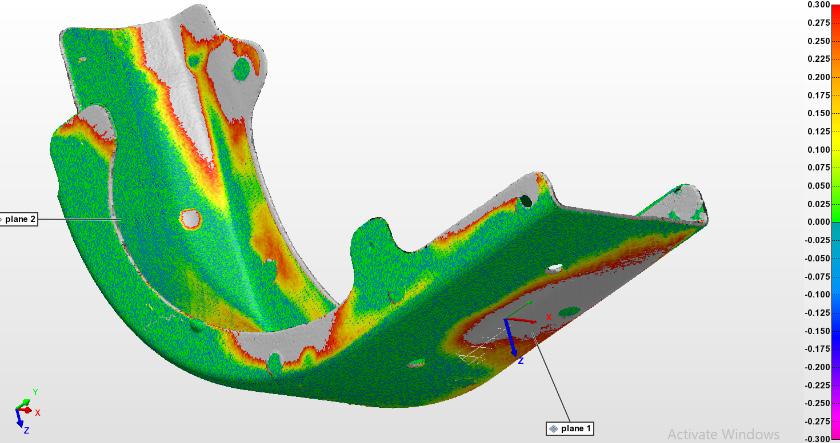
Figure 8. Color-coded error map comparing the same part through different scanning replicates to compare the measurement error of the scanner.
Figure 9. Reference targets whose deviation are extracted to measure all the 120 scanned parts. The delta between the 3D model and the point clouds are visible.
As specified before, the analysis is done over 4 aeronautical components and 2 sub-assemblies. All the critical dimensions were extracted, knowing that the current tolerance is ± 1.0 mm in every side of the component.
RESULTS
A sample of 15 pieces was carefully chosen from the production line to obtain the physical dimensions in a digital environment. Each of these 15 parts was stated as an OK raw material in the production line because they were measured manually with a digital caliper before the analysis. Using the experience from the final production line by analyzing the failure modes that constantly happen and whose root causes had not been found yet, 10 key critical characteristics were selected. These 10 characteristics are stated with the corresponding dimensions and tolerances in the 2D engineering drawing, having a maximum tolerance of ± 1.0 mm. To understand the current quality situation of these parts, it is essential to develop a capability study that can show if the process is in or out of control. This factor depends on the variation and the number of defects per million opportunities (PPM’s) that the current process can produce. In Fig. 10 a control graph shows a set of values coming only from 5 out of these 10 characteristics previously selected. The reason for doing this is that further analysis was made with the characteristics under control. By making the analysis of these 5 characteristics, it is evident that the process is out of control. Most of the values are completely out of the specification range, and therefore, this creates vast variation in the production environment. To statistically prove this hypothesis, a capability analysis was made by using Eq. 1; the results are presented in Table 2. Because all Cp and Cpk are << 1.33, it is possible to conclude that the process is out of statistical control, presenting enormous variation in the production line. In other words, every single part that is being produced is statistically different from the rest of them; making it impossible to predict the dimensions of the subsequent parts. Formulas to perform a capability study. Cp and Cpk are the necessary parameters to know if a process is under statistical control.
The following 5 critical characteristics come from the lateral plane of the component. The-
(1)
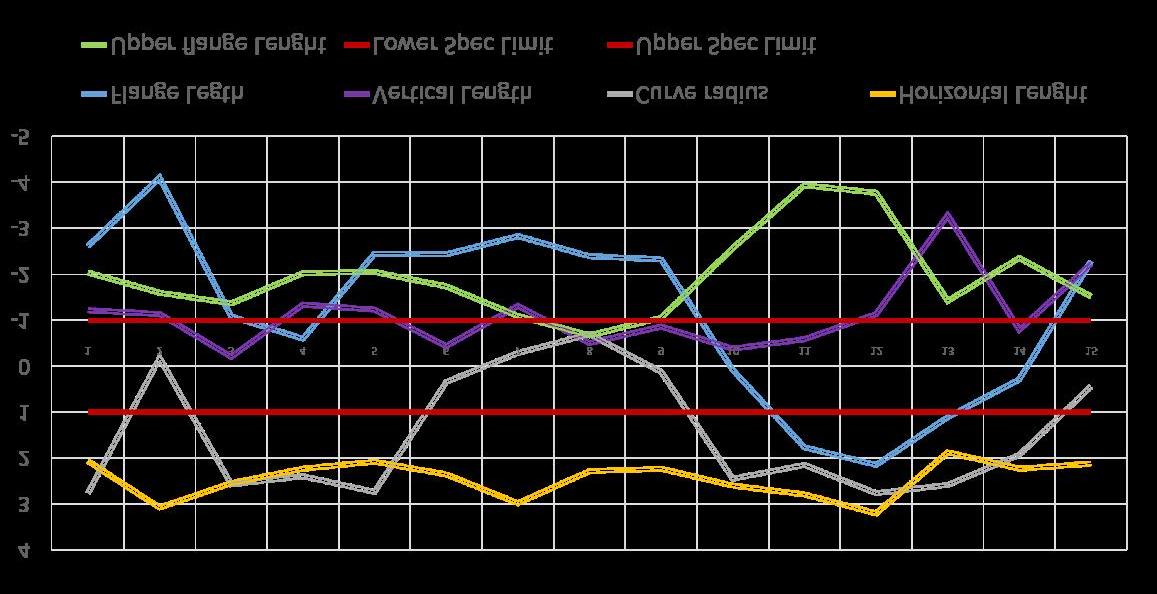
Figure 10. Control chart showing the dimensions of 5 critical characteristics through a sample of 15 pieces. The upper and lower limits are shown with the tolerance of ± 1.00mm.
se dimensions are crucial because they determine the total length of that curve. In case these dimensions are out of specification, it would create problems whenever the assembly process starts because the part will not fit between the other components. To be clear, these 5 points are shown in Fig. 11 as purple points. Additionally, a capability analysis was also made to understand the statistical variation coming from these points. A control graph is shown in Fig. 12, where it is possible to see that the process seems to be under control. Although the data seems to have a tendency towards the upper specification limit, the process is under control since it repeats the values, as shown with the Cp and Cpk in Table 3 because all the Cp are >> 1.33. Although these last characteristics are under statistical control when analyzing the individual components, a problem arises when the same points are studied while the subassemblies are manufactured.
The hypothesis is that these dimensions are modified by the operators when they assemble the two curves together. As it can be seen in Fig. 13 where a color map is shown, the delta between the 3D solid and the point clouds arises significantly when the subassembly is manufactured.
The color map shows a massive dimensional change between the single component and the subassemblies in this area of the curve. To prove this, the hypothesis is that the dimensions of the single component are statistically equal to the dimensions of the subassembly ; therefore, the following statement is analyzed:
Hypothesis testing to compare statistically two samples before and after the assembly process.
(2)
Table 2. Capability study showing the Cp and Cpk of the 5 critical characteristics of the components.
Flange Length Vertical Length Radius Horizontal Length Upper flange length
Cp 0.17729 0.42299 0.25155 .82455 0.36022
Cpk -0.03172 -0.04475 -0.11920 -1.19159 -0.34065
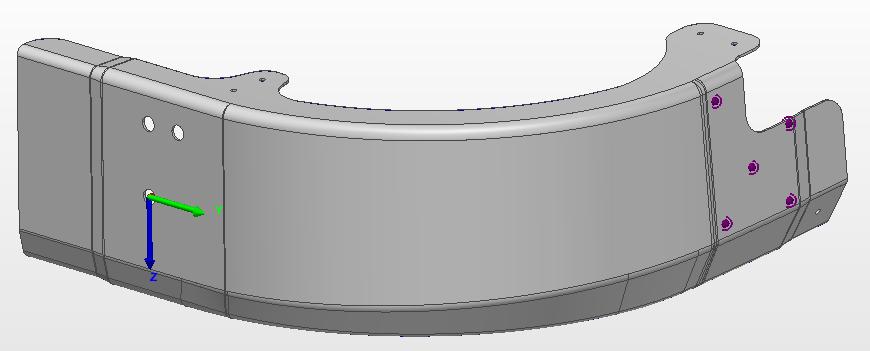
Figure 11. Critical dimensional points on the lateral plane of the component.
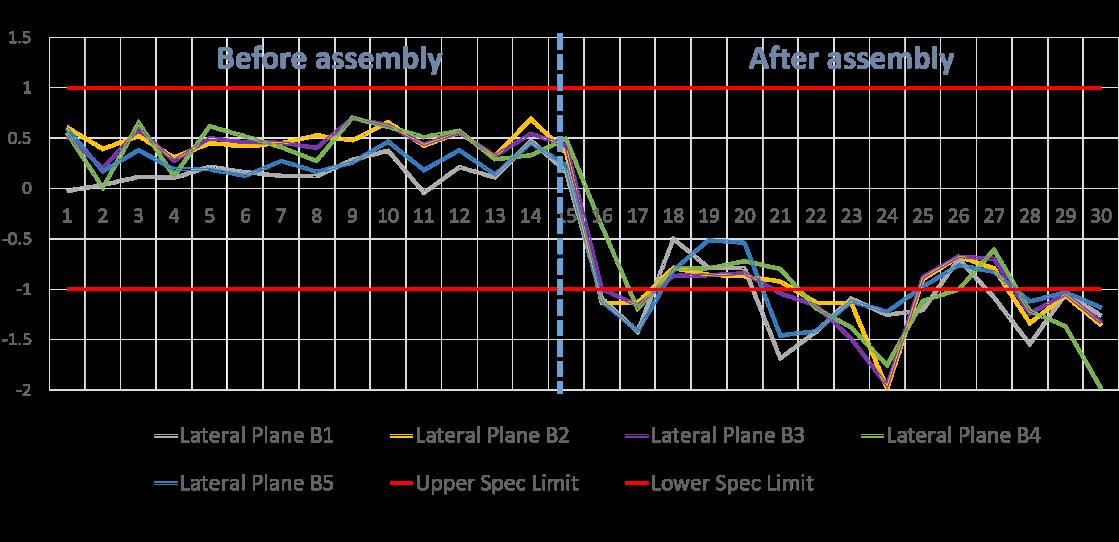
Figure 12. Control chart showing the variation of 5 critical characteristics on the lateral plane through a sample of 15 pieces. Study performed before the assembly process. Table 3. Capability study showing the Cp and Cpk of the 5 critical characteristics on the lateral plane before the assembly process.
Figure 13. Color-coded map comparing the deltas between the 3D model and the point cloud. Left picture performed before the assembly process. Right picture after the assembly.
Figure 14. Control chart showing the variation of 5 critical characteristics on the lateral plane through a sample of 15 pieces before the assembly process and 15 parts after assembly.
Cp
Cpk Lateral Plane B1 Lateral Plane B2 Lateral Plane B3 Lateral Plane B4 Lateral Plane B5
2.40323 2.87495 2.50666 1.65325 2.34582
2.01070 1.50025 1.33570 0.91793 1.68696
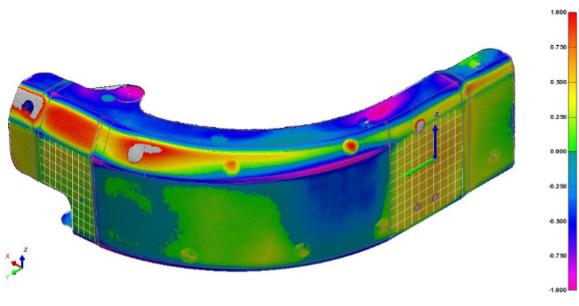
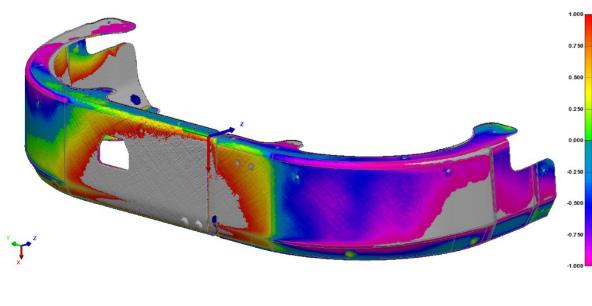
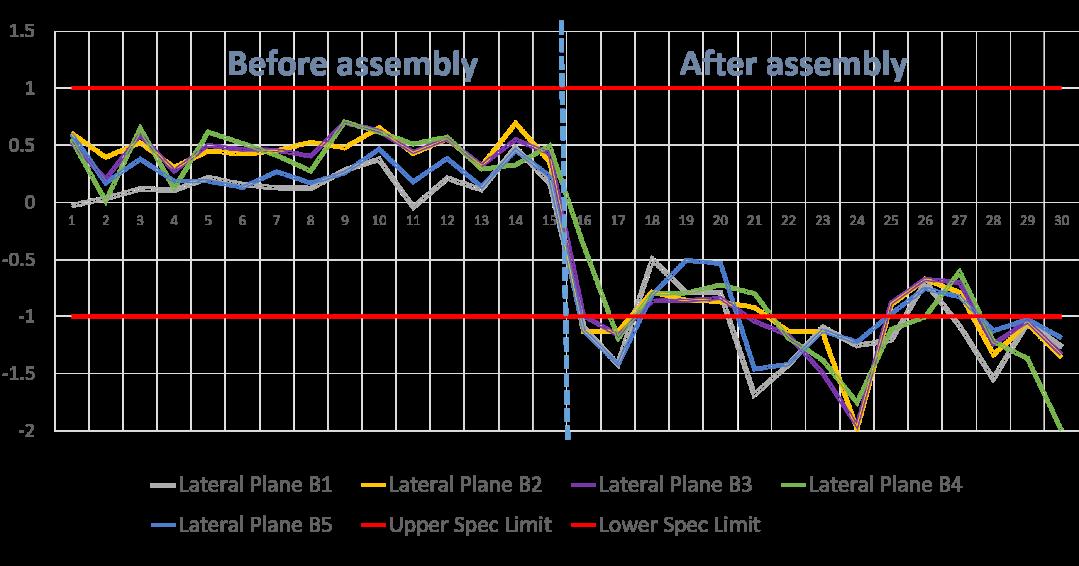
Table 4. Mean comparison of the lateral plane before and after the assembly process. Two-tailed t-student analyses showing the test statistic and a critical value .
Lateral Plane B1
Lateral Plane B2
Lateral Plane B3
Lateral Plane B4
Lateral Plane B5 Before After Test Statistics
Mean Variance Mean Variance tc (95%) to
0.16333 0.01924 -1.12520 0.10815 2.04841 13.98206
0.47817 0.01344 -1.07073 0.10420 2.04841 17.48955
0.46914 0.01756 -1.08173 0.11098 2.04841 16.75341
0.44477 0.04065 -1.08660 0.18511 2.04841 12.48243
0.28087 0.02019 -1.03373 0.08943 2.04841 15.37745
In Fig. 12, it is quite evident that the dimensions get out of control after the assembly process. Moreover, the change is so significant that it seems that they are statistically different. To be sure about this theory, a test statistic and a critical value were calculated in Table 4. In all the 5 measurements, ; therefore, there is enough evidence to prove that the assembly process affects the dimensions of the parts, creating a new average statistically different from the original value. This means that the null hypothesis is rejected with a confidence of 95 %.
DISCUSSION
As it was previously described, the manual measurement with the caliper showed that all the parts were OK in the quality gate established in the factory. However, by following the methodology presented in this paper, it was possible to see that all the 10 critical characteristics are out of tolerance and, by using statistics, they are entirely out of control. Since all the Cp and Cpk are << 1.33, it is possible to conclude that the process has no control and the variation among the parts is too high, producing parts consistently out of the specification. Since the part is entirely irregular, it is not possible to measure the parts accurately with manual instruments. By seeing the results, there is a production process based on manual operations with a considerable amount of failure modes happening repetitively.
The methodology presented in this paper is capable of measuring, visualizing, and determining the deviations accurately in any of the characteristics of this component. RE was the base of this research because it allowed the creation of a 3D model that could be used as a master reference to measure all the parts. RE is typically used by designers and materials creators, but in this case, it was used to create a measurement system capable of determining the real dimensions of a serial production part. The method was a combination of RE and statistical control tools to optimize the aeronautical production system.
The next step in this research is the optimization of this production system; shifting the manual operations into an automatic production system. The 3D model could be used to create the corresponding jigs and fixtures to shift the manual production system into a Computer Numerical Control (CNC) methodology. This optimization could be performed in the production plant and then a new set of parts could be produced by CNC.
The root causes of the problems in a production environment are difficult to find in some cases. These difficulties come from different perspectives such as a lack of training and standardization, incorrect management policies, machine’s inaccuracies, but the most critical source of poor-quality is variation among the processes and production parts. This was precisely the case presented in this paper. An aeronautical production system whose ability to produce parts with statistical control was nonexistent. The assignable causes of variation were mainly coming from the manufacturing manual method that was almost impossible to control due to the imperfection of the production controls. Manual operations were not capable of creating repeatability in the process, and therefore, the variation was a continuous within the process.
Through the state-of-the-art reverse engineering, it was possible to create a 3D model coming from a masterpiece whose characteristics were in accordance with the technical drawings. Since the only available reference was a 2D drawing, this model matched all these special characteristics to satisfy the customer’s needs. As soon as the masterpiece was created and validated by the quality team, digitalizations of 120 production parts were performed to understand the variation among those parts; by doing that, it was possible to measure, analyze and observe them deeply enough to understand the nature of the parts. Through this methodology, the 3D model was used as a masterpiece to measure, compare, and extract the dimensions of all the 120 parts that were scanned in this research. State-of-the-art RE was the base to create an inspection method in this production system belonging to the aeronautical industry.
The combination of RE and statistics was a novel methodology to create a measurement system with accurate results. The previous methodology used in the parts production was not capable since all the parts analyzed were stated as OK; contrary to the results shown in this paper. Measuring the meshes in a digital environment is a better methodology that allows visualizing simply the deviations on the product’s dimensions. In this paper, only the most valuable results were presented, but further analysis will be done in the future to optimize the production process in this factory. This paper is an example of an application of the state of the art and research literature into a running production system while using statistics.
ACKNOWLEDGMENTS
The authors acknowledge Universidad Autónoma de Querétaro (UAQ) and Consejo Nacional de Ciencia y Tecnología (Conacyt) for supporting this research.
REFERENCES
[1] S. Gauthier, W. Puech, R. Bénière, and G. Subsol, “Analysis of digitized 3D mesh curvature histograms for reverse engineering,” Comput. Ind., vol. 92–93, pp. 67–83, 2017. [2] N. Anwer and L. Mathieu, “From reverse engineering to shape engineering in mechanical design,” CIRP Ann. - Manuf. Technol., vol. 65, no. 1, pp. 165–168, 2016. [3] F. Ali, B. V Chowdary, and L. Gonzales, “An integrated design approach for rapid product development A case study through application of reverse prototyping tools,” J. Eng. Des. and Tech., vol. 11, 2013. [4] F. Buonamici, M. Carfagni, R. Furferi, L. Governi, A. Lapini, and Y. Volpe, “Reverse engineering of mechanical parts: A templatebased approach,” J. Comput. Des. Eng., vol. 5, no. 2, pp. 145–159, 2018. [5] I. Kovács, T. Várady, and P. Salvi, “Applying geometric constraints for perfecting CAD models in reverse engineering,” Graph. Models, vol. 82, pp. 44–57, 2015.
[6] Y. Zhou, “Reverse modeling of Auto part reconstruction based on CATIA,” Applied Mechanics and Materials, vol. 159, pp. 253–256, 2012. [7] L. Pagani and P. J. Scott, “Curvature based sampling of curves and surfaces,” Comput. Aided Geom. Des., vol. 59, pp. 32–48, 2018. [8] D. E. F. Fabio, P. Antonella, and C. Armando, “Shape Measurement Based on 3D Optical Scanner : Real Case Study in the Aeronautics Industry,” Applied Mechanics and Materials, vol. 656, pp. 378–387, 2014. [9] J. Herráez, J. C. Martínez, E. Coll, M. T. Martín, and J. Rodríguez, “3D modeling by means of videogrammetry and laser scanners for reverse engineering,” Meas. J. Int. Meas. Confed., vol. 87, pp. 216–227, 2016. [10] L. Li, C. Li, Y. Tang, and Y. Du, “An integrated approach of reverse engineering aided remanufacturing process for worn components,” Robot. Comput. Integr. Manuf., vol. 48, no. November 2015, pp. 39–50, 2017. [11] F. De Asís, C. Ordóñez, J. Roca-pardiñas, and S. García-cortés, “A statistical method for geometry inspection from point clouds,” Applied Mathematics and Computation, vol. 242, pp. 562–568, 2014. [12] J. Xu, N. Xi, C. Zhang, Q. Shi, and J. Gregory, “Optics & Laser Technology Real-time 3D shape inspection system of automotive parts based on structured light pattern,” Opt. Laser Technol., vol. 43, no. 1, pp. 1–8, 2011. [13] M. Xiang, S. Cheng, X. Yang, H. Peng, and X. Zhang, “A Design Methodology for Reverse Engineering Integrated with Anatomical CAD,” Applied Mechanics and Materials vol. 248, pp. 79–84, 2013. [14] F. Malapelle, D. Dall, D. Dalla, I. Dall, P. Fiorini, and R. Muradore, “Cost Effective Quality Assessment in Industrial Parts Manufacturing via Optical Acquisition,” Procedia Manuf., vol. 11, no. June, pp. 1207–1214, 2017.
