


Mayor & City Council
Edward Johnson, Mayor
Joe Clark, Mayor Pro-Tem
Rich Ho�man, Council Member
Darryl Langford, Council Member
Scott Stacy, Council Member
Niyah Glover, Council Member
Ray Gibson, City Manager
David Rast, Director of Community Development
Brian Wismer, Director of Economic Development
Denise Brookins, Director, Planning and Zoning
Julie Brown, Senior Planner
Nicole Gilbert, Planning Specialist
Katherine Prickett, Planning Specialist
Tony Whitley, GIS Analyst
Steering Committee
Sarah Murphy, Local Resident/Planning Commission Chair /Downtown Development Authority (DDA)
Kenneth Collins, Local Resident/Planning Commission Vice-Chairman
Debi Renfroe , Local Resident/Planning Commission
Toby Spencer , Local Resident/Teacher/Planning Commission
David Hilderbrandt, Local Resident/Planning Commission
Jamie Wyatt, Downtown Development Authority (DDA)
Dan Vano, Downtown Development Authority (DDA) /Business Community
Sam Burch, Downtown Development Authority (DDA) Historian/Local Resident/Business Owner
Nancy Musselwhite, Downtown Development Authority (DDA) Business Community
Brandon Sherman, Downtown Development Authority (DDA)/Business Community
Thank you to the residents of Fayetteville that provided input the throughout the planning process.


Today, more than 19,000 people call the City of Fayetteville “home”, and many thousands more shop, dine and work here. We are known for our overall high quality of life with high educational standards, low crime rate, and a great sense of community. As Fayetteville grows, and as more people desire to live, work, shop and play here, we are presented with the challenge of maintaining the high quality of life generations of families have come to expect In response to this challenge, we will encourage smart, collaborative, and managed growth

The Comprehensive Plan is a community-based vision for future growth and development within the City of Fayetteville The plan addresses land use, housing, economic development, transportation, parks and recreation, and natural resources, with a strong focus on how land is used, developed, and/or conserved
The City’s current Comprehensive Plan was adopted in 2017 and since that time, Fayetteville has experienced signi�cant population growth and economic development. The 2022 Update builds on the previous plan and provides a �ve-year update as required by Georgia’s local planning rules centered around reevaluating key elements.

The 2022 Update includes a review of the Community Work Program, which identi�es projects and initiatives to assist in implementing the Community Goals. While the Comprehensive Plan as a whole incorporates policies and strategies for a 20-year planning period, the Community Work Program outlines speci�c implementation strategies in a 5-year timeframe
The Capital Improvements Element identi�es capital investments the city intends to make in the next �ve years to facilitate achieving the city’s goals
The 2017 Comprehensive Plan provided a road map for the city as it continues to grow and evolve The comprehensive plan used di�erent forms of public engagement and re�ects the ideas, values, and desires of the community, aligning these with a range of plans, policies, and initiatives in place or underway in both Fayetteville and the wider region
The Strategic Plan serves as a tool to help guide the community toward its desired outcomes. The plan is intended to be a living document, meaning it will be updated and amended as needed to re�ect progress made, changing conditions in Fayetteville and the region, and the evolving needs of the community The updated plan serves as a reinvigorated foundation for the city, establishing a comprehensive vision for the future, refreshed land use recommendations, and implementation recommendations to guide the city moving forward
The 2021 LCI Study established a community-wide vision and plan for the downtown core. A part of the study evaluated previous planning documents and their recommendations for downtown development. The 2021 LCI study has served the city well and provided comprehensive analysis and recommendations for the downtown area's land use, zoning, and development regulations
The 2022 housing study provided a demographic review, market demand data, and identify potential residential development opportunities in the city


The City of Fayetteville is located in the center and serves as the county seat of Fayette County Historically, Fayetteville was predominantly an agricultural area with sprawling homes on large lots In recent years the city has worked to restore the historic streetscape and downtown charm while still welcoming new residents and businesses
Fayetteville captures estimated 17% of Fayette County's population, with a 2021 census population of 19,284 residing in 6,741 households The population is fairly diverse across age, race, and income cohorts While being historically more rural than suburban, recent development activity and housing market trends have fueled growth in Fayetteville
19,284 Population
12.88 Square Miles
1,365.1 People Per Square Mile
6,741 Number of Households
2.60 Average Household Size
Under18Years 22 18to34Years 19
35to64Years 40 65andOver 19
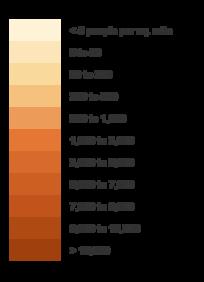
Between 2010 and 2022 the population in downtown Fayetteville increased from 3,426 to 3,786 people per square mile, demonstrating a 10% increase in population density Census statistics show the younger population has increased within the downtown core and the southern portion of the city, while the northern arc has experienced a decrease in the younger population The shift in age is predominantly due to high-performing schools being located to the west and south of the City, close to Peachtree City and south of the City, as well as job opportunities for younger adults located to the west (Trilith Studios, the Town at Trilith and Piedmont Fayette Hospital) and manufacturing and light industrial-related jobs to the east and north.
Since 2010, the census tracts encompassing Downtown Fayetteville have also identi�ed a 10% increase in the 55+ age group, which is consistent with similar growth patterns in neighboring communities. For instance, Peachtree City to our west has experienced a signi�cant increase in residents aged 55 and over, which bodes well as Fayetteville continues to provide opportunities for downsizing and senior living facilities.


The median age in Fayetteville is 42, and population growth has been steady since 2010 Based on census-based estimates, the strongest growth will have occurred from 2010 – 2022, with an 18 2% population increase, or just over 1 5% per year
Population growth over the last ten years has grown steadily in the 18-34 and 55-85+ age groups, with a steady increase in the Black/African American and Asian populations These numbers point to a growing number of young singles and professionals as well as empty nesters and retirees, all of which will require a greater variety of housing products Decreases in the 5-17 and 35-54 age groups indicates a decreasing number of younger families moving to the city
Fayetteville is located in the Atlanta-Sandy Springs-Roswell Metropolitan Statistical Area (MSA) The Atlanta MSA encompasses 29 counties, with ten central counties belonging to the Atlanta Regional Commission (ARC) and forming the core of the MSA. Roughly 78% of the population of the MSA lives within this ten county core including Cherokee, Clayton, Cobb, DeKalb, Douglas, Fayette, Forsyth, Fulton, Gwinnett, Henry and Rockdale
Between 2000-2010 only 67% of all population growth within the MSA occurred within this ten county core Since 2010 roughly 85% of all population growth within the MSA occurred in this ten county core as younger and older generations increasingly sought walkable neighborhoods both in urban and suburban areas Fayette County had considerable growth from 2000 to 2010 with an annual growth rate of 1 6% However, the story for the City of Fayetteville is more positive
From 2000-2010 population growth within Fayetteville outpaced many of the fastest growing counties in the MSA with a 3 6% annual growth Since 2010 the city's growth rate is still strong and has outpaced all counties in the MSA except for Cherokee County with an annual growth rate of 1.7%
Concentrations of highly-educated residents and households are attractive to both o�ce and retail employers Prospective o�ce tenants desire proximity to a highly-educated workforce Retailers often use educational attainment levels as a key metric when determining site locations Additionally, households with high educational attainment levels have shown to include higher income potential and are strong indicators of neighborhood stability
The northern and eastern portions of the city of Atlanta and the north metro suburbs have the highest concentrations of high educational attainment households in metro Atlanta On the southside of Atlanta, Fayette County stands out, but a lack of high concentrations of educated households and workforce continues to limit major o�ce growth and/or relocation
Nearly 40% of Fayetteville residents 25 years and over have obtained a Bachelor's degree or higher Historically, college-educated individuals in Fayette County have been concentrated in the west and southwest near Peachtree City and Tyrone, but over the past few decades college-educated individuals have been pushing west, increasing the educational attainment in Fayetteville, and within Fayette County, as a whole.
As of 2022, Fayetteville has 6,949 total housing units, the majority of which were constructed after 1991 and include single-family detached, townhomes, condominiums and apartments Approximately 36% of all dwelling units were constructed in the 1990's While more than 71% of all housing units within the city are owner-occupied, the recently completed Housing Study indicated a lack of product diversity, with an estimated 72% being conventional single-family detached structures
Statistics show a healthy rental vacancy rate typically hovers around 7-8%, while a healthy homeowner vacancy rate is much lower, at 2% or below Of the city's 6,949 housing units, an estimated 97% are occupied, and 3% are vacant Vacancy rates within the city are currently 2 7% for rental units and 0 2% for residential structures
When vacancy rates dip below 5%, studies show the demand for housing is outstripping the supply Rental market vacancy rates in the 5-7% range show the market is providing adequate housing choices. Low rental vacancy rates can be harmful to communities because it can lead to unjusti�ed rent increases, provide a disincentive for property owners to maintain facilities, and reduce the choice and opportunity for renters. Additionally, when rental vacancy rates fall below 5%, there is the possibility that rents will increase making some rental properties less a�ordable.
The assessment of existing tra�c patterns, access points, and conditions of the street network is an integral part of the Comprehensive Plan because land use and the street system are interdependent
Historically commercial establishments generate high tra�c volumes and pursue locations along major thoroughfares with high tra�c capacity and visibility Industrial and warehousing operations generate heavy truck tra�c and are typically located adjacent to similar uses O�ce and industrial employment centers generate high peak hour volumes and require convenient routes to expressways For example SR 85, SR 92, SR 314 and SR 54 have higher tra�c volumes than other roads in the city and, therefore, provide more opportunity to capture a segment of the pass-by tra�c Conversely, the arrangement of land uses can in�uence tra�c �ow Residents often desire convenient access to work and shopping but generally want safe, low-volume streets in their neighborhoods A well-designed street system can safely accommodate a mix of tra�c generated by each land use

Street Functional Classi�cations
Major Arterial Collector Local
Neighborhoods

The city has an estimated 150 miles of streets, with limited connections where motorists can travel to other parts of the city without depending on major corridors While limited connectivity discourages tra�c on local streets, it also constraints residents from entering and departing their neighborhood The city's road network is not comprised of the traditional grid pattern Between the early 1950's to the 1990's, the street network began to shift from grid to traditional suburban street patterns when regulations focused on reducing and even eliminating through movements on many residential streets and having them take place on main arterials


The opportunities for pedestrian mobility or even bicycles are even more constrained. As the population increases, this could cause further con�ict, congestion, and potential safety concerns among all road users.
 1900's

Currently, the vast majority (81%) of city residents who are employed drive alone to work while 8% carpool, 0.5% use transit (bus or rail), and 8% work from home. Most households (98%) have at least one automobile. The average city resident takes 33 minutes on average to travel to work.
The table below shows there are currently sixty-four (64) signalized intersections in the county with the majority located within Fayetteville along state routes. Even with the growth in population, tra�c volumes on arterials has declined slightly. Further review should be conducted to con�rm the decline is not related to the pandemic or other issues. Fayetteville moves forward by considering how streets are not only e�cient, but safe for all users.
The map below shows a rough estimate of the city sidewalk network in 2019 Overall, the city boasts good sidewalk coverage, but the pedestrian experience when traveling varies greatly and is dependent on factors such as:

▪ Tra�c volume
▪ Sidewalk width and physical condition
▪ Quality of the sidewalk surface
▪ Obstructions
▪ The presence of landscaping and street furniture
▪ Public art
▪ Building frontages
▪ Neighboring use
In 2019 a walking propensity analysis was conducted as a part of the city's Master Path Plan This quantitative analysis reviewed four factors to predict the most likely locations where people would walk if there were sidewalks

The four factors included:
▪ Existing Land Use
▪ School and Park Zones
▪ Intersection Density
▪ Pedestrian Crashes
The analysis showed a strong walking demand in downtown Fayetteville which was due to commercial land uses, a grid street network with small blocks, and proximity to schools Other high demand nodes include the intersection of SR 54 and Grady Avenue due to commercial and o�ce land uses, proximity to Fayette County Alternative School and Spring Hill Elementary School, and the Meridian apartment development
The analysis did not include Trilith Studios or the Town at Trilith due to the fact this area was still under construction at the time the study was conducted.
The Master Path Plan also evaluated existing streets throughout the city to determine how comfortable they were for biking Among other factors, the Bicycle Comfort Index analyzed the speed and volume of automobile tra�c The index assumes that as travel speed the volume of tra�c increase the road becomes less comfortable for cyclists
This map shows level of comfort by color Roads in green are the most comfortable to ride on Those yellow and orange are progressively more uncomfortable to ride on Those in red are the most uncomfortable to ride on The results show that almost all of longer routes are uncomfortable to ride a bicycle on This illustrates a need for either on-rode or separated bicycle facilities to help facilitate bicycle mobility

2002 LCI Supplemental Study:
The City of Fayetteville undertook an LCI Study in 2002 which identi�ed a series of transportation improvements intended to improve connectivity and circulation within the downtown core The LCI recommendations mainly focused on congestion relief strategies, safety improvements, and non-motorized travel alternatives Speci�cally, the study recommended implementing intersection and tra�c signal improvements along SR 85/Glynn Street between LaFayette Avenue and SR 54/Stonewall Avenue The study also recommended safety improvements for SR 85/Glynn Street, namely the installation of medians
2010 LCI Supplemental Study:
The 2010 LCI Supplemental Study was an update to the 2002 LCI Study Like the 2002 study, the 2010 LCI Supplemental addressed connectivity and circulation within Downtown Fayetteville The LCI Supplemental placed an increased focused on walk-ability and access management It also presented concept plans for:
▪ Extending Hillsdale Drive to SR 85/Glynn Street
▪ Extending Church Street to Kathy Avenue
▪ Intersection improvements at SR 92/Forrest Avenue at SR 85/Glynn Street
▪ Church Street at Kathy Avenue
▪ Hood Avenue at SR 92/Forrest Avenue Roundabout
In March of 2018, a community stakeholder meeting was conducted that focused on the Master Path Plan and the development of a county-wide network of sidewalks, side paths (bi-directionally multi-use path along side of roadways), greenway trails, and bicycle routes. This meeting brought a variety of community members from various backgrounds together in an e�ort to identify common community interests. Community desires for various locations for bicycle routes, pedestrian walkways, and golf cart facilities including sidepaths, greenway trails, shoulder bikeways, signed shared roadway, and sidewalks were discussed and cataloged.
The meeting generated a signi�cant amount of feedback for desired pathway connections. Common desired connection locations included a sidepath connections between Peachtree City and Fayetteville along Redwine Road, a sidepath on SR 54, and bicycle facilities on Bernhard Road and Brooks Woolsey Road. Common desired connection destinations include a regional trail connection in southern Peachtree City as well as connections to the Starr’s Mill school cluster as a starting point for the development of the Master Path Plan. The Master Path Plan includes design guidelines that cover the speci�cs of the path designs and how they should be constructed in relation to the existing environment. The Master Path Plan discusses a City Hall project that will update land-use, pedestrian transportation networks and tra�c patterns within the downtown area, while at the same time being integrated with expansion e�orts of paths and sidewalks throughout the city, including enhancing the network of streets connecting SR 54, SR 85, Beauregard Blvd, and Grady Avenue
“The Master Path Plan will connect population centers, schools, parks, commercial land use, and other recreational opportunities. The Master Path Plan will accommodate pedestrians, bicyclists, and golf cart users.”


This LCI study of the downtown area focused on implementation and hence featured a multi-disciplinary team that integrated urban planning & design, existing conditions, community engagement, market analysis, transportation, and zoning, in a collective vision for the Downtown Fayetteville study area The transportation section reviewed operational characteristics, potential changes and improvements to the mobility network
The following frameworks recommendation were proposed:
• Recognizes the physical constraints, context, and character of the surrounding built and natural environment. It recommends policies and projects that strengthen the pedestrian, bicycle, and vehicle transportation network
• De�nes ideal standards for Complete Streets in local areas. “Complete Streets” refer to the concept that roadways should be designed with all users in mind, not just motorists These standards apply contextsensitive design approaches to roadway redesign that enable safe, convenient, and comfortable travel or access for users of all ages and abilities regardless of their mode of transportation This e�ort will support walking and bicycling within Fayetteville

• Establish a Street Typology, the traditional functional classi�cations of streets provide a hierarchy that correlates tra�c �ow to land access Tra�c volume, speed, and level of service provide the basis for roadway design criteria. However, this classi�cation system falls short in considering non-vehicular users of the public right-of-way (pedestrians, bicyclists, and transit) and is void of context for how the street impacts adjacent land uses and vice versa.
• Advocates for (re)developing Fayetteville’s core transportation network to work for the city’s residents, businesses, and visitors This requires �exibility in its design application and implementation so that mobility priorities and guidance for transportation investments are identi�ed to improve resident’s quality of life and access to goods or services


The 2019 Fayette Transportation Plan is Fayette County’s Comprehensive Transportation Plan (CTP) and identi�es a set of short-term, intermediate, and long-range transportation system development opportunities As it relates to the City of Fayetteville, the Fayette Transportation Plan primarily identi�es the following policy changes recommendation:
▪ Veterans Parkway Overlay district that will encourage best practices in access management
▪ County-Wide Truck Route Ordinance restrictions through truck movements
▪ Re�ne Path Design Guidelines
▪ Sandy Creek Road Needs Assessment
Additionally, the Fayette Transportation Plan lends support for the City of Fayetteville’s use of Special Purpose Local Option Sales Tax (SPLOST) program funding, and the development of the Fayetteville City Center In 2017, in a county-wide referendum, Fayette County citizens voted to approve the 1% (or 1¢) SPLOST The following is the status of the 2017 SPLOST transportation projects
From the comprehensive plan, previous studies, public input, and sta� review, the following list of high priority projects were compiled Some of the projects did not have identi�ed funding sources
• Citywide – add sidewalks
• SR 85 South –widen to four lanes
• Work with GDOT and other stakeholders to make SR 54 and SR 85 in the downtown area safe and pedestrian friendly
• Improve and add sidewalks citywide
• Improve and update the multi-use path
• Fayette Bypass -- complete
• Citywide –create grid street network/connect neighborhoods
• Hood Avenue – connect to Sandy Creek
• Advocate for citywide – synchronize tra�c signals
• SR 85, SR 314, and Je� Davis – improve �ow, add safety improvements
• City Center Engineering and Constructions
• S R 54 Multi-Use Bridge-Crossing
Fayetteville is well-positioned geographically to the City of Atlanta, Harts�eld-Jackson Atlanta International Airport and to I-85 and I-75 which makes it convenient for residents, business owners and industrial tenants to travel for business and/or pleasure The city has a wealth of natural, cultural, historical, and commercial resources that provide an amenity for residents, a destination for tourists, and an attractive location for commercial business and industry

The unemployment rate within the city in 2022 is 3 7% which is a slight increase over 2020 (3 4%)
Revenue continues to be steady in most sectors, while sectors a�ected by the pandemic (hotel/motel tax, excise tax and court-related revenue) have started to normalize The �nancial position of the city continues to improve from the recent recession, with three years of positive growth in the tax digest Most revenue sources are stabilizing and some are showing slight increases The city continues to maintain adequate fund balances consistent with the reserve fund policy, while also monitoring of revenue and expenditures
A household includes all the persons who occupy a housing unit as their usual place of residence. The 2021 census data indicates that Fayetteville has 6,741 households, with approximately 69% identi�ed as owner-occupied. Of the owner-occupied households, 25% of the occupants earn less than $50,000 annually, 33% earn between $50-$100,000 annually, and 41% earn more than $100,000 annually. Most homeowners are married couples between the ages of 45-64 with a combined income exceeding $100,000. A growing number of single residents and those between the ages of 25-34 also purchasing homes in the city.

In the rental-occupied households, 34% are occupied by residents earning less than $35,000 annually; 24% are occupied by residents earning between $50-$75,000 annually; and 29% are occupied by residents earning more than $75,000 annually Statistics show that households earning less than $35,000 annually are likely renting due to income restrictions and a lack of a�ordable housing options Statistics also show there is a growing number of renters who could a�ord to own but choose to rent Within the city, rental-occupied households are split evenly amongst household type (singles, married couples, and other family) and age distribution (25-34, 35-44, and 45-54)
In 2019 the average median income of residents in the downtown district was between $52,700-$83,500 Through the years there has been a steady increase in the average median income with concentrations of high-earning households within the western and southern portions of the city This trend is consistent with the median income in unincorporated Fayette County which also shows a concentration of higher median income households to the west and south of the city Typically these areas are occupied predominantly by families and/or empty nester homeowners who want to live close to one of the county school complexes
Between 2018 and 2019 the median home value in Fayetteville increased 4 1% from $215,200 to $224,100, which was 0 93% less than the national average of $240,500
Within downtown Fayetteville home values have decreased 4% since 2010 On average the median home value within the city is 30% less than median home values within unincorporated Fayette County ($281,400) Home values not only vary within the city limits but also throughout the county depending on location and proximity to school complexes, other jurisdictions (Peachtree City, Tyrone, etc ) and larger lot sizes and open space available within the unincorporated county This disparity can be attributed to a de�cit of new housing being built within the city limits
Median Value $224,100
Gross Rent $1,157
Under$100K $100Kto$200K
$200Kto$300K $300Kto$400K
$400Kto$500K $500Kto$1M
Over$1M
The city's proximity to I-85 and I-75 hinders the ability to market the city to larger industrial and/or o�ce uses In contrast both Newnan and Peachtree City have direct access to the interstate and established industrial parks which make them more marketable to industrial, manufacturing and logistics facilities Fayetteville is situated to provide for a short commute to major employment centers within the southern crescent of metroAtlanta, including Harts�eld-Jackson International Airport, the Aerotropolis, as well as businesses and industries located within the I-85/I-75 corridors As seen in work�ow patterns, the majority of workers commuting to and from the city tend to live in the surrounding communities, work locally or commute from these areas into other employment centers
An estimated 14,310 people are employed within the city limits with approximately 41% earning more than $40,000 annually; 31% earning between $15-$40,000 annually; and 28% earning less than $15,000 annually. The majority of jobs paying more than $40,000 annually are in the healthcare or public administration �elds.
Of those individuals working within the city limits, an estimated 13,609 commute to work which indicates a potential shortage of housing options for those wanting to live and work within the city. Approximately 17% of people who work in the city live within a 4-mile radius of the city limits while another 12% within or close to Tyrone, Peachtree City and Jonesboro.

Employment data managed by the city indicates the public sector employs a signi�cant number of individuals who work within the city While the public sector provides high quality jobs for residents, it does not directly add to the tax base of the city especially since these properties are tax-exempt
Trilith is responsible for an estimated 3,700 jobs, including those related to the 60-plus businesses located on site Trilith's business ecosystem attracts investment capital, innovators, and entertainment-related businesses
The latest census data shows the largest employment sectors within the city are educational services and healthcare, followed by transportation and arts/entertainment Construction/manufacturing/warehouse jobs are primarily within the eastern and northern sectors while medical and technical jobs are primarily to the west Most public sector and public administration jobs are concentrated downtown
The city's target industry sectors include small business, retail and �lm production support services, professional and corporate o�ce users, computers and technology, and health services
Broadband is typically de�ned as a speci�c type of internet connection faster than non‐broadband internet, it uses wide bandwidth, and the service provides multiple signals at once Bandwidth refers to the maximum rate at which an internet connection can transmit data The Georgia Broadband Program de�nes an area as being served by broadband if at least 80% of locations within a census block have access to a �xed, terrestrial broadband provider with at least 25 megabits per second (Mbps) download speeds and 3 Mbps upload speeds

Critical Infrastructure like utilities, transportation facilities, and technology are essential to everyday business function and community growth In 2018 the Georgia General Assembly amended the provisions of local planning in Georgia by passing the "Achieving Connectivity Everywhere (ACE) Act," intended to facilitate the enhancement and extension of high-speed internet access in communities that lack such infrastructure and the vast resources it provides. As the �rst step in planning for this critical, potentially catalytic infrastructure, the "Ace" Act requires all local governments to incorporate the "promotion of the deployment of broadband internet services" into their local plan.
The map below shows that the city is well served with broadband service. Both the Federal Communications Commission and the Georgia Department of Community A�airs data indicate that citywide broadband service and high-speed internet coverage are available with several service providers. Also the latest American Community Survey (ACS) stated that 95 percent of households had a computer and 89 percent are served with broadband internet.

Georgia Broadband Availability Map
95.7%
Householdswithacomputer, percent,2016-2020
89%
Householdswithabroadband Internetsubscription,percent, 2016-2020
Source: 2022 Georgia Broadband Availability Map
https://broadbandgeorgiagov/2022-georgia-broadband-availability-map
Activity Centers are areas within the city that are currently or anticipated to become locations of signi�cant commercial and/or mixed-use development This 2022 Update identi�es four major Activity Centers : Innovative Mixed Use (Trilith), Medical Complex (Piedmont Fayette), Downtown Core, and the 85 North Corridor (Fayette Pavilion)
In 2020 the city commissioned Urban 3 to analyze property tax generation and value per acre trends within the city The Value Per Acre Analysis (below) shows the two areas within the county that dominate the value per acre map - the taller purple spike represents Piedmont Fayette Hospital and the associated medical o�ces with the second purple spike represents Trilith Studios and the Town at Trilith
The Urban 3 analysis suggested that �scally-healthy cities should have a downtown core that is six times as productive as the surrounding county Downtown Fayetteville is about twice as productive as the rest of Fayette County Medical o�ces around Piedmont Fayette Hospital and the construction near Trilith Studios are currently making up much of the di�erence These more productive developments put Fayetteville in a position that allows the city to focus on growing the downtown

One of the primary funding sources for local governments is derived from property taxes and charges for services. Residential properties are the highest contributor in Fayetteville. A tax base that is balanced between commercial/industrial and residential uses will ensure reasonable property tax rates in the future.
$341,459,925 $393,340,653
$658,806,034
$41,599,160 $8,054,235 $161,400 $10,903,338
Residential Commercial Industrial Utility Motor Vehicle Agricultural 41
The chart below provides an overview of the assessed value for the top property taxpayers in 2021. As mentioned in the Urban 3 study and evident from the revenue generation data, leveraging the development and redevelopment of existing commercial nodes increases vibrancy, character, and a sense of community and provides a substantial economic impact.
BrentScarbrough&CoInc
PinewoodAtlanta
DDRTCFayettePavilionI&II
DDRTCFayettePavilionI&II
DDRTCFayettePavilionIII&IV
CobblestoneApartmentsLLC
PinewoodForrestLLC
HeartisFayetteville
PiedmontFayetteMedical&Of�ceBldgI 20,000,000
The City of Fayetteville encompasses 12 8 square miles The majority of land is developed with single family detached residential subdivisions Approximately 14% of the overall land mass is consumed with commercial development, primarily concentrated along Highway 85 and culminating with the Fayette Pavilion shopping center Fayette Pavilion has in excess of 1 5 million square feet of big box retail and at one time was the largest assemblage of commercial space within the state Fortunately the retail complex continues to draw patrons from outside the Fayetteville/Fayette County zip codes, increasing sales tax revenue for both the city and county.
The Existing Land Use Map provides a citywide perspective of current growth and land-use patterns. The analysis was completed by conducting a thorough review of GIS data provided by city sta�. In addition, a windshield survey was conducted to further capture accurate data to analyze and update the Existing Land Use Map.

Over 50% of all parcels within the city are zoned for residential use, with the most signi�cant development being the Town at Trilith Single-family detached residential developments occupy the majority of the city's land mass, Permit records show the majority of multi-family residential development occurred in the 1990's and early 2000's prior to the 2007 recession Since then the bulk of residential development within the city has centered around the single-family detached product
In recent years the city has experienced an increase in requests for multi-family developments of all sizes and scopes In several public work sessions the discussion has centered on the need to redevelop certain areas with mixed-use development which has led to the approval of two multi-use residential projects within the downtown core
As available land becomes scarce, new residential development has been more dependent on in�ll, rezoning request and redevelopment opportunities. Developers have requested greater densities to o�set the higher land values and development costs.
Commercially zoned land is primarily located along major corridors and state routes, and there are limited areas zoned for industrial development.
Commercial uses in the City have historically bene�ted from the lack of retail in smaller cities in the area and the regional transportation routes. While many neighborhoods in the City were established in the 1990s, commercial growth followed the traditional development patterns with commerce at the center of town, then expanding along the corridors as the population increased. There has been less commercial growth in recent years as the real estate market has changed.
The City has experienced limited redevelopment of older commercial properties, and residents have been outspoken during public meetings about the necessity for projects to revitalize the aging shopping centers Recent changes in retail and o�ce markets have added uncertainty to the continued possible development options for some commercial properties in the City
There are considerable commercial properties throughout the City with the potential for redevelopment or repositioning themselves for present market demands Characteristics of potential redevelopment sites include signi�cant amounts of surface parking

Other cities and counties in the Atlanta Metro area have encouraged this auto-centric type of development and are now experiencing budget short falls. Fayetteville’s decisions on future development will determine the direction of the City’s fiscal health for decades
How well Fayetteville handles further growth will be the deciding factor in what type of city it becomes Encouraging traditional neighborhood design, in�ll development, and a more connected road network could lead to an economically-sustainable city On the other hand, if left unchecked, development will likely move towards autocentric shopping centers and suburbs that are ultimately unable to pay for the infrastructure they require. As the city nears build out, much of the remaining opportunities to shape future growth will be through in�ll of under-developed properties or through redevelopment of obsolete or declining areas.


The Comprehensive Plan Advisory Committee (CPC) was comprised of community stakeholders including neighborhood and Homeowner Association representatives, non-pro�t and civic leaders, business owners and other community members as well as representation from the City Council, Planning and Zoning Commission and Downtown Development Authority The purpose of the CPC was to engage the community and to work with City Sta� as the 2022 Update was being prepared The �rst action of the CPC was the analysis and review of current conditions, demographic changes and the community vision.
The 2022 Update was developed with a cohesive vision, along with achievable goals, objectives and implementation strategies based on feedback provided through the public input process and then con�rmed by the CPC The 2022 Update also includes amendments to the Future Land Use Map, special interest area plans and additional plan recommendations which were developed with input from city sta�, the CPC and the public The Draft Comprehensive Plan - 2022 Update was presented the CPC and the Planning and Zoning Commission prior to forwarding to City Council with a request to authorize Sta� to transmit the plan to ARC for review. The 2022 Update was o�cially adopted on September 15, 2022.
The planning process is summarized below:
Community members provided input throughout the planning process, both in person and online. The engagement activities focused on identifying priority needs and opportunities and building consensus around a community vision and goals for the future.
The CPC was comprised of community stakeholders including neighborhood and Homeowner Association representatives, non-pro�t and civic leaders, business owners and other community members as well as representation from the City Council, Planning and Zoning Commission and Downtown Development Authority The purpose of the CPC was to engage the community and to work with City Sta� as the 2022 Update was being prepared.
City Sta� initiated the 2022 Update of the Comprehensive Plan by holding a public hearing in the Council Chambers on Tuesday, March 3, 2022 at 6:00 p m The public was invited to attend and participate in this public hearing. The purpose of the public hearing was to brief the community on the process and opportunities for public participation
The �rst community workshop was held on April 18, 2022 at 6:00 p m in city hall The workshop was designed to give attendees an opportunity to share input on the assessment completed by Noel Consulting related to housing and commercial development
The second community workshop was held on May 10th at 6:00 p m in city hall The workshop was structured with exercises for open-ended responses. It was designed to solicit feedback on future development patterns and to identify areas where the city should focus its resources Attendees were asked to provide a list of "small victories" and "big ideas" for the city, in addition to being encouraged to rate community assets and map future growth areas. They were also asked to provide general feedback on any areas of concern


The last public workshop was held at a local community center to get direct input from senior citizens on the future Attendees were asked to add to the list of "small victories" and big ideas for the future Participants were also encouraged to rate community assets and map future growth areas. They also provided general feedback on any areas of concern
In 2021 as a part of the Livable Centers Initiative (CLI) Study, the city conducted a virtual community charrette on February 11-12 to develop a collective vision for the downtown core. A portion of the charrette was devoted to discussing the history of development patterns within the city and reviewing the recommendations from previous planning studies. Participants were then encouraged to re-imagine a future for the city and to share input on areas to preserve and/or change as well as perspectives on future land use, development patterns, accessibility and mobility, and parks and open space. Each of these sessions was conducted virtually and engaged 60-80 participants.
Following up on the work of the Fayetteville Forward LCI Study, a cross- disciplinary team conducted a design vision workshop with city o�cials in late April The goal was to create inspiring visions for key streets and critical city parcels of downtown Fayetteville and to outline a strategy for implementation


• Opportunity to live and work in the city
• Empty building need to be used for business
• Copy cat Trilith you need a model
• Redevelopment of the pavilion
• Refurbish empty or partially occupied strip centers
•
• Stop overbuilding apt complexes for town Tra�c congestion
• More business coming to town
• Fiscally sustainable and pro�table development
• Pedestrian facilities that are safe, connected and separated from tra�c
• Do not build additional apartments until you �ll and rent what you got
•
At each public workshop, attendees consistently ranked the city's small-town charm, parks, and community events with high marks. Public safety and the Senior Center (Fayette County) were additional areas that received high marks
The lowest-ranked areas included tra�c and transportation, housing options and family ties Other concerns included the increase in multi-family development, aging shopping centers, making downtown more walkable, and ensuring balanced growth.
A s s e t s
From the previous studies and community meeting, a number of speci�c priority issues emerged which ultimately guided the development of the updated core goals and recommended actions/projects The following list of needs and opportunities were identi�ed during a series of input meetings
• New City Center Park including the playground, walkways, a picnic pavilion, a splash pad and lawn space
• Small town Charm/Historic District
• Existing street network is a great foundation to build upon in creating a vibrant walkable downtown
• Historic buildings that contribute to the Southern/ small town charm
• Community events are well attended and have created strong bonds
• Piedmont hospital and other medical establishments provide vital services
• Moderately a�uent, established city with a quality school district and several local employment anchors
• Presence of Georgia Military College and Georgia Film Academy
• Proximity to Harts�eld-Jackson International Airport
• Proximity to Atlanta
• Pinewood Atlanta Studio and all the related businesses and workers that contribute to the Fayetteville economy
• In�ll development and undeveloped land
• Excellent �re and emergency response
• Established neighborhoods and housing stock
N e e d s / C h a l l e n g e s
• Refurbish empty or partially occupied strip centers, aging Shopping Centers
• Parking downtown seems limited, need clear signage to make it less confusing
• Improve the existing parks and add more open spaces
• More community artwork in the downtown and new programming for community events
• Old houses are deteriorated, lack of maintenance
• More community artwork in the downtown
• More sidewalks, bicycle paths and multi-use trails.
• Improve older parks and provide more green space
• Lack of pedestrian facilities that safe, especially downtown
• Planned/intentional businesses in square that drive walkability
• Reduce the impact of con�icting land uses
• Improve older parks and provide more green space
• Better tra�c management city wide
• Major state and U S highways transect the downtown
• Tra�c congestion and high speeds in downtown
• Separated bike lanes/temporary road diet on streets such as Je� Davis or Beauregard
• Aging infrastructure needs continuous follow-up and maintenance
• More housing options for seniors and young professional
A unique place to call home, a community building from the past, working together creating a better future, while preserving our small town charm.

Guiding principles are the values city leaders should use to establish a framework for decision-making throughout the life of the Comprehensive Plan These principles were conceived through robust and meaningful conversations with the CPC, city leaders, residents and the business community

GOAL ONE: Improve Property Tax Base to diversify and strengthen the �scal health of the city
L-1.1: Update and pursue goals of the Economic Development Plan.
L-1 2: Investigate the development of more TAD districts
L-1 3: Pursue more Business Park development to accommodate our economic development targets
GOAL TWO: Improve Aesthetics
L-2 1: Encourage more parks, street trees, median landscaping and gateways
L-2.2: Continue with high architectural and site design standards
L-2 3: Revisit the sign ordinance rules for temporary signs to ensure that the City maintains its appearance
L-2 4: Encourage the growth of the arts and cultural community
L-2 5: Minimize street frontages lined by parking lots and blank walls
GOAL THREE: Make Downtown Fayetteville more vibrant and walkable
L-3 1: Get more people living Downtown to support businesses
L-3 2: Recruit more businesses to Downtown
L-3.3: Study �nancial and engineering feasibility of regional stormwater detention in a water feature (such as a lake or enhanced creek/river/canal) Downtown
L-3 4: Improved/ additional way�nding signage
L-3 5:Encourage pedestrian improvements within Downtown including but not limited to sidewalks, pathway systems, multi use trails connecting park areas, businesses, and neighborhoods to Downtown
GOAL FOUR: Ensure development is complementary
L-4 1: Finalize and adopted the update zoning ordinance to re�ect goals of the Comprehensive Plan
L-4 3: Ensure appropriate density transitions and bu�ering between incompatible uses
L-4 4: Preserve and protect the desired character and value of well-established neighborhoods and natural resources from encroachment by incompatible uses
L-4.5: Support the redevelopment of underutilized parcels
L-4 7: As necessary, undertake detailed studies, plans for growth centers, and mixed-use centers to identify areas appropriate for density mixed-use development
L-4.8: Support residential in�ll development and redevelopment that responds to local preference and demand for innovative, high quality housing, that is sensitive to surrounding residential areas, and that supports community character goals and objectives
GOAL ONE: Get more people living Downtown to support businesses
H-1 1:Examine opportunities for higher density development in the activity centers (Trilith, Downtown, Pavillion, etc ) only as part of mixed-use development.
H-1.2: Actively recruit mixed use developers.
H-1 3: Encourage the development of townhouses that are externally oriented toward the street and neighborhood, not inwardly oriented or oriented toward parking lots
H-1 4: Encourage the development of smaller lot detached homes in walking distance of Downtown amenities
GOAL TWO: Encourage development of housing for every step of the life cycle
H-2 1: Investigate strategies to promote workforce housing, especially for government employees
H-2 2: Address identi�ed need for smaller single family detached housing with a higher architectural design standard located in walkable mixed use environments This could be downtown or in a developer created mixed use environment Care should be taken to limit the number of walkable mixed use developments outside of Downtown so as to not reduce the demand for living Downtown
H-2 3: Reconsider City standards for required open space set aside for all zoning districts
H-2.4: Work with community partners to stabilize and improve neighborhoods adjacent to downtown.
H-2 5:Target rehabilitation in neighborhoods that need assistance to mend and enhance the existing housing stock
H-2 6: Consider conducting an bi-annual market study to determine demand based housing and employment needs
H-2 7:Revise regulations and administrative procedures to ensure new residential and mixed-use development provides su�cient public open space, green space, and pedestrian connectivity.
H-2 8: Ensure new housing density complies with market demand recommendations from the 2022 housing market study
GOAL ONE: Continue to cultivate Fayetteville's distinct identity as a safe, welcoming city with attractive places to live; and highquality city programs and services
QL 1 1: Maintain property standards and enforcement to ensure that neighborhoods and buildings remain safe and livable
QL 1 2: Preserve Fayetteville unique character
QL 1 3: Maintain public infrastructure, buildings, equipment and open space that meets the demand of future community needs
QL 1 4: Support the vision of a community where everyone has access to the resources and opportunities needed to live healthy, active lives
GOAL TWO: Protect open space, natural, and sensitive areas
QL 2 1: Identify open space and sensitive areas that should be preserved for natural recreation areas
QL 2 2: Develop a plan to retain a variety of natural areas for use by Fayetteville citizens
QL 2 3: Foster dynamic, accessible public spaces and parks
QL 2 4: Provide a range of public spaces, programs, and facilities that meet community needs for recreation and leisure
GOAL ONE: Ensure coordination with state, regional, county, and local partners.
T-1.1: Participate in the Fayette County Transportation Plan.
T-1 2: Develop a more cooperative relationship with the Georgia Department of Transportation to help meet local objectives for state controlled roads
T-1 3: Participate in Fayette County Trails Plan in order to connect Fayetteville to larger countywide network
T-1 4: Pursue state and federal funding for community identi�ed transportation high priorities
T-1 4: Strategically locate and regularly maintain freight routes
T-1.5: Work with GDOT and other stakeholders to make SR 54 and SR 85 in the downtown more safe and pedestrian friendly
GOAL TWO: Maintain or enhance the quality of new and existing infrastructure
T-2 1: Prioritize projects that have the most impact to the most people
T-2 2: Compile and prioritize safety improvements based on accident data
T-2 3: Prioritize creating more of a grid street network and "complete streets" to ensure alternative routes
T-2 4: Prioritize projects that support a more walkable Downtown
T-2.5: Pedestrian improvements including crosswalks and signals.
T-2 6: Improved/additional way�nding signage
T-2 7: Promote connectivity of our road network to improve the quality of life in our residential neighborhoods
T-2 8: Require interparcel access in new development
T-2 9: Implements tra�c calming schemes, such as narrow travel lanes, on-street parking, mid-block crossings, and street trees to slow tra�c and increase safety for all modes of transportation
T-2.10:Design all new facilities and upgrade existing facilities to comply with all federal, state, and local safety standards.
GOAL THREE: Provide viable and attractive pedestrian facilities
T-3 1: Review and re�ne the City of Fayetteville Trails Plan
T-3 2: Identify and �ll gaps in the trail network Find opportunities for future trails, complete connections to existing segments, implement projects, and pursue new trail connections to create a more functional trail network
T-3 3: Improve the network of pedestrian facilities (sidewalks) by creating a safe and accessible network throughout the City Sidewalks of required widths, well-marked crosswalks and approved pedestrian-scaled lighting should be installed to create an inviting and well used pedestrian system
GOAL FOUR: Continue progress of making Downtown more walkable
T-4 1: Coordinate with Land Use Goals
T-4 2: Connect streets to create more of a grid
T-4 3: Utilize shorter blocks to increase walkability
T-4 4: Update Downtown commercial and mixed use zoning districts to enhance the pedestrian experience by creating scenic vistas and promoting street facing retail with store windows and sidewalk cafes
T-4 5:Develop a downtown streetscape plan
T-4 5: Add more parks and fountains that will enhance the pedestrian experience
T-4 6: Provide more downtown parking and signage for the parking
T-4 7: Create a detailed parking management plan and signage
GOAL ONE: Attract people to live here who: • Will appreciate the Fayetteville lifestyle which can best be described as: Active, Outdoors, Family- oriented, Embrace a sense of community, Educated workforce
E-1.1: Reconsider City standards for required open space set aside for all zoning districts.
E-1.2: Create a green ribbon of parks and trails that connects the entire city.
E-1 3: Support a healthy, diverse mix of businesses in Fayetteville
GOAL TWO: Develop a Downtown Plan to create a unique destination in Downtown Fayetteville
E-2 1: Work with consultant on economically feasible development strategies
E-2.2: Create a comprehensive marketing plan for Downtown.
E-2.3: Encourage buildings in walkable areas to be oriented to the street and have facades designed with abundant windows and human scale architectural features
GOAL THREE: Business Retention and Expansion
E-3 1: Create synergy with local businesses by communicating with existing businesses
E-3.2: Working together with the Fayette County Development Authority and Chamber of Commerce on business retention, expansion, and attracting developing the workforce local businesses need
E-3 3: Encourage educational enhancements to make Fayetteville the place to live for all school attendance zones (i e post secondary training and professional development opportunities)
E-3 4: Enhance the branding campaign
E-3 5: Encourage the creation (entrepreneur), retention, and expansion of local businesses
E-3 6: Encourage sustainable practices in locating, designing, constructing, and maintaining development in the city
GOAL FOUR: Enhance Commercial Corridors.
E-4 1: Encourage commercial redevelopment that o�ers amenities and atmosphere to attract top-tier commercial tenants
E-4 2: Identify underutilized properties (i e , buildings assessed at considerably less than the total property value) and, encourage redevelopment
E-4 3: Encourage structured parking and minimize surface parking, particularly adjacent to public rights-of-way
E-4 4: Prepare individual Small Area Plans, for each of the Activity Centers that clearly demonstrate the desired mix of uses, residential density, building intensity, design aesthetic, speci�c street locations and multimodal connections, infrastructure improvements, parking, and open space
GOAL FIVE: Encourage and facilitate broadband service throughout the city.
E-5 1: Consider adopting the model Broadband Ordinance
E-5 2: Consider becoming a Broadband Ready Community
E-5 3: Promote broadband as an asset and strength of the community for businesses and residents

This is the review of the Community Work Program from the next �ve years (2022-2026) This recognizes implementation actions the local government or other entities intend to take during the �rst �ve-year time frame of the planning period. This can include any ordinances, administrative systems, community improvements or investments, �nancing arrangements, or other programs or initiatives to be put in place to realize the plan goals.
The Report of Accomplishments immediately follows the Community Work Program and provides an overview of the status of Short-Term Work Program Goals that were previously established for the period 2017-2022.


Hire Economic Development Director to pursue the Comprehensive Plan Economic Development Goals of business retention and expansion, business attraction and recruitment AND the Land Use Goal of Improving the City’s property tax base.
Develop a City trails plan that will include identification of opportunities to provide connectivity between residential areas and other uses through multi-use trails/sidewalks and greenspace.


A number of key considerations contributed to the restructuring of the future land use designations adopted as a part of this update:
▪ Neighborhoods include a mix of housing types and choices at varying price ranges; with density and mixed-use at the center and lower density housing towards the edge
▪ Neighborhood Centers are strategically located at intersections to maximize access, visibility and economic viability These centers should include a range of commercial uses within walking distance of housing, serving the neighborhood primarily, but also serving existing, adjacent residential areas
▪ A single, prominent employment center, or Activity Center, serves as the major employment and revenue-generating specialized uses Activity Centers often have specialized uses and needs and may be dominated by a single user such as a campus.
In addition, a forthcoming zoning rewrite and small area plans will be the primary mechanism for implementing the Future Land Use Map
Updated Comprehensive Plan


Neighborhoods are not all the same - some are established, some are changing, some are emerging, and some are not yet built. The 2022 Update establishes the Neighborhood land use designation which is intended to identify residential areas that require attention to physical details, careful planning and connectivity. This plan focuses on stabilizing, nurturing, and reinvesting in distinct areas where deterioration has negatively a�ected their vibrancy and livability.
Speci�c goals and objectives have been incorporated into this plan to assist the city with adapting to the impacts of future growth and changes in the real estate market.
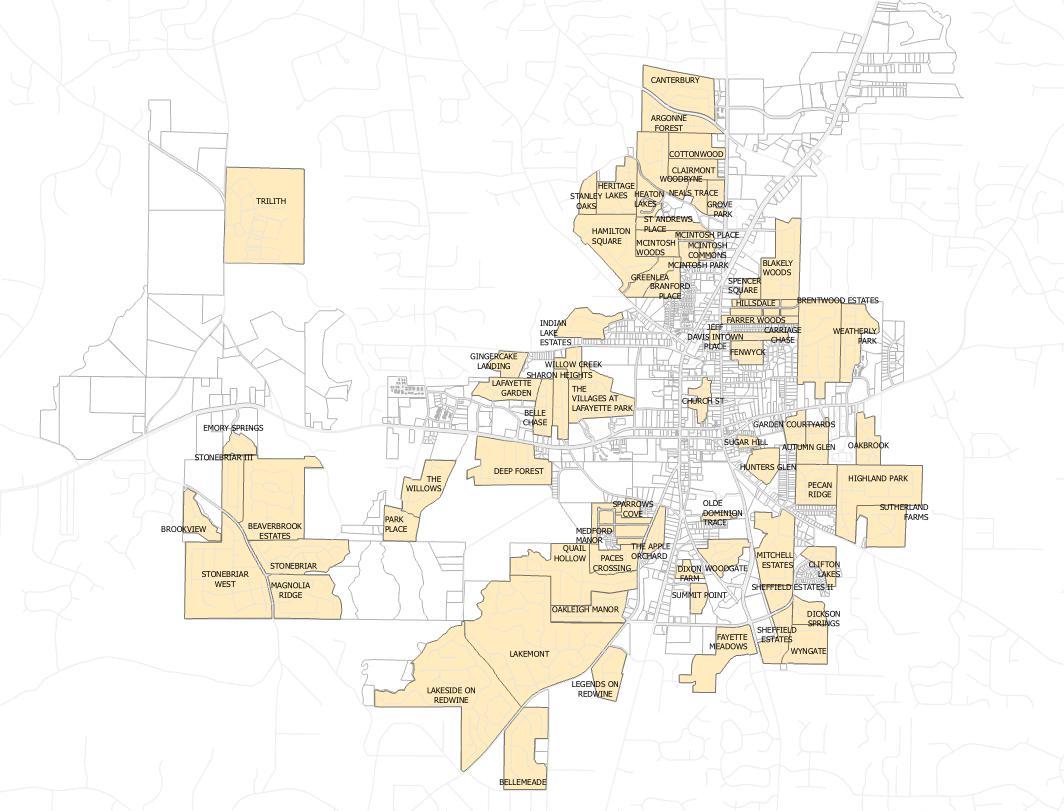

Neighborhood Residential 1 (Low, Medium, and High Single Family Detached)

Neighborhood Residential 2 (Single Family Attached, i.e Townhomes)
Mixed Residential (Multifamily )
Located throughout the city are neighborhoods with single-family detached homes on lots of varying sizes, with nearby uses such as retail centers, parks, recreational areas, places of worship and schools.
The Neighborhood future land use category is intended for single-family detached residential development and aims to recognize, maintain, support, and enhance the existing residential character of these areas. Future development within this land use category will primarily be single-family detached subdivisions that may include complementary uses such as public facilities and parks.
▪ Intended for single-family detached homes of varying architectural style


▪ Where in�ll opportunities exist, development density should be compatible with the adjacent neighborhoods scale and integrate character and neighborhood-de�ning features
▪ Buildings designed with a pedestrian scale
▪ Identify opportunities to increase walkability and connectivity with outdoor spaces, sidewalks and path system
▪ Include sidewalks on both sides of all internal streets
▪ Minimize the potential for incompatible land uses (e.g. high tra�c generators, noisy users, etc.) within or next to single-family neighborhoods.
▪ Encourage the use of landscape bu�ers and/or natural vegetation to mitigate the impacts that such land uses could have on residential neighborhoods.
▪ Prohibit higher density residential (e.g. duplexes, apartments) or high-density non-residential land uses (e.g. commercial and industrial uses) in single-family residential areas.
▪ Continue streetscape and infrastructure improvements in aging developments.
Land Use
Primary Uses
Recommended Zoning

Development Characteristics
Building Form
Mobility
Open Space
Primarily single-family detached (SF)
Small-scale civic/public uses
Places of worship
Parks/recreation/green space
R-70 R-40 R-30 R-15 R-22
Low-rise residential buildings with similar setbacks and lot sizes
Well-connected local street network supports walking, bicycling, and driving
Typically private yards and improved common areas
Located in three distinct areas: along or near Highway 85, North Je� Davis Avenue and Jimmie May�eld Boulevard, these moderate to high-density neighborhoods include a range of duplexes and/or attached units.

This land use designation is intended to allow for smaller single-family detached residences, duplexes, quadplexes, condominiums and townhouses. Public and institutional uses such as parks, schools or churches may also be built within this designation. The scale and height of revitalization projects and future development should be compatible with the surrounding community's existing and planned character which could include a mix of smaller single-family lots and/or a mix of attached residential. Regardless of the type and density of housing, there is a high standard of product provided. Neighborhoods should be well lit, with attractive landscaping, amenities, and aesthetics.
▪ Encourage new housing designs that are attractive and emphasize the structure from the street, rather than the garage.
▪ Where practical, new developments should be designed with vehicle access from a rear alley along with internal sidewalk connectivity throughout the development and to adjoining properties

▪ Encourage the construction of narrow streets in new neighborhoods and require sidewalks on both sides of all streets
▪ Minimize the potential for incompatible land uses (e.g. high tra�c generators, noisy users, etc.) within or next to Two-Family/Townhouse Residential areas. Where such uses do occur in close proximity, encourage the use of landscape bu�ers to mitigate the impacts that such land uses could have on residential neighborhoods.

▪ Plan for interconnected road and open space networks in new residential areas
▪ Identify opportunities to increase walkability and connectivity with outdoor spaces
▪ Discourage the use of cul-de-sacs in new neighborhoods whenever possible.
▪ Promote property upkeep and maintenance through e�ective code compliance
▪ Buildings designed with a pedestrian scale
Land Use
Primary Uses
Primarily small lot single family residential and attached residential
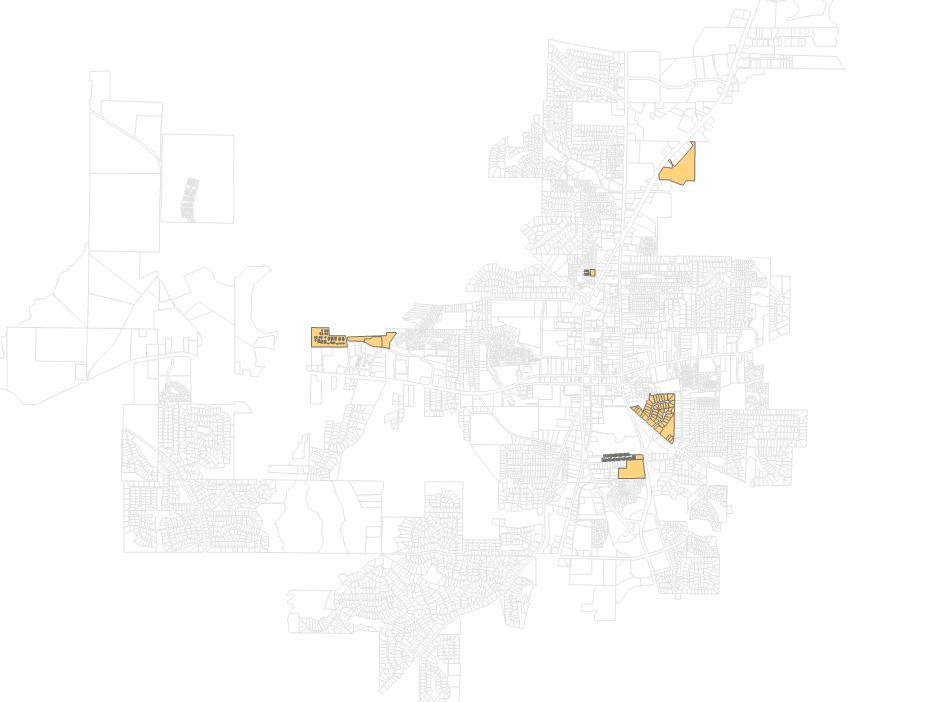
Recommended Zoning R-THC Residential Townhouse Condominium
Development Characteristics
Building Form
Mobility
Open Space
Single-family detached residential
Low- to mid-rise attached residential
Well-connected and dense street network and short blocks, encourage walking, bicycling and driving.
Privately owned, common space and small parks, greenways and open space
Primarily located along Lanier Avenue, the parcels with this land use designation are developed with a range of single-family detached and/or attached residential.


This land use designation is intended to provide a compatible variety of residential units as well as recreational and community facilities, with a focus on providing single-family detached as well as a variety of attached residential product (duplex, triplex, quadplex), multi-family residential, townhomes and condominiums along with public and institutional uses such as parks, schools and places of worship.
▪ Require residential developments to provide on-site open space areas and amenities


▪ Where practical, new developments should be designed with vehicle access from a rear alley along with internal sidewalk connectivity throughout the development and to adjoining properties
▪ Encourage the construction of narrow streets in new neighborhoods and require sidewalks on both sides of all streets
▪ Support the construction of "complete streets"
▪ Plan for interconnected road and open space networks
▪ Discourage the use of cul-de-sacs whenever possible.
▪ Link parking lots to building entrances by pedestrian walkways that are physically separated from vehicular movement areas
▪ Promote property upkeep and maintenance through e�ective code compliance
▪ Encourage the use of balconies, porches, stoops, garden walls, varied building and facade setbacks, varied roof designs, bay windows, and similar design features in new mixed residential project designs. In general, multi-family dwelling units should be designed so that they appear to be a grouping of smaller residential units.
▪ Promote architectural design that is compatible with the surrounding neighborhood including building and facade materials, building height, building bulk, setbacks, window and door styles and placements, roof designs and color scheme.
Land Use
Primary Uses
Single-family detached and attached residential
Recommended Zoning RMF-15 Multi-Family Residential
Development Characteristics
Building Form
Single-family detached Attached residential Mobility

Well-connected and dense street network and short blocks, encourage walking, cycling, and driving.
Open Space
Privately owned, common space and small parks, greenways and open space
BusinessPark
SuburbanCommercial

SuburbanOffice
PublicInstitutional (Schools)
WalkableMixedUse
The most signi�cant change in the 2022 Update is how the city classi�es commercial development. Studies show that allowing and promoting varying levels of activity within a development can promote pedestrian activity and business vitality along corridors and create a rhythm of development, which helps to segment the linear corridor into distinct areas that will create a greater sense of place.

NeighborhoodCenters
These areas encourage a mixture of small-scale commercial, low-intensity o�ce, restaurants, specialty retail, medical and service uses that cater to the surrounding residential neighborhoods.
ActivityCenters
Activity centers are often referred to as character areas and encourage a “holistic” approach to long-range planning by integrating the community’s vision and desires with actual land use patterns;
ActivityCenters:
• DowntownCore=DowntownMixedUseCenter
• North85Corridor-FayettePavilion
• MedicalCenter=PiedmontFayetteHospitalComplex
• InnovationMixedUseCenter-TrilithStudios/TownatTrilith
Neighborhood Centers are primarily located on major thoroughfares and near concentrations of existing or planned residential neighborhoods. Current developments and uses include smaller strip centers, shopping centers with grocery stores, storage facilities, o�ces, retail establishments, restaurants, and services.
This future land use category includes small-scale neighborhood supporting retail, o�ce and service uses which preserve the residential character through building scale, building appearance, landscaping and signage. With the proximity to the Downtown Core and adjacent residential developments, the neighborhood centers will include some in�ll. Mixed-use developments are envisioned to revitalize aging shopping centers and help bu�er the quieter residential neighborhoods. New development and redevelopment in these areas should be compact in form, with free-standing commercial structures and/or some vertical mixed-use structures. These areas should include a network of pedestrian-friendly and welldesigned streetscapes with a distinctive sense of place.
▪ Actively promote redevelopment of aging retail centers
▪ Transform parking lots into pedestrian-friendly parking plazas with bu�ered walkways, parklets and commercial pad sites
▪ Create pedestrian connections to the main building entrances and the adjoining sidewalk networks
▪ Encourage connected street grid network with small blocks and wide pedestrian walkways as properties are redeveloped
▪ Improve mobility within the shopping center and to nearby shopping districts by establishing streetscape hierarchy
▪ Strategically bu�er con�icting land uses such as residential areas and/or roadways with open space
▪ Create dedicated circulation for delivery vehicles to minimize con�ict between pedestrians and service vehicles
▪ Establish a consistent development pattern along the corridors by implementing design guidelines for building design and materials, sidewalks, landscaping and signage
▪ Require inter-parcel access between developments
▪ Encourage buildings to face the street and locate parking to the side and rear as retail centers redevelop
▪ Provide bicycle and pedestrian amenities, including covered walkways, benches, lighting and bike racks
▪ Reduce parking requirements and encourage adaptive reuse
▪ Consider the use of “build-to” lines and street-oriented customer entrances to encourage walking and neighborhood connections.
▪ Design buildings and sites for pedestrians not just automobiles.
Land Use
Primary Uses
Recommended Zoning

Development Characteristics
Building Form
Mobility
Open Space
Neighborhood-serving retail / commercial
Small-scale o�ce
Green space
For properties identi�ed as having strong revitalization potential, projects with smaller footprints should be considered with a mix of uses. There should be direct linkages between residential and commercial uses;
O-I O�ce and Institutional
C-2 Community Commercial
C-3 Highway Commercial
Low-rise retail structures with a walkable, landscaped public realm
Encourage safe and comfortable access by all modes of travel
Plazas, patios, and courtyards; landscaping and natural open space is encouraged


This master planned development includes Trilith Studios and the Town at Trilith, including a variety of detached and attached residential dwelling units, retail and commercial, o�ce, restaurant and internal amenities.


This land use category is intended to facilitate a carefully controlled mix of land uses which may include any combination of the following: o�ce, retail, restaurants, residential, community facilities, and highquality industrial that is compatible with neighboring uses. This category is also intended to encourage and facilitate the conservation of open land and other natural resource features
Land Use
Primary Uses
Mixed-use
Retail/commercial/restaurant
O�ce
Lodging
Hotel
Single-family detached
Apartments
Townhomes
Micro-homes
Parking garages
Indoor/outdoor event center
Recommended Zoning
Development Characteristics
Building Form
Mobility
Open Space
Create new zoning designation for areas within speci�ed activity node. This should permit a mixture of land uses.

Mid- or high-rise buildings with active ground �oors and building step backs on upper �oors
Encourage safe and comfortable access by all modes of travel
Improved open space is a key feature; many public and private spaces
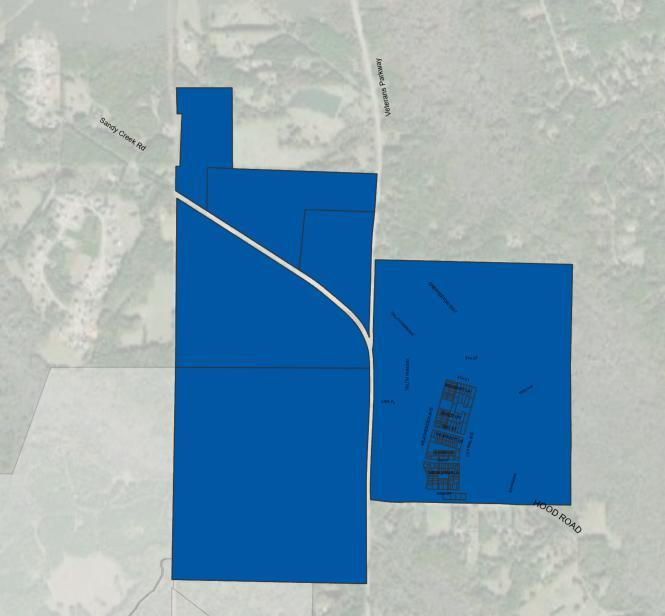
In accordance with New Urbanism principles, the master planned development will continue to adhere the following standards :
▪ The neighborhood, the district, and the corridor are the essential elements of development and redevelopment in the metropolis They form identi�able areas that encourage citizens to take responsibility for their maintenance and evolution
▪ Neighborhoods should be compact, pedestrian friendly, and mixed-use. Districts generally emphasize a special single use, and should follow the principles of neighborhood design when possible. Corridors are regional connectors of neighborhoods and districts; they range from boulevards and rail lines to rivers and parkways
▪ Many activities of daily living should occur within walking distance, allowing independence to those who do not drive, especially the elderly and the young Interconnected networks of streets should be designed to encourage walking, reduce the number and length of automobile trips, and conserve energy
▪ Within neighborhoods, a broad range of housing types and price levels can bring people of diverse ages, races, and incomes into daily interaction, strengthening the personal and civic bonds essential to an authentic community.
▪ Concentrations of civic, institutional, and commercial activity should be embedded in neighborhoods and districts, not isolated in remote, single-use complexes. Schools should be sized and located to enable children to walk or bicycle to them
▪ The economic health and harmonious evolution of neighborhoods, districts, and corridors can be improved through graphic urban design codes that serve as predictable guides for change
▪ A range of parks, from tot-lots and village greens to ball�elds and community gardens, should be distributed within neighborhoods Conservation areas and open lands should be used to de�ne and connect di�erent neighborhoods and districts.
The Medical Center activity center includes the Piedmont Fayette Hospital and adjoining medical buildings. Piedmont is a leading community hospital and one of the largest employers in Fayetteville with nearly 2,700 doctors, nurses, and other professionals. The activity center o�ers 24-hour emergency services, cancer care, health care, transplant center, women’s health, and more This area encompasses a contiguous area of land generally located around the intersection of the Veterans Parkway, Sandy Creek Road and Highway 54 West
The vision for the area is one of mutual compatibility and support among di�ering uses with people living and working in the community It includes a neighborhood that encourages people to live and work within the area and promote development that is consistent with, and transitions to, the established neighborhood scale Future development will create a center that is a walkable, multi-modal community with a variety of transportation options with enhanced connections and safe pedestrian routes.
• Establish new zoning designation for areas within a speci�ed activity node to permit a mix of land uses, similar to the Trilith development but at a smaller scale
• Maintain existing hospital as an economic anchor for the community and support the future growth of healthcare and healthcare related businesses
• Implement interconnected street grid network with small blocks and wide pedestrian walkways
• For new mixed-use developments, streets should include landscaping, pedestrian-scale lighting, and street furniture. Public gathering areas should be encouraged. Buildings should be limited to no more than three stories and should include facade variation and fenestration. Parking should be located to the rear or side of buildings
• Require inter-parcel access between developments and parallel access to the medical center
• Support the growth, stability and diversity of the residential communities by ensuring a continued mix of housing types
• Establish direct, pedestrian friendly circulation and crossing patterns that connect uses with trails and bicycle and pedestrian routes Provide pedestrian friendly crossings
Land Use
Primary Uses
• Medical o�ces and other medical-related uses
• Higher Density Residential
• Retail (stand-alone or ground-�oor as part of mixed-use development)


• Hotel
• Civic uses that support residential uses, such as schools and places of worship
Recommended Zoning Create new zoning designation for areas within speci�ed activity nodes. This should permit a mixture of land uses
Development Characteristics
Building Form Commercial, institutional, multi-family or mixed-use buildings
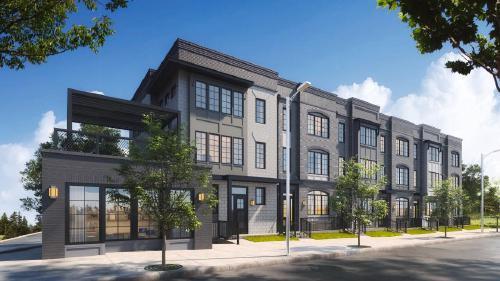
Mobility
Encourage safe and comfortable access by all modes of travel
Open Space Improved open space is a key feature; many public and private spaces
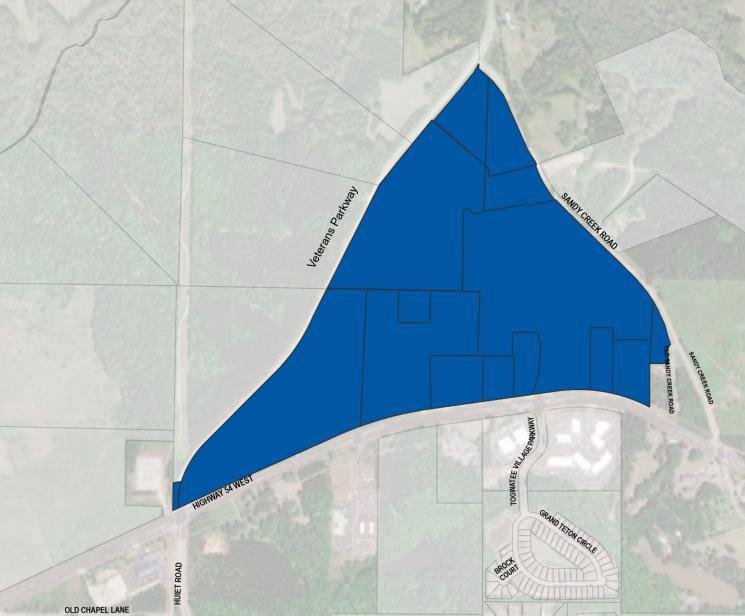
This Activity Center includes several existing commercial sites along North 85 and other areas with commercial land uses. The most prominent is the Fayette Pavilion with multiple big box retailers and supporting retail, commercial and restaurant uses. The corridor is easily accessible by car but not easily accessible to adjoining residential developments. Vacancy in the corridor is generally low but is burdened by in�ll retailers such as discounters, thrift stores and churches
A vibrant commercial corridor with a mix of aesthetically pleasing and well-maintained mixed use developments that are interconnected with each other as well as the adjoining residential developments.
▪ Actively promote redevelopment of the commercial areas and work with property owners to encourage higher occupancy rates and help maintain high occupancies rates through business retention and recruitment
▪ Reduce parking requirements and encourage existing retail centers to redevelop into mixed-use centers
▪ Reintroduce internal grid street networks along with pedestrian-friendly connections. Convert unused parking areas into pedestrian-friendly parking plazas with bu�ered walkways, parket, and commercial pad sites.
▪ Create pedestrian connections to the main building entrances and the adjacent sidewalk network
▪ Improve mobility within the shopping center and to nearby shopping districts by focusing streetscape improvements
▪ Strategically bu�er from or connect to adjacent uses of con�icting land uses, and open space, protect residential neighborhoods, and the highway
▪ Create dedicated circulation for large vehicles so that retail warehousing uses do not con�ict with improvements geared towards creating a pedestrian-friendly environment
▪ Establish a consistent development pattern along the corridor by implementing design guidelines for signage, sidewalks, and landscaping
▪ Require inter-parcel access between developments
▪ As shopping plazas redevelop, encourage buildings to face the street and locate parking to the side and rear
▪ Provide bicycle and pedestrian amenities, including covered walkways, benches, lighting, and bike racks
• Continue code compliance e�orts to maintain an attractive appearance of shopping centers and buildings
Land Use
Primary Uses
Shopping centers
Standalone retail uses
Personal services
Restaurants
Mixed use (including o�ce and ground-�oor retail/commercial)
Recommended Zoning Create new zoning designation for areas within speci�ed activity node This should permit a mixture of land uses.

Development Characteristics
Building Form
Mobility
Open Space
Mid- or high-rise buildings with active ground �oors and building step backs on upper �oors
Very well-connected street network with small blocks and highly walkable connections
Improved open space is a key feature; many public and private spaces


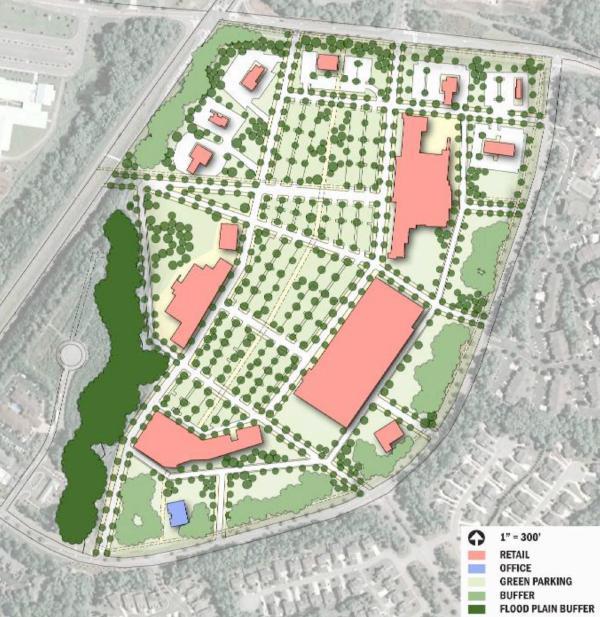
Land use within downtown are characterized by a predominance of institutional uses, single-family homes, and commercial/retail facilities Records indicate that much of the downtown core was constructed between 1880 and 1920. Since then the downtown has grown more modestly and consistently resulting in the development of previously undeveloped or underdeveloped areas along major transportation routes and redevelopment within the historic downtown square. Recent developments like the city center park has brought new life to downtown, and the two state highways present a challenge to the vision of a walkable, safe and pedestrian-friendly downtown
This land use designation is intended to encourage pedestrian-oriented retail, o�ce, service, community facility and residential uses. The vision for the downtown core is centered on pedestrian-oriented and walkable development where people living, working and visiting should be able to park their car and easily walk from place to place. The vision for the recent LCI Study centered around moving downtown Fayetteville Forward through catalytic and equitable placemaking, enhanced legibility of the built environment, and creative guidelines for sustainable developments
▪ Prioritize walkability and connectivity
▪ Require inter-parcel access between developments
▪ Develop a comprehensive sidewalk network to enhance safety, emphasize walkability in the street grid and pedestrian scale
▪ Improve zoning ordinance to permit a mixture of uses
▪ Use code to enhance pedestrian experience, and uni�ed streetscaping (improving aesthetics)
▪ Codify historic inspiration as a guide for new buildings
▪ Emphasis on placemaking/Downtown as a destination
▪ Add more parks, landscaping, and trees
▪ Emphasis on historic character and Identify in�ll parcels and ownership for redevelopment opportunities
▪ Create distinct character areas
▪ Establish Street Frontage Typologies, Improve Public Space Domains
▪ Adopt architectural design guidelines
▪ Adopt a Complete Street policy
▪ No new auto-oriented commercial developments
▪ Historic buildings originally constructed for residential use must retain their residential architecture regardless of the use or mix of uses
▪ All sites are designed for the convenience of pedestrians �rst and vehicles second


Land Use
Primary Uses
Recommended Zoning
Development Characteristics
Building Form
Mobility
Open Space
Shopping centers
Standalone retail uses
Personal services
Restaurants
Residential
Create new zoning designation for areas within speci�ed activity nodes This should permit a mixture of land uses.

Buildings are also designed with the convenience of pedestrians in mind All buildings have street entrances and the primary façade(s) and architectural treatments are street facing
Blocks are small and streets are interconnected in a grid fashion to the extent practicable. Streets are tree lined and sidewalks are wide.
Improved open space is a key feature; many public and private spaces

The use and enjoyment of outdoor spaces have long been a source of joy and quality of life for residents and visitors There are currently six (6) public parks, and the city is committed to enhancing these spaces to bene�t the general public.

This land use category is for land dedicated to active or passive recreational uses as well as green space and wildlife management. It is in this area that residents have an opportunity to connect with nature through activities that promote physical activity and healthy lifestyles. These areas may be either publicly or privately owned.
• Preserve and protect environmental areas that protect wildlife and vegetative resources
• Work collectively with surrounding and overlapping governments and non-pro�t agencies on the preservation and enhancement of woodlands and open space areas
• Identify opportunities for future open space in neighborhoods that are undersupplied in public recreation and open space opportunities.
• Enhance public access to parks and recreational facilities by making necessary infrastructure improvements.
Land Use
Primary Uses
Playgrounds
Public parks
Nature preserves
Golf courses
Recreation centers
Pedestrian and/or bike trails
Dog parks
Pavilions
Amphitheaters and similar uses
Recommended Zoning OS - Open Space

Development Characteristics
Building Form
Typically low rise recreation, maintenance and other support facilities
Mobility Along all street types; Encourage safe and comfortable access by all modes of travel
Open Space Open space is the primary element

Business parks are located along or in close proximity to major corridors, the existing developments include o�ces, warehouse space, and light manufacturing There are several acres of undeveloped land with this designation.
This category is for land dedicated to maximize the potential for job creation. This classi�cation is for land dedicated to o�ces, research and development, healthcare and education It will be supportive of other related uses such as hotels, restaurants, and small scale retail Business park sites will typically be over �ve acres and master planned to have easy internal circulation in a planned campus atmosphere
• Business park sites will typically be over �ve acres and master planned to have easy internal circulation in a planned campus atmosphere.
• Sites are clean, well landscaped, and heavily bu�ered.

• In general, business park uses will not generate signi�cant truck tra�c.
• New development should include appropriate landscaping and bu�ering elements including street trees, parking lot landscaping and perimeter screening
• Screening should be provided between incompatible land uses, especially residential uses
• Pedestrian connections should be established between developments and along roadways to improve the connectivity of the area
Land Use
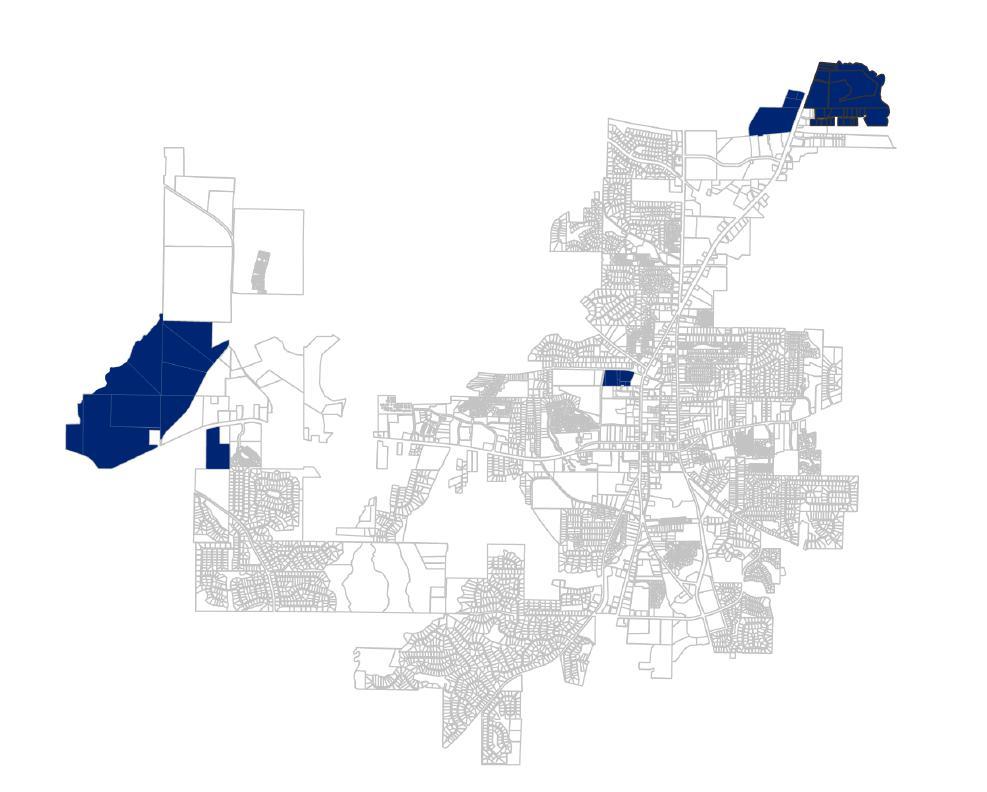
Primary Uses
O�ce and Institutional Medical O�ce Business Park
Recommended Zoning Business Park
Development Characteristics
Building Form
Mobility
Open Space
Architectural styles will vary, but site design will have a character similar to that of a college campus
Encourage safe and comfortable access by all modes of travel and pleasant pedestrian connections between buildings
Signi�cant greenspace is a key feature; many public and private spaces
There are limited industrial areas within the city and most are fully occupied The most recent development is located along Promenade Parkway.
Located to minimize impact on surrounding uses, the industrial classi�cation is for land dedicated to manufacturing facilities, processing plants, factories, warehousing and wholesale trade facilities, and any other uses with signi�cant truck tra�c or any use that has detrimental visual (or other sensory) impact that cannot be concealed by its building and landscaping Sites have a traditional industrial design and appearance
• Protect remaining industrial sites for signature opportunities.
• New development should include appropriate landscaping and bu�ering elements including street trees, parking lot landscaping and perimeter screening
• Screening should be provided between incompatible land uses, especially residential uses
• Pedestrian connections should be established between developments and along roadways to improve the connectivity of the area
Land Use

Primary Uses
Primarily light manufacturing
Research & development
Warehousing
Distribution
Processing plants
Wholesale trade facilities
Recommended Zoning Light Industrial and Heavy Industrial
Development Characteristics
Building Form Typical high-bay, single-story and large/ long manufacturing or warehousing buildings
Mobility Encourage safe and comfortable access by all modes of travel
Open Space Improved open space is a key feature; many public and private spaces
The Fayette County Public School System comprises 14 elementary, �ve middle, and �ve high schools, as well as an adult community school Along with the administrative o�ces, there are three schools in the city limits.

This area allows for the location of public and non-pro�t institutions, and organizations that provide regular services to and for the general public. This includes certain state, federal, and/or local government and institutional land uses. These are ideally located in areas distributed throughout the city with emphasis being on proximity to residential areas and areas with intense population activity during the day While most of these areas are generally envisioned solely for Public/Institutional use, there are times that these uses will be found in other appropriate character areas
• Strategic open spaces should be provided throughout the district that provide both passive and active recreational opportunities which could include parks, common gathering spaces, and gardens
• New development within the district should include appropriate landscaping and bu�ering elements including street trees, parking lot landscaping and perimeter screening, and building perimeter landscaping.
• Screening should be provided between non-residential and residential uses.
• Parking and service areas should be minimized where possible by locating the building prominently on the site with parking and service areas to the rear or side of the building
Land Use
Primary Uses
Educational facilities Churches
Cemeteries
Government uses such as city hall, government building complexes, public safety stations, libraries, post o�ces, community centers, senior centers, recycling collection centers, and recreation centers
Recommended Zoning Create new zoning designation for areas

Development Characteristics
Building Form Primarily o�ce and/or civic buildings
Mobility Encourage safe and comfortable access by all modes of travel
Open Space Improved open space is a key feature; many public and private spaces



APRIL & MAY MEETING COMMENTS


TOTAL ( WRITE IN ) ( WRITE IN )
APRIL MEETING = BLUE DOTS
MAY MEETING = ORANGE DOTS


September 15, 2022


The City of Fayetteville is fairly developed, but there are pockets of opportunity for new housing development to occur.


The map to the left shows existing concentrations of land use, with areas of opportunities for future development highlighted in red circles.
Higher density forms of housing such as apartments and townhomes, should be located near Downtown, Piedmont, and Trilith, where density is naturally higher and a mix of land uses join together. Additionally, senior living facilities and apartments should be located along heavily trafficked corridors for visibility purposes.
Lower density housing such as single family subdivisions and estate lots can be located near the City's edge where density is naturally lower and existing residential homes are more spread out.
SOURCE: Noell Consulting Group, Google Earth Fayetteville Trilith Piedmont Downtown




Up
50 through 2026, though price band is comparable to conventional MF flats shown below, so demand can be reallocated from flats.
Estimated at 400 units of additional demand beyond the current pipeline (Walton and Meridian) through 2026.


The City is located in Fayette County, within the Atlanta-Sandy Springs-Roswell Metropolitan Statistical Area (MSA). The Atlanta MSA includes 29 counties, with ten central counties belonging to the Atlanta Regional Commission (ARC) and forming the core of the MSA. Roughly 78% of the population of the MSA lives within this ten county core. From 2000 to 2010 only 67% of all growth occurred in this ten county core, however, since 2010 roughly 85% of all growth has occurred in this ten county core as younger and older generations increasingly seek walkable neighborhoods, both in urban and suburban areas. Fayette County had considerable growth from 2000 to 2010 with an annual growth rate of 1.6%. Since 2010, the County has experienced a positive growth rate of 1.0% although slower as in previous years as some cities in Fayette County, such as Peachtree City, have slowed construction. However, the story for the City of Fayetteville is more positive. The City of Fayetteville outpaced many of the fastest growing counties, from 2000 to 2010, with 3.6% annual growth. Since 2010, The City's growth rate is still strong and has outpaced all counties in the MSA except for Cherokee County from 2010 to 2020 with an annual growth rate of 1.7%.


The City of Fayetteville is located in the center of Fayette County. Historically, Fayetteville was predominately an agricultural area of cotton fields with sprawling homes on large acre lots.


Recently, Fayetteville has worked to restore the historic streetscape and Downtown country charm, while still welcoming new residents and businesses.
SOURCE: Noell Consulting Group, Google Maps

 Exhibit 5
Primary Market Area


The map in this exhibit shows the total inbound migration flows for Fayette County, Georgia utilizing 20152019 5-Year American Community Survey (ACS) Data. The leading out of market states are New York and Virginia representing retirees that are largely settling at locations closer to children and family. The county is very diverse with 67% local migrants with 23% of migrants coming from out of state or abroad. Naturally, most of the local migrants come from neighboring Walton County, Clayton County, and Fulton County --with in-Fayette same county migration at nearly 35%.


In this exhibit NCG looks at the inbound migration data for the census defined City of Fayetteville. The graph on the left shows where people who moved to the City are coming from. For those who are new to market, those aged below 55 largely originated in other Georgia counties. That trend declines with the three age tiers from ages 55-60 and reemerges at the 65 and up age group. Among those three groups, intra-county migration was the most popular. Migrants from abroad were more heavily leaving ownership positions (59%) and migrants from other states were in a very similar position, 60% ownership positions. However, persons moving within Fayette County showed a heavy distribution of renters, 74% renters, over homeownership, 26%, who had moved within the County. Current residents in Fayetteville skew toward owning, 73%.
SOURCE: Noell Consulting Group, US Census Bureau


Bachelor Degrees
2010 Census
Bachelor Degrees

2019 5-Year ACS


The maps in this exhibit show the change in the population, per census tract, aged 25+ that have obtained a bachelor's degree or more using the 2010 Census and 2019 5-Year ACS (American Community Survey) data. Historically, college educated individuals in Fayette County have been concentrated in the west and south west near Peachtree City and Tyrone, but over the past few decades college educated individuals have been pushing west increasing the educational attainment in Downtown Fayetteville, and Fayette County, as a whole. This surge is primarily due to many people being priced out of more established neighborhoods to the west. NCG believes, based on available data, educational attainment will continue to growth in the coming years.

SOURCE: Noell Consulting Group, Social Explorer

The maps above show the change in median household income above per census tract within Fayette County. Downtown Fayetteville shows an average median household income of $52,700 to $83,500 in 2019. There has been increases in median income throughout the city with concentrations of high-earning households to the west and south. There is a massive cluster of high earning households to the south and west of Fayette County which is predominantly family/empty nester homeowners who want to live close by one of Fayette County's highest rated schools.


SOURCE: Noell Consulting Group, Social Explorer


The above maps show the change in median home value of owner-occupied housing. Downtown Fayetteville stands out slightly with a 4% decrease in median home value since 2010. Further, the combined median home value of Downtown Fayetteville is 30% less than the Fayette County median home value of $281,400. While Downtown has some varying home values depending on the side of town you are on, the highest home values are concentrated to the west, in Peachtree City and Tyrone, as well as south of the city. The disparity can be attributed to a deficit of new housing being built in Downtown Fayetteville, as well as Peachtree City being an alternative solution to Downtown living.


SOURCE: Noell Consulting Group, Social Explorer


Change in Family Households
Married-Couple Family Households With Children
2010 Census
Married-Couple Family Households With Children

2019 5-Year ACS


The above maps show the percentage of households, per census tract, that consist of a married-couple family household with children under the age of 18. Downtown Fayetteville showed 22% of this household type--a 15% decrease since 2010. A number of factors play into decreasing family households, such as aging population, younger families being priced out, better schools being located in Peachtree City, etc. but a more plausible explanation is that as the children leave the household and go to college, the parents then become empty nesters. As you will see later in the analysis, the population aged 18-34 is increasing as well as the over 55 population which confirms the exodus of 18 year olds from Fayette County to college.

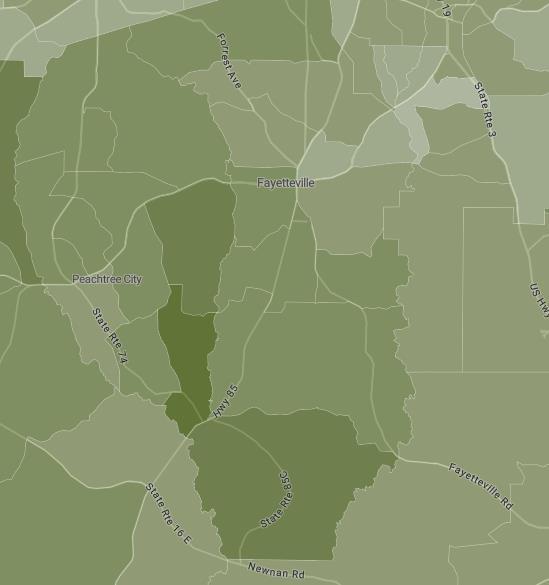
SOURCE: Noell Consulting Group, Social Explorer


Age: 55 + 2010 Census
Age: 55 + 2019 5-Year ACS


The maps above show the concentration of the population, per census tract, aged 55+. Downtown Fayetteville's surrounding community has seen an increase in population of people over 55 years of age. Since 2010, the tracts containing Downtown Fayetteville have seen the 55+ population grow more than 10% - consistent with the steady growth seen in neighboring areas. Peachtree City has seen a significant concentration and growth of residents aged 55 and over. This bodes well for Downtown Fayetteville as these persons are strong candidates for a downsize value play.
SOURCE: Noell Consulting Group, Social Explorer


Age: 18-34 2010 Census
Age: 18-34 2019 5-Year ACS


This exhibit examines age of residents as of 2019 to examine the growing number of 18-34 aged cohorts in a given area. Downtown Fayetteville has seen an increase of younger demographics in the southern area of the City and a decline in younger populations in the northern area of the City. The shift in age is predominantly due to great schools being located to the west by Peachtree City and South of the City, as well as job cores for younger demographics located to the west, Trilith Studios and Piedmont Hospital, and manufacturing jobs to the east/north of the City.

SOURCE: Noell Consulting Group, Social Explorer


Proximity to work is a key factor for residents choosing where to live. There are over 33,000 jobs paying at least $40,000 per year within 10 miles of the study area. The most popular sector within this area is educational services (15% of jobs) followed by Health Care and Social Assistance (12%) and Manufacturing (11%.) You can see the majority of jobs are concentrated along Highway 74 through Tyrone and Peachtree City, as well as Highway 85 through Kenwood and Downtown Fayetteville. The Downtown being farther away from the I-85 corridor that houses major job centers, such as the Airport, is a hindrance to the City and has lead to the exponential growth of Tyrone and Peachtree City. However, with new commercial development, Downtown Fayetteville will be able to provide more local employment options.
Density of Jobs over $40k/year within 10 miles of Downtown Fayetteville (2019)
-
SOURCE: Noell Consulting Group, Google Maps, OntheMap, Gwinnett County


Fayetteville employs 14,310 people in the city limits. The largest employment sectors within the city are Healthcare and Social Assistance, followed by Construction and Public Administration. The City is broken down into Construction/manufacturing/warehouse jobs concentrated to the east and north, medical and technical jobs to the west, and public administration jobs concentrated in Downtown.

Roughly 41% of City employees earn more than $3,333 per month or $40,000 annually, 31% earn between $1,250-$3,3333 a month ($15,000 - $40,000 annually), and 28% earn less than $1,250 per month ($15,000 annually). Of the 14,310 employees, 13,609 live outside of Fayetteville's limits and commute in, pointing to what could be a lack of housing options for employees nearby. 701 Fayetteville residents live and work within the City, and 6,759 of residents commute out of the City for work.
4.9% of total employees live and work in Fayetteville compared
SOURCE: Noell Consulting Group, Google Maps, OntheMap, Gwinnett County

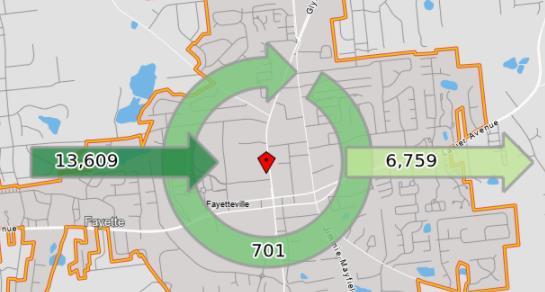


 Downtown
Fayetteville
Fayetteville Pavilion


Commuting patterns of residents can help identify target audiences for residential development. While residents making over $40k/year within a 4-mile radius work all over the metro Atlanta area, the highest concentration (12%) work at the Airport. A substantial amount work in nearby cities Fayetteville (8%) and Atlanta (5%).

SOURCE: Noell Consulting Group, Google Maps, OnTheMap


In the previous exhibit we looked at where residents of Fayetteville work. This exhibit shows where people who work inside the Fayetteville limits are commuting in from.

The majority of jobs paying more than $40k/year in Fayetteville are in the healthcare or public administration fields. Roughly 17% of people who work within 4-miles of Fayetteville are already living close by and within the city. Another 12% of workers live nearby in Tyrone, Peachtree City, and Jonesboro.


As the chart points out, Fayetteville is a central location where the majority of workers in a 4 mile radius South of I-20 prefer to live.
Top 10 Resident Locations (By Zip Code)
SOURCE: Noell Consulting Group, Google Maps, OnTheMap


The heat map within this exhibit shows area crime in relation to the City (provided by Crimegrade.com). The majority of crime in the City of Fayetteville occurs in the east side of the city and east neighborhoods. However, this pales in comparison to the amount of crime occurring in more established areas of Georgia, such as Atlanta, as well as some areas of Georgia similar to the Fayetteville area, Marietta and Douglasville, and those cities south of I-20 such as Stockbridge, McDonough, and Newnan. A low crime rate is excellent for future families moving to the area who want a safe place to raise a family.
SOURCE: Noell Consulting Group, Crimegrade.com
 Fayetteville
Atlanta Douglasville
Stockbridge McDonough
Newnan


The map in this exhibit is a traffic map showing commute times via automobile in and around the Fayette County area per data from Google Maps. The City of Fayetteville's proximity to I-85 and I-75 hinders the location slightly, hence why other cities such as Newnan and Peachtree City have grown considerably given their good interstate access. However, Fayetteville is still within adequate driving distance to major employment cores such as Hartsfield-Jackson Airport, South Atlanta, and along I-85 and I-75 which are only 7- 13 miles (15-20 mins) away. Further, as seen previously in the work inflows map we see that the majority of workers live in the cities highlighted above as well as work locally within the city or commute to the cores listed above.

SOURCE: Noell Consulting Group, Trulia.com


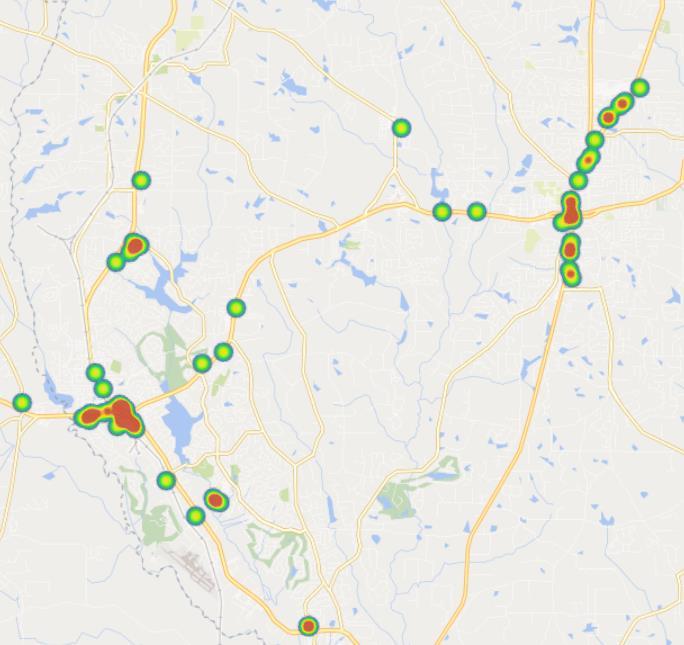







Living close to restaurants and bar options is a key factor for many households when choosing where to locate, as well as for businesses when choosing office space. The heat map within this exhibit shows restaurant and bar options near the City that have been reviewed by users of Yelp.
There are more than two dozen dining options and bars in Downtown Fayetteville. Although the majority of dining options in Downtown are chain restaurants, there are some more boutique options such as Line Creek Brewery and City Cafe and Bakery. Farther west there are more options. geared towards a fancier dining experience at Trilith Studios. Farther west is Peachtree City which has a plethora of dining options from Breweries like Line Creek to Ted's Montana Grill.


In terms of walkability, there are some restaurants within walking distance to Downtown, however most are accessible with a short drive. Although Downtown is well served, it will be important for the city to allow more unique infrastructure, like breweries or a dog park with beer and food. To the extent this can be maximized, the stronger the appeal of Downtown Fayetteville being seen as a lifestyle amenity that many residents coming from the north seek.
 SOURCE: Noell Consulting Group, Yelp, Bing Maps
PEACHTREE CITY


As with restaurants and bars, living close to retail and grocers is an important factor to residential households when choosing where to live and to an extent, office decision makers when choosing where to locate their business. By pulling Yelp data from the area we are able to visualize where key retail and shopping nodes are in relation to the City.
The largest retail corridors in Fayette County are located in Downtown Fayetteville and Peachtree City. Downtown Fayette offers a lot of shopping/retail options from large chain stores like Dick's or JCPenney as well as many grocery options such as Kroger and Publix. Peachtree City has many of the same offerings as well as some more boutique shopping/grocery options, such as Sprouts.


All in all, the level of retail/shopping is more than suitable for the area. Future development ideas would be to add higher level shopping and retail to the area such as a Sprouts as the median income increases.


SOURCE: Noell Consulting Group, Yelp, Bing Maps


 FAYETTEVILLE
 PEACHTREE
FAYETTEVILLE
FAYETTEVILLE PEACHTREE


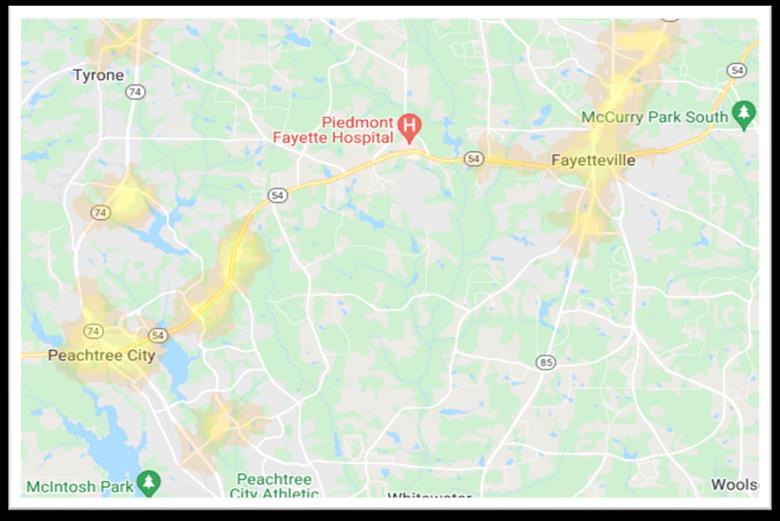
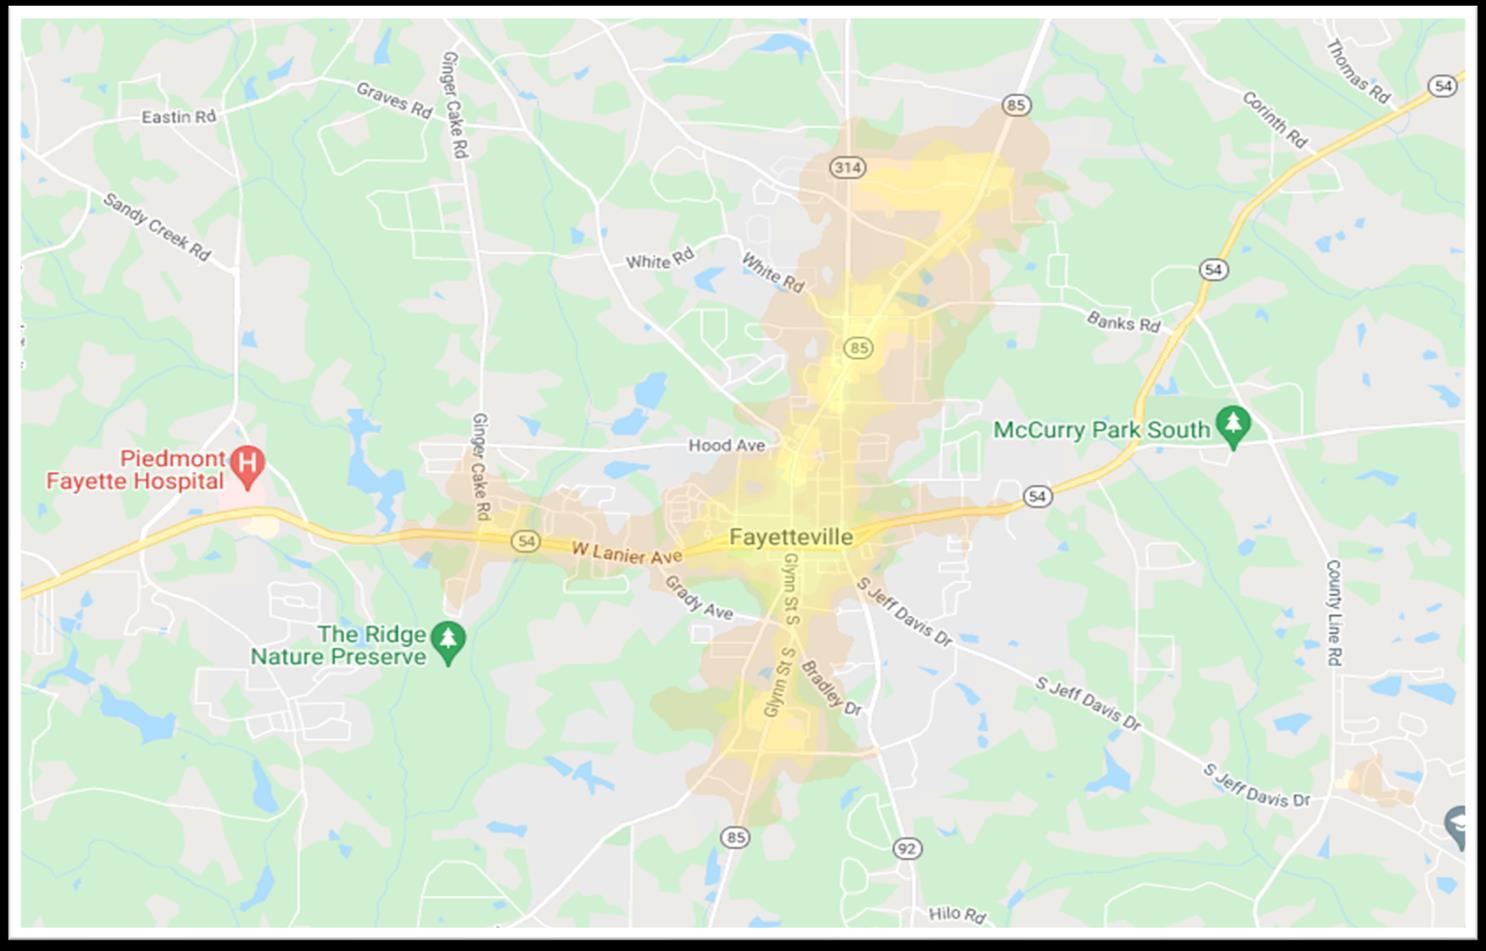


Walkable environments are key to economic competitiveness and creating healthy communities. Increasingly, Millennials and seniors are looking for walkable environments, with studies showing 80% of 18 to 34-year olds want to live in walkable neighborhoods and per AARP surveys roughly 60% of those over 50 want to live within one mile of daily goods and services. Christopher Leinberger of George Washington University completed a study of WalkUPs (Walkable Urban Places) throughout the nation, including Atlanta, and discovered that office, retail, and rental housing achieved 30%, 144%, and 12% premiums respectively over their drivable, suburban counterparts. Furthermore, a study completed by the Wall Street Journal indicated a 1.69% premium in home prices for a one-point increase in Walk Score. The City of Fayetteville is "Somewhat Walkable" according to WalkScore with much of the area still being dependent on vehicles to access grocery/retail/entertainment. However, foot traffic is still active in the area as shown by the white lines on The Strava map, Top Right map, Peachtree City's walkscore is very similar to the City of Fayetteville yet they have an infrastructure that allows golf carts to take presence over foot travel. To increase the Walkability of the City of Fayetteville, the city could invest in more sidewalks as well as nature trails to increase foot traffic to the area which will be a major draw for empty nesters as well as younger audiences.
SOURCE: Noell Consulting Group, WalkScore, Strava


3/18/2022


North Fayetteville Assigned Schools
South Fayetteville Assigned Schools


This exhibit presents context with regard to the local school offerings in the City of Fayetteville, the north city limits and south city limits are separated out. Downtown Fayetteville's assigned elementary, middle, and high schools rank above average in quality. After market interviews, the highly rated schools are a major draw to younger families coming to the area and buying in the Downtown area, though this face should not turn off prospective family buyers with older aged children or emptynester/downsizer audiences not affected by the assigned schools.
SOURCE: Noell Consulting Group, Great Schools


Fayetteville captures roughly 17% of Fayette County's population, with a 2022 census estimate of 18,853 persons and 7,194 households living in the city. Fayetteville has a smaller population in comparison to similar Atlanta suburbs including Newnan, Peachtree City, and McDonough. Fayetteville's population is fairly diverse across age, race, and income cohorts. While being historically more rural than suburban analogs, recent development activity and housing market trends have fueled growth in Fayetteville.
Source: NCG, US Census Bureau, Spotlight by Environics Analytics


Exhibit 26
City Demographic Profile and Change
2010, 2022, and 2027
The City of Fayetteville has steadily grown since 2010. Based on 2027 census based estimates, the strongest growth will have occurred from 2010 - 2022 with an 18.2% population increase, or just over 1.5% per year.
That growth primarily came from increases in the population aged 18 - 34 and 55 - 85+, and the Black/African American and Asian populations. This points to a growing number of young singles and professionals as well as empty nesters and retirees - many of whom will require greater variety in housing products.
Decreases in the population age 5 - 17 and 35 - 54 indicate there are fewer families with young children in Fayetteville, again signaling a need for a variety of housing products
Source: NCG, US Census Bureau, Spotlight by Environics Analytics


The City of Fayetteville has seen very strong growth among all age and income cohorts, outpacing the rest of Fayette County in almost all categories. Fayetteville has grown by approximately 3,080 households from 2000-2022, and currently has 7,194 households in the city limits. The city's growth is primarily fueled by increases in households aged 15-24 and 55+ and households who earn more than $100,000 annually. This growth in affluence has contributed to growth in development of large single family homes, but growth in other household incomes and ages should also be supported by growth in diverse housing product and options.
Source: NCG, US Census Bureau, Spotlight by Environics Analytics


Of the 7,194 households in Fayetteville, roughly 29% or 2,077 are renter households. Of the renter households, 34% of them earn less than $35,000 a year, 24% earn between $50,000$75,000, and 29% earn more than $75,000 annually. Households earning less than $35,000 annually are likely renting due to income restrictions and a lack of affordable housing options, but there is a strong share of renters who could afford to own but choose to rent. Renters are split fairly evenly amongst household type (singles, married couples, and other family), and age distribution (25-34, 35-44, and 45-54).
SOURCE: Noell Consulting projections based on data obtained from the US Census and Claritas, Inc.

Description
Professionals working in the area seeking a lifestyle and easy access to employment and entertainment.


Singles over 35 seek convenience in quieter setting. Many have relocated to the area for work and may choose to rent before buying.


Couples mostly in their 30s, with some late 20s and early 40s. A mix of recently married and dating. May be recent relocatees.
Mature couples and empty nesters. Established and seeking home close to work and in the suburbs.


Use unit as crash pad and place to unwind. Often more active/out and about. Trade space for less rent. Appreciate well-executed building amenities.
Tend to stay in more than younger counterparts. More likely to cook and host. Value space, quality, but not excessive finishes, and functional unit layouts.
Eat-in more often, but still enjoy going out. Tend to stay local. Value amenities, and have friends over on a frequently.
A true home. Eat-in most nights and host friends on a regular basis. seek spacious kitchen and living areas. Often down-sizing and need extra storage.
New parents and those with young and early school-aged children. Some single parents working in the area.
Students, recent graduates, and working roommates who moved our of their parents homes or are new to the area for jobs and school.
Seeking space and functionality. Values finish levels and amenities but will make trade-offs for price.
Most space for the money and keeping absolute rents lower. Larger floorplans with a minimum of 2BRs.
Seek areas with a trendy local perception and proximity to entertainment, employment and retail. Downtown core and Trilith only areas in the County that feature this.
Value proximity to employment and retail, but will generally prefer quieter neighborhood areas.
Can afford higher end product with dual incomes, will likely be saving to buy a home in the future. Often look for more spacious product types.
Many will rent units while waiting for homes to be built, but a growing segment is choosing a rental lifestyle.
Typically either temporary renters who want space for a growing family while waiting to build/buy, or lack financial means to purchase.

Limited by higher rents in newer Class A, but still a small audience.
Summary: The City of Fayetteville's diverse renter audiences lead to the potential support for a variety of rental product types, beyond the predominately conventional rental flat communities already in-place or in the coming pipeline. Consideration should be given to rental TH/villa, and/or 55+ rental communities.
SOURCE: Noell Consulting Group


There are approximately 5,117 households, 71% of the total households, who own their housing units in Fayetteville. Of the owner households, 25% earn less than $50,000 a year, 33% earn between $50,000 - $100,000, and a solid 41% earn more than $100,000 annually. Most home owners are married couples, between the ages of 45-64, and earn over $100,000. There is a strong share of singles and households aged 25-34 who also own homes in Fayetteville.
Description
Young and mature professionals seeking access to employment and entertainment. Often more active/out and about. More willing to trade space for price. Often between the ages of 20-35, and many coming out of apartments nearby, or graduating and coming back to where they grew up and looking to purchase their first home at an affordable price.


Typically fairly affluent dual working couples, primarily 35-45, value both work access and neighborhood quality. Most likely first time home buyers ready to settle in the suburbs, or looking for the best value home for a decent price. Often coming from rental communities in the City, as well as out-of-market move-ins.
Mix of first-time and moveup buyers from existing product in the market, or relocates from out of market. Looking for a home that offers room to grow as the family expands. Will be concerned with school districts, neighborhood safety, and where other young families are located.
Established families with older children and teenagers. May include some executive households and corporate employees, or divorced households and single parents. Likely upgrading into larger homes or moving in from out of market.


Mature couples who are either looking to simplify lifestyle with smaller homes, or upgrade to accommodate grandchildren and family visitors. Most likely to purchase homes in presale phases or build custom dream homes to retire in.


Retired senior couples and some widows who are looking for a maintenance free lifestyle but don't want to leave the area. Will appreciate quality and may have money from prior home sale to spend, but will be modest in spending retirement incomes and likely to downsize.
Citywide we believe Fayetteville has a lack of product diversity, with an estimated 90% being conventional single-family homes and/or estate homes. This leaves very little opportunity for those looking for lower price points, maintenance-free products, and/or homes in a more walkable lifestyle option. An estimated 50% of the market audiences have the majority of their preferences being non-typical SFD products, leaving a significant market gap. Also worth noting is that many of the under represented housing products are more dense, helping to justify higher land prices and smaller parcel sizes which is a majority of the undeveloped land in the City, but also helping to keep absolute home affordability.

Fayetteville Household Projected Growth Next 5 Years by Age and Income, 2022 - 2027

High -Decreasing opportunity for the private sector to hit these price points without subsidy
Medium - Moderate ability for the private sector to deliver this product without subsidy
Low -Strong ability for the private sector to deliver this product without subsidy
Without the ability for new housing stock to hit the potential demand levels, particularly rental product below $800 and for-sale product below $200,000, demographic projections forecast a loss in households earning less than $75,000, and the majority of future growth is projected from those earning greater than $100,000 through 2027.
While much of the new apartment development is obtainable for those earning above $75,000, land and constriction costs are making it harder for those earning under $75k, and especially under $50k to rent in the community, making renter households earning $25-35k the most at risk. Garden apartments represent the best market based opportunity to solve this, or relying on LIHTC subsidized deals.
New single-family homes are generally obtainable for those earning above $150,000, but it is largely only townhome and/or condominiums that are affordable to those earning $75-150k. Increasing land and construction costs are making it considerably harder for those earning $75-100k (often young singles/couples and starter families) to purchase. This makes those in the estimated 113-150% AMI levels ($75-100k) the most at risk. Starter townhomes, including one bedrooms and those without garages to maximize affordability, represent the best opportunity to solve this.
SOURCE: Noell Consulting Group based on data obtained from US Census and Claritas.


Based on existing households and current tenure and turnover patterns (Census), the demand for affordable, subsidized for-sale units from households earning $75-100k, or approximately 120-150% AMI based on 2-person households is 52 units per year. Typically affordability for these households is for homes in the $225,000 - $300,000 range. For affordable subsidized rental units, the demand potential for households earning $35-50k, or approximately 60-80% AMI, is nearly 80 units per year.
SOURCE: Noell Consulting Group based on data obtained from US Census and Claritas.

 BRANCH PROPERTIES, LLC
LAUREL ISLAND MARKET ANALYSIS


227,550 Permits Below Historic Average from 2008 to 2020
Atlanta Metro Home Ownership Rate
4Q Rolling Avg
Since 1990 Metro Atlanta permitted roughly 41,554 units annually peaking right before the Great Recession in 2004. Since the Great Recession permitting activity has been slow to recover despite substantial job and population growth. From 2001 to 2007 there were 0.55 permits per job, from 2011 to 2020 0.39 permits per new job. While some of this has been oversupply of housing being absorbed into the market, historic lows in for-sale vacancies indicate a lack of supply emerging over the last few years, inflating prices and resulting in a serious lack of affordable product today. This housing crunch can be seen in home price appreciation in many Atlanta suburbs and particularly in the city of Atlanta where demographic preference trends saw households flocking into the city and muted new inventory.
Based on historic levels since 1990 the metro has underdelivered roughly 230,000 homes since 2008. Even since the recovery years of 2011 to 2020 the metro has lagged behind historic building activity, with a potential 122,171 units missing when measuring historic population growth to total permit activity. All these metrics indicate a market that has been severely undersupplied, particularly in desirable suburban and intown Atlanta locations where entitlement challenges, local opposition, and costs of construction have often limited new product delivery. This has forced many households into less established areas.
Additionally, since peaking prior to the recession, the homeownership rate in the Atlanta metro has declined with renters making up a larger share of households with this trend much more pronounced in the city of Atlanta. After bottoming out in 2015, homeownership trends at a metro level began to slowly reverse and have picked up steam with historically low mortgage rates in 2020. That said, a lack of inventory post COVID has resulted in the rates again declining.

Limited new supply compared to historic averages has led to recent lows in active residential listings according to the Georgia Multiple Listing Service (GAMLS). The metro has seen negative growth in listings through out 2020 and 2021.
With limited supply coming to market and strong demand for housing, particularly in dynamic urban and suburban environments, home values have seen a sharp increase since bottoming out in 2012 and continue to reach all time highs. According to the Case-Shiller Home Price Index of Atlanta, which measures repeatsales, home values have increased 16.6% on average year over year in 2021 despite the ongoing pandemic.

This exhibit expresses the change in home values as a percentage increase/decrease from the previous year based on the Case Shiller Index. It then uses a historic correlation model based on annual job growth versus the home price index change (historically an approximate 70% correlation from 1996-2019) to forecast what will happen with home prices going forward as a result of the COVID recession and forecasted recovery. Based on the current recession due to COVID-19, one would have expected the Case-Shiller index to drop, but it in fact surged as those of means continued to buy despite the pandemic, and limited supply continued to push pricing to record levels. Going forward we forecast the market will come back to a more normalized state of supply/demand balance, however strong forecasted job gains, and potentially still supply constraints with the cost of lumber, is likely to result in strong continued growth of the index and thus home prices through 2025.
SOURCE: Noell Consulting Group, US Census Building Permits Survey, Moody's/Economy.com, Zillow


The metro Atlanta for-sale market has experienced a strong recovery since the great recession, but has struggled with supply shortages since early 2013. Below we show new home closings as they relate to job growth, and over the 2011-2021 timeframe 36.2 new homes were sold for every 100 jobs that were added at the metro level. That said, the COVID-19 pandemic has created a recession resulting in job loss of over 150,000 jobs in 2020, but with a strong rebound occurring/forecasted to continue in 2021-2022. That said, 2020 did not act like any previous recession, with home sales still hitting highs not seen since before the last recession as those with means still purchased. That said, increasing construction costs and market concerns for how long the pandemic would continue (along with concerns for potential repeats) resulted in some cooling of sales in 2021 (a 7% drop in volume). Strong job gains in 2022 should result in a strong year, but then we expect decreasing job gains will start to cause the market to cool off through 2026.
SOURCE: Noell Consulting Group, MetroStudy and Economy.com | Moody's Analytics

Prior to the great recession, attached product accounted for 16%-17% of all new home sales, however, during the recession and the following recovery period attached product sales rose into the 20%-23% range as new unattached product sales plummeted and large condo buildings, delivering during the recession, had product scooped up by investors / speculators and/or sold in distressed situations. Attached sales have slowly increased as a percentage of new sales since bottoming out in 2015, largely driven by townhome development, as people seek relative affordability in quality locations. As the Atlanta metro and its suburbs mature, we project this number to increase, averaging 22.6% of new sales over the next 5 years.
SOURCE: Noell Consulting Group (based on surveys of properties)

SOURCE: Noell Consulting Group and MetroStudy

The Outside the Perimeter (OTP) submarket including popular core areas such as Smyrna, Roswell, Alpharetta, Forsyth among others has consistently captured 68-75% of the Metros new attached sales since 2014. As low inventory levels and increasing prices continue to put affordability pressure on the market, and demographic surges of first-time buyers and Empty Nester/Retirees increasing look for more maintenance-free product, we forecast this capture to maintain around 76-80% over the next five year period. This will result in sales volumes surpassing what has been demonstrated in the most recent 2011-2021 cycle, but continuing the more recent averages witnessed in 2017-2021.


OTP NEW ATTACHED SALES & FAYETTE COUNTY CAPTURE
Historically Fayette County has had a significant lack of new attached homes offered, and this has only recently shifted with the addition of townhomes in Trilith (located within the City limits). To understand the potential captures the County (and it is assumed 100% of this would be within the City limits) could achieve, we examined demonstrated captures at analogous Cities such as Newnan and McDonough on the next exhibit. Based on these we are making a conservative estimate that the City could witness captures ramp up to average 1.3% through 2026, which would result in demand potential of nearly 40 attached homes per year.

SOURCE: Noell Consulting Group and MetroStudy

CITY CAPTURES OF OTP NEW ATTACHED SALES
City Capture of OTP New Attached Sales 2015 - 2021
Fayetteville average: 0.1% capture
McDonough average: 0.6% capture Newnan average: 0.5% capture
average: 5.2% capture
Although Fayetteville has had a historically low capture of the total new attached sales OTP, the projected capture rate is not unreasonable when compared to the new attached sales and capture of analog cities. Newnan's capture is increasing at about 6% per year and McDonough's capture is increasing at about 65% per year, so if Fayetteville delivers new attached product it can achieve a capture rate between 1-2% from 2022-2026. Not show on the charts is the Alpharetta average capture of 5.2% and total new attached sales of 921 homes. Fayetteville can model their attached product after the high quality well executed Alpharetta stock and maintain the value of attached product.
NEW ATTACHED SALES
Total New Sales 2015 - 2021
Fayetteville: 25 sales
McDonough: 148 sales
Newnan: 109 sales

Alpharetta: 921 sales
SOURCE: Noell Consulting Group and MetroStudy


Historically, Fayetteville delivered no attached housing product until the delivery of Trilith in 2019. The Trilith attached product price point is much higher than that of entry townhomes, duplexes, and other attached product, pointing to a lack of diverse and affordable attached product that the City could benefit from providing. An increase in density and attached product can help offset increasing prices of land and construction costs, but product can be well designed to maintain high home values throughout Fayetteville. Attached product can also be located in concentrations, like in Trilith, near downtown in walkable areas where density is appropriate.

1. Employment growth from Economy.com.
2. For the purpose of NCG's supply and demand analysis the Primary Market Area (PMA) Is defined as Fayette County.

3. Potential Fair Share capture is based on historic captures the City has achieved within the county. NCG predicts that any new attached product will locate directly within the city limits of Fayetteville, giving the city a 100% capture rate of product, as has been demonstrated thus far.
4. The results of our demand analysis indicate the City can support an annual average of approximately 40 new attached sales per year, or a total of 194 through 2026.
*Please note that there could be some rounding errors in price band estimates
SOURCE: Noell Consulting Group, MetroStudy, Moodys / Economy.com

With the exception of the recovery post great recession, detached product has accounted for 82%-86% of all new home sales in the metro up until 2017. Since 2017 however there has been a significant decline in the detached home sale portion of the market, as affordability pressure increased following a strong economic run and associated price appreciation, which was only sped up further with the onset of COVID. While 2021 witnessed a slight bounce back, we forecast the trend will continue with a gradually declining % of detached sales as more attached products gain popularity both for their more affordable price point, but also in many areas their increased walkability and maintenance-free aspects.

SOURCE: Noell Consulting Group (based on surveys of properties)
SOURCE: Noell Consulting Group and MetroStudy

While not a surprise, the market has witnessed nearly 90% of the new detached sales occurring OTP, as infill sites for low density products ITP are becoming increasingly scarce. We believe this trend will largely continue, resulting in a forecast of nearly 12,000 new detached sales per year Outside the Perimeter.

SOURCE: Noell Consulting Group and MetroStudy


OTP NEW DETACHED SALES & FAYETTE COUNTY CAPTURE
Historically Fayette County has averaged a 1-2% capture of the OTP new detached home sale market. Most recently, Trilith has enabled that capture to ramp up to nearly 3.5% when significant inventory was available. To understand demand potential, we are assuming the County can witness a ramp up to 4% of the OTP market if inventory was made available. As can be seen below this results in just over 315 average sales per year.
SOURCE: Noell Consulting Group and MetroStudy


Since the Great Recession, the bulk of the new detached sales market in the PMA has been the under $400k band. The delivery of Trilith, as well as new job gains associated with the hospital, and market wide appreciation rates have resulted in the majority of sales now occurring in the $400-750k bands.
1. Employment growth from Economy.com.
2. For the purpose of NCG's supply and demand analysis the Primary Market Area (PMA) Is defined as Fayette County.

3. Potential Fair Share capture is based on historically demonstrated captures the City has witnessed of County sales across price bands.
4. The results of our demand analysis indicate the City has demand potential for an annual average of 118 new detached sales per year, and up to 588 total sales through 2026.
SOURCE: Noell Consulting Group, MetroStudy, Moodys / Economy.com
*Please note that there could be some rounding errors in price band estimates


Exhibit 49


Analogous For-Sale/ Rental Product Community Map


SOURCE: Noell Consulting Group, CoStar

Exhibit 51


Comparison of Key Competitive/Analogous Communities For-Sale Product in the Market - Weighted Average


55+ For-Sale Communities


For-Sale Single Family

 Exhibit 55 (Page 2 of 2)
Competitive SFD Community - The Villages at LaFayette: Park (110 Mansfield Drive)


10’ Ceilings on Main Floor
Lennar Homes

3/18/2022
Began Q3 2017
Features &
Grounds maintenance; 5 pocket parks located throughout community; pet stations located throughout community; playground; sport court w/ regulation pickle ball; swimming pool plaza with sun shields
Recessed can lighting
3” Plank Shaw® Engineered Hardwood Flooring, ceramic tile in bath
Electrolux® Stainless Steel Appliances including 36” Gas Cooktop, Vent Hood, WaveTouch Double Ovens (Standard and Speed cooking), Ring® Video Doorbell; Samsung SmartThingsTM Hub
including some Delta attendants. 1 Closing Price Range 41 4 Recently Sold (2020+) 4 10 6 11 Unit Size Range Vinyl tilt-in windows with wood returns; a front porch and covered, rear patio. Not offered NA Typical Upgrades Financing and Incentives Effective PSF UNIT FINISHES Countertops, Cabinets and Bath Detail Appliances and Tech Windows and Balconies Only the total unit count in the neighborhood is known. Data is from recent sales 2 3 COMMUNITY OVERVIEW
Previously developed by Ravin Homes (most custom homes); Lennar purchased in 3Q 2017 (production).
SOURCE: Noell Consulting Group

Competitive SFD Community - Apple Orchard (Apple Blossom Lane, Winesap Way, Stayman Park)

SALES PACE
Unknown
2001
Sales Pace: Phased construction began in 1999. All units were delivered by 2004. No active sales. Most recent resale was a 3B/3b for $395,000 which sold in March 2022. Q1
Private 2 car garage in rear
Only
$500 ($46/mo.) 16
Varies, lighted fans in bedrooms, chandeliers, decorative pendants, decorative track lighting in bath
Wide plank Hw on main, tile in bath, carpet in beds and on second floor if there is one.
Broad mix of mature suburban home owners, some empty-nesters, and maturing families seeking new housing in Fayette County.
SOURCE: Noell Consulting Group

None Effective PSF 1 6 Typical Upgrades Financing and Incentives Flooring Countertops, Cabinets and Bath Detail Appliances and Tech
UNIT FINISHES
Dark granite countertops in kitchen, white granite in bath, framed walk in shower with separate tub in master.

SS appliance package w/electric range, microwave, fireplace Punch windows, Private patio/deck
SUMMARY


OVERVIEW
Sales Pace: Construction began in Q2 2015. They are still building, with the construction of Phase 3 of the development underway. Sales pace in 2021 was roughly 3 (2.8) units sold per month.
Ceiling Height and Finish
10' ceilings on main
of
Only 3 4 14 Typical Upgrades
Private courtyards Effective PSF 68 UNIT FINISHES Lighting Flooring Countertops, Cabinets and Bath Detail Appliances and Tech Windows and Balconies *Currently in Phase 3 of Construction 8 3 6 1 2 2 13 Typical annual assoc. Fee: $2,400 N/A PRODUCT PROGRAM Recently Sold (2020+) Base Price Range Unit Size Range 600 SFDs Features & Amenities:
the total unit count in the neighborhood is known. Data is from 6 3 3 MARKET AUDIENCE SUMMARY
Buyers all over; tv stars, investors, from out of town, few families with kids, some empty-nesters, majority from Atlanta metro area.

SOURCE: Noell Consulting Group
countertops


Financing and Incentives NA N/A Custom designer lighting Wide-plank hardwood flooring
standard.


Buyers all over; tv stars, investors, from out of town, few families with kids, some empty-nesters, majority from Atlanta metro area.

Marble countertops in bathrooms and kitchens. Solid wood custom cabinetry with custom paint or stained finishes. Granite marble and stone counter top selections and apron front kitchen sink are standard.


Bosch appliance package, plumbing fixtures in popular finishes by Delta. Pre-wired for electric vehicle charging station.
600 detached residences, 100 townhomes, and 600 apartments/condos. Massive, multiplephase mixed-use planned community. Next door to Pinewood Atlanta Studios.
◘ Developer: Euram-Macauley One, LLC/Reynolds Capitol Group, LLC

◘ Lot sales and construction began in 2006, still ongoing

◘ HOA fees: $700
◘ Master planned community of approximately 600 acres

◘ 350 homesites along 2 freshwater lakes
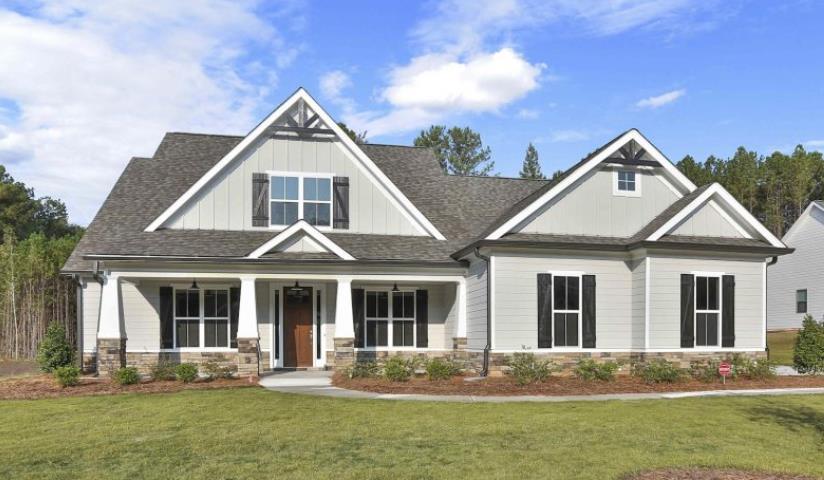
◘ Lake-adjacent cottage with fitness center, pool, coffee bar, addtl.
Master planned community with custom homes as well as pre-built or pre-designed options. Includes access to 2 freshwater lakes along with wharf docks and canoe storage. Lake cottage includes some traditional amenities like lighted tennis courts, sunroom, coffee bar, fitness center, catering kitchen, and lap pool. Located within convenient driving distance of historic downtown Fayetteville as well as Trilith. All home sites 1 acre or more.


Pulte
Sales Pace: Recent sales data indicates that five homes were sold in the month of December (2021) alone which is a strong pace. Sales have slowed as construction slowed with the most recent sale was in March of 2022.
None Pour
55+, and families. Attracted
convenience to job cores at the Airport, Atlanta, as well as local job cores.
Competitive SFD Community - Annelise Park Drive: Park (Vinings Walk; Annelise Park Drive,)
Sales Pace:
Construction began in 2005 and the community has been slowly adding on through the years. As of 2022, there are 22 lots ready to build with 3 lots breaking ground. There is no estimated time of delivery.The current data is only resales.
Recessed can lighting, lighted fans, chandeliers
Hardwood Flooring, ceramic tile in bath, carpet in bedrooms
Custom 42” Uppers and Crown Molding, Granite Kitchen and bathroom countertops. Framed walk in showers, double vanities, large soaking tub in master.


Custom, Stainless Steel Appliances including gas cooktop, Double Ovens, granite island

Previously, upgrades were up to the discretion of the owner. The future phase will be uniform with no upgrades.
Mix of empty nesters and families from local area who work in Atlanta, airport-area workers, including some Delta pilots, and healthcare workers. Most recent inquires have been from out of state, California and New York.
Large double pane windows with metal returns; porches and covered rear patio. 3/18/2022
Previously developed by various home builders (most custom homes); Currently being developed by Heather homes.

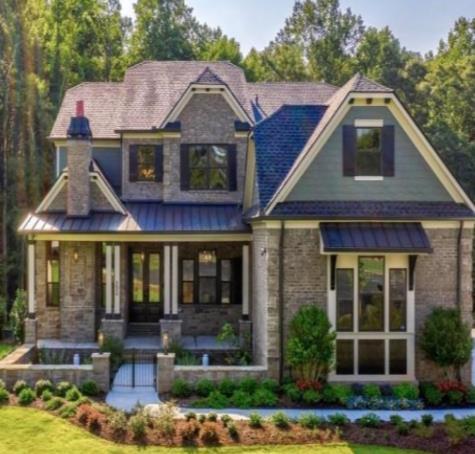

 BRANCH PROPERTIES, LLC
LAUREL ISLAND MARKET ANALYSIS
Atlanta Metro Job Growth
Note: Class A apartments are defined as CoStar's 3, 4 & 5 Star properties and exclude military, senior, and vacation properties.
The graphs on this page track the relationship between job creation and Class A apartment absorption. While population and wage growth are strongly related to apartment absorption, job growth figures capture many of these trends. Additionally, the relationship between job creation and apartment absorption can illuminate demographic trends and shifts in preferences. This relationship in the Atlanta metro has steadily risen since coming out of the Great Recession as young professionals have put off home ownership and many empty-nesters have sought to downsize with developers meeting this demand, often in urban, walkable areas, with an increasing amount of deliveries (thus net absorption). Despite the jobs fall out from the coronavirus pandemic in 2020, the metro absorbed over 14,800 units, and with a significant rebound in jobs occurring in 2021, an additional record of over 17,000 units were absorbed. Moving forward, NCG projects the net absorption to jobs relationship to grow with continued strong job growth and a lack of for-sale product within the Metro unable to meet demand, particularly at more modest price points, with just over 8,000 apartments absorbed on average per year over the five-year projection period.
Atlanta Metro Class A Apartment Absorption
SOURCE: Noell Consulting Group, Costar, Economy.com | Moody's Analytics


Exhibit 60
Outside the Perimeter (OTP) Capture of Atlanta Metro Class A Apartment Absorption
Atlanta Class A Apartment Absorption & Outside the Perimeter (OTP) Capture
The Atlanta regional core, defined as "OTP" or Outside the Perimeter (the local reference for Interstate 285 that rings the City of Atlanta), has seen a decreasing share of absorption since 2003 as renters increasingly seek job proximity and dynamic, walkable intown neighborhoods. However, in recent years, there has been a small uptick with apartment units added to several suburban mixed-use developments and historic downtowns. This uptick became more pronounced during the COVID 19 pandemic, as many choose to relocate out of urban areas to save money given a decreased need for commuting. That said, we do believe this was a temporary spike that will gradually cool (as already demonstrated in 2021) as more and more employees are required to go back into the office, even if only for a few days per week, and urbanization trends return. Moving forward, while individual years will vary as the pipeline delivers, we project OTP to capture roughly 42% of metro absorption through 2026. Overall, this equates to an average of just over 3,300 units absorbed annually from 2022 - 2026.
Outside the Perimeter (OTP) Class A Apartment Absorption
SOURCE: Noell Consulting Group (based on surveys of properties)

SOURCE: Noell Consulting Group and Costar

Fayette County Submarket Capture of Outside the Perimeter (OTP) Apartment Absorption

Outside the Perimeter (OTP) Class A Apartment Absorption & Fayette County Capture
Over the past cycle (2011-2021) Fayette County has averaged just 1.1% capture of the OTP market, however in more recent years, new deliveries at mixed-use developments such as the Lofts at Trilith and Downtown walkable deals such as Meridian, have shown the potential to boost the capture. In addition to more of these urban-suburban town centers helping to increase capture going forward, COVID has also helped to spur the increase of the build-to-rent SFD & TH market, much of which is in the pipeline for areas like Fayette County, indicating the demand potential is there going forward. Given these trends, along with an overall push to the suburbs and more affordable markets as a result of more work remote situations, we forecast this capture to have the potential to increase to as high as 5-10% of the OTP market. The result is a forecasted annual average of approximately 170 units per year through 2026.
Fayette County Class A Apartment Absorption
SOURCE: Noell Consulting Group and Costar

Exhibit 62 (Page 1 of 2)
Fayette County Apartment Supply and Demand Analysis
1/ Employment growth from Economy.com
2/ Noell Consulting Group analysis based on larger analysis and trends of the market.


3/ Fayette County submarket shown above
SOURCE: Noell Consulting Group, CoStar, Economy.com


1. The numbers found beneath the year columns for each project indicate the percentage of the year the projects are expected to be in lease-up.
2. Projects that delivered in 2020 or 2021, but were/are currently in lease-up are designated in PURPLE, with the number of outstanding units as of January 1st, 2022 listed. Projects that are currently under construction are designated in GREEN
3. Based on our demand forecast we believe there is positive demand for up to an additional 500 units within the City. These may come in a variety of product types - rental TH, rental SFD, multifamily flats, etc. but represent the otal volume the market can support.
These projects added to see how many units the market can support and still maintain supply/demand balance
SOURCE: Noell Consulting Group, CoStar, Economy.com


The result of our supply demand analysis can be seen here, with validation that even the addition of an additional 500 units above the current pipeline will still enable the market to maintain lower vacancy rates and push strong rate growth through 2026.
SOURCE: Noell Consulting Group, CoStar

While limited, demand exists for market rate senior housing (in either 55+ or an IL/AL facility) at an estimated 30 beds per year within the City of Fayetteville. This would likely translate into one new 90 bed facility supported every three years.
1/ Claritas, Inc. for HHs 65+.
2/ AARP based on National average.
3/ Noell Consulting using modified estimates from the US Census.

4/ US Census Bureau

5/ From previous interviews and research with analogous facilities in the SE.
SOURCE: Noell Consulting, Claritas, AARP, US Census


Exhibit 66


Comparison of Key Competitive/Analogous Communities For-Sale Product in the Market - Weighted Average
 Exhibit 71 (Page 2 of 2)
SOURCE: Noell Consulting Group based on surveys of properties.
Lofts at Trilith $2.40/SF
Meridan at Lafayette $2.08/SF
Equinox at Knight $1.63/SF
Competitive Rental Community - Premier Lofts at Trilith (301 Veterans Pky)


$75/app + $200/admin
Owner Name Pinewood Forrest Real Estate Pet Fees:
$350 fee + $30/mo
Property Manager Name Capstone Companies - Premier Lofts at Pinewood For Other Fees: $30/mo valet trash


2019-2020
Lease Up Pace: N/A
Parking Fees: $50/mo for 2nd vehicle
Surface/parking deck
Total Spaces 442
Market Audience: According to the leasing agent, there is a wide mix of age demographics with many young professionals working at local hospital, airport, and other south Atlanta employers as well retirees and families.
Building Summary:
Multi-phase apartment complex that is part of the Pinewood Forest ecosystem, including for-sale resi, retail, office, and movie studio. Leasing has just begun, with 18 units online and another 18 coming online March 1st. All unit phases are expected to be complete and online by the end of Q3 2020, for a total of 263 units that will also include some Studios and 3B's.
Ceiling Height and Finish: 9' ceilings
Lighting and Fixtures: Black track lighting in kitchen/bath, glass pendants in kitchen, lighted fans in living/bedroom
FINISHES AND AMENITIES
Flooring: LVT throughout
Cabinets and Hardware:
w/ SS pulls
Countertops: Granite countertops; subway tile backsplash

Appliance Package: Flat top electric SS appliances with standard SS refrigerator
Laundry and Bath Detail: Stackable full size washer and dryer
Windows and Balconies: Large double pane windows
Additional Features: French doors leading to balcony/patio (in select units)
Community Features and Amenities: 24-hour fitness center, lounge, courtyard, pool, grill stations, clubhouse w/ entertainment room, dog park, on-site retail/restaurant, electric vehicle charging stations
Source: Noell Consulting Group, CoStar
$85/app + $250/admin
Property Manager Name Matrix - The Meridian at Lafayette Other Fees: $45-$85/mo storage

Year Built 2017
39 (Car-Dependent)
FINISHES AND AMENITIES
3/18/2022
Type: Surface/assigned garage
Spaces 317
Parking Fees: Free surface, $150/mo garage 0.88
Primarily 60% local families, with the rest comprising of young professionals working at local hospital, airport, and other south Atlanta employers.
New apartment community adjacent to Downtown Fayetteville and the price leader in Fayetteville. Offers an updated finished and amenity package and the only community in the competitive set offering dens.


Ceiling Height and Finish: 9'-10' ceilings
Lighting and Fixtures: Track in kitchen, pendants over island
Flooring: Vinyl HW in kitchen, bath and living room. Carpet in bedroom.
Cabinets and Hardware:
42" shaker with vertical pulls
Countertops: Two packages, cloud white granite or harbor white granite

Appliance Package: Whirlpool stainless steel with smooth top range
Laundry and Bath Detail: Full sized, washer/dryer, tub/shower combo, standing showers in select units

Windows and Balconies: Standard punch windows, balconies in select units
Additional Features: USB outlets
Community Features and Amenities:
Salt water pool, grilling stations, fire pit, car detailing station, conference room, tenant lounge, pet park, fitness center
Source: Noell Consulting Group, CoStar


FINISHES AND AMENITIES
13 (Car-Dependent)
Roughly equal percentages of healthcare workers, air-line employees, studio workers, and locals. There is a 50/50 split in age demographics
Building Summary: An old class A apartment community east of Downtown Fayetteville. Currently, the only community in the competitive set offering dens, sunrooms, and patios.
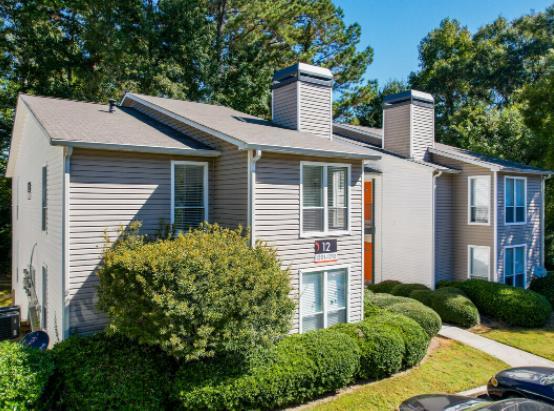
Ceiling Height and Finish: 9'-10' ceilings
Lighting and Fixtures: Fluorescent light in kitchen, flush lighting in living area, no ceiling fans in bedrooms
Flooring: Vinyl HW in kitchen, bath and living room. Carpet in bedroom.
Cabinets and Hardware:
42" shaker with SS knobs, subway tile backsplash
Countertops: Granite throughout
Appliance Package: Standard black appliances with gas range
Laundry and Bath Detail: Community washer/dryer, standards tub/shower combo
Windows and Balconies: Standard punch windows, balconies in select units
Additional Features: Fire places in every unit, walk-in closets, sunrooms/patios available in select units


Community Features and Amenities: Swimming pool, Playground, fitness center, sport/activities court, and tennis courts


Source: Noell Consulting Group, CoStar
3/18/2022
Competitive 55+ Community - Garden Court: Park (Garden Ct., Courtyard Lane, Arbor Way, Wilbanks Drive)


Sales Pace: Construction began in Q1 2021 with presales beginning in February 2021. So far 63 have been built with 66 remaining. This is Phase 1 of 5 planned phases.
on main 55+ community design
Recessed can lighting, lighted fans in living and bedrooms, chandilers in kitchen, track lighting in bathroom


LVT in living rooms, tile in bath, carpet in bedrooms
modern 42" shaker cabinets in all with brushed nickel pulls, granite/marble throughout, farmless walk in showers, modern tile in bath/shower
SS gas cooktop with seperated double oven, and refrigerators with water/ice dispenser
Standard punch windows, some with back yards, others only have a front yard.
$5,000 towards closing If the future owners use their insurance agent.
Mix of empty nesters, retirees, and families. The community was designed for 55+ community but accepts everyone no matter the age. 75% are over 55( 60% single 40% couples) with the rest being a mix of families and other audience demographics. According to the listing agent, all tenants are locals who are moving due to downsizing and/or wanting to be close to good schools .
Quiet neighborhood close to Downtown Fayetteville. Typical product for 55+ communities (master on main with limited two story homes).

Competitive 55+ Community - Garden Court: Park (Garden Ct., Courtyard Lane, Arbor Way, Wilbanks Drive)

COMMUNITY OVERVIEW
Developer:
N/A

SALES PACE
Sales Pace: Construction began in 1990 and ended in 1992. Recent sales have the property reselling at around 11 units per year, or almost 1 unit a month. Q1
Presale: Began selling in 1990
112 duplexes Features & Amenities: None Cement Siding 1 car garages per unit 1 car garages per unit


Effective PSF 17 17 UNIT FINISHES
10’ Ceilings
1992 3/18/2022
Recessed can lighting, lighted fans, chandeliers
Standard 42" shaker cabinets in all, laminate in lower priced houses granite in higher priced ones
lower level houses with black appliances where the high priced ones have SS appliances and refrigerators with French doors,, fire places in all units None
Standard punch windows, some with fenced in back yards, others only have a front yard. Typical Upgrades Financing and Incentives
MARKET
neighborhood
close
to
Mix of empty nesters, retirees, 55+. Typical of retirees who don’t have a lot of money and don't want to deal with the hassle of having a lot of land which is typical of most SFD's in the Fayetteville area. Typically lower income


• This data shows the historic and future demand potential for single-family detached product in the County
• Strong job growth projections in the Metro for 2022 and 2023 will continue to drive strong demand
• The County’s capture of the Metro has been trending up thanks to new developments such as Trilith increasing awareness and inventory
• This data shows the historic and future demand potential for single-family attached product for the County
• Metro wide the percentage of attached new home sales of all new sales has been increasing, primarily as a means of offering greater affordability, but also as growing demographic segments chose more maintenance-free living such as first-time home buyers and Empty Nester downsizers
• While attached product has been rare in the County historically, Trilith and increased lifestyle offerings in Downtown Fayetteville bring new opportunities for buyers to consider the product and we therefore believe it will see increased demand going forward, ultimately matching the metro average of 20-22% of all new home sales being attached. In Fayette County these will likely all be fee-simple townhomes.
• Coweta and Fayette County have seen an increase share of Class A multifamily absorption since 2011
• Absorption in Fayette County has largely been limited by lack of new supply
• Increasing lifestyle environments in Newnan, Trilith, and potential Downtown Fayetteville will increase the market’s capture moving forward
• NCG’s forecasted demand of 276 units annually from 2021-2025 allows for absorption of the planned deals in the pipeline and up to an additional 250-300 units within the County by 2025
• Nationally, and throughout the Atlanta metro, retail growth has been dwindling as more retail expenditures shift to online sales. That said, net absorption is still seen in areas of increasing population density and as newer retail concepts – primarily in food and beverage and professional services are introduced
• With retail in Fayette’s core serving a larger market area than just the county, and strong new household growth in those areas, we forecast the county capture to steadily increase in the coming years
• The local office market has been stagnant in recent years with 3 years showing negative absorption since 2016
• However, there has been limited new product added to attract prospective users to the market
• NCG estimates the County will absorb close to 62,000 SF of Class A office space annually, Trilith likely to get first several years given existing space
• Given annual absorption levels office product should be provided in the 5,000 - 20,000 SF range, ideally in high value areas such as proximity to retail, parks / trails, with high visibility
Since 2015, approximately 1 million SF of new commercial and multifamily space has been added to the Fayette County market
Of this, 60,000 SF was within the Highway 85 north corridor, or a 6% capture.
With Peachtree City limiting development, and Trilith and the Fayetteville LCI increasing market perception/awareness of the Fayetteville market, we believe this capture can grow up to a 10-20% range.

While demand exists, it is unlikely detached (SFD) homes will be built in the corridor given the lack of remaining greenfield sites. If realized this would be in the form of small lot (35’-55’) product.
While attached/TH demand is limited in the corridor today, we believe pent-up years of demand from 2021-2023 will combine to sell out the new units coming online at Satterfield, then new demand will be available for approximately 30 additional units in 2024-2025.
Multifamily demand will likely come in the form of one new 200 +/- unit community within the 20212025 time frame.
Most retail demand will continue to be small outparcels and back filling existing tenants that may close – more on this in a few slides.
Office demand is limited, but potential for adaptive reuse of older retail centers in the corridor. Likely to be one in the 30-40,000 SF range by 2025.
3.8 Million SF of commercial space

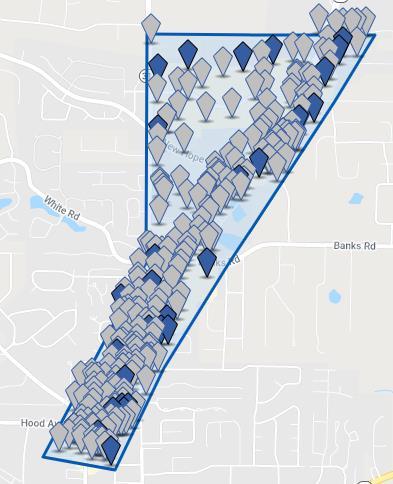
▪ 3.5 M retail
▪ 266k office
▪ 67.5k industrial/flex
▪ 0 MF
4,994 jobs
▪ 83% pay below $40k
▪ 99% commute in
3.5 Million SF
▪ 79% in 15 shopping centers of 20k SF+
▪ Over 40% located in Fayette Pavilion alone
Since 2008, approx. 73k SF added – mostly free standing outparcels
Net absorption has gone up and down, losing big tenants and then taking 1-2 years to fill
Total net absorption since 2008 only 49,000 SF
Vacancy is currently low, but rate growth has been flat for over a decade
Majority of patrons come from within 15-miles
Most from Fayette County, but also Fairburn, Union City, Senoia


Demand potential is high for many store categories, however several are likely less desirable for the corridor:
▪ Motor vehicle and parts dealers
▪ Gasoline stations
Strongest acceptable opportunities are for:
▪ Full-service restaurants
▪ Health and personal care
▪ General merchandise
▪ These uses tend to be in small boxes on out parcels, or in the case of general merchandise – large anchor boxes (Target, Sam’s Club, Costco, etc.)
▪ Most out parcels opportunities are gone, and large anchor space does not exist without redevelopment
We examined the 15 shopping centers along the corridor are rated them for redevelopment potential

Rating was based on:
▪ Age
▪ % leased
▪ Current rental rates
▪ Tenant strength
A; Strong fundamentals, low redev. opportunity
B; Moderate fundamentals, redev. 5-10 years
C; Poor fundamentals, high redev. opportunity
A properties are in the $150+/SF value and result in a land value to high for redevelopment

B properties are +/$100/SF in value and result in a land value that would require high density development


C properties are less than $100/SF in value and result in a land value under $750k/acre

Land values of existing centers along the corridors, even C grade, will not make residential redevelopment feasible. Future residential additions will largely need to be on remaining greenfield sites.


Current office lease rates in the greater Fayette market will make new construction speculative office space difficult unless part of a larger mixeduse development.
Opportunities do exist to adaptively reuse older retail spaces into creative office and bring to market at lower lease rates that will be accepted.
Multifamily development is often the primary driver for redevelopment given its strong market demand, and ability to pay higher land prices with increased density. While the current market will not support structured parking (unless subsidized), both Garden-Urban and 3-4 story garden (w/elev) product will justify redevelopment of the B and C grade centers in the corridor.

In addition to the full scale redevelopment opportunities examined, we believe there are also opportunities for infill along the corridor.
The addition of multifamily on underutilized portions of existing centers, can help to enhance them

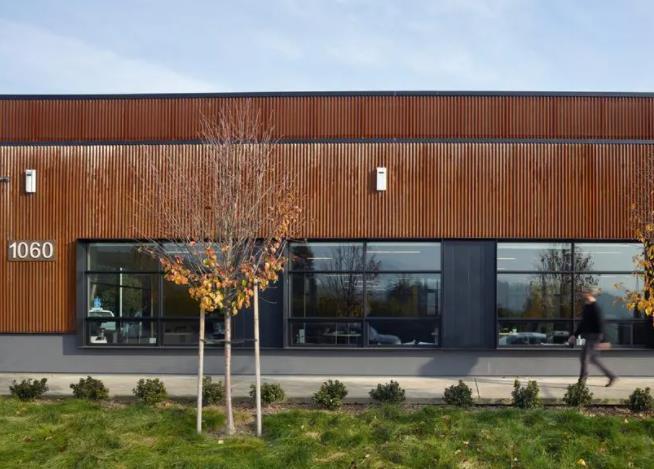
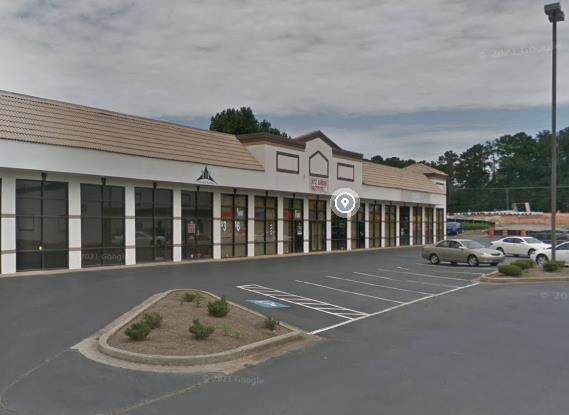
The low values associated with the Grade B and C properties make them prime for adaptive reuse if their land area is too small for full redevelopment.
Acquisition of these properties for $100/SF or less allows them to support adaptive reuse budgets of $175-200/SF, and still hit rent levels supported in the market of $20-25/SF.
1. Promote full redevelopment of C grade shopping centers on large land parcels (5 acres+) close to Downtown; Fayette Place (Davis Development?), Fayetteville 85 Center/Fayetteville Center North. Leverage the in-place TAD to make more attractive to developers.

2. Aid adaptive reuse on C grade shopping centers on small land parcels (under 5 acres) close to Downtown; Glynn Hood Plaza. Leverage the in-place TAD to make more attractive to developers.
3. Facilitate select infill multifamily development opportunities where it will strengthen retail support; Fayette Pavilion, Banks Crossing (JC Penny)
4. Continue to allow development of retail outparcels and/or infill residential where feasible
1 2


3 4

Prepared for Fayetteville, Georgia on-site April 28-30, 2022
Following up on the work of Moving Fayetteville Forward and the Livable Cities Initiative, a crossdisciplinary team conducted a design vision workshop with city officials. The goal was to create inspiring visions for key streets and critical city parcels of downtown Fayetteville and to outline a strategy for implementation.
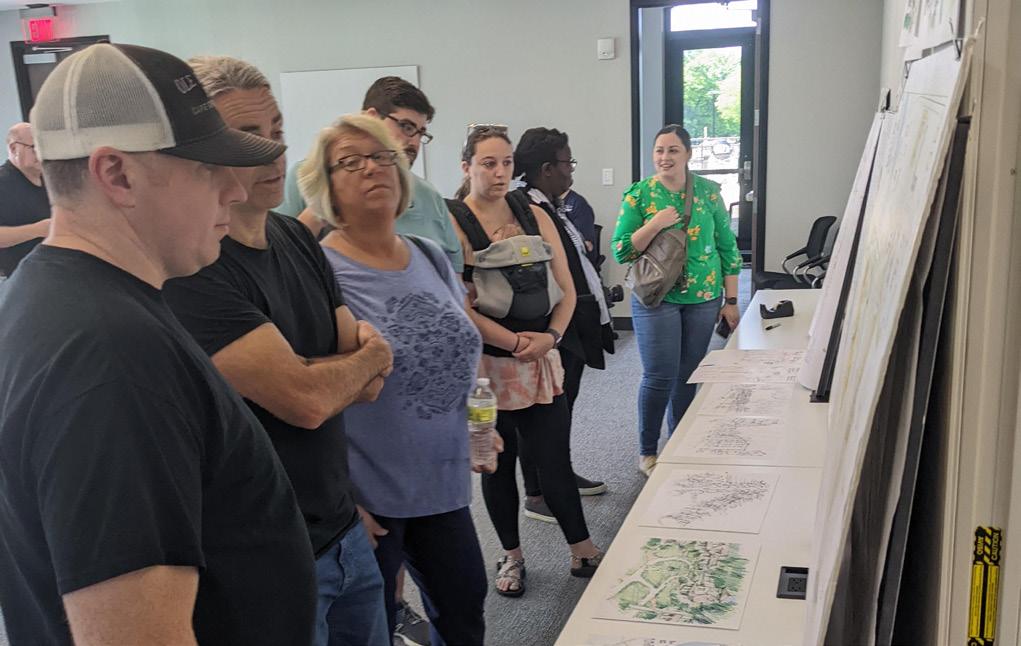
On the first day, the team created preliminary designs for improvements to the transportation network and concept plats for priority parcels. The second day was focused on detailed study of the critical parcels and creating an outline regulatory framework to review and permit infill projects within the study area. On the final day, the team refined concepts according to feedback and revised concepts for a final round of presentation and feedback.
In general, the team finds development prospects in the city are very strong based on the fundamentals. Residential demand is high as indicated in prior reports and reflected by active permits and inquiries. If the city can slow the traffic and codify a system supporting appropriate infill, the vibrant walkable vision for Downtown Fayetteville will become an inspiring reality.
1. Exploratory work plan re: GDOT conversation
a. Overview call w/ referred traffic engineer
b. Execute scope to make a schematic case to GDOT.
Short
c. Goal is to get GDOT to agree to receive an application. Then engage a detailed follow-on scope, including legal counsel.
2. Program outline for pattern zone
a. Overview call: components, optional integrations, benchmark pricing
b. Concept program proposal is focused on pocket neighborhoods and main street buildings.

3. Adopt the Unified Development Ordinance (UDO) and Downtown Mixed-Use zone (DMU).
a. Set the expectation for regular amendment packages.
Downtown Fayetteville is currently bisected in each cardinal direction by roadways under GDOT jurisdiction. These roads are designed to highway standards and prioritize traffic volume and traffic speed. In contrast, rights-of-way in active downtowns are designed to be streets that accommodate pedestrian movement at least as well as vehicular movement. Execution of a streetscape improvement plan will require a negotiated agreement–or even a transfer of jurisdiction–with GDOT. The team considers this recommendation mission critical to providing the type of living environment the citizens and city officials of Fayetteville want to enjoy and share with future generations. Without significant streetscape changes, Downtown Fayetteville’s full potential will remain suppressed.


The team recommends the city maximize the use of existing parking and postpone the construction of a parking deck; however the team also identified future sites for planning purposes. Sufficient downtown parking is available but underutilized due to a lack of connecting pedestrian infrastructure such as safe and comfortable sidewalks and adequate lighting. The entire downtown area, including city center and the square, is within a 3 minute walk of existing surface parking lots. The city can address present and future parking needs through shared use agreements with private parking lot owners and construction of parking on streets within existing right-of-way.
Certain sections of the new UDO and DMU still need to be amended. The team observed that the use unit tables and ADU and cottage court codes may be improved with downtown-focused revisions.
The proposed UDO and DMU is a substantial step forward and should be adopted as soon as possible. To maximize its impact, combining the DMU with a pre-approved building program would help guide the local market to build appropriate infill development in the right places.
In the case of large tracts, the team recommends the city replat these parcels for small-scale projects in a proactive manner. Replatting these parcels for traditional lot sizes and arrangements will open a large market of buyers and developers that is currently unaddressed.
Downtown Fayetteville is presently dominated by high-speed automobile traffic. Conversion of 1-way streets to 2-way traffic has been demonstrated to dramatically improve business revenues and desirability of residences by significantly reducing operating speeds (and therefore road noise) and increasing accessibility by allowing the site to be conveniently accessed from either direction.
The team recommends reducing the number of lanes on Glynn St between Grady Ave and Lanier Ave from four travel lanes to two travel lanes with planted medians and left turn pockets or turn lanes. This creates more room for safe pedestrian and cycling facilities and for parking. This configuration can accommodate existing traffic counts if it includes network improvements.
1. Segment A: Between Grady and Stonewall, include a center turn lane.
2. Segment B: Between Stonewall and Lanier, remove the center turn lane in favor of angled parking on both sides of the street.
3. Segment C: North of Lanier, keep four travel lanes but install a tree-lined median in the center turn lane.
4. Major opportunity for network improvement: Roundabout at Grady Ave and Glynn St.
a. Segment A starts at this roundabout. It’s a signal to drivers they are entering downtown.
b. Lee Street links into the new roundabout. This will help with development on the east and southeast sides of the downtown and reduce pressure on Glynn.
c. A vehicular connection on Williamsburg Way to Jeff Davis should be considered a high priority connection.
1. Engage a traffic engineer with experience in roundabout design, lane reductions, and 2-way conversions.
2. Prepare for a protracted negotiation as you would with any state agency. Persistence is key.
3. Broach conversations about transferring jurisdiction of the street or changing its designation from a principal highway to a business route.
4. Reference the ITE Context-sensitive Highway Design manual and the NACTO Street Design Guide.
The team recommends the city create an accelerated work plan for the repair and widening of existing sidewalks and installation of new sidewalks, on-street parking, lighting, and street trees, prioritizing and scheduling work on each street. Most downtown streets are of sufficient width to install parallel parking on the existing paved section without reductions in roadway capacity.
1. On some streets, a protected cycling facility may be more appropriate than parallel parking. The team observed the LCI trails map will be complemented by on-street linkages.
2. Returning Stonewall and Lanier to two way operation will require adjustments to traffic signals throughout the downtown network.
3. When feasible, construct raised intersections on Stonewall and Lanier at the square and in other appropriate locations.

Blue outline represent 3 minute walking areas from existing surface parking lots.

Existing street spaces
New street spaces
Existing parking lots
1. Postpone the construction of a parking deck indefinitely. The entire downtown has coverage via existing lots.
2. Link walkability and lighting improvements with effective use of existing parking capacity.
3. Negotiate shared use and management agreements with area churches who own large parking lots in downtown
4. Construct on-street parallel parking on most streets. (designated in pink)
1. Stonewall has one fewer lane than Lanier, but the principle is the same.


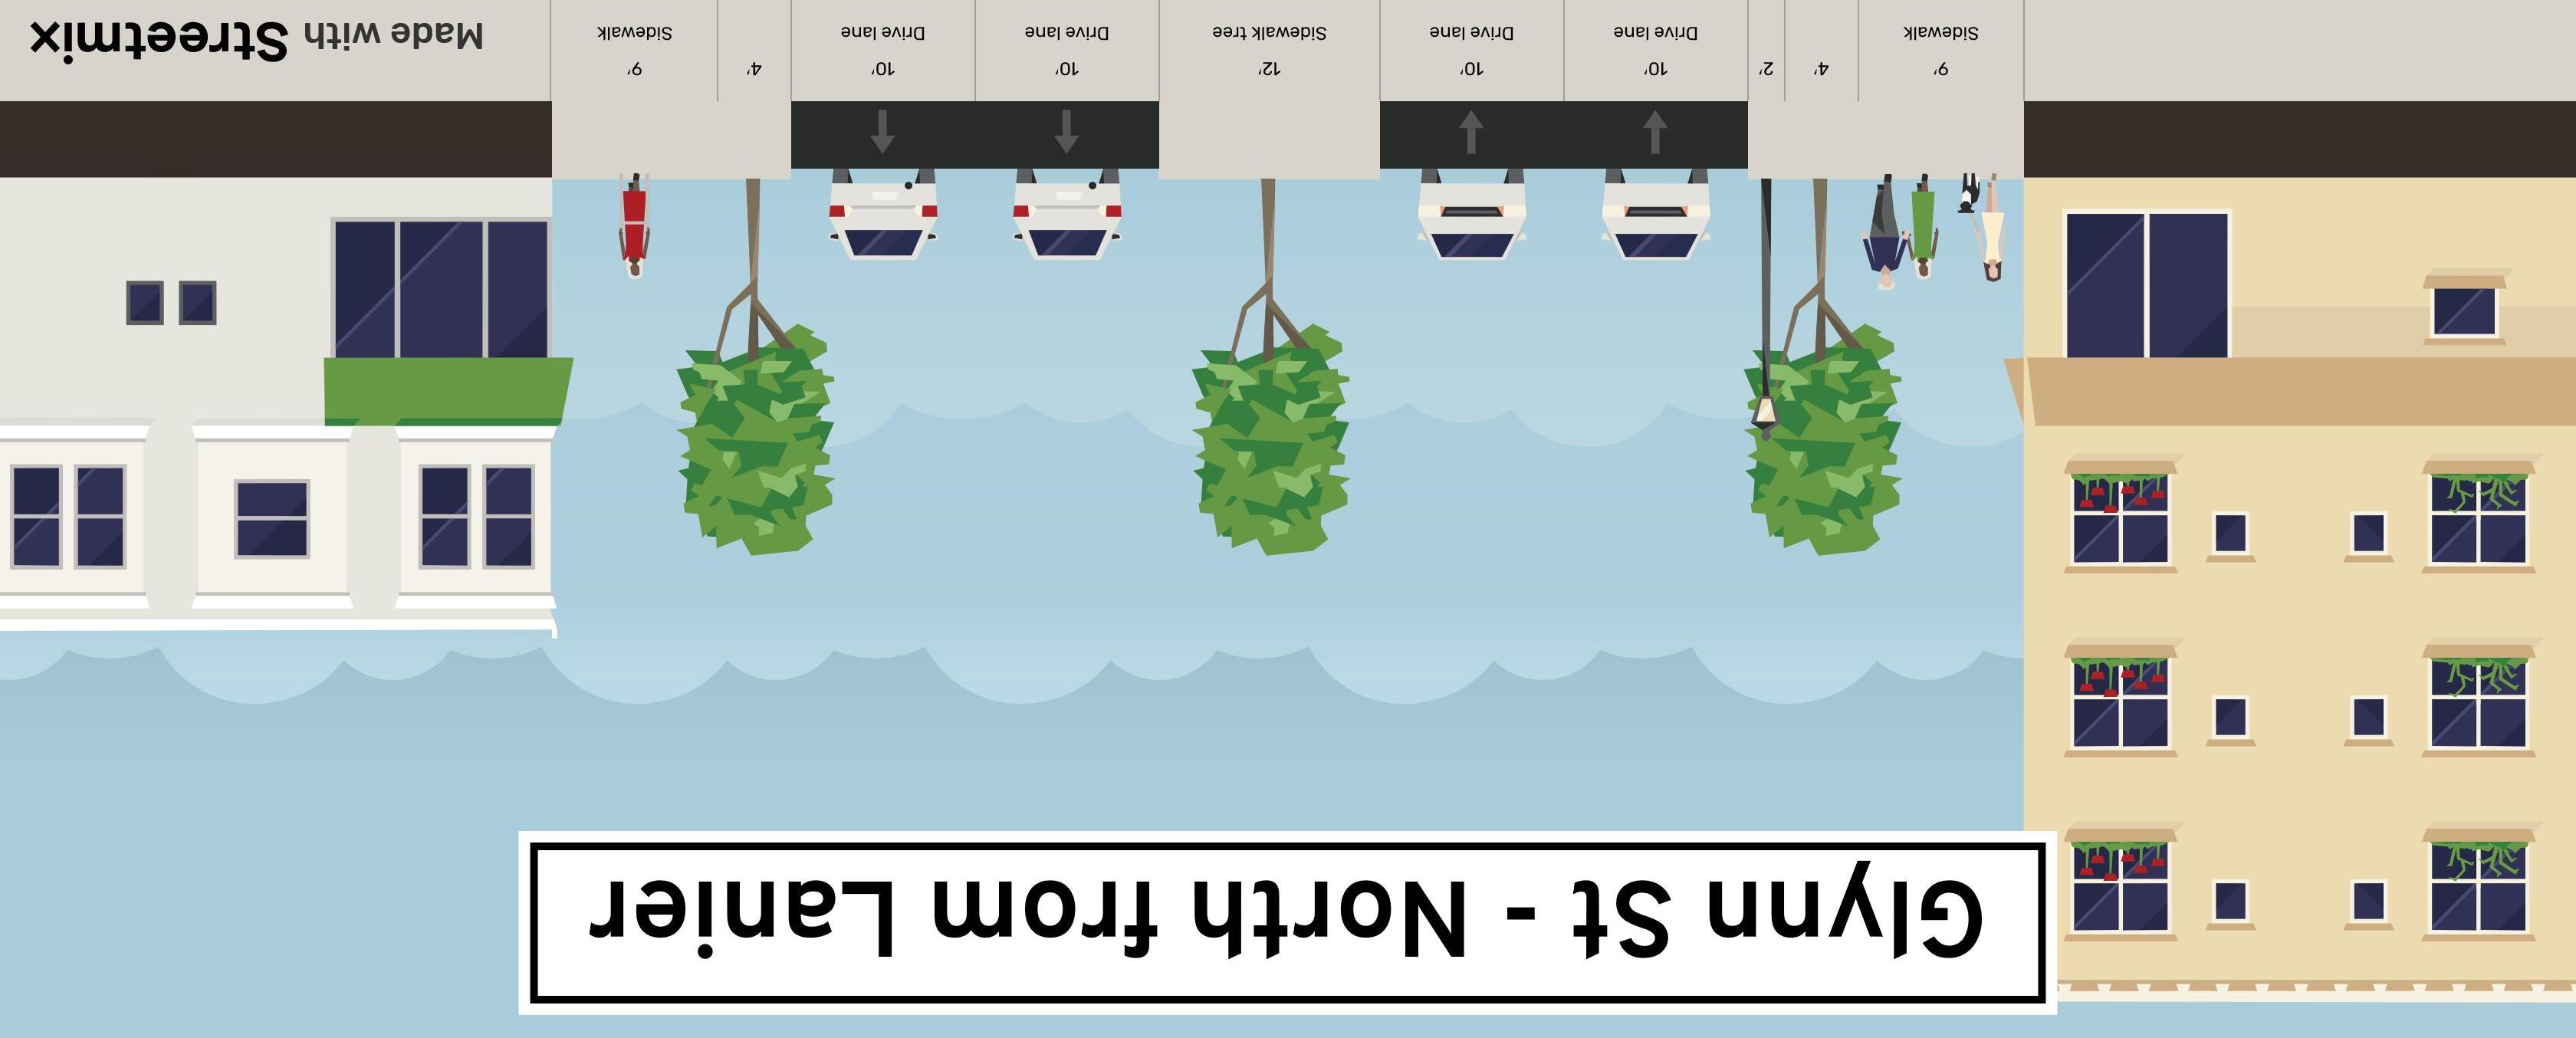


Development-oriented plan. Using pocket neighborhoods and a smart grid system of new streets and alleys, this plan maximizes the buildable area.


1. Pre-approve the plan sets with the best market fit:
Detached and attached single-units, convertible garages and guest suites, 2- and 3- story townhouses, ADU’s with carriage variants, apartment houses.
Conservation plan. This uses the same techniques as the development plan but preserves 40% of the total space for conservation.


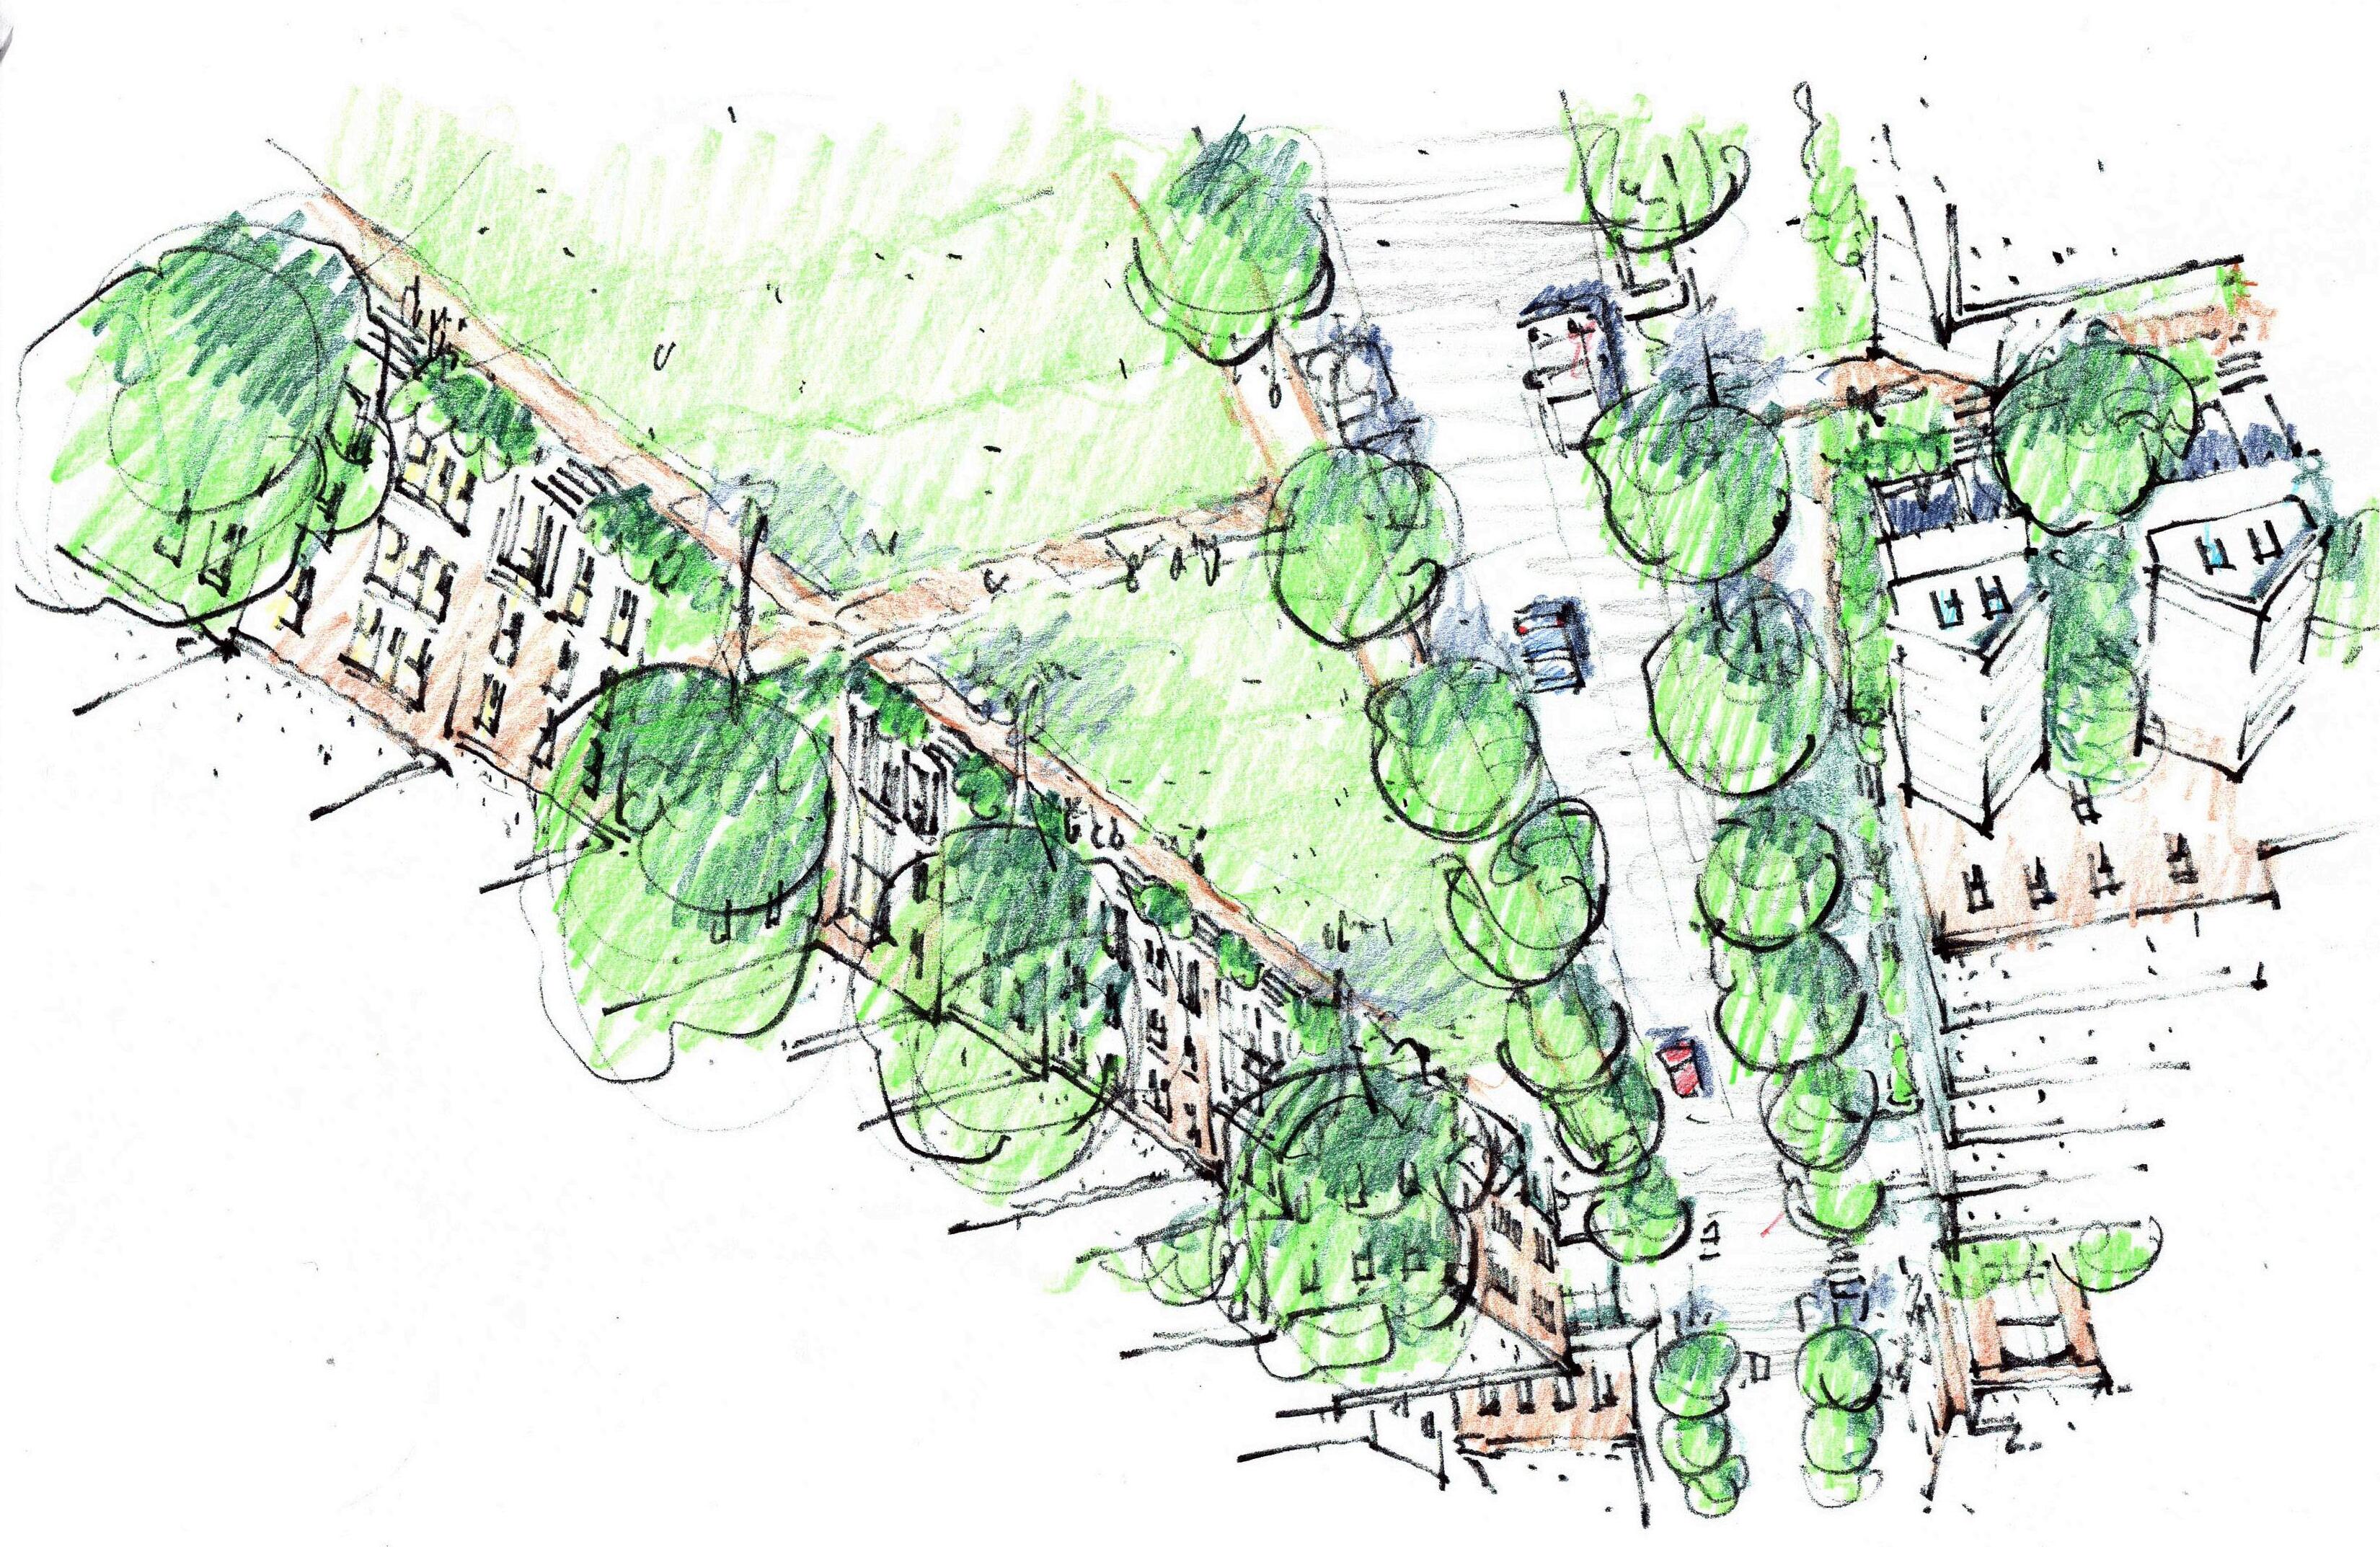


A pattern zone is an overlay code that supplements the underlying code by pre-approving specific buildings for construction on specific parcel. The city licenses architectural assets for construction by applicants and associates them with an expedited review process and supplemental criteria for site design and development. Using the plans is voluntary; applicants can still propose custom architecture via conventional review procedures. The result is a program that dramatically reduces
Program and policy design. Short list building types, define applicable areas, outline review processes.
Technical implementation. Short list and select specific buildings, site diagrams, supplemental development criteria, policy and process construction.


Program launch. Data onboarding, software demonstrations, process testing, launch event, affirmative marketing workplan.
• Cottages w/ carriage variants.


• Guest suites / garage.
• Detached fee simple, small and modest size.
• Attached fee simple.
• ADUs - attached and detached.
• Duplexes.
• Apartment houses (up to 4 units).


• Residential and mixed-use walkups.


• ACUs (Accessory Commercial Units).
• Carriage buildings.
• Fee-simple, primary dwelling (conventional).
• Fee-simple courts, detached and attached.
• Rear yard accessory structures. time-to-market in addition to direct savings.
Pre-approved building program. Multiple buildings are pre-approved for most parcels to ensure variety.
Program platform. An online platform makes accessing and administering the program straightforward.
It’s about the pattern. From a single building type four variations were ultimately pre-approved in Bryan, TX. These buildings are also pre-approved for construction in multiple site formats: as a primary dwelling, accessory unit, or pocket neighborhood. Images by MBL Planning, used with permission.
R John Anderson, Anderson | Kim Architecture & Urban Design
Hannah Carroll, Smith Planning Group
Dennis Decker, b + c Studio
Dan Osborne, MakeUP Design Operation
Matthew Petty, The Infill Group
Bob Smith, Smith Planning Group
Randy Vinson, Live/Work Building Company


Denise Brookins Director, Planning and Zoning
David Rast Director, Community Development
Mollie Bogle Atlanta Regional Commission
CoreTeam
Ray Gibson | City Manager
Brian Wismer Director, Economic Development
Carl Martin | Local Property Owner
Rev. Thomas Martin| Fayetteville First United Methodist
Walter Rodriguez | Town Square Jewelers
Sam Burch Historian/Local Resident/Lanier
Rick Seaman | Twisted Taco/Business Owner
Jim Thomas | Fayetteville First Baptist Church
Vickie Turner Historian/Local Artist/Mainstreet
David Burnett | Local Business Owner
Matt Teague Local Developer /Walton
Sarah Murphy | Local Resident/Planning Commission Chair
Bonita Askew Berry | Local Property/Sugar Hill
Hazel Askew| Historian/Local Resident/Sugar Hill
Sonja Gibson | Local Resident/Villages/Business Owner
Alfred Lee Dingler | Local Resident/Jeff Davis/ Business Owner
Rev. Velma Grant Pastor/Sugar Hill
Rev. Allyson Lawrence Fayetteville First United Methodist
Katie Pace Southern Conservation Trust

Sheba Ross | Project Director
Shelby Morris | Project Manager

Doug Childers Urban Planning Leader
Marwah Garib | Urban Designer


Hayley Todd | Existing Conditions and Zoning
Doug McClure Landscape Architecture
Russell Harrington | Landscape Architecture
Danny England | Existing Conditions and Character Analysis
Livable Centers Initiative (LCI) Study for Downtown Fayetteville, Georgia


September 2021
Darrell Howard | Mobility
Neil Desai | Zoning
David Laube Economic Development and Market Study
Jordan Rowe Economic Development and Market Study
Caroline Evans | Community Engagement
Amanda Hutton | Community Engagement
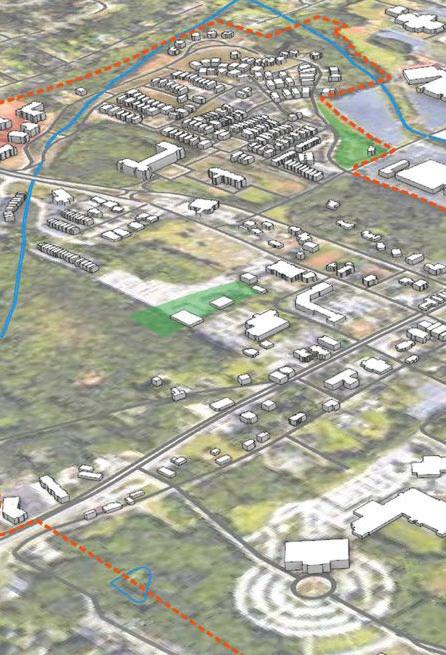


The Atlanta Regional Commission’s Livable Centers Initiative (LCI) is a grant program that incentivizes local jurisdictions to re-envision their communities as vibrant, walkable places that offer increased mobility options, encourage healthy lifestyles and provide improved access to jobs and services. The study area encompasses about 900 acres and addresses the Main Street area (sometimes referred to as the historic district) and includes downtown, and areas to Lafayette Avenue to the west, Gwinnett Street to the east, Georgia Avenue and North Jeff Davis Drive to the north and Grady Avenue and just north of Williamsburg Way to the south.

A work done through previous efforts and to ground the project by learning from precedents, prioritizing goals, developing actionable recommendations and documenting with clarity for an achievable outcome. The process hinged on community engagement with the goal to achieve sustainable outcomes using equitable decision-making methods, and deepen relationships and trust between government organizations, design teams and communities.
The LCI study is implementation-focused and hence features a multi-disciplinary team that will integrate urban planning & design, existing conditions, community engagement, market analysis, transportation, and zoning, in a collective vision for the Downtown Fayetteville study area. Key questions were asked from the perspective of these disciplines to kick-off the project and were accounted for in the final implementation matrix.
ExistingConditions
Howcanweusecurrentconditionstoleadustofuturepossibilities?
CONNECTIVITY
VALIDATE PREVIOUS EFFORTS
CONSTRAINTS
ENVIRONMENTAL ANDPHYSICAL
FRAMEWORK
ZONINGANDLAND USE
STREETSAND MOBILITY
MIXOFUSES
CHARACTER
OPENSPACE
PUBLICPARKS ANDASSETS
CommunityEngagement
WhatinvolvementandengagementopportunitiesworkwellinFayetteville?

SYNTHESIS INFERENCE

ADVERTISE INFORMATION EXCHANGE


Howcanweensurethatourplansaregroundedinmarketandfinancialreality?
Whatarethecomponentsforaholisticsolutionthatharmonizesthebuiltenvironmentandthepublicrealm?
ASSESS DEMOGRAPHICS
IMPACT
ZONINGAND GUIDELINES
EXAMINE LANDUSE PERFORMANCE
FORECAST SUPPLYAND DEMAND
STRATEGY SUMMARYAND RECOMMENDATIONS
StreetsandMobility
Howcanweachievebalancebetweenmobilityandplacemaking?
OPTIONS MOBILITY
MULTIMODA
MULTI-MODAL CONNECTIVITY
EQUITABLE ACCESSIBILITY
REFUGE SAFETY
PRECEDENTS BENCHMARK ANALYSIS

NEIGHBORHOODS CHARACTER
IDENTITY PLACEMAKING
GATEWAYS PORTALS
PEOPLE-FIRST PUBLICREALM

CLARITY STREETSCAPE
EVALUATE MULTIPLE SCHEMES
Zoning
COLLABORATION PLAN DEVELOPMENT
FRAMEWORK STANDARDSAND GUIDELINES
Whatmethod(s)willleadtothetypeofdevelopmentandoverallplaceenvisionedfortheMainStreetDistrict?
FRAMEWORK USEBASED

FRAMEWORK CHARACTERBASED
FRAMEWORK TRANSECTBASED
FRAMEWORK FORMBASED: TRANSECT
VEHICLES PARKING IDENTITY PLACEMAKING

STRATEGY SUMMARYAND RECOMMENDATIONS
FRAMEWORK OVERLAY
FRAMEWORK FORMBASED: FRONTAGE INFORM

ATTRIBUTES HISTORIC DESIGNATIONS ANDDISTRICTS
FRAMEWORK FORMBASED: BUILDINGTYPE


DESIGNGUIDELINES


Abackgroundanalysiswasconductedto reviewrelevantbackgroundinformationfrom previousandon-goingplansandstudies, plannedinfrastructureimprovements,relevant regulatorydocuments,andexistingconditions documentationoflanduse,physicaldesign characteristics,transportationsystems, environmentalfeatures,parksandopenspace systems,cityneeds,andhistoricresources. GISbaseddatawasgatheredandevaluated tounderstanddemographicsandhealth information.
AnalyzedPlans
• 2002 LCI Downtown Planning Study


• 2010 LCI Supplemental Study
• 2016 Market Study
• 2019 Paths Master Plan
Recurring themes and goals amongst previous plans:
• Comprehensive sidewalk network
• Multi-use trails -- for improved connectivity with Fayetteville and Fayette County


• A seat at the table for the Fayette County Plan
• Enhance safety
RevitalizeDowntown
• Emphasize walkability in street grid and pedestrian scale
• Improve zoning ordinance to permit a mixture of uses


» Use code to enhance pedestrian experience
» Unified streetscaping (improving aesthetics)
» Permit variety of housing types in proximity to downtown core
» Codify historic inspiration as a guide for new buildings
• Emphasis on placemaking/Downtown as a destination
• Specific marketing campaign for Downtown
• Parks, landscaping, trees
• Emphasis on historic character
• Unified signage standards referencing historic character
• Identify ownership
• Focus on those located in proximity of Downtown core to create unified streetscape
Forward:
• Identify infill parcels and ownership for redevelopment opportunities


• Create distinct character areas
• Emphasis on parks and recreation
• Facilitate better communication between public and city officials


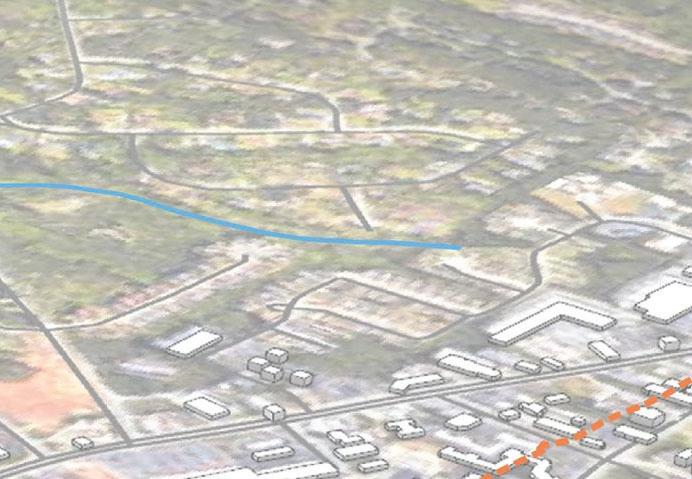


Parks and open spaces serve all residents of the community, and provide opportunities for community members of various backgrounds to come together for a variety of purposes


Parks and open spaces have been a critical aspect of successful community planning since the beginning of the 20th Century. Ever since the birth of community planning and city design, parks and open space have served as the “glue” that holds the city together by providing pedestrian and vehicle friendly linkages between important nodes in the city, promoting physical health and mental well being for the residents of the community, and providing space for public community events to take place which improves the quality of life for the community residents. Parks and open spaces serve all residents of the community, and provide opportunities for community members of various backgrounds to come together for a variety of purposes.
The City of Fayetteville, GA has made many efforts over the previous years to improve their parks and open spaces, and intentionally plan how these parks and open spaces can compliment the surrounding built environment. This section will address the efforts that have been made in the past to improve parks and open spaces in the city, and what issues and opportunities still exist today.

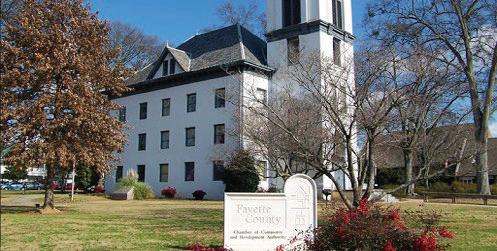
In 2002, the City of Fayetteville conducted an LCI Study, and as part of this study the community was engaged as to what issues and opportunities they saw the city facing. During this engagement, the community identified certain issues such as a need for a useful open space in Downtown Fayetteville, and the desire to provide a more pedestrian friendly environment downtown. Some of the opportunities the community identified include reduced traffic congestion, and increased facilities for pedestrians and bicyclists, as well as added public open spaces and green spaces able to host cultural events. At the time of this study, only 3% of the total city acreage was dedicated to parks and open spaces. Some of these areas include a park downtown, a pocket park north of Lanier Avenue on Church St., a cemetery, and an amphitheater constructed in conjunction with The Villages development. This discussion led to the identification of certain future projects that could help add more park space and open space to Downtown Fayetteville including a new Fayetteville Village Green to be surrounded by mixed use development and pedestrian amenities which can be used to host community events, the development of a central open space on Church St. as part of a green way in the Main Street Residential District, preservation of existing green space along Beauregard Blvd., redevelopment of the city park by the county office building, develop a greenway system connecting major city landmarks and residential clusters, and construct landscaped entry gateways at major intersections and nodes into the downtown area.
In 2010, an LCI supplemental study was conducted that identified three different development areas within the city. One of these developments, called Market Place at Lafayette, proposed the development of an attractive storm water management area which separates it from the accessing road that also provides a usable green space for the users of the development. In 2016, a Downtown Market Study was conducted to identify the issues and opportunities for downtown development. As part of this study, it was identified there is a need for a downtown square to serve as a starting point for development. This square was proposed to be located by the existing green space surrounding the Old Fayetteville County Courthouse. This study also identified a need for greenway that links the downtown area to the surrounding residential areas of the city. In 2017 the City of Fayetteville conducted a downtown re-development plan identifying three separate parcels for redevelopment potential near Lanier Avenue and Stonewall Avenue. This study included a network of proposed streets to lay the foundation for the future development parcels improving efficiency of pedestrian transportation throughout the area. The proposed layout and design 2 added 6.56 acres of green space to the downtown area connected with pedestrian friendly amenities including street and parking lot trees, rooftop gardens, a village green, a storm water park, a pedestrian tree ally with string lights, open art plazas, bioswales, amphitheater lawn with fountains, tree bosques,rain gardens, and playgrounds.
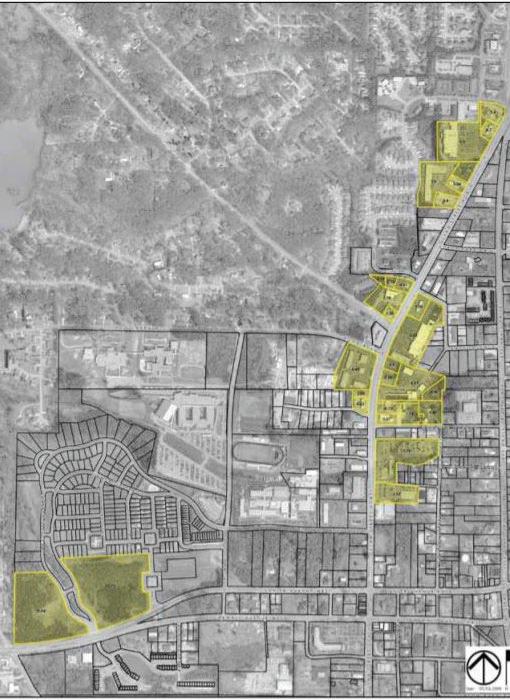
Within the same year, Fayette County voted to approve Special Local Option Sales Tax (SPLOST) which was meant to fund a variety of improvement projects throughout the city. Some of the projects related to parks and open spaces include the construction of a bridge crossing to connect the Fayette Piedmont Hospital to the existing path system, a master plan design for the expansion of the multi-use path systems, and landscaping medians on Hwy 85.
A comprehensive plan for the City of Fayetteville was also produced in 2017, which identified a total of 279.42 acres of land (3.71%) dedicated to parks and open space. Although there have been many planning and design efforts since the 2002 LCI Study, the amount of land still dedicated to parks and open space in 2017 had not increased much since 2002. The Comprehensive Plan identified issues related to parks and open space including the need for more sidewalks and multi-use paths to improve connectivity for improved walk-ability, the need for pedestrian oriented development that creates a safe distinction between the pedestrian and vehicular environments, the need to improve aesthetics around the gateways leading into the downtown area, and the need to increase the amount of parks and green space in the downtown area. It also identified that as an opportunity the city had SPLOST funding available for land acquisition of park space, and expressed the community’s desire to improve parks and green space within the city in the community driven goals and objectives. The Comprehensive Plan also identified several projects that would increase the amount of parks and open space in the city including the construction of a new downtown park, a feasibility study for park water features, park improvements at the existing gazebo, park improvements at The Ridge, development of a city trails plan for connectivity, and the continued installation of street trees and landscaped medians. Some of the record of accomplishments identified in the Comprehensive Plan related to parks and open space include the implementation of the Open Space Plan for the development and preservation of parks and green spaces throughout the city, the identification of opportunities to provide green space connectivity, and the development of local and regional partnerships to preserve existing green spaces and develop a regional multi-use trail system.

The 2002 LCI study identified opportunities for public space, new development, and traffic calming mobility interventions that would be conducive to pedestrian connectivity, community events, and preservation of green space.
The 2017 LCI study produced a comprehensive plan for the city of Fayetteville and identified issues related to walkability and pedestrian access.
The 2018 Capital Improvements Element further expands on how the city intends to provide future land for parks and open spaces with the use of impact fees for future development. It identifies the current parks located within the city as Jack Day Park, Burch Park, Jeff Davis Park, Patriot Park, and Church Street Park. It also identifies The Ridge as a large 308 acre conservation area. The trails located within the city include the Redwine Multiuse Path, the Patriot Park walking trail, and the Lester Road Multi-use Path. This study also identifies future growth projections for parks and open space to increase by approximately 22 acres by 2040 and conservation acres to increase by 234 acres, and identifies the funding methodology to accomplish this goal. One of the projects that this study identifies that will increase park space within the city is the addition of an 8 acre city park to be included within the design of a new City Hall building. The City of Fayetteville 2019 State of the City Address reinforced this desire by announcing the project for a new city center complex that includes amenities for the community to the public. The City of Fayetteville has completed many studies identifying the community’s desire for an increase in parks and open space, and these desires are now starting to be developed as the city plans to continue to grow and prosper.

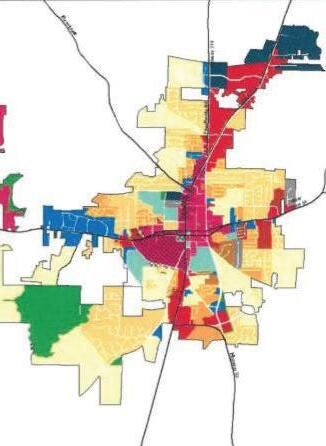

The 2018 Capital Improvement Study builds off of previous LCI studies through thoughtful research while also asking new, relevant questions to provoke innovative solutions for public park space.
The City of Fayetteville has completed many studies identifying the community’s desire for an increase in parks and open space, and these desires are now starting to be developed as the city plans to continue to grow and prosper.
In March of 2018, a community stakeholder meeting was conducted that focused on the Master Path Plan and the development of a county-wide network of sidewalks, side paths (bi-directionally multi-use path along side of roadways), greenway trails, and bicycle routes. This meeting brought a variety of community members from various backgrounds together in an effort to identify common community interests. Community desires for various locations for bicycle routes, pedestrian walkways, and golf cart facilities including sidepaths, greenway trails, shoulder bikeways, signed shared roadway, and sidewalks were discussed and cataloged. The meeting generated a significant amount of feedback for desired pathway connections. Common desired connection locations included a sidepath connections between Peachtree City and Fayetteville along Redwine Road, a sidepath on SR 54, and bicycle facilities on Bernhard Road and Brooks Woolsey Road. Common desired connection destinations include a regional trail connection in southern Peachtree City as well as connections to the Starr’s Mill school cluster as a starting point for the development of the Master Path Plan. The Master Path Plan includes design guidelines that cover the specifics of the path designs and how they should be constructed in relation to the existing environment. The Master Path Plan discusses a City Hall project that will update land-use, pedestrian transportation networks and traffic patterns within the downtown area, while at the same time being integrated with expansion efforts of paths and sidewalks throughout the city, including enhancing the network of streets connecting SR 54, SR 85, Beauregard Blvd, and Grady Avenue. The City of Fayetteville used SPLOST funding in 2018 to purchase approximately eight acres of land from the Fayette County Board of Education for the development of a city park adjacent to the Fayette County Public Library and new City Hall building providing many opportunities for pedestrian and bicycle connectivity.
Recommendations Report November 2019

“The MPP will connect population centers, schools, parks, commercial land use, and other recreational opportunities. The MPP will accommodate pedestrians, bicyclists, and golf cart users.”
2019 Fayette Transportation Plan and Master Path Plan

Slope Analysis Map
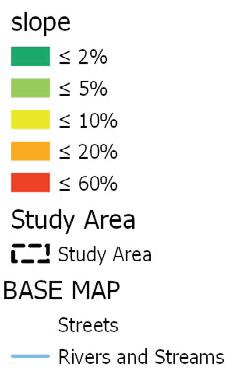

• To better understand the mobility systems of the LCI study area and the places that they serve within Downtown.
• To understand the operational characteristics of the mobility network.
• To serve as a basis for a discussion about changes and improvements to the mobility network.
• Depicts roadway functional classification within the study area
• Illustrates signalized intersections within the study area
• Illustrates roadway traffic volumes as identified by GDOT count stations.
• Illustrates roadway level of service based on traffic volumes and roadway characteristics

• Illustrates bike lanes, multi-use paths, and sidewalks
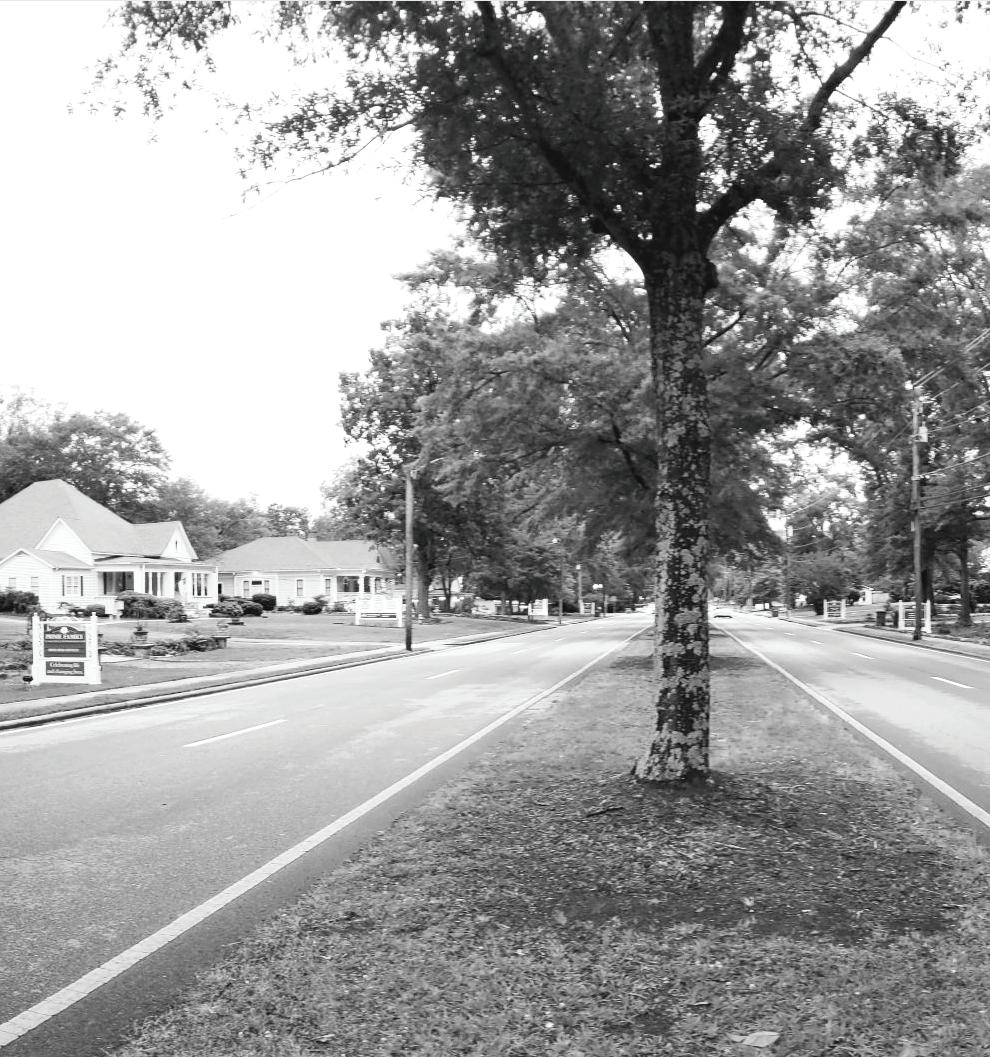
• What gaps exist within the transportation system?
• What information is missing from the existing conditions analysis?
• Where can traveler safety be improved?
• Where are the opportunities to improve bicycle and pedestrian mobility?
• Where are the opportunities to improve access and connections?
1. Aesthetics
» Improve downtown street-scape
» Unify street-scape along travel corridors into Downtown
2. Prioritize connectivity and walk-ability
» Use redevelopment to create smaller blocks
» Use redevelopment to develop downtown street grid
» Between SR 54/Stonewall Avenue and Grady Avenue
» Develop comprehensive sidewalk network
» Connect with Fayette County multi-use trail system
» Inter-parcel connectivity
3. Incorporate bicycle infrastructure
» Widen existing bike lanes from 4 to 6 feet
» Extend existing Class II bike facility to Jeff Davis
» Connect existing bike facilities with the larger mobility network
» Identify additional bicycle infrastructure opportunities
4. Operational and Safety Improvements
» Continue intersection improvements
» Address access management along SR 54 and SR 85
» Extend landscaped median on SR 85/Glynn Street South
» Improve Beauregard Boulevard and SR 85/Glynn Street South intersection
5. Parking
» Increased need/demand for parking downtown
» Explore the potential for shared-use parking
» Parking placement for new development
• Continue operational improvements
• Continue to enhance traveler safety
• Develop a connected street network
• Support redevelopment and place-making activities
• Develop local bicycle network and infrastructure
• Enhance pedestrian mobility
The City of Fayetteville undertook an LCI Study in 2002. The study identified a series of transportation improvements intended to improve connectivity and circulation within Fayetteville’s downtown area. The LCI recommendations mainly focused on congestion relief strategies, safety improvements, and non-motorized travel alternatives. Specifically, the study recommended implementing intersection and traffic signal improvements along SR 85/Glynn Street between LaFayette Avenue and SR 54/Stonewall Avenue. The study also recommended safety improvements for SR 85/Glynn Street, namely the installation of medians.
The 2010 LCI Supplemental Study is an update to the 2002 LCI Study. Like the 2002 study, the 2010 LCI Supplemental addressed connectivity and circulation within Downtown Fayetteville. The LCI Supplemental placed an increased focused on walk-ability and access management. It also presented concept plans for:
• Extending Hillsdale Drive to SR 85/Glynn Street
• Extending Church Street to Kathi Avenue
• Intersection improvements at SR 92/Forrest Avenue at SR 85/Glynn Street
• Church Street at Kathi Avenue
• Hood Avenue at SR 92/Forrest Avenue Roundabout
The Fayette Transportation Plan is Fayette County’s Comprehensive Transportation Plan (CTP) and identifies a set of short-term, intermediate, and long-range transportation system development opportunities. As it relates to the City of Fayetteville, specifically the LCI study area, the Fayette Transportation Plan primarily identifies opportunities to develop the County’s Master Path Plan. It envisions a network of multi-use side paths and trails that run through the Downtown, connecting to provide cross-county and regional movement. Additionally, the Fayette Transportation Plan lends support for the City of Fayetteville’s use of Special Purpose Local Option Sales Tax (SPLOST) program funding, and the development of the Fayetteville City Center.
The 2019 Traffic Engineering Study is an operational analysis of several roadway intersections within the Fayetteville LCI area, focusing on the major roadways entering and exiting Downtown Fayetteville from the north. The Traffic Engineering Study is periodically updated and has been used to identify, prioritize, and program low-cost, easy to implement intersection and signal modifications. Referenced in the 2010 LCI Supplemental Study, the Traffic Engineering Study has been credited with improving vehicular flow through Downtown Fayetteville, reducing delay-based congestion, and improving roadway safety.
Downtown Fayetteville’s roadway network is not comprised of the traditional grid pattern of streets. Instead, the LCI study area’s roadways are organized in loose hierarchical street classification system. These classifications - principal arterials, minor arterials, collectors, and local streets - define a roadway’s desired functional and operational characteristics. The Fayetteville LCI study area contains approximately 22 miles of total roadway. Principal and minor arterials, 4.1 miles and 2.5 miles respectively, serve as the primary access routes to Fayetteville’s downtown area, and are the principal vehicular travel routes into, out of, and through the LCI study area. Approximately 6.2 miles of collector roads and 9.2 miles of local streets provide for the study area’s internal circulation. Functionally classified roadways include:
State Route (SR) 54/Lanier Avenue is functionally classified as a principal arterial. For the entirety of its length across the middle of the LCI study area, SR 54 is a median divided facility. For approximately 1.15 miles through Downtown Fayetteville, SR 54 is split into a one-way pair of eastwest streets identified as Lanier Avenue (westbound) and Stonewall Avenue (eastbound). In addition to providing access and thru travel to Downtown, SR 54 connects to residential neighborhoods and commercial development at either end of the study area. West of SR 85/Glynn Road, SR 54/Lanier Avenue hosts a Class II bikeway.
SR 85/Glynn Avenue traverses Fayetteville from north to south and is a five-lane (four-travel lanes and a two-way left-turn lane) roadway. It is functionally classified by the Georgia Department of Transportation (GDOT) as a principal arterial north of SR 54/Lanier Avenue. South of SR 54/Lanier Avenue, SR 85/Glynn Road is functionally classified as a minor arterial. Along the entirety of its length through the City of Fayetteville, SR 85 primarily serves various commercial land uses.
Jeff Davis Drive is a four-lane roadway facility that is functionally classified as a minor arterial roadway. Traversing the city from north to south, Jeff Davis Drive changes design cross-sections and development character several times within the LCI study area.
Grady Avenue is a two-lane major collector roadway that connects SR 54/Lanier Avenue with Beauregard Boulevard and SR 85/Glynn Street. Grady Avenue’s development character is variable over its length, with commercial and office developments located at its nodes with SR 54/ Lanier Avenue and SR 85/Glynn Street. Grady Avenue is characterized by residential development and large undeveloped parcels between its two major intersections.
Beauregard Boulevard is a two-lane minor arterial roadway with nodes within the LCI study area at SR 85/Glynn Street and Grady Avenue. Beauregard Boulevard is characterized by large lot residential development and undeveloped land parcels within the study area.

LaFayette Avenue is an east-west roadway that connects SR 85/Glynn Street and SR 54/Lanier Avenue. Although classified as a local roadway by GDOT, the City of Fayetteville has identified LaFayette Avenue as a collector roadway. The facility is the primary access to the Villages at LaFayette, a planned community. Between SR 85/Glynn Street and Tiger Trail, LaFayette Avenue is a three-lane (two lanes westbound, one lane eastbound) roadway. It serves traffic related to the Fayette County Public Schools as both administrative functions, and the Fayette County High School are located along the street. West of Tiger Trail, LaFayette Avenue becomes a two-lane median divided roadway that primarily serves residential land uses within the Villages at LaFayette planned community. At Campaign Trail, LaFayette Avenue becomes a one-way roadway going westbound toward SR 54/Lanier Avenue. Eastbound oneway traffic travels along Campaign Trail through the Villages at LaFayette. On-street bike lanes are present on both LaFayette Avenue and Campaign Trail.
The LCI study area’s roadways are controlled by a variety of traffic control devices. Most intersections internal to residential neighborhoods within the study area are stop controlled by all-way signs. This is consistent with the low-speed and walkable nature of the study area’s neighborhoods. The LCI study area, however, does not have a consistent street grid, and the street network is reflective a suburban community whose development follows a linear path along major travel corridors. Traffic signals are present along arterial roadway that traverse the study area and bisect the downtown area. These signals help to facilitate higher volumes of traffic flow at major intersections.
Grady Ave.Through rethinking the role of existing roads, solutions are proposed that provide pedestrian connectivity, traffic-calming, and vehicle access where it is most necessary.
Roadway Facilities in the Study Area
Since the early 2000s, traffic volumes on SR 54/Lanier Avenue and SR 85/Glynn Street have declined, and appear to have plateaued. 2019 Average Annual Daily Traffic (AADT) taken from GDOT’s Traffic Analysis and Data Application (TADA) system shows that AADT along SR 54/Lanier Avenue west of Downtown was 26,700 vehicles per day. West of SR 85/Glynn Street, the SR 54 one-way pair comprised of W. Lanier Avenue (eastbound) and Stonewall Avenue (westbound) has an AADT of 11,500 vehicles per day and 13,100 vehicles per day, respectively. East of SR 85/Glynn Street, Lanier Avenue has an AADT of 11,500 vehicles per day; Stonewall Avenue has an AADT of 10,300 vehicles per day. East of Downtown, SR 54/Lanier Avenue has an AADT of 24,000.
SR 85/Glynn Street, between LaFayette Avenue and SR 54/ Lanier Avenue, has an AADT of 32,200 vehicles per day. SR 85, between Stonewall Avenue and Beauregard Boulevard, has an AADT of 25,200 vehicles per day. Between Beauregard Boulevard and Grady Avenue, SR 85 has an AADT of 22,200 vehicles per day.
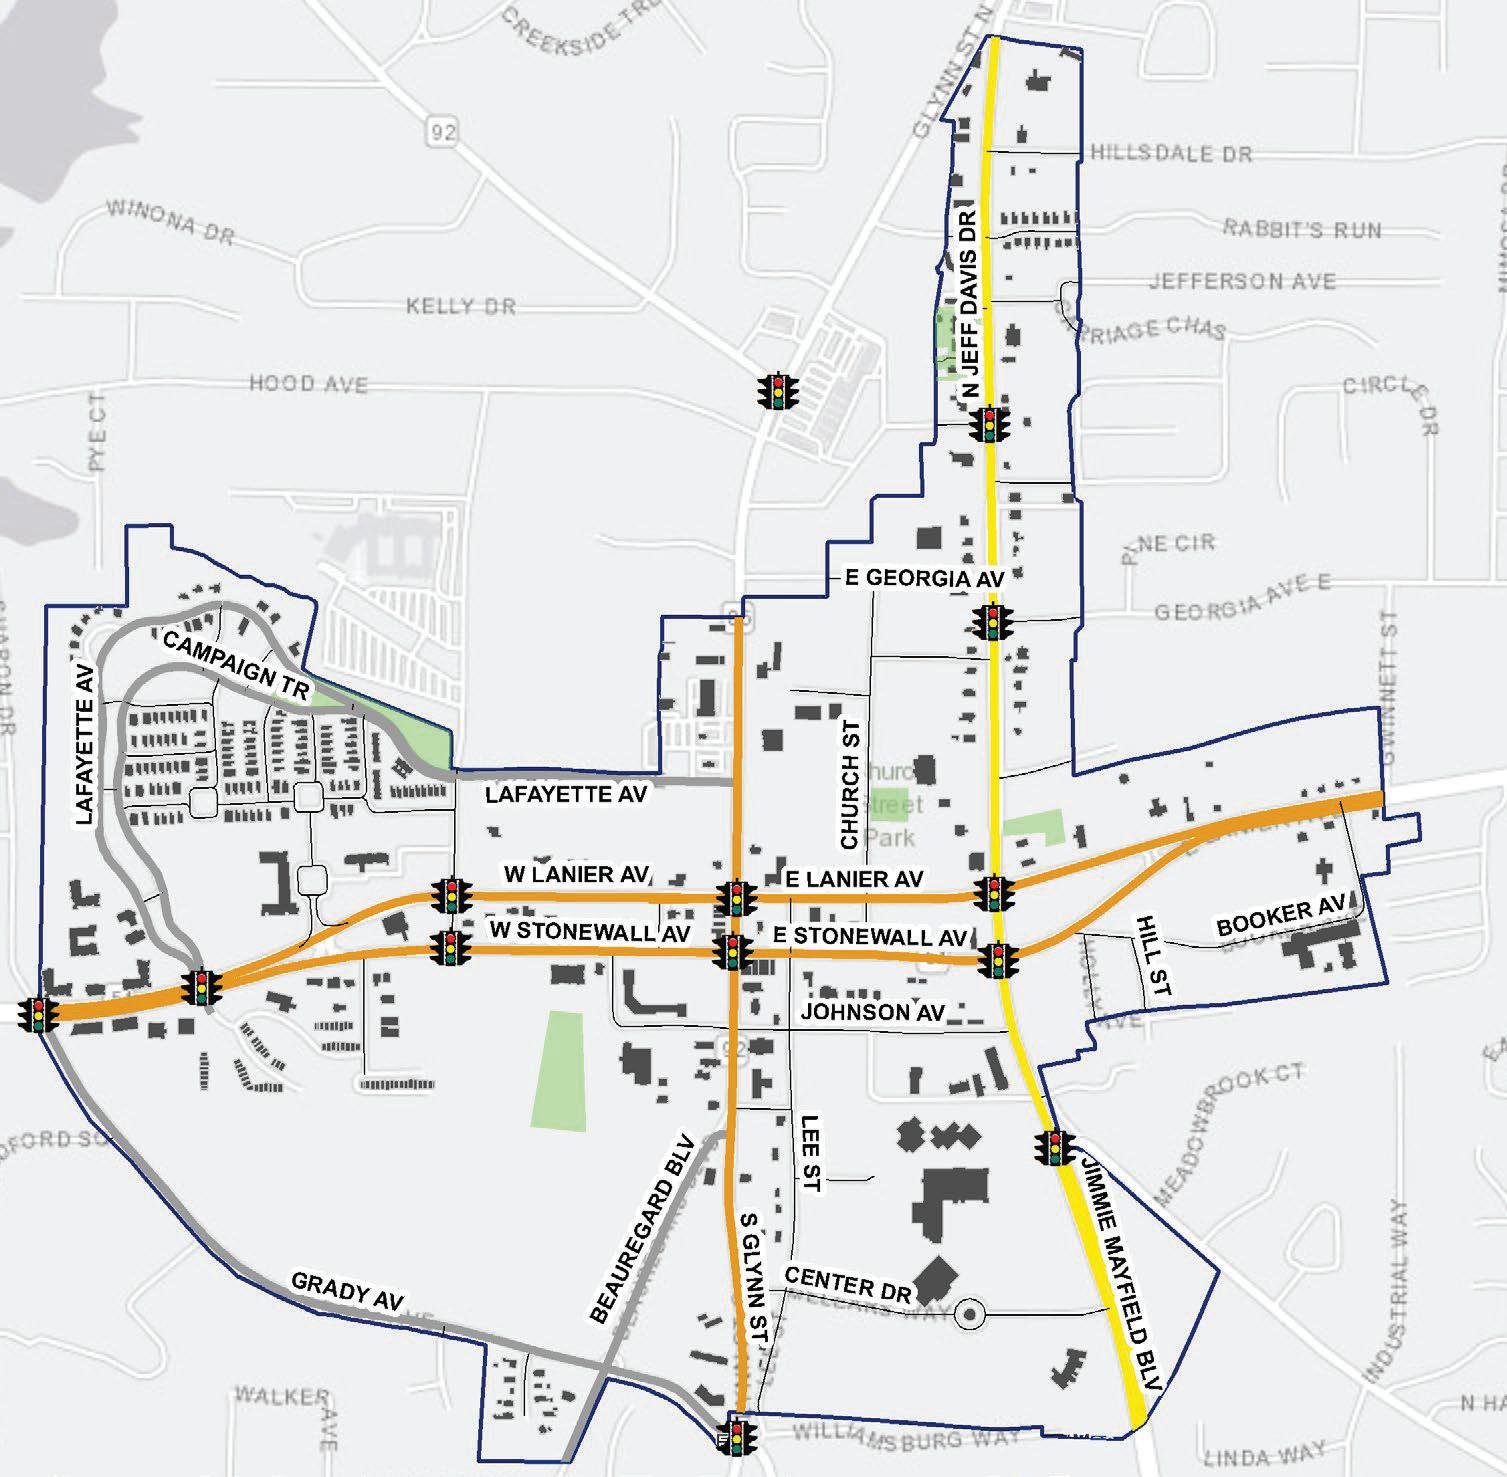
Jeff Davis Drive near Rabbit Run has an AADT of 17,700 vehicles per day. Grady Avenue near Bradford Square has an AADT of 13,000 vehicles per day. Grady Avenue near Beauregard Boulevard has an AADT of 10,900 vehicles per day.
AADT data were evaluated using the Florida Department
of Transportation’s General Annual Average Daily Volumes table. This tool is specific to signalized arterials in urbanized areas and considers roadway design characteristics such as thru travel lanes, medians, and exclusive turn lanes. It also considers speed characteristics, directionality, and roadway ownership.

The table below illustrates the AADT versus the available capacity per the volume General Annual Average Daily Volumes.
RouteCountLocationCapacityAADTLOS
SR54/E.LanierAveE.ofBookerAve33,80024,000C SR54/E.LanierAveE.ofJeffDavisDr12,48011,800C SR54/E.LanierAveW.ofJeffDavisDr12,48011,500C SR54/W.LanierAveW.ofSR85/GlynnSt.12,48011,500C SR54/W.LanierAveWofGradyAve33,80026,700C SR54/StonewallAveWW.ofSR85/GlynnSt.12,48013,100E SR54/StonewallAveEE.ofJeffDavisDr12,48012,300D SR54/StonewallAveEW.ofJeffDavisDr12,48010,300C SR85/GlynnSt.NN.ofSR54/LanierAve33,80032,200C SR85/GlynnSt.SS.ofSR54/StonewallAve33,80025,200C SR85/GlynnSt.SNofBeauregardBlvd33,80022,200C JeffDavisDriveNearRabbitRun30,42017,700C GradyAveNearBradfordSquare10,92013,000E GradyAveW.ofBeauregardBlvd10,92010,900E
Data shows that traffic volume has plateaued on major streets. Fayetteville moves forward by considering how streets are not only efficient, but also safe.

The 2019 Traffic Engineering Study went further to analyze roadway operations and evaluated several intersections within the LCI area. Because this evaluation process is ongoing and past improvements recommendations have been implemented, most of the intersections analyzed operate sufficiently under existing conditions. The SR 54/Lanier Avenue at Grady Avenue intersection and the SR 85/Glynn Street South at Beauregard Boulevard intersections were the two exceptions. Both intersections operate at a level of Service D, which is not bad but also not good. They are expected to experience significant delays under future conditions without any new development being added to them. The 2019 Traffic Engineering Study is included in the Appendix.


Sidewalks or shared-use paths are generally present along all streets within the LCI study area, with a few exceptions. The pedestrian experience when traveling on these facilities varies greatly and is dependent on factors such as:


• Traffic volume
• Sidewalk width and physical condition
• Quality of the sidewalk surface
• Obstructions
• The presence of landscaping and street furniture
• Public art (g) building frontages, and
• Neighboring use
W. Lanier Avenue and Stonewall Avenue, between SR 85/ Glynn Avenue N. and Tiger Trail, features a pedestrian realm that accommodates employees and visitors to the area. Street furniture, e.g., sitting benches and landscaping, provide a comfortable pedestrian environment where people are encouraged to stroll, linger, and sit along W. Lanier Avenue and Stonewall Avenue. Sidewalks along the LCI area's other arterial and collector roadways and local streets also facilitate pedestrian travel.
Marked crosswalks facilitate pedestrian crossings at intersections through downtown Fayetteville along the primary travel corridors. Generally, marked crosswalks are present on all legs of signalized or all-way stopcontrolled intersections. Some side-street stop-controlled intersections – LaFayette Avenue at SR 85/Glynn Street N. and Beauregard Boulevard/Redwine Road – are missing crosswalks to facilitate movements between sidewalk endings/beginnings.
Some of the pedestrian network challenges include gaps in the network, especially between facilities located on functionally classified roadways and local streets, and between regional facilities entering the study area from different directions. Identified challenges include the brick sidewalk pavers along both Lanier Avenue and Stonewall Avenue. While attractive and adding to the downtown area's historic charm, this decorative surface material could potentially pose risks to mobility challenged individuals, particularly to those who are unsteady on their feet or use mobility assistance devices such as walkers, canes, or wheelchairs. This is especially true if the pavers are not well maintained. Risks to travelers come from loose, tilted, or cracked pavers or large gaps between them. Another identified challenges to travelers using sidewalks and side paths, especially on local streets, is adequate maintenance (or lack thereof) of vegetation adjacent to the facilities. Overgrown bushes, low hanging tree branches, and grass growing onto the path can push travelers off the sidewalk/ sidepath and street.
There are two Class II bicycle facilities within the LCI study area. Class II facilities, commonly referred to as bike lanes, are dedicated facilities for bicyclists immediately adjacent to automobile traffic. Class II facilities are identified with striping, pavement markings, and signage. The West Lanier Avenue bike lane extends approximately 1,500 feet from SR 85/Glynn Street North to Tiger Trail. The LaFayette Avenue bike lane extends from Tiger Trail to SR 54/W. Lanier Avenue, through the Villages at LaFayette community.


The LCI study area ensures that the pedestrian experience is safe, comfortable, and continuous. Giving people the ability to walk or bike lowers traffic volume and enables them to be healthier through physical activity.
Bicyclists traveling within the LCI area can utilize the onstreet bicycle infrastructure, off-street infrastructure such as shared-use trail facilities, and bicycle-friendly street, i.e., roads that are low-volume and low-speed, to access and move around the study area. At present, there are no public bicycle parking or storage facilities, especially within the downtown area.
The 2002 LCI Study discussed the need for additional public parking to support commercial and mixed-use land uses. As noted in that study, the existing parking supply for existing commercial and mixed-use parking was underutilized during peak demand periods by an estimated 40-50%. The subsequent 2010 LCI Supplemental Study recommended incorporating shared use parking for new development when feasible, reducing parking requirements as an incentive for redevelopment, and adding bicycle parking. Additionally, the 2010 study recommended making public parking more easily accessible. This sentiment was echoed by City of Fayetteville staff during the project kickoff meeting, particularly during discussions about creating and utilizing civic spaces. City staff shared plans for the new City Hall development pointed out that public parking will be available as a part of this project, renovations to the Fayetteville Library, and the development of the proposed City Center Parkway.
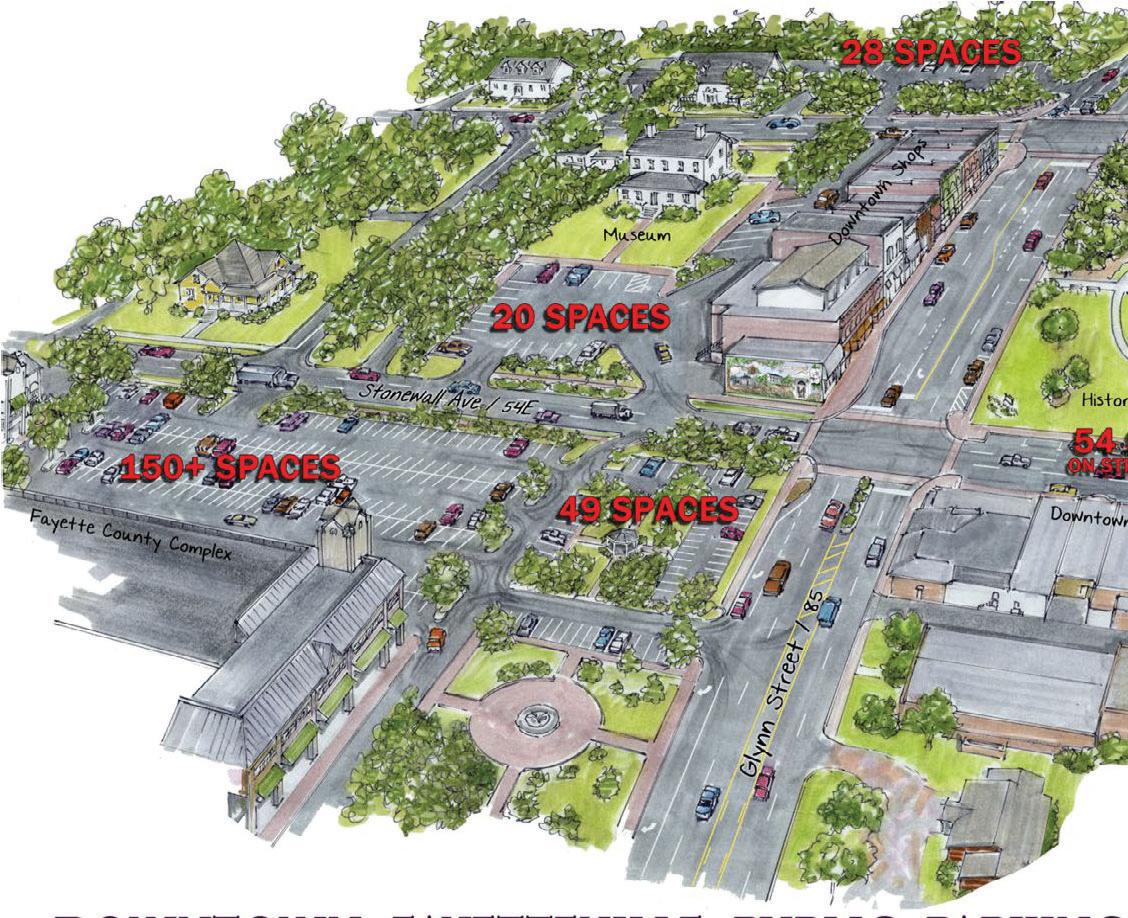

A high-level windshield survey was performed of parking using Google maps and information obtained from the City of Fayetteville’s website. The survey was intended to identify existing on-street and public parking supply within Downtown and inform a census of public surface parking.


Between SR 85/Glynn Street between Lanier Avenue and Stonewall Avenue and along Stonewall Avenue between SR
85/Glynn Street and Less Street, a total of twenty (20) onstreet parking spaces are available to the store front shops. Forty-eight (48) on-street parking spaces also are available around the Historic Courthouse. An estimated 340 parking spaces are available in public surface parking lots within downtown. This includes 224 parking spaces at the Fayette County Annex Complex, 20 spaces at the Holiday Dorsey Five Museum, and 28 spaces at 145 Lanier Avenue. Each of these is within walking distance to downtown attractions and restaurants.
Downtown Shops - Stonewall Parking Fayette County Annex Parking Public Parking in Downtown FayettevilleAn estimated 340 parking spaces are available in public surface parking lots within downtown... Each of these is within walking distance to downtown attractions and restaurants.
In addition to the existing on-street and surface parking, the City of Fayetteville will expand its parking inventory in 2021 with the opening of its new City Hall complex. 218 parking spaces are included as a part of this facility’s development. The parking will be situated along two parallel driveways located on either side of the new complex. These driveways will enable entry and egress onto Stonewall Avenue and entry and egress onto a new east-west roadway, City Center Parkway, located south of the development. Parking along the driveways will be configured like head-in onstreet parking spaces and protected by curb-extensions that frame the driveways’ travel lanes. Eighttwo (82) parking along the new City Center Parkway also will be head-in parking protected from the travel way by curb extensions. In total, 300 new parking spaces will be created with the new City Hall development and the City Center Parkway’s first phase.


An additional 300 parking spaces will be added to Fayetteville’s downtown parking inventory with the opening of the new Fayetteville City Hall complex. 218 surface parking spaces are included on the City Hall campus. 82 on-street spaces are include in the first phase of the new City Center Parkway.


• To gain a better understanding of the built and natural characteristics of the Downtown study area and the various places that they create within Downtown.
• To observe how recent and new developments impact or will impact the prevailing character of their surroundings.
• To serve as a basis for a discussion with the City about the prevailing character areas and their future treatment through zoning.

• Depict “character areas” based on common: building forms, orientation of buildings toward streets, setbacks, front yard treatment, street characteristics, property lines, and land uses.
• The table assigns a number and descriptive name for each character area, along with identifying the type of place it is (a District, Corridor, Node, or Neighborhood), The numbers on the map correspond with those in the accompanying table.
• The colors of the character areas correspond with the predominant land use (red for commercial, yellow for residential, purple for industrial, and brown for institutional) the predominant building type present, the zoning districts that currently apply, along with many character attributes.
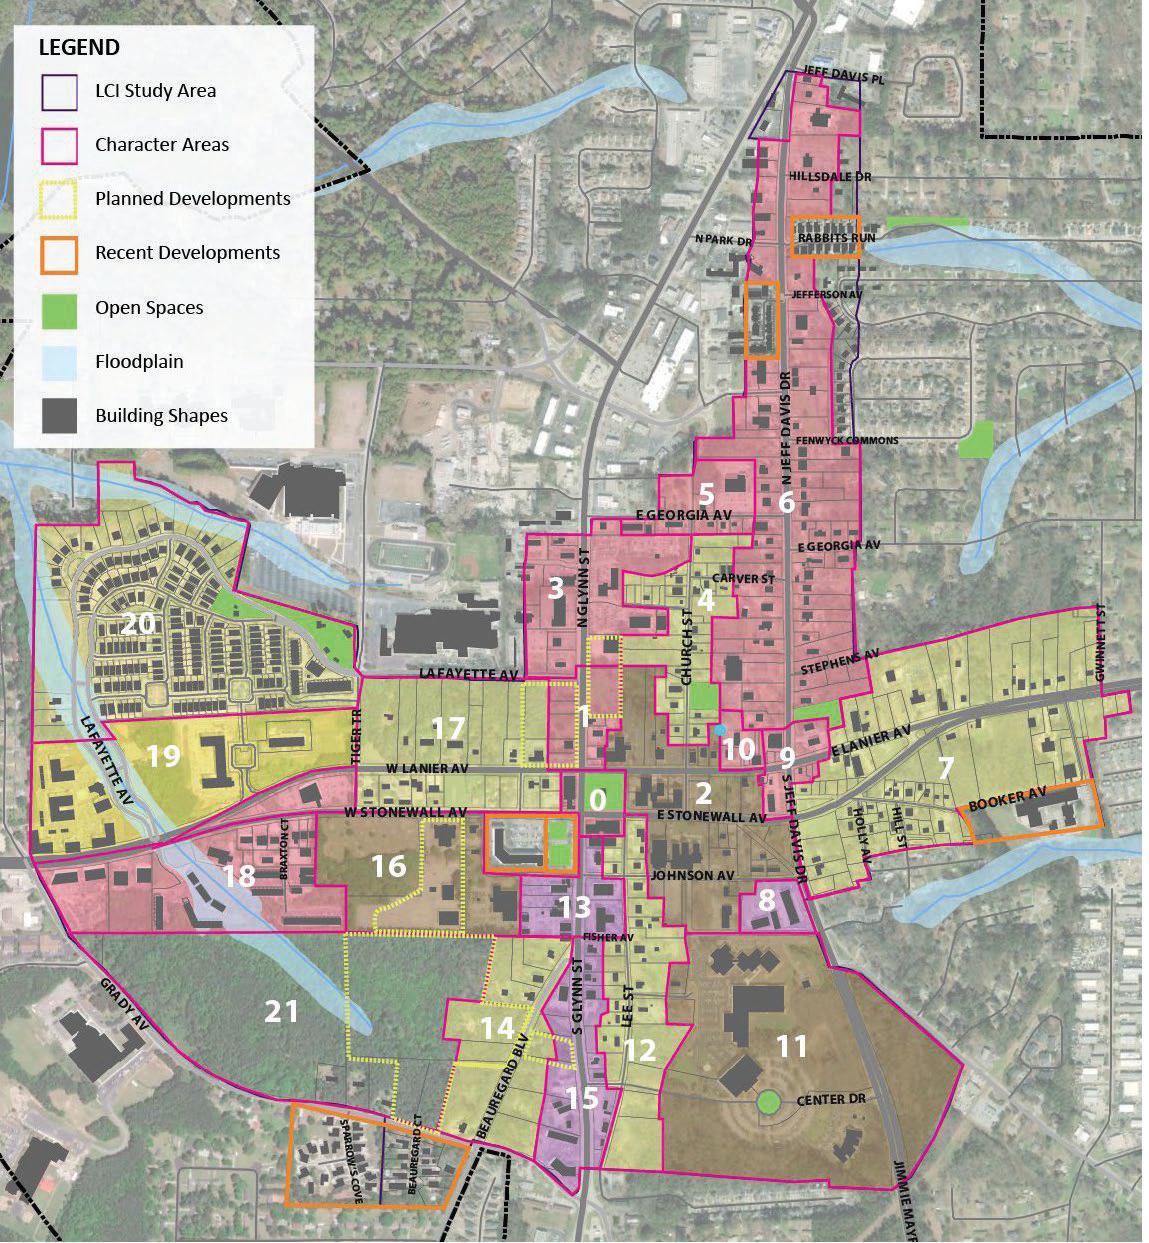 The Villages at Lafayette Park
RMF-15MULTI-FAMILYRESIDENTIAL
R-THCRESIDENTIALTOWNHOUSECONDOMINIUM
RPRESIDENTIALPROFESSIONAL
MOMEDICALOFFICE
OIOFFICEANDINSTITUTIONAL
C-1DOWNTOWNCOMMERCIAL
C-2COMMUNITYCOMMERCIAL
C-3HIGHWAYCOMMERCIAL
CC-3CONDITIONALC-3
C-4HIGHINTENSITYCOMMERCIAL
BPBUSINESSPARK
M-1LIGHTMANUFACTURING
M-2HEAVYMANUFACTURING
PDPPLANNEDDEVELOPMENTPROJECT PCDPLANNEDCOMMUNITYDEVELOPMENT
The following district designations are from the City’s zoning regulations (Sec. 94-31) and are meant to be referenced with the Existing Zoning column in the Existing Character Areas Table.
ZoningDistrictsLocatedWithinDowntown
RP Residential Professional
This district is created to provide an area in which residential, business, professional, educational, and institutional uses can be compatibly mixed while maintaining a healthful living environment for residents of the district.
OI Office-Institutional
This district is created to provide areas in which business, professional, educational, and institutional uses can be compatibly mixed in close proximity to residential land uses. Intensive commercial land uses are restricted or prohibited so as to maintain a healthful living environment for residents of adjacent residential districts.
MO Medical/Office
This district is created to provide a campus like setting that allows for the establishment of local and regional medical centers. The medical/office zoning district also provides the opportunity for allied health services, as well as necessary support businesses, to locate within the MO district.
C-1 Downtown Historic Mixed-Use District
This district is created to enhance and protect the central business district of the city by providing for those commercial uses requiring a central location.
C-2 Community, Commercial
This district is created to provide and protect areas for community shopping and service facilities convenient to residential neighborhoods.
C-3 Highway Commercial
This district is created to provide retail trade and service establishments compatible with surrounding residential and office-institutional areas, and for business activities which primarily cater to the traveling public. The C-3 district requires larger yard areas, greater setbacks, and lower building densities than are permitted in the downtown commercial district.
C-4 High Intensity Commercial
This district is created to provide a location for intense retail commercial land uses, requiring large tracts of land and a location away from residential land uses. The C-4 district allows for retail business with a gross floor area greater than 75,000 square feet; however, centers which have these large retail stores must conform to a higher level of development standards. Properties zoned C-4 must entirely abut a minimum of two, four-lane state highways. The four-lane section of the highway shall be at least five miles in length.
M-1 Light Manufacturing
This district is created to provide a location for those light industrial uses which are able to meet comparatively rigid specifications for nuisance-free operation and which do not create excessive noise, odor, smoke, or dust or possess other objectionable characteristics which might be detrimental to surrounding neighborhoods, or to the other uses permitted in the district.
MS Main Street Architectural Overlay
This district is created to promote the beautification of the city, preserve the historic and distinctive architecture and design qualities of the downtown area of the city, and to recognize and protect the unique character and integrity of the downtown area while also allowing for productive land use. This district may overlay any zoning district.
OS Open Space
This district is created to limit development on certain water bodies, watercourses, floodplains, wetlands, groundwater recharge areas, and lands which serve important environmental functions and provide recreational opportunities and open areas for residents. The district is also created to protect lands of natural beauty, tracts of forests, and areas of archaeological and historical significance; and to prevent commercial, residential, and
The existing LCI study area has many zoning districts which makes it harder to create a unified vision of Downtown Fayetteville. Consolidating zoning districts is essential to implement the UDO plan.
industrial development from encroaching into flood zones, lands with severe grades of 15 degrees and more, naturally dangerous areas, and to protect the undeveloped nature of lands within the district from the adverse impacts of development. No property shall be zoned OS when said property contains man-made water bodies individually in excess of 500 acres in size.
R-30 Medium Density Single Family Residential
This district is created to provide single-family residential areas with minimum lot sizes of 30,000 square feet protected from the depreciating effects of small lot development and high density and from the encroachment of those uses which are incompatible with a desirable residential environment.
DR-15 Two-Family Residential
This district is created to provide areas for high density oneand two-family residential uses with minimum lot sizes of 15,000 square feet for single-family residences and 18,000 square feet for duplexes.
R-70 Low Density Single-Family Residential
This district is created to provide single-family residential areas with a lot size of no less than 87,120 square feet protected from the depreciating effects of small lot development and high density and from the encroachment of those uses which are incompatible to desirable residential environment.
R-40 Low Density Single-Family Residential
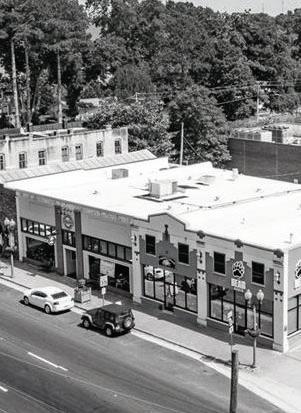
This district is created to provide single-family residential areas with a minimum lot size of 43,560 square feet, protected from the depreciating effects of small lot development and high density and from the encroachment of those uses which are incompatible to desirable residential environment.
R-22 Medium Density Single-Family Residential
This district is created to provide single-family residential areas with minimum lot sizes of 22,500 square feet where a central system for the collection of sewage and distribution of water is provided. Said areas being protected from the depreciating effects of small lot development and high density and from the encroachment of those uses which are incompatible with a desirable residential environment.
R-15 High Density Single-Family Residential
This district is created to provide for site-built housing, or industrialized building which complies with all requirements of the zoning ordinance. With this district, the city seeks to provide for single-family residential areas with higher population densities and lot sizes of 15,000 square feet.
RMF-15 Multifamily Residential
This district is created to provide orderly development of high-density residential areas for one-family, two-family, and multifamily dwellings with minimum lot sizes of 15,000 square feet for single-family detached dwellings and 8,000 square feet for first unit, 5,000 square feet for each additional unit for multifamily development, but in no event shall the number of bedrooms exceed 16 per acre.
R-THC Residential Townhouse-Condominium

This district is created to provide for high density, singlefamily, attached fee simple residential development. The minimum size of a R-THC development is five acres and the density of residential development shall be limited to a maximum of six dwelling units per acre.
MHP Mobile Home Park
The mobile home district provides for the establishment of mobile home parks located on unsubdivided land which has single ownership and control, and for mobile home subdivisions where private lots are available for sale to individual mobile homeowners.
M-2 Heavy Manufacturing.
This district is created to provide and protect areas for those industrial uses which cannot comply with the more restrictive requirements of the M-1 district.
BP Business Park
The business park zoning district is created to provide planned, mixed use development along major thoroughfare or expressway corridors, so that accesses onto these corridors are kept to a minimum in order to protect these corridors as expressways and so that persons entering the city along those corridors will receive a good first impression, and to maintain a quality appearance which will stabilize or increase property values.
The Meridian Apartments located in the Planned Community Development zoning district (PCD) Retail at Stonewall Avenue and Glynn Street located in the Downtown Commercial zoning district (C-1)


The following images depict representative building types of the “Recent Developments” as highlighted in the Existing Character Areas Map. The new developments that are currently under construction or planned may add new building types, architectural styles, and open spaces to Downtown. Furthermore, new developments outside of Downtown, such as Trilith, also will add new building types, architectural styles, and open spaces to the City.


The existing land uses and character of the study area has been extensively documented and described across a number of documents over the last 20 years: The 2003 Downtown LCI Planning study, the 2016 Conceptual Downtown Master Plan, and the 2017 Fayetteville Comprehensive Plan. While some new structures have been built in the study area during this time, the outdated zoning resolution from the 1990s still guides development and building form standards today. Thus, the existing character and land uses have not changed substantially since these studies were conducted.

This hybrid map groups existing land uses according to geographical proximity and existing zoning. This map was created subjectively through a combination of on-theground observations of the study area, known patterns of existing zoning in the study area, and geographic proximity between similar uses and building forms. While not a perfect or scientific means of classification, breaking down the study area into thematic sections will help to identify specific goals and organize priorities in later phases of the study. Below is a description of the rationale behind each of the existing ‘character areas’ as defined by the existing character/existing land use hybrid map:
This area is defined by the historic character of the structures, including the Old Fayette county courthouse. Land uses in this area include County and City government buildings, the library, and churches.
These areas are roughly bounded by Lanier Avenue and Stonewall Avenue on either side of the Historic Core district. Land uses in these areas consist of smaller commercial or office uses, which are often in repurposed single-family home structures.
These areas are located further from the downtown core on the far eastern and western sides of the study area. Land uses in these areas consist of dedicated professional office parks and buildings that were constructed for commercial uses.
This area is located due north of the Historic Core district on either side of N Glynn Street. This area is characterized by the higher-intensity commercial uses such as drive-thrus, shopping centers, car-dealerships and other auto-oriented uses that require significant amounts of impervious coverage. The land use and character of the North Glynn corridor is in stark contrast with the Historic Core it abuts at the south end.
This area is bounded by the edges of the study area on the south and east, by E Lanier Avenue to the north, and S Jeff Davis Drive to the west. Land uses in this area consist of smaller, single-family residential structures or compatible uses, such as schools.
Breaking down the study area into thematic sections helps to identify project goals and organize priorities in later phases of the LCI study.


The downtown gateway character areas are located along N Jeff Davis drive to the north and S Glynn Street to the south of the Historic Core character area. The northern extent of this character area is characterized by smaller businesses in detached or historic structures. The southern extent of this character area is characterized by older commercial uses on an auto-oriented scale. Both of these areas exist as geographical gateways to the Historic Core, and are grouped together under the assumption that the same type of redevelopment and emphasis on streetscaping, traffic calming, and walkability could be of benefit here.

These are broad character areas located in the northwestern corner and northern extent of the study area. These areas are currently comprised of primarily residential uses with residential zoning districts, however, there are other uses mixed sporadically throughout. This district allow for a more specific, distinct planning vision to guide future development.
This character area is less categorically defined than others and is better defined in geographical terms. This character consists of the southeastern extent of the study area, roughly bounded by Lee Street on the west and Johnson Avenue to the north. Existing, larger-scale structures also help to define this character area, including the senior center, the Court building, and the sheriff’s department. south and east, by E Lanier Avenue to the north, and S Jeff Davis Drive to the west. Land uses in this area consist of smaller, single-family residential structures or compatible uses, such as schools.
Identification of sites where new development can occur indicates opportunities for immediate application of the LCI recommendations.


Demand in 2021-25: 100 units/year
Estimated Pricing: $400,000 - $600,000
Estimated Density: 4-6 units/acre
Parking: 2-car front/rear entry garages
Notes: Strong land value, good transitional use, great for all household types. Likely to run into land limitations.
Townhomes

Demand in 2021-25: 15 units/year
Estimated Pricing: $300,000 - $375,000 $425,000 - $475,000
Estimated Density: 8-14 units/acre
Parking: 2-car front/rear entry garages
Notes: Mix of conventional and luxury townhomes. High land value, limited depth. Good transitional use, great for ENs & starter families.


Demand in 2021-25: 250-300 units above pipeline.
Estimated Pricing: $1.45/SF | THs $2.15/SF | 55+ $1.75/SF Conv.
Estimated Density: 25-45 units/acre
Parking: 1.5/unit OR 1/bed
Notes: Opportunity to leverage existing downtown environment & provide for “missing middle” housing options & grow workforce housing.
Demand in 2021-25: + / - 25,000 SF
Estimated Pricing: $20-$25/SF Full Service
Estimated Density: 10,000 SF/acre
Parking: 4/1,000 SF

Notes: Population servicing office uses including medical and smaller private firms.
Demand in 2021-25: 90,000 - 140,000 SF
Estimated Pricing: $20-25/SF NNN
Estimated Density: 8,000 SF/acre

Parking: 5/1,000 SF
Notes: Potential for small-format grocer / hardware store, majority is F&B & service-oriented w/ pharmacy / drug store.
All development can remove unwanted uses, increase city tax digest/improve services, & increase property values
Greatest retail support
ProsLow intensity use in/near neighborhoods
Opportunities for new residents / existing residents to downsize
Low intensity use in urban environment
Cons
Does not provide significant retail support
All uses will increase property values (higher taxes) and traffic
More eyes on street, increased safety
Strongest attainability
More transient population
Increased density
More residents frequenting establishments
More eyes on street
Increased Density
Often geared towards wealthy due costs
More services / amenities in area
Local jobs
Might get undesirable retail
Jobs are not high wages
More jobs
Living wages
Workers frequent and support retail
Creates dead zones at night


• The Atlanta metro lost over 100,000 jobs due to the pandemic


• Much of these in retail, hospitality, and population servicing industries
• Most jobs projected to recover starting in late 2021 and back to pre-pandemic levels by year end 2022
• The for-sale residential market has remained strong particularly at higher sales prices result of historic low supply delivered since the Great Recession
• The rental market metro-wide has remained strong with highest level of absorption in its history, however, rental rate growth has slowed and absorption has been strongest in the suburbs as well as value-oriented properties
• Mixed-use environments both urban and suburban continue to be in high demand, with the lack of these environments in the suburbs pushing demand even further for suburban town centers
• Rising home prices and a lack of supply coupled with changing tenure preferences has created new rental product types including professionally managed rental townhomes and rental single-family developments
• The pandemic has exacerbated retail trends of the shift away from big box stores to more online shopping and less need for brick & mortar locations.
• While many stores still desire a brick & mortar location to engage customers, these spaces need to be “right-sized” as there is less inventory need and a desire to keep absolute rents low

• A result is an increasing mix of food & beverage as “anchors” to any retail development along with support from population servicing retail
• Experiential / destination retail has become extremely important in creating successful retail environments
• Similar to retail, the pandemic has exacerbated office trends that were already in place which were a shift to more remote / flexible work environments
• While this might lead to less office space needed per employee this could be offset by a shift away from dense office settings
• While more remote work scenarios could reduce demand for office space, this trend is very sector
• Hospitality has been hit hardest by the pandemic and will take years to recover with many companies currently limiting business travel and large gatherings.

• The analysis indicates significant demand for single family and attached townhouses. The identification, prioritization, and policy incentives that encourage the desired scale and character of development should be evaluated to align with the overall vision of the Downtown Fayetteville LCI Study.
• The City of Fayetteville has completed many studies identifying the community’s desire for an increase in parks and open space.
• Open space aesthetics, identity, gateways, and streetscapes are a priority given previous studies. Next steps are to identify specific opportunities for existing open space improvements and locations for new proposed spaces.


• Past analyses emphasize the need for infrastructure to optimize walking and biking. This LCI study should reinforce the Master Path Plan while considering a bold vision of a highly networked open space that is independent of the road system.
• Community feedback for parking is pivotal for a deeper study and consideration.
• Demand for office space is limited as only 19% of residents work in Fayetteville in comparison to 35% of residents that commute over 25 miles to work. Future studies should identify work and lifestyle changes as a result of the COVID-19 pandemic.


• Fayetteville leadership should determine whether to prioritize attracting major employers or improving quality of life and local amenities to benefit local residents and attract others.
• The LCI study should focus on engaging marginalized and underserved residents to be benefited by the plan without displacement.


The project process was divided into four phases as outlined below. Starting with outreach and communications activities to build study awareness and excitement within the community, laying the groundwork for meaningful input and community engagement during the next phases, and initiating a strong following by community members.

Investigate

The study process began with a soft kick-off of the project via the City’s multiple communications channels. This work was carried out through the release of a study flyer in late December 2020 that communicated the project goals and process and informed the community of input opportunities that would debut in early 2021.


Explore
In this phase, a virtual community charrette was conducted to craft a collective vision for the LCI study area.

Recommend
The teams recommendations were presented to the community via a hybrid setting.
Document
This phase was to document and finalize the recommendations including the community engagement process and input.

The first few months of the LCI study process included a flurry of outreach and communications activities to help position the project for success. These activities focused on building study awareness and excitement within the community, laying the groundwork for meaningful input and community engagement during the next phase, and initiating a strong following by community members.
The study process began with a soft kick-off of the project via the City’s multiple communications channels. This work was carried out through the release of a study flyer in late December 2020 that communicated the project goals and process and informed the community of input opportunities that would debut in early 2021.
Early January 2021 saw the launch of the study website: www.fayettevillelcistudy.com
This site will serve as the information hub for study information as well as a centralized location for all outreach activities. The City’s Planning and Zoning page links directly to the site: https://fayetteville-ga.gov/city-departments/ community-development/planning-and-zoning/livablecenters-initiative-lci/, furthering ease of access to project information.
Early January 2021 also marked the start of a fun, webbased photo scavenger hunt. Community members can take photos from anywhere in the Downtown study area, capturing characteristics they feel best fits with their response to the hashtags of:
#MoreOfThisDowntown
– a photo to display something they like to see more of in Downtown
#LessOfThisDowntown – a photo to display something they would like to see less of in Downtown
#MyFayettevilleFavorite – a photo that shows their favorite place/thing in Fayetteville
Participants submit responses via email or social media and are entered for a raffle prize from local businesses. Photos and raffle winners will be featured at the February Design Charette, creating a bridge between the project kick-off and the February community meetings.


The Community Design Charrette – a community work session where community members are asked to roll up their sleeves and help plan for Downtown’s next phase – was scheduled for February 11th and 12th. An online registration tool was established on the project website –giving community members the option to participate in one or both 1.5-hour sessions (to be held on Thursday evening and Friday mid-day).

The City established, confirmed, and welcomed a 17-member “Core Team” to serve as champions of the study process and help guide the plan’s outcomes. The project team delivered a formal welcome via email the first week of February, encouraging members to participate in the charrette and scavenger hunt while helping get the word out about the process.
During the Investigate stage, the study, its goals, and current/upcoming activities were promoted in multiple ways, including via the City’s Facebook and Instagram accounts, Next Door, weekly eblasts, and monthly City News publication. The team also established a project updates email sign-up on the study website and sent out its first update to the group.
Questions
What are the community acceptable levels of density?
How do you interpret density –by height or other?
How does the community feel about rental product versus ownership product?
Does this vary by product type? (Rental townhomes / cottages vs conventional apartments) x
Are there demographics and/or household types / housing types missing in the community?
Young professionals? Opportunity for households to downsize? x
Would the community support a shared centralized parking deck?
A centralized shared parking deck would unlock the development potential of many sites given the costs of parking and current rent levels of many uses
What types of retail and/or services do you have to leave the community for? And where do you go for this retail and / or services? x
What is Fayetteville missing?
In 5 years from now what other Atlanta regional community do you envision Fayetteville looking like?
What character areas should be preserved? x
How should the character areas be treated where there has been recent new development or where there is development planned? x
The 2018 Future Land Use Map shows much of the Downtown study area as “Walkable MixedUse.” Is this desirable and feasible given the Existing Character Map and Table? Should the Downtown study area be more variable in character? x
What parts of the downtown area should be preserved into the future? x
What parts of the downtown area do you want to see change or improve in the future? x
What is your opinion of the new residential development that’s taken place in downtown Fayetteville? (i.e., The Village, The Meridian, scattered new housing subdivisions). Could you see yourself moving there soon or in the future? If you already live in downtown, what made you choose to live there? x
What are some of your favorite downtowns in Georgia or in other states and why? x
What are the positive and negative characteristics of the existing parks and open spaces? What is desirable, what is undesirable? x
What activities do you want to take place within future and existing parks and open space (recreation, community gathering, event planning, physical health, economic development, nature appreciation, etc.)? x
How should the character areas be treated where there has been recent new development or where there is development planned? x
What types of amenities and nodes are desired for greenspace connections (pocket parks, bike paths, walking trails, multi-use pathways, seating areas, water features, plazas, community gathering spaces with commercial partnership, dog parks, etc.)? x


Overview
A virtual community charrette was conducted on February 11th and 12th, 2021 to craft a collective vision for the downtown study area of Fayetteville by taking the lessons learned from history and past efforts and reimagine a future that engages all the stakeholders and is healthy for the environment and the community. Participants shared input on areas to preserve and change as well as perspectives on future land uses, Downtown access and mobility, and open space. Both meetings were conducted virtually via zoom.
The first day was to re-engage the community..
Focus
The second day was built on discussion and input provided and collected from the first day.


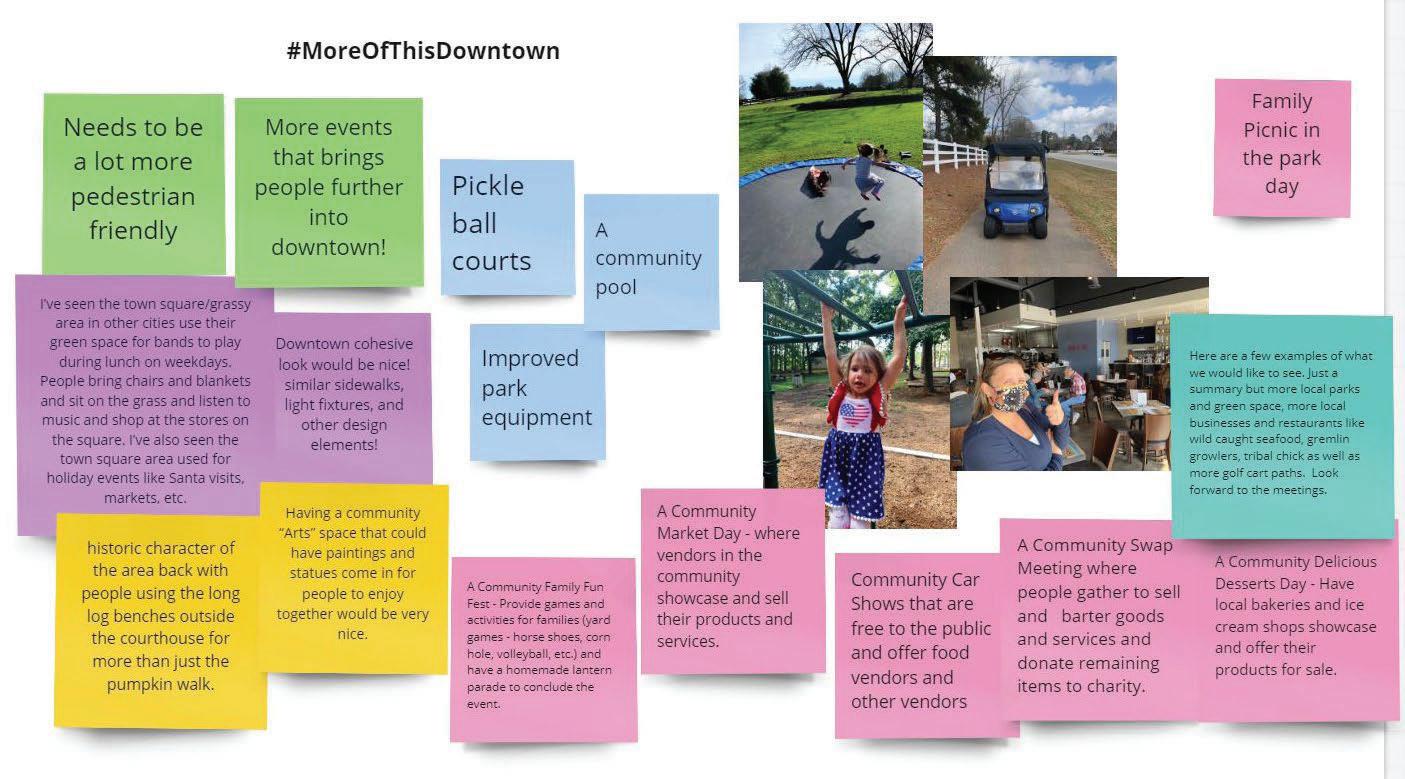


• Existing parks, open and green spaces such as courthouse square and the amphitheater.
• Current community events and activities.

• Heritage Park and May Hart parks need updates and improvements.
• Current park network lacks connectivity.

• More parks and open spaces with programming and memorial spaces (sports courts, equipment, roller skating, arts, veteran and African American memorial space).
• More community events such as fests, community swaps, car shows, movie nights.
• Dedicated multi-use paths connecting to activity nodes and green network to enhance connectivity and pedestrian and bike safety.
• Senior services have good programs, but could be built up and improved.
• Less auto-centric; more pedestrian and bike friendly by improving safety and infrastructure.
• Less traffic congestion and high speeds in downtown.
• Parking in downtown is limited, need clear signing to make it less confusing.
• More parking in downtown.
• Relieving traffic through road diets.
• Existing local businesses and restaurants and shops.


CHANGE
• Less chains and big businesses.
• Less car dealerships.


• More local small businesses, shopping and restaurants in downtown.
• Mixed income housing for different demographics (affordable, middle income, young and older families).
• Mixed-use developments and diversity in uses and amenities (commercial, office + housing).
• New uses such as meeting space, art gallery, outdoor dining in downtown.
• Attract residents and businesses to downtown.
• Preserve historic character and old buildings.

• Old houses are deteriorated, lack of maintenance,

• Downtown shops are vacant and need activity.
• Infill developments to provide density and walkable to downtown.
• Re-purpose unused buildings re-purpose and improve existing buildings.
• New developments to be compatible with historic character
What is your vision for Fayetteville?
“Preserve neighborhood and small town feel.”
“No jobs for young professionals; current commute time is very long.”


“Fayetteville as an inviting, affordable and authentic town with a sense of pride.”
“Fayetteville should be the heart not an artery.”
“Providing growth opportunities.”
“Pinterest Worthy.”
“Need sustainability element to be incorporated into plan!”
“Infill Development.” “Repurpose unused property and buildings.”

Input boxes were designed and decorated by a group of Fayetteville local artists. The boxes were used to receive feedback from the community and were strategically places in accessible locations in the city including the Fayette County Library, City Hall and Church Street Park.

During the community charrette, participants were asked for suggestions regarding naming the LCI initiative. The top choice was Fayetteville Forward. The word ‘moving’ was later added by the team to suggest active motion.
A Community Town Hall meeting was attended by elected officials and several local residents in June 2021. Presenters reported on months of research and community feedback and gave recommendations to the City regarding many quality-of-life infrastructure improvements Participants engaged in-person and online.


Part 1 of the meeting focused on the Presentation of Project Overview and Progress including Connections and Nodes, Mobility , Codifying the place and the impact of feedback and preferences. Part 2 engaged the audience online through break-out rooms and in-person through large printed boards to garner feedback and preferences.
This section highlights the main takeaways from the Explore and Recommend Community Meeting.


General push back reggarding tall and big buildings. Modern aesthetic desired, howwever, not too eclectic as in imaage G.


Note: Images highlighted in green indicate most desired and images indicated in red were the least desired images.

Small scale office buildings with 1-3 stories serving small usinesses are mostly prefered, b milar to image E). Unlike images (sim s (B),(C) and (G), contemporary ades with less glass and modern cafa fac brick patterns are preferred (Similar to images A and D). General support for adaptive reuse.
Lower scale and aesthetic similar to image (B) are most preferreed especially with restaurants and active rooooftop spaces. nts are not Large monolithic developmmeen ). Glass and desired (as in images A and E E) erials are contemporary styles / mate ge D). not preferred (as in immag


de sidewalks, overhangs Wid d outdoor dining spaces and desired. The group liked are d re colorful facades, such mor in image (F). Collonade as tructures are generally st not preferred.


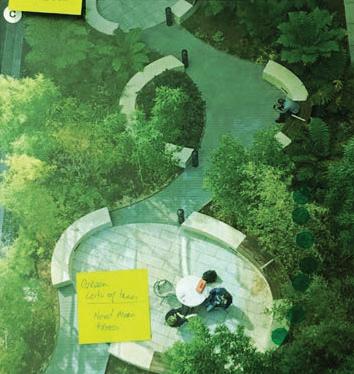


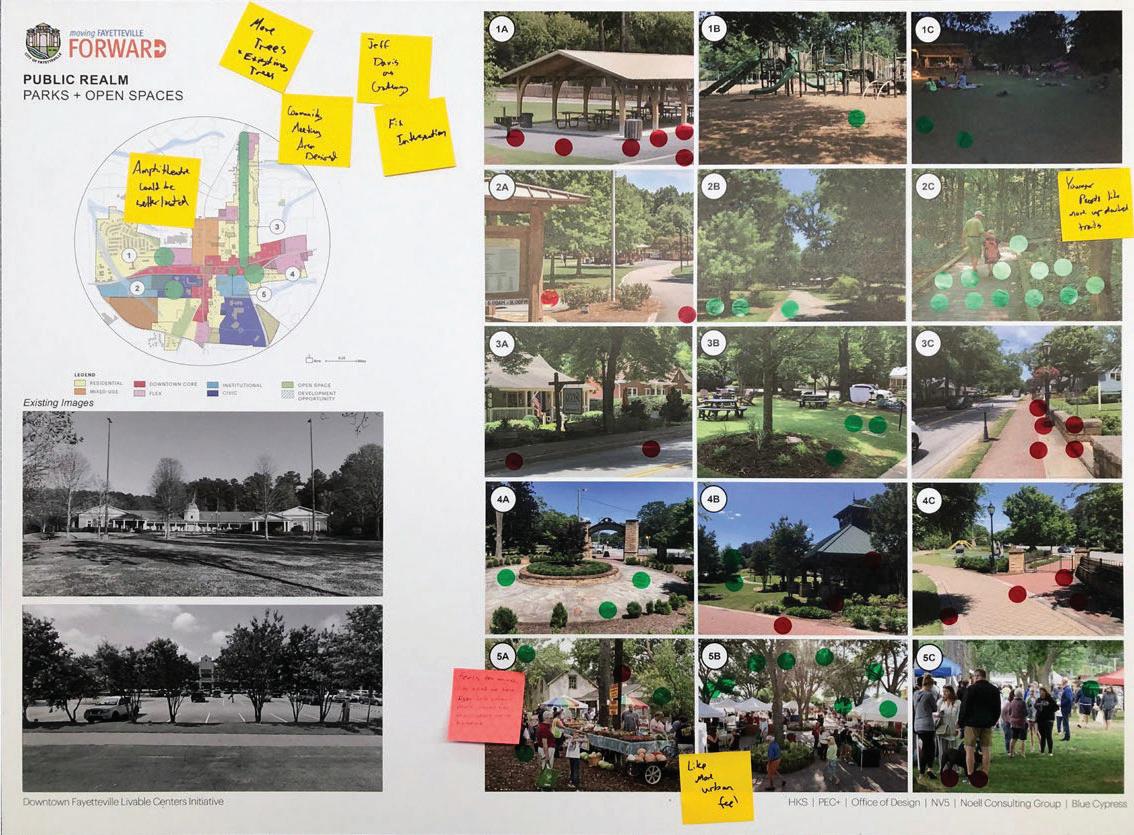
There is a general apprehension towards large paved areas. Sidewwalks and buffers with more e trees and landscape were preferred


GeneralComments


“Active rooftop spaaces and usabble parklets will be wonde


Note: Images highlighted in green indicate most desired and images indicated in red were the least desired images.
st participants indicated a Mos ire to have a more active des n feel as well as separating urban cyclists and pedestrians with cycl wide planting buffers

YES
Quaint architectural style, diverse flexible spaces, contextsensitive wayfinding, Brick facades.

“Build upon current small town feel, yet modernize!” modernize!


NO
Too much concrete, gardenstyle apartment buildings, large mpervious surfaces, im overpowering buildings.
idea of “Love the i space for planning a s ch as food activities suc open air trucks or o ts.”marke

“More uralnatu ngs.”settin
“Future materiality should complement and bllend with current charactter and heritage of Fayetteville.”


Through deep community engagement, this project was named: moving Fayetteville Forward In doing a vested exploration of what the opportunities are for Downtown Fayetteville, it was determined that the movement that was desired needed to be multidirectional. To demonstrate this aspiration , the team tapped into the visual of a compass to create the guiding principles that will illustrate the priorities of the study and identify the performance metrics that will help maintain the accountability of the process for the Livable Centers Initiative.
Improve walk scores
Integrate sidewalks with public realm
Incorporate Multi-use trails and improve connectivity with Fayetteville and Fayette County
Focus on Downtown core accessibility to create unified streetscape
The guiding principles for a project are tenets that will be a tool for decision making and accountability. The cardinal directions of North, South, East and West of a compass have been adapted to indicate the priorities of the study:

Nature, Social, Economy and Walkability
This aligns with the goals that the Atlanta Regional Commission has while investing in such initiatives for the cities. The guiding principles inform an actionable framework on which the recommendations are built. Character themes portray the individual identity of different zones in the area where key nodes are inserted for the community to meaningfully gather. The places and spaces are intentionally connected through a network of links that offer the legibility and access indicated in the over-arching vision.
Maintain the authenticity of Fayetteville
Preserve natural assets
Leverage Parks, landscaping, trees
Elevate access for improved mental health and emotional well-being
Emphasize historic character
Unify signage standards referencing historic character
Diversify economy
Imagine new developments creatively to revitalize the economy
Strengthen economic impact by mixing uses Plan feasible developments aligned with market study
Promote small businesses and art+culture organizations
Emphasize spaces for community interaction
Enhance safety
Empower Community - led action
Celebrate Social, racial and intergenerational diversity
Promote shared, flexible spaces
The Vision for moving Fayetteville Forward is to reimagine the possibilities in Downtown through catalytic equitable placemaking, enhanced legibility of the built environment, and creative guidelines for healthy, sustainable developments that will empower its diverse communities.


Preserving the character set by the Villages at LaFayette, this area echoes the homely features of walkable urbanism with connections to nature
A Threshold is the entrance or start of something and this area serves as a portal to the new downtown district with its mix of uses that are just right for communities to thrive
The Core pays homage to the history of Fayetteville with the preservation of many notable places of interest. It is also home to the new government buildings that together with the local businesses shape the main street.
The Edge mirrors the historical aspect of the root by being a play of the phrase - at the Leading edge. This western portion of the study area is closer in proximity to both natural assets and new developments like Trilith. It lends itself to be characterized by innovation as it becomes the nexxus where creative mixed use developments can be featured.
The Root speaks to the rich foundation set in this area by the Sugar Hill community, the religious institutions and the civic organizations. It indicates growth that speaks to the dichotomy of the present and the future that is deeply rooted in the heritage of Fayetteville’s 200 years of existence.
Areas distinguished by common characteristics based on physical environment analysis and community perception


Strategic focus points for orientation, pause, celebration and engagement. New nodes provide placemaking opportunities unique to each character area.
Routes along which people move throughout the city that offer legibility and access.


As stated earlier in this document, Fayetteville needs more programmed open spaces. In addition to preserving the existing parks and open spaces, there are four proposed new parks as shown on the map on the opposite page.


The analysis below shows how the proposed parks close the walkshed gaps with the LCI study area. This ensures all of the residents of the LCI study area are within at least 15 minute walk to a park or programmed open space. The next spread details the proposed parks and public spaces as well as streetscape enhancements.
Walkshed Analysis of Existing Parks and Open Spaces


Walkshed Analysis of Proposed Parks and Open Spaces within the LCI boundary.

Four new parks are proposed to ensure all residents of the study area are within a 15-minute walk to a park.
Continue Preservation of forest land next to the Southern Conservation Trust. The vacant parcel west of the Southern Conservation Trust could be developed in a way where conditions exist requiring the developer to connect trail systems in the development by the stream to the Southern Conservation Trust as well as the planned community green space on the Fisher Avenue extension.
• Outdoor education opportunities
• Natural walking trails that take advantage of the stream.

• Health and exercise
• Disc golf
• Playgrounds for children
The vacant lot adjacent to the existing amphitheater provides a great opportunity to create linkage between the amphitheater and the residential area leading to downtown. This could be done with a combination of park space that is more of a natural feel than a developed feel with the following programming:
• Walking trails
• Community event space
• Playground for children
• Dog park
• Mixed use of small scale commercial (dining and or shopping) on the edges facing the street.
• A place for people to enjoy the city before or after going to an event at the amphitheater.
• Pedestrian connection through the residential area linking this vacant area to the downtown.
The vacant spaces between E Lanier Avenue and E Stonewall Ave provide a great opportunity for a mixed-use development that provides an open park space linkage between the two streets.
• Open green spaces provide opportunities for community events close to the downtown area.

• Adding mixed use options makes the place more easily inhabitable which creates public interest.
• Potential to be used as a public park when not being used for community events.
The vacant space along E Lanier Avenue and S Jeff Davis Drive, and also along Booker Avenue, provide an excellent opportunity to provide transition space between the residential community in this area to the downtown commercial area.
This could be accomplished in a variety of ways, but adding public park space in this area that provides a variety of functions would work well.
• Playgrounds for children

• Dog Park
• Open spaces for community events
• Physical and mental health
• This would also potentially serve as a node of connection between the enhanced pedestrian gateway along N Jeff Davis Drive and the residential community.

• Small scale commercial development for the use of restaurants or shopping could also be incorporated into the park space.
• Abernathy Greenway along Abernathy Road in Roswell is a good example of a liner park alongside of a vehicular roadway.

PocketPark
• Public space node
• Gateway to north 85 corridor
• Possible location for a community garden, playground for children or other neighborhood initiatives.
The historic homes purposed for commercial use along N Jeff Davis Drive provide a good opportunity to begin a gateway into the downtown area.
Pedestrian activity could be enhanced with more of a separation between the sidewalk and the road with enhanced low maintenance landscaping within the landscape strip.

• Seating nodes within the enhanced pedestrian pathways should be designed appropriately to connect to the local businesses. Perhaps there is an incentive for business owners to provide enhanced seating nodes along the sidewalk that lead into their place of business and also provide a nice feature for the users of the sidewalk. Pocket parks with private partnership
• There was strong desire for more local outdoor dining options. The large front yards of these old historic homes facing N Jeff Davis provide a great opportunity to meet this desire.
• Historic Roswell, GA on Canton Street is good example of this.


More tourists and locals are expected to visit and live in the city’s downtown area with this influx in population, creating a need for better and safer downtown amenities to support its residents and visitors. There is a need for public spaces where people can interact and define the community’s aesthetic quality, economic activity, health, and sustainability. New design strategies should therefore be implemented to develop a strong framework for the infrastructure amenities needed to get people out of their cars to socialize, interact with their environment, and discover other mobility options.
A Mobility Framework, detailed below, was formulated by NV5 to guide the future development and growth of Downtown Fayetteville. The overarching goal of this framework is to implement the desired public infrastructure investments within the city’s existing specifications for streets and roadways. These investments are needed to support more private developments in the downtown area and ensure all users of transportation networks leading to or from these developments can travel safely, reliably, and independently between them in adequate and accessible ways. The proposed framework should be used to rethink how existing street networks and public rights-of-way can be re-purposed or better utilized to move Fayetteville Forward into a future and prosperous community.


1. Recognizes the physical constraints, context, and character of the surrounding built and natural environment. It recommends policies and projects that strengthen the pedestrian, bicycle, and vehicle transportation network within the LCI study area.


2. Defines ideal standards for Complete Streets in local areas. “Complete Streets” refer to the concept that roadways should be designed with all users in mind, not just motorists. These standards apply context-sensitive design approaches to roadway redesign that enable safe, convenient, and comfortable travel or access for users of all ages and abilities regardless of their mode of transportation. This effort will support walking and bicycling within Fayetteville.
3. Advocates for (re)developing Fayetteville’s core transportation network to work for the city’s residents, businesses, and visitors. This requires flexibility in its design application and implementation so that mobility priorities and guidance for transportation investments are identified to improve resident’s quality of life and access to goods or services.
These three Mobility Framework guidelines will assist city staff with identifying a street design hierarchy so that mobility investments and place-making strategies are prioritized and applied within the LCI study area. Doing so will create unique pedestrian and storefront opportunities in targeted redevelopment locations as well as present several project recommendations that can enhance local mobility. This includes improved pedestrian and bicycle capacities through downtown, connecting residential and commercial areas with parks and open space, and creating stronger linkages to neighboring communities. Applying these approaches to Downtown Fayetteville will position the city for any future public transit investments and advance the city’s livability goals.
The recommendations within the Mobility Framework are intended to provide a broad vision for streets within downtown Fayetteville and the LCI study area. It is intended to supplement and provide a baseline for decision-making on a case-by-case basis using the professional judgment of the designer. The recommendations provided herein offer directions for incorporating Complete Street principles and practices, especially as the city looks to finalize its Unified Development Ordinance (UDO) and update its Public Works Design Manual, other standards, and practices. Although these street typologies are focused on the LCI study area, they also may have wider application.
The built up character of the Fayetteville’s downtown area present unique challenges for implementing changes to its streets. However, new development on vacant parcels and redevelopment of existing land offer opportunities few cities will experience to remake their street system. It should be noted that implementation of the Mobility Framework’s recommendations is not one size fits all, and the recommendations provide a range of feasible, cost-effective approaches to achieving mobility facility design objectives. The street typologies presented are intended to illustrate how different travel modes can be balanced within an existing right-of-way while minimizing modification of the curb and drainage system, thereby minimizing cost of implementation. At the same time the street typologies offer preferred dimensions and treatments that may only be applicable when a roadway is being rebuilt. In practice, a specific design may more strongly emphasize some street design objectives while providing baseline treatments for others.
Project decisions will continue to be made through the combination of expert and community input, City Council direction, available resources, site conditions and other factors. Opportunities to reduce environmental impacts should be routinely considered, along with other project objectives. Broadly speaking, the city will seek to cost-effectively maximize the benefits to the public, to distribute street improvements equitably and to serve all members of the community.
Trailhead’s are an important introduction to a facility. Their design can either support an overall theme for a trail or convey a story for a trail segment. Trailheads often include amenities such as trail maps, benches, trash receptacles, portalets bike repair stations, etc. They also can be designed so that they provide parking for hikers who might arrive by car.
The Inner and Outer Loops are an assemblage of existing sidewalks and trails that enable travelers to walk, run, or bike around downtown Fayetteville’s inner core, connecting with the city’s cultural and historic assets. The loop system aims to connect the different sections of the downtown mixed use district through a cohesive pedestrian and cyclist paths that connect to the existing and proposed open spaces. As both loops path through the various character theme areas (see Section 04: Vision) the trails would have a similar character in the respective areas as detailed below.

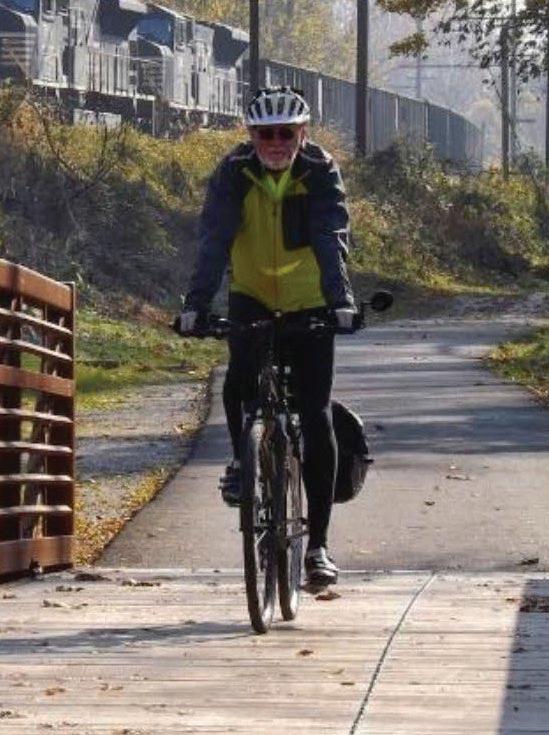

This section would have opportunities to highlight local art, artists and community members and groups including veterans and civil rights activists.


This section connects Fayette Elementary School and the Fayette County High school to the Southern Conservation Trust passing along the Pye Lake Watershed. This section of the outer loop would have synergy with the schools, including students using it for commute, opportunities for student work exhibitions. Also, there is an opportunity to connect with Southern Conservation Trust educational mission by providing educational markers and signage of natural landscapes such as flood plains and wetlands, as well as habitats and ecosystems.
This inner loop is envisioned to be identified by a unique wayfinding signage system, emphasized by markers and signage of historic properties, landmark and events.


Adopt a Complete Street Policy
“Complete streets” refers to the concept that roadways should be designed with all users in mind, not just motorists. The policy should include language that addresses all users and travel modes, applies to all types of transportation projects, recognizes the importance of a complete street network, directs designers to use the latest design guidance, identifies specific implementation steps, and creates measurable performance standards to evaluate whether the policy is meeting its goals.
Establish a Street Typology
The traditional functional classifications of streets provide a hierarchy that correlates traffic flow to land access. Traffic volume, speed, and level of service provide the basis for roadway design criteria. However, this classification system falls short in considering non-vehicular users of the public right-of-way (pedestrians, bicyclists, and transit) and is void of context for how the street impacts adjacent land uses and vice versa.
A Street Typology can augment the traditional roadway functional classification method by providing a user-oriented classification system that goes beyond considering the street system as a mere conveyor of automobiles. The typology classification system focuses on contextual approaches to roadways that consider nearby land uses and multiple user groups that create a sense of place rather than solely focusing on traffic volumes and speeds as functional roadway design parameters.
UDO Streets
The City of Fayetteville, through their Unified Development Ordinance (UDO), prepared a simplified three (3) tiered street hierarchy, classifying all streets, roads, and highways as:


» Major Streets. Major Streets are intended to provide swift and safe movement of traffic through the community.
» Collector Streets. Collector Streets channel local traffic into the major/minor collector and arterial system. Collectors provide circulation within residential subdivisions or commercial and industrial areas.
» Minor Streets. Minor Streets are used for local circulation in residential areas providing access to abutting property.
1Unified Development Ordinance (Draft), City of Fayetteville, GA. Chapter 300 - Land Development. Article 1. Street, Sidewalks, and Public Paces. Section 301.1-301.4. pp. 103-112. City of Fayetteville, GA, January 2021.
Place types represent the context of the surrounding area and are simplified categories that combine land use, development patterns, and density. Identifying the most appropriate place type—considering the existing and future context of an area—is the first step in selecting an appropriate street type. Individual projects may pass through several place types, which may require transitioning between multiple street types along the corridor.
The Fayetteville LCI area includes a variety of development patterns and land uses. A highly-simplified set of place types has been assembled in an attempt to capture and summarize development characteristics and describe their mobility attributes. The proposed zoning districts and place types are presented in Table 2 below along with descriptions of the idealized mobility characteristics.
Historic Core
Mixed-Use Core
Activity CenterAreas with high amounts of circulation across and along streets, with a high proportion of people accessing buildings by walking or on bike
Mixed-Use
Transitional Residential
Mixed Use Neighborhood
Neighborhood Residential
Areas or corridors with a mix of uses, with people accessing buildings using multiple modes of transportation
The conventional approach to street design is based primarily on a roadway’s functional classification (arterial, collector, local, etc.). Functional classification is a surrogate for motor vehicle traffic volume and speed. Higher classifications (e.g., arterial streets) tend to carry higher volumes of traffic at higher speeds. Lower classifications (e.g., local streets) tend to carry lower volumes of traffic at lower speeds. However, there are several limitations to this approach, primarily:
The current approach lacks a consistent method for making street designs respond appropriately to the surrounding context. Take for example SR 54/Lanier Avenue West and North Jeff Davis Drive. Both roadways are classified as major streets, but exist in vastly different development contexts and should thus be designed differently. Under the current approach, it can be challenging to design major streets that support walkable, vibrant places.
Residential Neighborhood Areas with single and multi-family homes, oftentimes with adjacent schools and parks
Gateway Commercial Boulevard Commercial Commercial Center/Corridor
Areas oriented toward automobile traffic, with parking lots placed between streets and buildings
The current approach assumes a constant relationship between the amount of car traffic and the function of the street. However, two streets can carry the same amount of traffic but serve different functions. Streets through activity centers located near Fayetteville’s downtown core might emphasize access and lower speeds, while streets along the LCI study area’s periphery might emphasize throughput (the quick and efficient movement of people) at higher speeds.
As Fayetteville continues to grow, it is important that streets are designed to be compatible with new development types (ex. walkable mixed use). The current street design approach is less conducive to designing streets that respond to and support such development patterns.
Note: The Mobility Framework’s street typologies do not replace the traditional functional classification system which should still be used for federal funding and design purposes or where the city code requires it be utilized. All design parameters are subject to engineering review to ensure the safety and functionality of each system.
The recommended approach to street design will first take into consideration (1) the existing hierarchical street classification; (2) the context of the surrounding area (in the case of a greenfield or redevelopment project – the expected context of the surrounding area), and; (3) the intended function of the street. Ideally, this approach will result in streets designed to serve all anticipated users. The street type selection approach is comprised of three steps.
Place types represent the context of the surrounding area and are simplified categories that reflect land use, development patterns, and density. The first step in selecting the appropriate street type is identifying the most appropriate place type. Planners and/or designers should take into consideration both the existing and future context of an area. Keep in mind that individual street projects may pass through multiple place types. This means that it may be necessary to transition between multiple street types along the corridor.
The City of Fayetteville anticipates adopting new character-based zoning districts within the LCI study area as a part of this work effort. The zoning districts encompass several place types and potential future land uses. Note, however, that place types relate to, but do not replace, the city’s zoning districts.
The transportation function of a street is determined first by identifying place type and secondly by conventional factors (e.g., traffic demand). Transportation function exists on a spectrum with one end emphasizing throughput and the other end emphasizing local access and small-scale, localized circulation. Throughput describes the efficient movement of people at greater distances, often at higher speeds. Safely maximizing throughput typically requires physically separating modes and limiting the number of intersections and driveways along a corridor. Access describes peoples’ ability to reach destinations and individual properties along a street by any mode. Access-oriented streets are typically lower-speed with higher levels of foot traffic.
Transportation function may be determined by answering the following questions:
» Are there several destinations along the street?
» How much foot or bike traffic (currently or potentially) is present?
» Is the street an important cross-town travel link?
Step 3 - Street Types
Street types, as applied herein, represent common combinations of place types and transportation functions. The street types presented within the Mobility Framework provide, offering a shortcut to address common street design situations with flexibility so that the LCI’s objectives might be implemented as envisioned. The street cross-section layouts included herein serve as starting points for the design of individual streets and include a range of parameters and set of priorities for the inclusion of various street elements (e.g., bike lanes versus on-street parking).
1 Street Types Selection and Design Parameters. Complete Street Ames. June 15, 2018.
The relationship between these place type, street function, and street type is shown in Figure 1. Street types are selected by first identifying the appropriate place type for the context, choosing the appropriate transportation function, and then selecting the resulting street type produced by the matrix. In some situations, multiple street type options are appropriate. Selecting between the multiple options requires considering the fine-grained context and constraints within the corridor.
Major Type 3: Mixed-Use
Activity Center N/A
Place Type
Mixed-Use N/A
Residential
Major Type 2: Major Boulevard
Commercial Street Type 1: Connector
Commercial Center/ Corridor
Major Type 1: Thoroughfare
Major Type 2: Major Commercial
Commercial Street Type 2: Main Street
Major Type 2: Major Boulevard
Major Type 3: Mixed-Use
Commercial Street Type 2: Main Street
Residential Street
Residential Boulevard
Major Type 3: Mixed-Use
Commercial Street Type 1: Connector
Commercial Street Type 3: Commercial Alley
Shared Public Way
Commercial Street Type 3: Commercial Alley
Residential Boulevard
Shared Public Way
Types
Residential Alley
Commercial Street Type 2: Main Street
Commercial Street Type 3: Commercial Alley Street
Case-by-case design flexibility is built into the Mobility Framework and can be applied to any of the included street typologies by shifting street elements within the UDO right-of-way standards. The design parameters established by the UDO for each street type include minimum values which in most cases can accommodate the desired street design. In cases where values outside of the parameters are necessary or desirable to accommodate elements such as bicycles, paths, and on-street parking, the design engineer should consider and balance the needs of all modes, emphasizing safety above all else, and especially pedestrians and bicyclists.
As mentioned in Step 1, land use contexts (and therefore place types) can change across the length of a corridor, and multiple street types may be applied to different segments of a single roadway. For example, a corridor may be primarily categorized as an Arterial Street, however a commercial node along it may result in a segment being classified as a Mixed Use Street. The street design elements will change accordingly, reflecting the designated street type and its economic and mobility objectives.


1.2A.1Description
Major Commercial Streets are are characterized by their size, high traffic volumes, fast-moving traffic, emphasis on through-traffic, and adjacency to dense concentrations of commercial land uses.


Emphasis
1.2A.4ZoningDMUSub-Districts
1.2A.6Considerations
Access management (driveway consolidation)
Bicycle mobility and safety
Pedestrian comfort and safety

Future transit service access / mobility
1.2A.7LocalExamples


1.2B.1Description
Major Boulevard is are characterized by its size, high traffic volumes, fastmoving traffic, adjacency to dense concentrations of commercial land uses, and a center median. Major Boulevards emphasis both access to property and vehicular mobility.


1.2B.2PriorityDesignUser
Vehicles
Non-motorized Travelers
1.2B.3PlaceType

1.2B.7LocalExamples
1.2B.4ZoningDMUSub-Districts
Core (DMU-MUC)
Mixed-Use Neighborhood (DMU-MUN)
Transitional Residential (DMU-TR)
1.2B.6Considerations
Traffic volume and speeds
Access management (driveway consolidation)
Bicycle mobility and safety
Pedestrian comfort and safety
Future transit service access / mobility
Mixed-Use Streets are are characterized by their emphasis on access to property and vehicular mobility and serve a variety of land uses ranging from low-intensity industrial uses to residences, shops, services, and offices. Mixed-use streets’ land uses and development character are constantly changing.
Vehicles

Non-motorized Travelers
(Future) Public Transit

Access and Throughput Balance Activity Center
Mixed-use
Design flexibility to support land development
Aesthetics, lighting, and street furnishing
Integration of civic/public and green spaces
Traffic volume and speeds
Commercial Center / Corridor Historic Core (DMU-HC)

Mixed-Use Core (DMU-MUC)
Gateway Commercial (DMU-GC)
Local business access and freight loading/unloading
Access management to minimize vehicle/pedestrian conflicts

Bicycle mobility and safety
Pedestrian comfort and safety
Jeff Davis between Our Father’s House Florist and Johnson Ave
SR 85/Glynn St between LaFayette Ave and Beauregard Blvd

SR 54/Lanier Ave between Rising Star Montessori Academy and LaFayette Ave
SR 54/Stonewall Ave between LaFayette Ave and Booker Ave
Connectors are streets that move people through and between neighborhoods. They connect to surrounding areas and land uses together. Connectors provide continuous walking and bicycling routes, becoming a secondary network of streets to the arterial street systems.

Transitional Residential (DMU-TR)
Mixed-Use Neighorbohood (DMU-MUN)
Gateway Commercial (DMU-GC)
Vehicles

2.1.3PlaceType
Residential Commercial Center / Corridor
Throughput Emphasis
Property Access Traffic Speeds

Efficient vehicle movements/vehicle progression
Access management to minimize vehicle/pedestrian conflicts
Bicycle mobility and safety
Pedestrian comfort and safety
Aesthetics, lighting, and street furnishing
Tiger Trail from SR 54/Stonewall Ave to Hood Ave
LaFayette Ave from Fayette County BOE Driveway to Tiger Trail
City Center Pkwy from Grady Ave to City Hall West Driveway (Future)
City Center Pkwy | from City Hall East Driveway to SR 85/Glynn St South (Future)
Grady Ave | from SR 54 to SR 85/Glynn St South
North Park Drive | from SR 85/Glynn Street North to North Jeff Davis Drive
Kathi Ave/Hood Ave/Forrest Ave from Hood/Forrest Ave Roundabout to N. Jeff Davis Drive
Georgia Avenue | from SR 85/Glynn Street North to Church Street
S. Jeff Davis Drive from Jimmie Mayfield Boulevard to End of Study Area


LaFayette Avenue Extension | from SR 85/Glynn Street North to Church Street (Future)
LaFayette Avenue Extension | from SR 54-Stonewall Avenue to City Center Parkway

Main Streets are defined by the character of the varied land uses surrounding them. These are generally oriented towards non-motorized travel and commercial store frontages serving people conducting daily errands, meeting with friends, shopping, and playing. Main Streets should comfortably accommodate many users, including pedestrians, bicyclists, and drivers.


Residential Streets primarily serve neighborhoods. They are quieter than mixed-use and connector streets, and have relatively low traffic volumes and low speeds. Though they have minimal activity relative to other street types, Residential Streets play a key role in supporting the social life of a neighborhood.

Non-motorized Travelers
Residential
Church Street North of Lanier Ave Existing Condition. Residential Street Section and Plan

Transitional Residential (DMU-TR)
Mixed-Use Neighborhood (DMU-MUN)
Neighborhood Residential (DMU-NR)
Open Space / Conservation

Access Emphasis
Traffic Speeds
Property Access
Pedestrian comfort and safety
Integration of Public and Green Spaces
Aesthetics, lighting, and street furnishing
Georgia Ave from Church St to East Study Area Boundary
Church St from Georgia Ave to North of SR 54/Lanier Ave
Lee St from Johnson Ave to Roadway End LaFayette Ave from SR 54/Lanier Ave to Tiger Trail Booker Ave from SR 54 to SR 54 Hillsdale Drive | from North Jeff Davis to East Study Area Boundary

North Park
East/West Johnson Avenue from Johnson Avenue to Jeff Davis Drive
North/South Johnson Avenue from Johnson Avenue to Jeff Davis Drive

Holly Avenue
Hill Street

3.2.1Description
Residential Boulevards primarily serve neighborhoods. They are quieter than mixed-use and connector streets, and have relatively low traffic volumes and low speeds. Like Residential Streets, Residential Boulevards play a key role in supporting the social life of a neighborhood.


Transitional Residential (DMU-TR) Mixed-Use Neighborhood (DMU-MUN)
4.1.1Description
Residential Alleys are small-scale streets that typically only carry low numbers of vehicles accessing adjacent properties.
Note: This street typology to be incorporated in new developments or subdivisions.
Vehicles

4.1.3PlaceType
Residential
Access Emphasis
4.1.6Considerations
Residential Density
Accessibility / connectivity at more than one street
Sight lines/visibility
Integration of informal recreational / gathering spaces
Property access and deliveries
Lighting
Mixed-Use Neighborhood (DMU-MUN)
Neighborhood Residential (DMU-NR)
Transitional Residential (DMU-TR)
Utility services, e.g., Trash pickup
Any new residential neighborhood or subdivision to include mixeduse development
Residential Alley Section and Plan


In the absence of a Fayetteville street-specific design manual, the Mobility Framework recommends the Georgia Department of Transportation’s (GDOT) Pedestrian and Streetscape Guide be used to provide direction with best design practices for streets and roadways intended to support multi-modal travel. Further, the GDOT Plan Development Process1 and Plan Presentation Guide2 should also be consulted to ensure consistency across federal-aid, state and locally-funded transportation and streetscape projects.
The recommendations that follow are based on existing transportation conditions analyzed and input gathered by the LCI project’s core team from public in-person and virtual meetings with the local community.
Implement the following Capital Improvement Projects:

1. New Roadway Connections


2. Complete Street Enhancements
3. Paths & Trails
4. Pedestrian Safety Projects
5. Inner and Outer Pedestrian Loops for Circulation Flow
Descriptions for potential projects associated with each improvement project type, mentioned above, are illustrated in the image to the right and also detailed in the following pages.


State of Georgia Department of Transportation (2021). Plan Development Process Rev 3.3. Available from: http://www.dot. ga.gov/PartnerSmart/DesignManuals/PDP/PDP.pdf
2 State of Georgia Department of Transportation (2017). Plan Presentation Guide Rev 2.8. Available from: http://www.dot.ga.gov/ PartnerSmart/DesignManuals/Plan/Plan_Presentation_Guide.pdf
Roadway Projects
Complete Streets Projects

Trail and Path Projects
Pedestrian Safety Projects
Capital Improvement Projects


1City Center ParkwayFisher Ave at SR 85/Glynn St SGrady AveNew roadway serving the Fayetteville City Hall complex, Walton Fayetteville Development and undeveloped land parcel


2Beauregard Blvd RealignmentBeauregard Blvd City Center ParkwayRealignment of Beauregard Boulevard from SR 85/Glynn Street to City Center Parkway
3Fisher Avenue ExtensionLee StJohnson AveExtend existing Fisher Avenue from Lee Street termini to Johnson Avenue
4LaFayette Avenue South ExtensionSR 54/Lanier Ave WCity Center PkwyNew roadway connecting existing LaFayette Avenue Magnolia Office Park to City Center Parkway
5LaFayette Avenue East ExtensionSR 85/Glynn StChurch AveExtend existing LaFayette Avenue from SR 85/Glynn Street to Church Street
6City Hall Drive ExtensionSR 54/Lanier Ave WSR 54/Stonewall AveNew roadway connecting SR 54 /Lanier Avenue westbound to existing City Hall Driveway
7Fayetteville Alleyway ProjectSR 54/Lanier Ave WSR 54/Stonewall AveNew Alleyway between SR 54/Lanier Avenue and SR 54/ Stonewall Avenue, behind retail buildings.
No.Project
1Hood Avenue/Kathi AvenueSR 85/Glynn St NJeff Davis DrBike lane / sharrow
2West Georgia AvenueSR 85/Glynn
No.Project NameFromToDescription


1Church Street Park PathChurch Street ParkJeff Davis DrMulti-use pathway
2Pye Lake TrailCity Center PkwyPye LakeGreenway trail, multi-use trail; side path
3Bradford - Manassas TrailCity Center PkwyThe Ridge Nature PreserveExtend existing Fisher Avenue from Lee Street termini to Johnson Avenue
4Southern Conservation TrustCity Center PkwyGrady AveMulti-use trail
5City Center TrailheadPye Lake Trail at City Center PkwyBradford-Manassas Trail at City Center PkwyTrailhead with parking
6Booker Avenue PathSR 54/Stonewall Ave EJeff Davis Dr / Booker AveMulti-use pathway
7Fayetteville First Baptist PathSR 54/Stonewall Ave EJeff Davis DrMulti-use pathway
8Inner and Outer Loop Project
Assemblage of existing and proposed sidewalks and trails that enable travelers to walk, run, or bike around downtown Fayetteville’s inner core. For description of the project, see page 111.


Street Frontage Typologies are inherent to identifying the function and purpose of streets in their area. Frontage Types are integral in creating the appropriate nexus between public and private realms within streets and blocks. Frontages types regulate how the private realm relates to the public domain, ensuring harmony between the two. Frontage type regulations determine what building types, public realm elements, and building elements are permitted or required based on the street’s development character. Frontage typologies include standards for sidewalks, street furniture, landscaping, outdoor retail displays, cafe areas, utilities, etc. Such standards allow the vision and goals articulated herein to be realized over time through incrementa development practices and changing architectural styles and materials. The Built Environment and Zoning recommendations describe the frontage typologies and their locational application in more detail.
The City of Fayetteville should pursue shared parking agreements with the Fayette County Annex, the Fayetteville First Baptist Church, First United Methodist Church, and the Fayetteville First United Methodist Church as a cost-effective alternative to the construction of a new structured parking facility. Additional analysis of Downtown Fayetteville’s parking inventory and parking demands is needed to determine existing parking demand peak hours, surplus and deficits in available spaces, and optimal time frames for public or private events.


1. Rabbits Run
2. Fenwyck Clubhouse
3. May Harp Park
4. Church Street Park
5. Historic Fayette County Courthouse Lawn
6. Heritage Park Gazebo
7. Southern Ground Amphitheater
8. Fayetteville City Cemetery
9. Heritage Park Lawn
10. Fayette County Superior Courthouse Lawn
11. Winesap Way
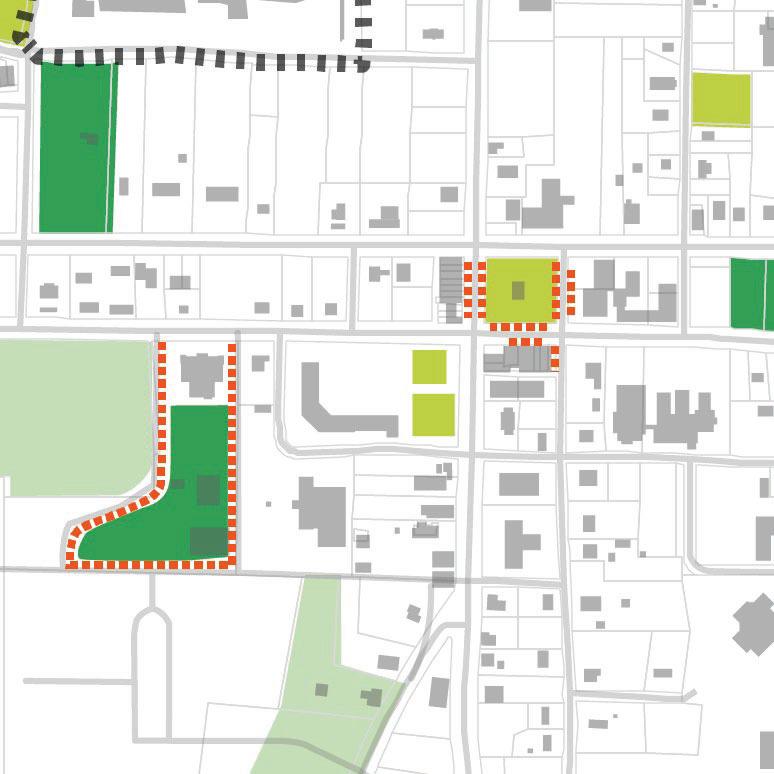
1 City Hall, Entrance Drive0112
2 City Hall, Exit Drive067
3 City Center Parkway0123
4 Glynn Street, southbound direction59
5 Glynn Street, northbound direction77
6 Stonewall Street, facing courthouse99
7 Stonewall Street, facing storefronts57
8 Lee Street, facing courthouse1418
9 Lee Street, facing UMC77
10 Lee Street, facing storefronts77
Total Available Parking Spaces54366

1 Library Lot157157
2 Fayette County Facility Lot0206
3 Lanier Avenue Lot2832
4 Fayetteville FBC Lot051
5 Fayetteville UMC Lot 1021
6 Fayetteville UMC Lot 2071
7 Fayetteville UMC Lot 3042
Total Available Parking Spaces185580


Downtown Mixed Use District (DMU)
The study area scope for the Livable Centers Initiative
Introduction
Purpose
The Downtown Mixed Use Zoning Code is intended to implement the overall aims of the Downtown Mixed Use District as set forth n the Unified Development Ordinance (cite), which is based on the City’s 2017 Comprehensive Plan vision for walkable, mixed use Downtown. The subdistricts that comprise the Downtown Mixed Use Zoning Code have their roots in the analyses depicted in the Moving Fayetteville Forward Living Cities Initiative Plan.
The Downtown Mixed Use Zoning Code is not a conventional zoning code like the zoning in other parts of the City. The subdistricts within Downtown Mixed Use Zoning Code are based on the existing and/or future character and built form of sections of Downtown rather than on the predominant type of land use permitted in that area. The Downtown Mixed Use Zoning Code regulates more aspects of the built environment than a conventional zoning code typically regulates.
Each subdistrict has an intent statement that describes the general vision for the future of that subdistrict with respect to development, scale, open spaces, and other attributes.
The opposite page show the proposed zoning map. The next pages describe the intents of each zoning district and the permitted building types within each district as well as outline the regulations within each zoning sub-district and provide architectural character references.
The LCI Zoning encompasses four layers: the overall Downtown Mixed Use District, the character themes outlined in Section 04: Vision the Downtown Sub-Districts, and the Regulations for each Permitted Building Type within a Sub-District. For each zoning district , development guidelines are detailed pertaining to the following:
ZoningDistrictIntent- The intent of the zoning regulations with respect to the form and character of development.
CharacterReferenceArea- The character(s) of the zoning district
Adjacent Street Typologies - Which street typologies outlined in the mobility section are proposed within the said zoning district to understand the synergies between the street typologies, permitted building types and uses.
CharacterReference- This section outlines the desired building character in the district including architectural design guidelines.
PermittedBuildingTypes - This is a list of building typologies permitted
BuildingPlacement- Location of the building on the lot, including setbacks.
BuildingForm- Recommended height and massing of a building
SiteandParkingAccess- Pedestrian and vehicular access to the building including parking and entrance location
SupplementalStandardsfromUnifiedDevelopmentOrdinance(UDO)- Other relevant standards that should be followed in accordance to the UDO.
Character Themes
Themes for 5 sectors that reflect the past, the present and the future of the study area
Downtown Sub-districts (DMU- )
Classification of districts within the DMU that will codify the development pattern
Building Types + Regulations
Guidelines for the various aspects of site, buildings, open spaces and detail design
The four layers of Fayetteville LCI zoning

The following sub-districts are established for development within downtown areas and are collectively called the Downtown Mixed Use Zoning Code. These sub-districts achieve the purpose of consolidation while also maintaining the characteristic features of the different areas.
1. Historic Core (DMU-HC)
2. Mixed Use Core (DMU-MUC)
3. Gateway Commercial (DMU-GC)
4. Mixed Use Neighborhood (DMU-MUN)
5. Boulevard Commercial (DMU-BC)
6. Transition Residential (DMU-TR)

7. Neighborhood Residential (DMU-NR)
8. Open Space Conservation

The existing and new zoning maps have been illustrated for comparison so that the changes can be tracked as the ordinance gets enforced. The following pages are a comprehensive guide to both public officials and private developers to ensure that all new development is cohesive and represents the vision of the livable centers initiative both in the built environment and the public realm.

R-10SINGLEFAMILYRESIDENTIAL
R-15SINGLEFAMILYRESIDENTIAL
R-22SINGLEFAMILYRESIDENTIAL
R-30SINGLEFAMILYRESIDENTIAL
R-40SINGLEFAMILYRESIDENTIAL


R-70SINGLEFAMILYRESIDENTIAL
DR-15ONEANDTWOFAMILYRESIDENTIAL

RMF-15MULTI-FAMILYRESIDENTIAL
OR-THCRESIDENTIALTOWNHOUSECONDOMINIUM
RPRESIDENTIALPROFESSIONAL
MOMEDICALOFFICE
OIOFFICEANDINSTITUTIONAL
C-1DOWNTOWNCOMMERCIAL
C-2COMMUNITYCOMMERCIAL
C-3HIGHWAYCOMMERCIAL
CC-3CONDITIONALC-3


C-4HIGHINTENSITYCOMMERCIAL
BPBUSINESSPARK
M-1LIGHTMANUFACTURING
M-2HEAVYMANUFACTURING
PDPPLANNEDDEVELOPMENTPROJECT
PCDPLANNEDCOMMUNITYDEVELOPMENT
RDREDEVELOPMENTDISTRICT
OSOPENSPACE
Existing Zoning Map

Historic Core (DMU-HC)
Mixed Use Core (DMU-MUC)
Gateway Commercial (DMU-GC)
Mixed Use Neighborhood (DMU-MUN)
Boulevard Commercial (DMU-BC)
Transition Residential (DMU-TR)
Neighborhood Residential (DMU-NR)
Open Space District (DMU-OS)
Retain Existing Zoning


Zoning DistrictHistoric Core (DMU-HC)Mixed Use Core (DMU-MUC)Gateway Commercial (DMU-GC)Mixed Use Neighborhood (DMU-MUN)
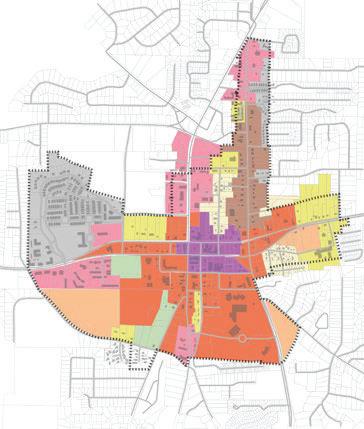
Character Theme Area The CoreThe Edge, The Core, The Gateway, The RootThe Gateway, The Edge, The RootThe Root, The Edge
Intent
The intent of this subdistrict is to preserve the historic character and scale of this area as expressed through the form and architecture of the existing historic building stock. New development in this area will be scaled and designed to complement the buildings located around the Old Fayette County Courthouse.
The intent of this subdistrict is to continue the evolution of this part of Downtown, in combination with the Historic Core, as the center of civic, commercial, social, cultural, and spiritual life in the City, where people can undertake a wide variety of activities, enjoy public open spaces, and walk safely and comfortably. New development in this district may be scaled slightly larger than the traditional mixed use buildings in the Historic Core and include a mix of uses with commercial activity on the ground level and residential units on upper levels.
These subdistricts are located at or near the edges of Downtown along one of the major corridors. The intent of this subdistrict is to encourage the development of prominent buildings with attractive facades and appealing commercial uses that would create a lively ambiance as people arrive into Downtown.
The intent of this subdistrict is to create pocket neighborhoods where a sufficient amount of land is available. Pocket neighborhoods are primarily residential in nature, consisting of a variety of residential building types along with some mixed use buildings with community-serving amenities, all of which are situated within a network of shared open spaces.
Zoning
Character
Intent
The intent of this subdistrict is to preserve the existing character and form of the buildings and landscapes of the section of the N. Jeff Davis Drive corridor that is characterized by converted or purpose-built buildings with residential architectural styles containing commercial uses.
The intent of this subdistrict is to serve as a transition between a mixed use or commercial district and a low-intensity residential area through the development of multi-unit residential buildings.


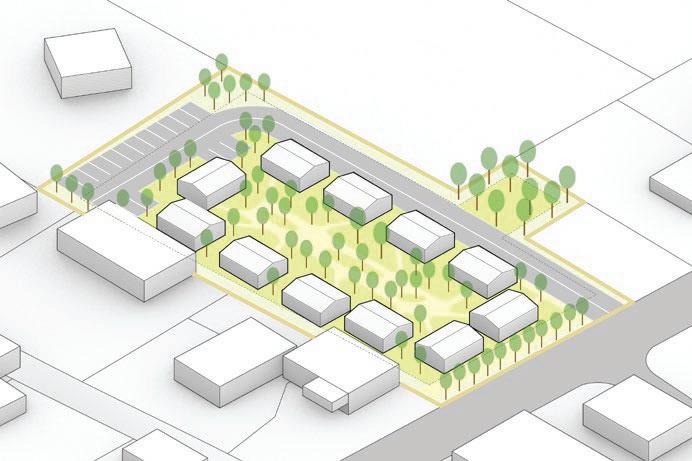

The intent of this subdistrict is to preserve the character and scale of longstanding residential neighborhoods of detached houses while allowing for new residential building types including cottage houses, cottage courts, and duplexes
This district is intended to protect and preserve valued environmental, scenic, and historic resources within the city, as well as to accommodate agricultural and horticultural uses that require areas of open land on which to operate in order to minimize potential impacts upon neighboring uses.

HOUSE
A detached structure consisting of one residential unit located on a lot.
DUPLEX
A structure on a lot consisting of two residential units attached vertically or stacked horizontally.
CARRIAGE HOUSE

An accessory residential unit located to the side or rear of a house on the same lot.


MULTIPLEX (FOURPLEX)
A detached structure on a lot containing four dwelling units, two on the ground floor and two on the second floor, with shared or individual entrances from the street.
Image Credit: Platt Builders

COTTAGE COURT
A series of detached houses arranged around a shared open space.
MULTIPLEX (FIVE TO TWELVE)
A detached structure on a lot containing from five to twelve dwelling units, two on the ground floor and two on the second floor, with shared or individual entrances from the street.
Image Credit: rosschapin.com
Note: Building Type Guidelines should be studied along with Zoning District Guidelines. (insert link)
TOWNHOUSES (ATTACHED)

Three or more residential units that are attached vertically and that each have separate entrances.


MAIN STREET BUILDING
An attached 2- to 3-story building with ground floor commercial space and residential or commercial space on upper floors.


TOWNHOUSES (STACKED)
Three or more residential units that arestacked horizontally.
LIVE/WORK BUILDING
An attached or detached structure consisting of one residential unit above or behind a fire-separated, flexible ground floor with a nonresidential use.
COURTYARD BUILDING
Multiple attached or stacked residential units with access from a shared courtyard.
MIXED USE BUILDING
A building with ground floor commercial use and residential units on upper floors.
Credits: Downtown Fayetteville Livable Centers Initiative (LCI) Study Overview Analysis | Engagement Vision | Recommendations | Implementation
COMMERICAL HOUSE
A converted house or purpose-built building designed like a house that contains a commercial use.

FLEX COMMERCIAL BUILDING
A building with taller ceilings than a typical commercial building that can accommodate a variety of commercial and light industrial activities.
COMMERCIAL BUILDING (PROMINENT)
A stately commercial building, typically a bank, designed with traditional architectural features.

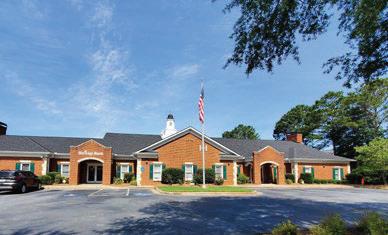
Public Building Types
CIVIC BUILDING (SMALL)
A minor government or institutional building.
COMMERCIAL BUILDING (SMALL)
A single-story building containing a commercial use.
CIVIC BUILDING (PROMINENT)
A distinctive government or institutional building.
MIXED COMMERCIAL BUILDING
A two-story building consisting of the same or multiple commercial uses.


Note: Building Type Guidelines should be checked along with zoning districts. (insert link)
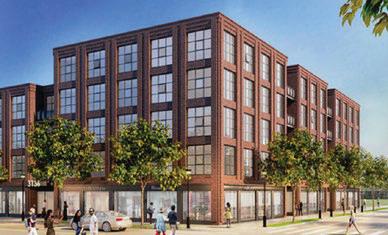

Buildings design should take into account the following design principles as per the UDO:
a. Size - the relationship of the project to its site.
b. Scale - the relationship of the building to those around it.
c. Massing - the relationship of the building’s various parts to each other.
d. Fenestration - the placement of windows and doors.
e. Rhythm - the relationship of fenestration, recesses and projection.
f. Setback - the relation to setback of immediate surroundings.
g. Materials - their compatibility with the surrounding developments.
h. Context - the overall relationship of the project to its surroundings.
The following guidelines apply to all districts
• A building’s massing should relate to its site location, use, and architectural context. The massing of a building can be defined as the overall geometry (length, width and height) of its perceived form. Massing is a significant factor that contributes to establishing the character of a specific building. Of particular importance in defining the massing of a building is the overall height of the form, both actual and perceived, as well as the geometry of the roof.
• Continuous, street-facing facades shall have additional design elements such as variations in the width, height, and rhythm at the street level to add interest, enhance the building appearance, establish greater depth in the facade, and enliven the pedestrian realm. Blank walls that can be seen from any street (public or private) are prohibited.
• Façade composition and color should be mindful of the existing context with no sharp contrast.
• Roofs shall be expressed in a visually interesting manner that complements the existing buildings. With the exception of singlefamily residences, the use of awnings on buildings is encouraged to provide protection from sun, wind, and rain, and to improve aesthetics of the building exterior.
• Franchise architecture for single or multiple buildings within a development should be avoided in order to create buildings that complement one another. Franchises or national chains should follow the guidelines to be compatible with the development in which it is located, utilizing similar architectural design, building materials or color selections to blend with the surrounding development.
• Monotnous repetition of the same architecture expression is discouraged, especially any wall surface over 30 feet in length should include at least one change in plane. Larger buildings shall be divided into bays of 25 to 40 foot widths that are articulated by pilasters, piers, differentiation in material, texture, or color, or by variations in the wall plane.
• Styles that are not recommended include faux colonial reproductions employing the use of false columns and accent pieces along storefronts.
• Materials should be selected based on their visual characteristics, quality, and durability. Carbon sequestering (the process of capturing and storing atmospheric carbon dioxide to reduce the amount of carbon dioxide in the atmosphere with the goal of reducing global climate change), urban heat island reducing, and locally sourced/ ethically made materials are ideal like lighter colored pavements/ white sealed asphalt where applicable. For examples of preferred materials, visit the mindful materials resource. The mindful materials Library aggregates product sustainability information while minimizing redundant effort on the part of both manufacturers and designers. Building Materials: Primary Materials: Not less than 80 percent of each street-facing Facade shall be constructed of one or more primary materials comprised of tested and proven, high quality, durable, and natural products. For Facades over 100 square feet, more than one Primary Material shall be used. Changes between Primary Materials must occur only at inside corners. The following are considered acceptable Primary Materials: Brick masonry; Native stone; Glass curtain wall. Accent Materials: The following Accent Materials may make up no more than 20% of the surface area on each Façade. Accent Materials are limited to: Pre-cast masonry (for trim and cornice elements only); Gypsum Reinforced Fiber Concrete (GFRC—for trim elements only); Recycled Metal (for beams, lintels, trim elements and ornamentation, and exterior architectural metal panels and cladding only); Glass block.
• These materials should not be used without prior approval: Metal building without a masonry base course or other architectural features; Prefabricated steel panels; Highly reflective, shiny, or mirrorlike materials; Mill-finish (non-colored) aluminum metal windows or doorframes; Aluminum, vinyl or fiberglass siding or roofing materials; Un-faced or painted concrete block; Pre-cast concrete panels or exposed, unfinished foundation walls; or Exposed plywood or particle board.
• The architecture and landscape design should represent cues from local climate, topography, history, and character, and incorporate modern, climate-sensitive, and environmentally-conscious design considerations to create healthier, more productive, and more sustainable places to live, work, play and rest.
The Zoning ordinance and Design guidelines for each district have been graphically respresented in response to this vision. This provides a toolkit not only for developers and investors targeting specific development opportunities, but also for the Planning & Facilities Department of the City Of Fayetteville in terms of the permiting and approval process. The sheets are intended to be read in conjunction with the Unified Development Ordinance as they mutually inform each other.
The Vision for moving Fayetteville Forward is to reimagine the possibilities in Downtown through catalytic equitable placemaking, enhanced legibility of the built environment, and creative guidelines for healthy, sustainable developments that will empower its diverse communities.
MajorType3:Mixed-Use
1.01Intent
CommercialStreetType2:MainStreet
MajorType3:Mixed-Use
The intent of this subdistrict is to preserve the historic character and scale of this area as expressed through the form and architecture of the existing historic building stock. New development in this area will be scaled and designed to complement the buildings located around the Old Fayette County Courthouse.
The Core
Common*
* Except for Attached Townhouses open space requirement is Private space
Major Type 1.3: Mixed-Use
Commercial Street Type 2.2: Main Street
Commercial Street Type 2.3: Commercial Alley
Residential Street Type 3.1 Residential Street
Reference:
DesignGuidelines:
Massing & Scale
• The preservation of existing historical building massing should be prioritized where possible.
• When applicable, adaptive reuse should be considered after the structural integrity can be assessed.
• Buildings need to conform to a three-part – base, middle, top –configuration.

• Buildings shall feature an architecturally distinct base to address and enhance the meeting of the building and ground.
• The massing of new construction in this district must be in the interest of walkability; ex. no large set backs from the sidewalk


Active Frontage
• Storefront windows shall utilize a bulkhead or other design feature to transition the building to the ground and establish depth and interest in the façade.


• Building entrances shall be easily identifiable. When appropriate, buildings should incorporate changes in mass, surface, lighting, or finish to emphasize entranceways.
• Buildings should incorporate alcoves, arcade, awnings, covered walkways, porticoes, or roofs that protect pedestrians from the rain and sun.
Facade Composition
• Fenestration rhythm should not be extreme in difference to the existing vernacular of adjacent buildings.
• Trim materials, glass, and details should appropriately match the character and quality of existing historic facades.
• High transparency at the ground level with visual connection to activity is strongly recommended in this district.
Roof Lines
• Roof forms of new buildings should be kept consistent with existing buildings. Gabled and hipped roofs are not appropriate for new structures in this district.
• Gutters and downspouts of new construction should be kept consistent in appearance with historic gutters and downspouts. They should not obstruct windows or architectural details.
Style & Materiality
• New construction shall utilize materials common on surrounding historic buildings where possible.
• Innovative use of regular materials such as brick and stone is encouraged but not required. For example, An expressive pattern can be created in the front façade by offsetting the bricks used to create the typical bond, so they project from the surface or different color combinations can be used.
A. See Article 6. of UDO (Conditional Uses) for Conditional Uses.
B. See Section 401.23. of UDO (Projections into Required Yards.) for Structural and Architectural Projections.
C. See Section 401.29. of UDO (Accessory Buildings.) for Accessory Building Regulations.

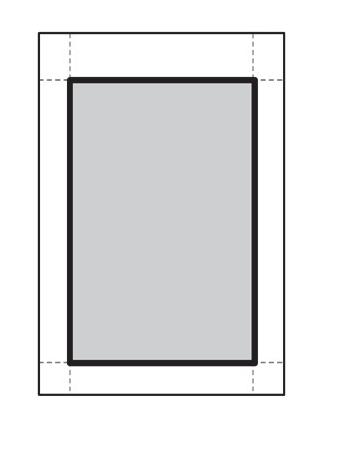
D. See Section 401.35. of UDO (Fences and Walls) for Fencing and Wall Regulations.
E. See Section 401.36. of UDO (Height Exceptions.) for Height Limitation Exceptions.
F. See Section 402.8 of UDO (Off-street automobile parking) for Off-Street Parking Requirements
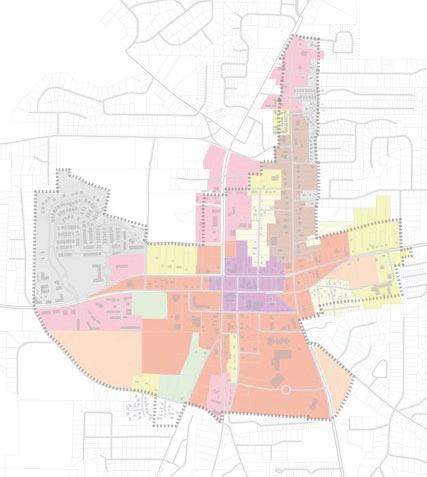
G. See Section 402.43 of UDO (Loading area requirements) for Loading Requirements
H. See Section 403.19 of UDO (Site Design.) for Landscaping Requirements
I. See Section 404.13. of UDO (Screening of Utilities and Trash Enclosures - Design Standards) for Screening Standards.
J. See Chapter 400, Article 5. of UDO (Building and Site Lighting) of for Lighting and Fixture Requirements, Illumination Levels, and Fixture Mounting Height.
H. See Section 406.18. of UDO (Signange - Downtown Mixed Use District) for Signage Regulations and Requirements
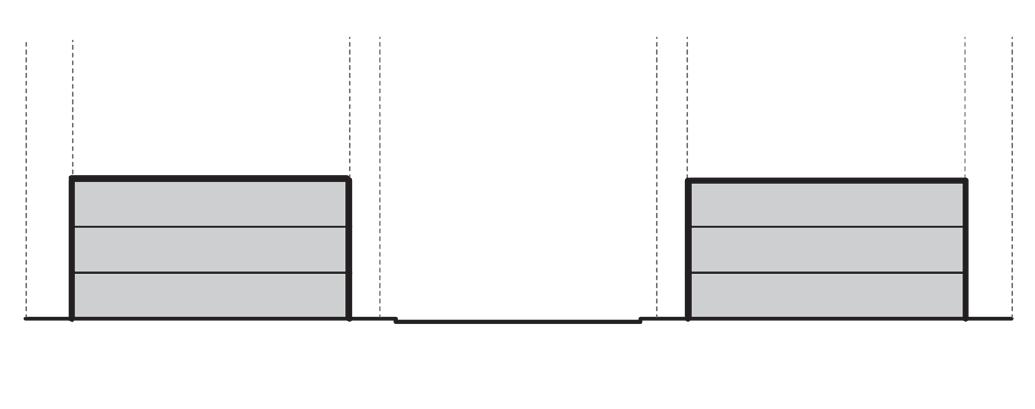

MajorType3:Mixed-Use
MajorType3:Mixed-Use
2.01Intent
The intent of this subdistrict is to continue the evolution of this part of Downtown, in combination with the Historic Core, as the center of civic, commercial, social, cultural, and spiritual life in the City, where people can undertake a wide variety of activities, enjoy public open spaces, and walk safely and comfortably. New development in this district may be scaled slightly larger than the traditional mixed use buildings in the Historic Core and include a mix of uses with commercial activity on the ground level and residential units on upper levels.
2.02CharacterAreas
The Core
The Edge
The Root
The Threshold
Common*
* Except for Mixed Use Building open space requirement is Common (at top of building)

Major Type 1.2A: Major Commercial
Major Type 1.2B: Major Boulevard
Major Type 1.3: Mixed-Use
Commercial Street Type 2.1: Connector
Commercial Street Type 2.3: Commercial Alley
Residential Street Type 3.1: Residential Street
Residential Street Type 3.2: Residential Boulevard
Alley Type 4.2: Shared Public Way
Reference: Recommended Discouraged
X
DesignGuidelines:
Massing & Scale
• Buildings shall be located, designed, and programmed to activate open spaces, promote pedestrian activities, provide visual interest, and create an enjoyable, vibrant, and mixed- use environment
• Development located at signalized intersections of major streets shall include pedestrian-oriented, community serving commercial uses such as a bookstore, coffee shop, or local market.

• Buildings shall be designed to accommodate a minimum first floor finished ceiling height of twelve feet (12’) to allow for retail commercial uses at the ground floor. The minimum interior depth of these commercial spaces shall be 25 feet.
• Upper floors of mixed-use buildings shall be stepped back when adjacent to single-family residences to ensure and protect privacy.

• In order to integrate new buildings with the existing urban fabric, new buildings are encouraged to incorporate pocket parks and attractive plaza areas between buildings that allow light to reach adjacent buildings.
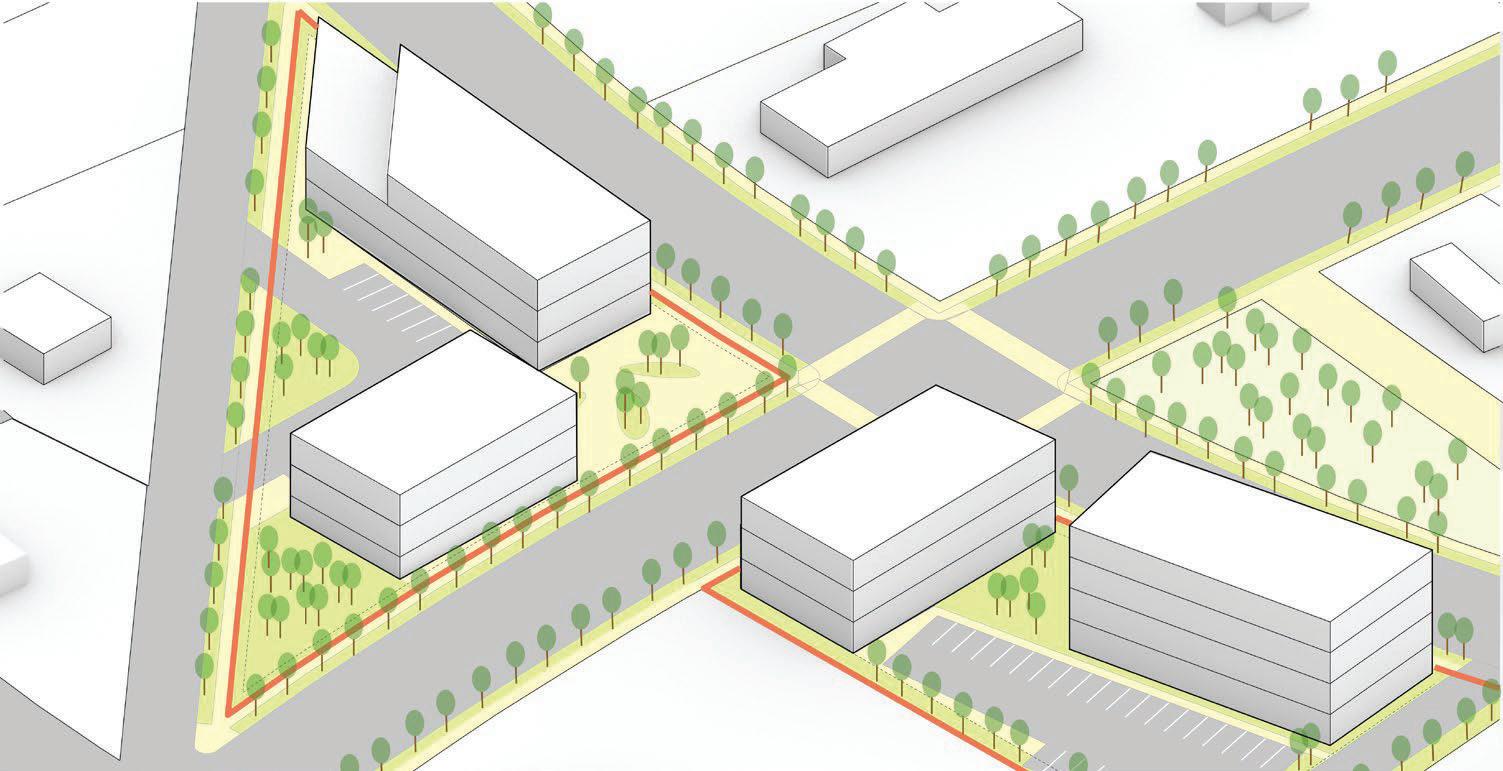
Active Frontage
• Storefront windows shall utilize a bulkhead or other design feature to transition the building to the ground and establish depth and interest in the facade. Entrances have to be definied.
• Provide a transitional design feature(s) such as an opaque wooden barrier between public spaces and residential spaces at the ground floor to distinguish between the public and private realms.
• The fenestration at the first floor of Mixed Use Core buildings should be composed of a 70% of window area in order to promote pedestrian-oriented uses with a high degree of transparency along the street. Uses shall be readily discernible to passers-by. Visually extend interior spaces outside through paving and glazing to create the concept of an indoor/ outdoor room
• Upper stories, which are less likely to be occupied by retail tenants may have a smaller percentage of window opening area with window proportions different from ground level.
Facade Composition
• Variations in the width, height, and rhythm of street-facing facades are encouraged along any block face.
• Street-facing facades shall have additional design elements at the street level to add interest, enhance the building appearance, establish greater depth in the facade and enliven the pedestrian realm.
Roof Lines
• Green roofs and gardens are highly encouraged.
• Activate any podium upper level with open stairwells and lively programs (Ex. Restaurants, entertainment, retail, etc.)
Style & Materiality
• This district can include a mix of architecture styles ranging from contemporary to traditional.
• The monotonous repetition of details on the building facade is not recommended.

A. See Article 6. of UDO (Conditional Uses) for Conditional Uses.
B. See Section 401.23. of UDO (Projections into Required Yards.) for Structural and Architectural Projections.
C. See Section 401.29. of UDO (Accessory Buildings.) for Accessory Building Regulations.


D. See Section 401.35. of UDO (Fences and Walls) for Fencing and Wall Regulations.
E. See Section 401.36. of UDO (Height Exceptions.) for Height Limitation Exceptions.
F. See Section 402.8 of UDO (Off-street automobile parking) for OffStreet Parking Requirements


G. See Section 402.43 of UDO (Loading area requirements) for Loading Requirements
H. See Section 403.19 of UDO (Site Design.) for Landscaping Requirements
I. See Section 404.13. of UDO (Screening of Utilities and Trash Enclosures - Design Standards) for Screening Standards.
J. See Chapter 400, Article 5. of UDO (Building and Site Lighting) of for Lighting and Fixture Requirements, Illumination Levels, and Fixture Mounting Height.
H. See Section 406.18. of UDO (Signange - Downtown Mixed Use District) for Signage Regulations and Requirements

3.01Intent
These subdistricts are located at or near the edges of Downtown along one of the major corridors. The intent of this subdistrict is to encourage the development of prominent buildings with attractive facades and appealing commercial uses that would create a lively ambiance as people arrive into Downtown.

3.02CharacterAreas
The Threshold
The Edge
The Root
Common
Major Type 1.1: Thoroughfare
Major Type 1.2A: Major Commercial
Major Type 1.2B: Major Boulevard
Major Type 1.3: Mixed-Use
Commercial Street Type 2.1: Connector
Reference:
RecommendedDiscouraged
DesignGuidelines:
Massing & Scale
• Building widths have to be broken into multiples of 50’ along major street and 100’ along secondary street to respond to pedestrian scale. For maximum width, refer zoning table.

Activate Frontage
• For buildings on a parcel abutting a primary street, the primary building entrance must face either: a.The primary street sidewalk; or b. A pedestrian-oriented outdoor space such as a public square, plaza, or courtyard


• The ground-floor building walls facing a primary street shall provide transparent windows or doors with views into the building for a minimum of 60% of the building frontage between 2½ and 7 feet above the sidewalk and 90% of the transparent windows or doors area shall remain clear to allow views into the building unless the proposed use has unique operational characteristics which preclude building openings.
• Buildings shall feature an architecturally distinct base to address and enhance the meeting of the building and ground.
• Building entrances shall be easily identifiable. When appropriate, buildings should incorporate changes in mass, surface, lighting, or finish to emphasize entranceways.
Facade Composition
• Storefront windows shall utilize a bulkhead or other design feature to transition the building to the ground and establish depth and interest in the façade.
• Provide human scaled architectural features is particularly important in areas where pedestrian activity is occurring or encouraged. The highest level of detail shall occur close to pedestrian areas, near streets and entries and around the ground floor.
Roof Lines
• Green roofs and use of solar panels are highly encouraged in these low scale buildings.
• Activate any podium upper level with open stairwells and lively programs (Ex. Restaurants, entertainment, retail, etc.)
• Roof forms may be flat or sloped. All flat roofs shall employ trim, variation in brick coursing, a projecting cornice or projecting parapet to visually “cap” the building.
Style & Materiality
• This district should have a predominant architecture style that is contemporary and less traditional

• The monotonous repetition of details on the building facade is not recommended and visual interest with mix of two primary materials is encouraged.
A. See Article 6. of UDO (Conditional Uses) for Conditional Uses.
B. See Section 401.23. of UDO (Projections into Required Yards.) for Structural and Architectural Projections.
C. See Section 401.29. of UDO (Accessory Buildings.) for Accessory Building Regulations.

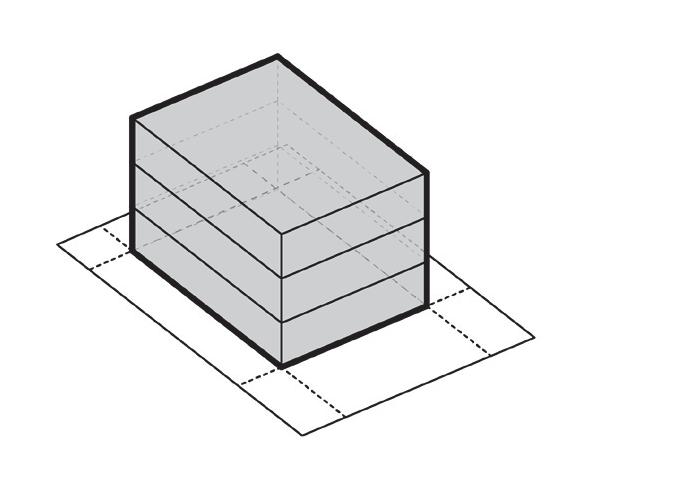
D. See Section 401.35. of UDO (Fences and Walls) for Fencing and Wall Regulations.

E. See Section 401.36. of UDO (Height Exceptions.) for Height Limitation Exceptions.
F. See Section 402.8 of UDO (Off-street automobile parking) for OffStreet Parking Requirements

G. See Section 402.43 of UDO (Loading area requirements) for Loading Requirements
H. See Section 403-19 of UDO (Site Design.) for Landscaping Requirements
I. See Section 404.13. of UDO (Screening of Utilities and Trash Enclosures - Design Standards) for Screening Standards.
J. See Chapter 400, Article 5. of UDO (Building and Site Lighting) of for Lighting and Fixture Requirements, Illumination Levels, and Fixture Mounting Height.
H. See Section 406.17. of UDO (Signange - Downtown Mixed Use District) for Signage Regulations and Requirements


4.01Intent
The intent of this subdistrict is to create pocket neighborhoods where a sufficient amount of land is available. Pocket neighborhoods are primarily residential in nature, consisting of a variety of residential building types along with some mixed use buildings with community-serving amenities, all of which are situated within a network of shared open spaces.
Open space that is commonly owned and managed by all residents of a pocket neighborhood is a key feature in fostering community. It is intended that it be adequately sized and centrally located with individual dwelling entrances oriented towards the open space.
At least 75 percent of the dwelling units of a pocket neighborhood shall abut a common open space; and all of the dwelling units shall be within 60 feet walking distance measured from the nearest entrance of the dwelling along the shortest safe walking route to the nearest point of the common open space. The common open space shall have dwellings abutting at least two sides.

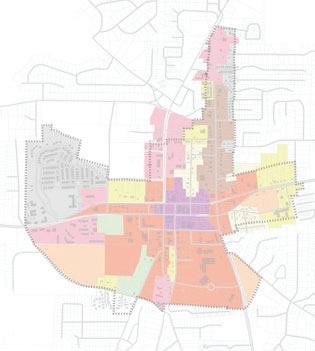
The Edge The Root
Major Type 1.2B: Major Boulevard
Commercial Street Type 2.1: Connector
Residential Street Type 3.1: Residential Street
Alley Type 4.1: Residential Alley
Alley Type 4.2: Shared Public Way
Reference:
DesignGuidelines:
Massing & Scale
• Each cluster shall contain a minimum of four and a maximum of twelve dwellings to encourage a sense of community.
• It is recommended to raise cottages off the ground. When cottages are clustered close together, a few steps up to a porch allows for a visual separation between community space and private space.

Activate Frontage
• From each residential unit, clear access to any existing/future trail and sidewalk network is strongly recommended.
• Every dwelling shall have a covered entry porch oriented toward the common open space or street. This porch shall be open on at least two sides, and shall not be enclosed. An exception is in mixed-use buildings that may have covered entry porches located off of an access alley lane
• High transparency at the ground level with visual connection to activity is strongly recommended in this district for mixed use buildings

• For residential units on the ground level, direct access to the sidewalk is recommended but not required.
Facade Composition
• Nested Houses configuration is encouraged to increase privacy in a cluster. Layout of homes should be with an open side and a closed side so that neighboring homes ‘nest’ together - with no window peering into a neighbor’s living space.
• Fenestration rhythm should not be extreme in difference to the adjacent development. For example mixed use buildings should follow the windows and opening style of adjacent residential buildings.
• Trim materials, glass, and details should complement the character and quality of the residential vernacular.
Roof Lines
• Gabled and hipped roofs are permitted. A mix of flat and sloped roofs are encouraged for diversity.
• Gutters and downspouts of new construction should be kept consistent in appearance with other residential buildings in this district.
Style & Materiality
• New construction following a specific architectural vernacular is not required but should respect the existing buildings in the area.
• Use of transparent material including but not limited to glass should be limited in this district for residential uses.
Note: No more than 20% of lots in this district may be developed as duplexes to promote diverse

A. See Article 6. of UDO (Conditional Uses) for Conditional Uses.
B. See Section 401.23. of UDO (Projections into Required Yards.) for Structural and Architectural Projections.
C. See Section 401.29. of UDO (Accessory Buildings.) for Accessory Building Regulations.

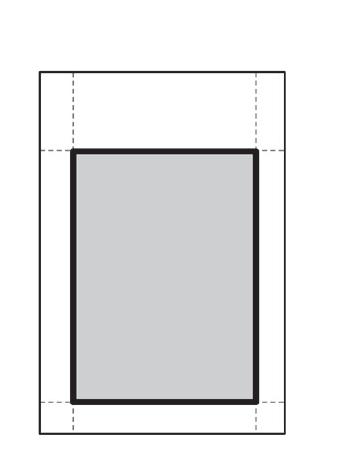

D. See Section 401.35. of UDO (Fences and Walls) for Fencing and Wall Regulations.

E. See Section 401.36. of UDO (Height Exceptions.) for Height Limitation Exceptions.
F. See Section 402.8 of UDO (Off-street automobile parking) for OffStreet Parking Requirements
G. See Section 402.43 of UDO (Loading area requirements) for Loading Requirements
H. See Section 403-19 of UDO (Site Design.) for Landscaping Requirements
I. See Section 404.13. of UDO (Screening of Utilities and Trash Enclosures - Design Standards) for Screening Standards.
J. See Chapter 400, Article 5. of UDO (Building and Site Lighting) of for Lighting and Fixture Requirements, Illumination Levels, and Fixture Mounting Height.
H. See Section 406.17. of UDO (Signange - Downtown Mixed Use District) for Signage Regulations and Requirements
Reference: RecommendedDiscouraged
5.01Intent
The intent of this subdistrict is to preserve the existing character and form of the buildings and landscapes of the section of the N. Jeff Davis Drive corridor that is characterized by converted or purposebuilt buildings with residential architectural styles containing commercial uses.

5.02CharacterAreas
The Threshold
Common
Major Type 1.2A: Major Commercial
Major Type 1.2B: Major Boulevard
DesignGuidelines:
Massing & Scale
• The massing of new construction in this district must be in the interest of walkability. Existing sidewalk networks should be well connected to new construction.


Activate Frontage
• From each parcel, clear access to any existing/future trail and sidewalk network is strongly recommended.
• Porches and outdoor areas within the commercial parcels that are within sight lines of the existing sidewalk network should be mindful of the pedestrian experience.
• If applicable, landscaping and native planting for larger front-yards is recommended with indication of type of business with clear signage.
Facade Composition
• Façade composition and color should be mindful of existing buildings on Jeff Davis Drive and respond to traditional facade elements as seen in current conditions.
• Fenestration rhythm should not be extreme in difference to the existing vernacular.
• Trim materials, glass, and details should attempt to best match the character and quality of the commercial vernacular
Roof Lines
• A variety of pitched roofs are permitted to respect the residential character.
• Gutters and downspouts of new construction should be kept consistent in appearance with other commercial buildings in this district.
Style & Materiality
• The predominantly white and grey combination of colors and materials to be complemented with new development.
• Innovative use of common materials such as brick, stone, and metal is encouraged.
• The use of transparent material (glass) should be limited in this district.
UDO Sec. 206.63 Accessory Dwelling Unit)
A. See Article 6. of UDO (Conditional Uses) for Conditional Uses.
B. See Section 401.23. of UDO (Projections into Required Yards.) for Structural and Architectural Projections.
C. See Section 401.29. of UDO (Accessory Buildings.) for Accessory Building Regulations.


D. See Section 401.35. of UDO (Fences and Walls) for Fencing and Wall Regulations.

E. See Section 401.36. of UDO (Height Exceptions.) for Height Limitation Exceptions.
F. See Section 402.8 of UDO (Off-street automobile parking) for OffStreet Parking Requirements

G. See Section 402.43 of UDO (Loading area requirements) for Loading Requirements
H. See Section 403.19 of UDO (Site Design.) for Landscaping Requirements
I. See Section 404.13. of UDO (Screening of Utilities and Trash Enclosures - Design Standards) for Screening Standards.
J. See Chapter 400, Article 5. of UDO (Building and Site Lighting) of for Lighting and Fixture Requirements, Illumination Levels, and Fixture Mounting Height.
H. See Section 406.17. of UDO (Signange - Downtown Mixed Use District) for Signage Regulations and Requirements

6.01Intent
The intent of this subdistrict is to serve as a transition between a mixed use or commercial district and a low-intensity residential area through the development of multi-unit residential buildings.

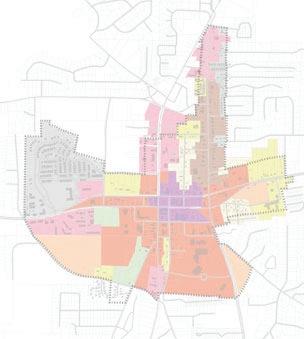
The Core
The Edge The Root
The Threshold The Village
Common
* Except with Duplex and Townhouses (Attached), open space is to be Private
Major Type 1.2A: Major Commercial
Major Type 1.2B: Major Boulevard
Commercial Street Type 2.1: Connector
Residential Street Type 3.1: Residential Street
Alley Type 4.1: Residential Alley
Reference: Recommended Discouraged
6.05CharacterReference X
DesignGuidelines:
Massing & Scale
• Break up long, monotonous, uninterrupted walls if the buildings front the public realm, through at least one of the following methods
• Locate multiple buildings along any given block face.
• Utilize a segmented facade treatment on larger buildings.


• Vary the articulation of the massing.
• Differentiate between the base of the building and the top of the building to enhance the pedestrian realm. Base treatments shall be cohesive across facades and integrated with the architectural character of the building.
Activate Frontage
• Provide a transitional design feature(s) between common spaces (lobbies, corridors, etc.) and residential spaces at the ground floor to distinguish between the public and private realms.
• Porches, outdoor areas, and active frontages facing pedestrian areas are encouraged.
• Front doors or common vestibules shall face a street or a courtyard that provides a publicly accessible and direct walkway to a street. Such courtyards shall be landscaped, shall generally exclude
vehicles, and shall be visible from a street where feasible.
Facade Composition
• Changes in wall planes, layering, horizontal datums, vertical datums, building materials, color, or fenestration shall be incorporated to create simple and visually interesting buildings in attached settings..
Roof lines:
• Roof features, such as solar collectors, shall be designed and placed in a manner that is compatible and harmonious with the roof slope and overall architectural character of the building.
Style & Materiality
• The predominant building material may be complimented with other secondary materials used in limited areas of the facade to highlight architectural features.
• Accent materials, which would generally not be acceptable on large areas of the facade, may be used in limited areas of the facade to highlight architectural features.
Note: On parcels with an area of 2 acres or more, at least 30 percent of the lots shall be developed as a Multiplex building type.


A. See Article 6. of UDO (Conditional Uses) for Conditional Uses.
B. See Section 401.23. of UDO (Projections into Required Yards.) for Structural and Architectural Projections.
C. See Section 401.29. of UDO (Accessory Buildings.) for Accessory Building Regulations.
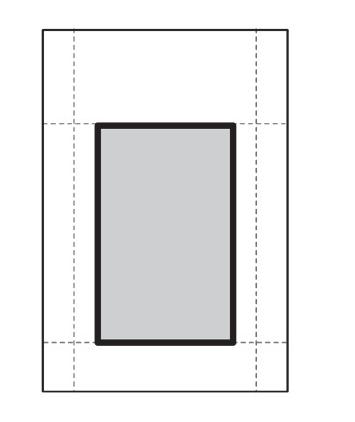
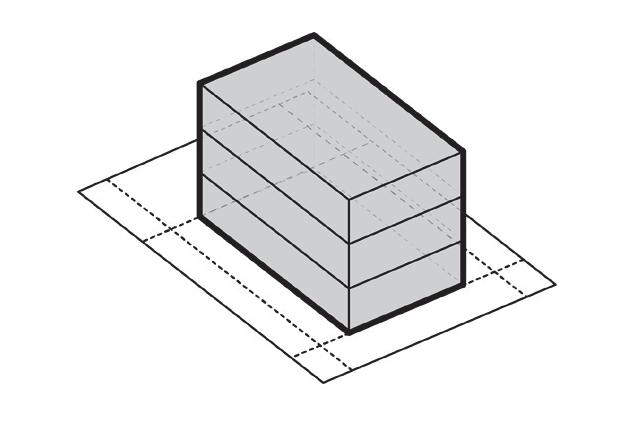
D. See Section 401.35. of UDO (Fences and Walls) for Fencing and Wall Regulations.

E. See Section 401.36. of UDO (Height Exceptions.) for Height Limitation Exceptions.
F. See Section 402.8 of UDO (Off-street automobile parking) for OffStreet Parking Requirements
G. See Section 402.43 of UDO (Loading area requirements) for Loading Requirements
H. See Section 403.30 - 403.31 of UDO (Street Tree and Internal Landscaping Requirements for New Subdivisions.) for Tree Placement and Landscaping Requirements.
I. See Section 404.13. of UDO (Screening of Utilities and Trash Enclosures - Design Standards) for Screening Standards.
J. See Chapter 400, Article 5. of UDO (Building and Site Lighting) of for Lighting and Fixture Requirements, Illumination Levels, and Fixture Mounting Height.
H. See Section 406.17. of UDO (Signange - Downtown Mixed Use District) for Signage Regulations and Requirements

7.01Intent
The intent of this subdistrict is to preserve the character and scale of longstanding residential neighborhoods of detached houses while allowing for new residential building types including cottage houses, cottage courts, and duplexes


7.02CharacterAreas
Residential Street Type 3.1: Residential Street Alley Type 4.1: Residential Alley
DesignGuidelines:
Massing & Scale
• Avoid and modulate long, monotonous, uninterrupted walls if the buildings front the public realm.
• Differentiate between the base of the building and the top of the building to enhance the pedestrian realm. Base treatments shall be cohesive across facades and integrated with the architectural character of the building.

Activate Frontage
• Provide a transitional design feature(s) between public spaces and residential spaces at the ground floor to distinguish between the public and private realms.
• Porches, outdoor areas, and active frontages facing pedestrian areas are encouraged.
Facade Composition
• Changes in wall planes, layering, horizontal datums, vertical datums, building materials, color, or fenestration shall be incorporated to create simple and visually interesting buildings.
• Blank, windowless walls in excess of 750 square feet are prohibited when facing a public street unless required by the Building Code.
• In instances where a blank wall exceeds 750 square feet, it shall be articulated or intensive landscaping shall be provided.
Roof Lines
• Gabled and hipped roofs are encouraged. If applicable, research on the desired vernacular is highly recommended.
Style & Materiality
• The architecture of new buildings should complement the vernacular architecture
• The use of metal panel is discouraged.
• Homogenous and monotonous architectural expressions not recommended.
• Styles that are not recommended include faux colonial reproductions employing the use of false columns and accent pieces along storefronts
in 7.04
Note: On parcels with an area of 2 acres or more, at least 30 percent of the lots shall be developed as a permitted building type other than House.

C. See Section 401.29. of UDO (Accessory Buildings.) for Accessory Building Regulations.


D. See Section 401.35. of UDO (Fences and Walls) for Fencing and Wall Regulations.

E. See Section 401.36. of UDO (Height Exceptions.) for Height Limitation Exceptions.
F. See Section 402.8 of UDO (Off-street automobile parking) for OffStreet Parking Requirements.
G. See Section 402.43 of UDO (Loading area requirements) for Loading Requirements.
H. See Section 403.30 - 403.31 of UDO (Street Tree and Internal Landscaping Requirements for New Subdivisions.) for Tree Placement and Landscaping Requirements.
I. See Section 404.13. of UDO (Screening of Utilities and Trash Enclosures - Design Standards) for Screening Standards.
J. See Chapter 400, Article 5. of UDO (Building and Site Lighting) of for Lighting and Fixture Requirements, Illumination Levels, and Fixture Mounting Height.
H. See Section 406.17. of UDO (Signange - Downtown Mixed Use District) for Signage Regulations and Requirements.

I. See Section 206.63. of UDO (Accessory Dwelling Unit (ADU)) for Residential Accessory Dwelling Unit Regulations and Requirements.
J. See Section 206.64. of UDO (Cottage Court for Tiny Homes) for Regulations and Requirements of Cottage Courts.
8.01Intent
8.02CharacterAreas
This district is intended to protect and preserve valued environmental, scenic, and historic resources within the city, as well as to accommodate agricultural and horticultural uses that require areas of open land on which to operate in order to minimize potential impacts upon neighboring uses.
A. See Section 205.6. of UDO (Open Space District) for Open Space District Regulations, including Permitted Uses, Land Distrubance and Landscaping.


B. See Chapter 200, Article 6. of UDO (Conditional Uses) for Conditional Uses.
C. See Chapter 300, Article 2 (Watershed Management) Of Udo For Watershed Development Standards And Additional Design Requirements.
The Edge
Commercial Street Type 2.1: Connector
Residential Street Type 3.2: Residential Boulevard
• Preservation of natural landscapes and maintenance of areas for public interaction for health, wellness and recreational benefits
• Impervious Surface Area limited to 10% beyond which no alteration of natural landscape is permitted
• Plant species native to the Piedmont Region of Georgia only.
• Singlular non-native species such as grass lawns are not permitted.
• Potential compatible Programs: Nature Preservation, Education, Horticulture, Play Areas

• Environmental and geotechnical assessment have to be completed before any programmatic intervention.
D. See Section 401.23. of UDO (Projections into Required Yards.) for Structural and Architectural Projections.
E. See Section 401.35. of UDO (Fences and Walls) for Fencing and Wall Regulations.
F. See Section 401.36. of UDO (Height Exceptions.) for Height Limitation Exceptions.
G. See Section 402.8 of UDO (Off-street automobile parking) for OffStreet Parking Requirements.

H. See Section 402.43 of UDO (Loading area requirements) for Loading Requirements.
I. See Section 403.8 - 403.14 of UDO (Tree Protection Standards.) for Tree Protection and Preservation Standards.
J. See Section 404.13. of UDO (Screening of Utilities and Trash Enclosures - Design Standards) for Screening Standards.
K. See Chapter 400, Article 5. of UDO (Building and Site Lighting) of for Lighting and Fixture Requirements, Illumination Levels, and Fixture Mounting Height.
L. See Section 406.18. of UDO (Signange - Downtown Mixed Use District) for Signage Regulations and Requirements.


Introduction

The implementation matrix is created to be accountable to the initial questions put forth at the kick-off of the LCI Study. While each may be categorized in terms of priority, the overarching goal of implementation is to be intentional and calculated with each action item such that each builds off a previous action. Ultimately, the moving Forward Fayetteville Vision will be fulfilled through consistently acting on the tasks. Stakeholders and funding possibilities are listed as a starting point to initiate decisions by the City. Continuous community engagement will be key to keep the momentum.
Outer Loop


Miles
Potential catalytic site for mixed use development
Transitional Park Space
Inner Core Loop

2.2 Miles
City Hall Park
Potential Public Gathering Space

Transitional Park
Pocket Park

Create gateway to downtown


Potential catalytic site for mixed use development


Howcanweusecurrentconditionstoleadustofuturepossibilities?Howcanweusecurrentpublicspacetoleadustofuturepossibilities? Item
EC.01Planning
ContinuetoensurethattheCityof Fayettevilleisadequatelystaffedand fullyempoweredtoact
EC.02PublicRealmContinuepreservationofforestlandnext totheSouthernConservationTrust
EC.03Development Performfeasibilitystudyofexisting buildingsandvacantorunderutilized lots
EC.04DevelopmentContinuetocreaterelationshipswith futurebusinessownersanddevelopers
EC.05Planning
ContinuecoordinationwithGeorgia MainStreetprogramtocommit toneighborhoodanddowntown revitalization
EC.06PublicRealmRabbit'sRunImprovementProject• Cityof Fayetteville, landscape architect Generalfunds
EC.07PublicRealmFenwyckClubhouseImprovement Project
EC.08PublicRealmMayHarpParkImprovementProject•
Cityof Fayetteville, landscape architect Generalfunds
EC.09PublicRealmChurchStreetParkImprovementProject•
Cityof Fayetteville, landscape architect Generalfunds
EC.10PublicRealmHistoricFayetteCountyCourthouse LawnImprovementProject
EC.11PublicRealmHeritageParkGazeboImprovement Project
EC.12PublicRealmSouthernGroundAmphitheaterImprovementProject•
EC.13PublicRealmFayettevilleCityCemeteryImprovement Project
EC.14PublicRealmHeritageParkLawnImprovementProject•
EC.15PublicRealmFayetteCountySuperiorCourthouseLawnImprovementProject•
Cityof Fayetteville, landscape architect
Fundraiser events,general funds
EC.16PublicRealmWinesapWayPublicSpaceImprovementProject•
Cityof Fayetteville, landscape architect Generalfunds
Cityof Fayetteville, landscape architect Generalfunds
Cityof Fayetteville, landscape architect ImmediateShort-TermLong-Term
Howcanweachievebalancebetweenmobilityandplacemaking?
SM.01Public Realm Createpublic/parkspacebetween amphitheateranddowntown• CityofFayetteville, landscapearchitectGeneralfunds
SM.02Public Realm CreateparkspacebetweenE. LanierAveandSJeffDavisDr.•
SM.03Public Realm CreatetransitionalparkalongE. LanierAveandSJeffDavisDr.•
SM.04Public Realm Createpocketpark,playground,or communitygarden•
SM.05Public Realm Creategatewayintodowntown byimprovingN.JeffDavisDr. streetscape •
CityofFayetteville, landscapearchitectGeneralfunds
CityofFayetteville, landscapearchitectGeneralfunds
CityofFayetteville, landscapearchitectGeneralfunds
CityofFayetteville, Downtown Improvement Partnership, landscapearchitect
REBC,general funds, improvement districtfunding
Howcanweachievebalancebetweenmobilityofroadwaysandplacemaking?
SM.06MobilityEstablishstreetfrontagetypologies•
CityofFayetteville Planning Department, landscapearchitect Generalfunds,LCI
SM.07PublicRealmImprovepublicspacedomains•
CityofFayetteville, Downtown Development Authority(DDA)
SM.08MobilityPursuesharedparkingordinances•
REBC = Roadside Enhancement and Beautification Council grant
TSPLOST = Transportation Special Purpose Local Option Sales Tax
TAP = Transportation Alternatives Program
LMIG = Local Maintenance & Improvement grant
HSIP = Highway Safety Improvement Program
STBG = Surface Transportation Block Grant Program
TSPLOST,general funding,DDA
CityofFayetteville Planning Department Generalfunds
REBC = Roadside Enhancement and Beautification Council grant
TSPLOST = Transportation Special Purpose Local Option Sales Tax
TAP = Transportation Alternatives Program
LMIG = Local Maintenance & Improvement grant
HSIP = Highway Safety Improvement Program
STBG = Surface Transportation Block Grant Program
ImmediateShort-TermLong-Term
Howcanweachievebalancebetweencompletestreetsandplacemaking?
Item No.WorkTypeProject
Priority ResponsiblePartiesPotentialFundingHighMedLowSources
SM.16MobilityHoodAvenue/KathiAvenueBikeLane/Sharrow•CityofFayettevilleTAP,LMIG,general funds
SM.17MobilityWestGeorgiaAvenueSidewalk/Sharrow•CityofFayetteville TAP,LMIG, TSPLOST,general funds
SM.18Mobility
LaFayetteAvenue BikeLane/Sharrow
SM.19Mobility
JohnsonAvenue Sidewalk/Sharrow
SM.20Mobility
TigerTrail Sidewalk/Sharrow
SM.21Mobility
•CityofFayetteville TAP,LMIG, TSPLOST,general funds
•CityofFayettevilleTAP,LMIG,general funds
•CityofFayettevilleTAP,generalfunds
ChurchAvenue SidewalkImprovement/Sharrow
SM.22Mobility
JeffDavisDrive SidewalkUpgrades,PlantingStrip Buffer,Sharrow,RaisedCurb
SM.23Mobility
BookerAvenue SidewalkUpgrades,Pedestrian Crossing
HeritageParkwaySharedStreet
•CityofFayettevilleTAP,LMIG,general funds
•CityofFayettevilleTAP,REBC,general funds
•CityofFayettevilleTAP,TSPLOST, generalfunds
SM.24Mobility
•
CommercialSharedPublicWay
REBC = Roadside Enhancement and Beautification Council grant
TSPLOST = Transportation Special Purpose Local Option Sales Tax
TAP = Transportation Alternatives Program
LMIG = Local Maintenance & Improvement grant
HSIP = Highway Safety Improvement Program
STBG = Surface Transportation Block Grant Program
Howcanweachievebalancebetweenpaths,trails,andplacemaking?
SM.25MobilityChurchStreetParkmulti-usepathway•
SM.26MobilityPyeLakeTrailgreenway,multi-usetrail,andsidepath•
CityofFayetteville, landscapearchitectTAP,GARec.Trails
Southern ConservationTrust, landscapearchitect TAP,Recreational Trails
SM.27MobilityBradford-ManassasTrail• Southern ConservationTrust, landscapearchitect TAP,Recreational Trails
SM.28MobilitySouthernConservationTrustmulti-usetrail• Southern ConservationTrust, landscapearchitect TAP,Recreational Trails
SM.29MobilityCityCenterTrailheadandparking•
CityofFayetteville, Developer,Southern ConservationTrust, landscapearchitect
Developer,TAP, generalfunds
CityofFayetteville andDowntown Development Authority(DDA)
TAP,TSPLOST, generalfunds/DDA funding
SM.30MobilityBookerAvenuemulti-usepathway•
Howcanweachievebalancebetweenpedestriansafetyandplacemaking?
CityofFayetteville FayetteCounty, landscapearchitect TAP,TSPLOST Item No.WorkTypeProject Priority
SM.31MobilitySR-54/LanierAveWtoGradyAve-visibilitycrosswalk•
CityofFayetteville andGDOT HSIP,TAP,LMIG, TSPLOST
SM.32Mobility
SR-54/LanierAveWtoSR-85/ GlynnStS-visibilitycrosswalkand signalimprovement • CityofFayetteville andGDOT HSIP,TAP,LMIG, TSPLOST
SM.33Mobility
SR-54/StonewallAveWtoSR-85/ GlynnStS-visibilitycrosswalkand signalimprovement • CityofFayetteville andGDOT HSIP,TAP,LMIG, TSPLOST
REBC = Roadside Enhancement and Beautification Council grant
TSPLOST = Transportation Special Purpose Local Option Sales Tax
TAP = Transportation Alternatives Program
LMIG = Local Maintenance & Improvement grant
HSIP = Highway Safety Improvement Program
STBG = Surface Transportation Block Grant Program
ImmediateShort-TermLong-Term
WhatinvolvementandengagementopportunitiesworkwellinFayetteville?
Whatarethecomponentsforaholisticsolutionthatharmonizesthebuiltenvironmentandthe publicrealm?
CE.01Community Createdigitalplatformfor communitytoleavecommenton futureprojectstobeimplemented
CE.02Community Strategizehowtoinvolve communitycommentonfuture projectstobeimplemented
DG.01PlanningEstablishastreettypology guide
DG.02PlanningAdoptarchitecturaldesign guidelines
CE.03Community
Createframeworkforguidinghow communitycanbeinvolvedin futureprojectimplementation
CE.04CommunityHostannualeventstoestablish relationshipswithdevelopers
CE.05Community Createaportionofwebsite dedicatedforprospectivebusiness owners
Howcanweensurethatourplansaregroundedinmarketandfinancialreality?
DG.03PlanningAdoptaCompleteStreet policy Item No.WorkTypeProject
Whatmethod(s)willleadthetypeofdevelopmentandoverallplaceenvisionedfortheMain StreetDistrict? Item
Z.01Planning
EstablishcodetoalignwithCity's ordinancestructureasSec202.6, DowntownMixed-UseZoning •CityofFayetteville Recommendhiring thirdpartyzoning consultant.
MA.01Planning Performinventoryofexisting funding,pipelinefunding,and opportunitiesforfunding
MA.02Development Createstrategyforland acquisitionforcapital improvements
MA.03Development
Strategizerecruitmentofthird partiestoexaminemarket conditionsoffirst-degree priorityprojects
MA.04DevelopmentCreateRFQsforproject developers
MA.05DevelopmentCreateRFPsforarchitectural designofkeycatalyticsites
Z.02Planning
Modifyscheduleoflanduses withinUDOtoaccountforeachof theDMUsubdistricts; Removeplaceholderswithintables throughoutUDOdedicatedforthe DMUdistricts;
ChangethelanguageunderSec 202.6torefertotheDowntown Mixed-UseZoningdocument
Recommendhiring thirdpartyzoning consultant.
Z.03PlanningRevisetheUDO•CityofFayetteville Recommendhiring thirdpartyzoning consultant.
Z.04Planning
AdoptDowntownMixed-Use ZoningOrdinanceandRevised UDO•CityofFayetteville Recommendhiring thirdpartyzoning consultant.
When faced with implementation, it is often viewed as a direct relationship between money and impact. However, in the collective vision for Fayetteville, it is possible to flip that script: whathappensif actionableitemsbecomeprioritizedbythecenterofthevisioncompass?
As each action item in the previous tables was evaluated, it was determined that some were addressing a specific direction of the vision compass, while others were located toward the center, able to address every direction. The radial priority matrix seeks to address that the actionable items in the center need the most immediate attention and can happen much faster than the other items: many of these items are policy-based recommendations that other action items might play off of.
Within the matrix, each high priority item falls within a zone: "Long Term”, "Short Term", and "Immediate." Immediate items are listed at the bottom as they are the most important first steps toward implementation. Other items that are important but might take more time/planning, such as many items that fall under mobility, are located on the outer rings.
The matrix allows the city, as well as stakeholders, to visualize each action item's place on the matrix while seeing how each is able to be tied directly back to the original vision. While it is ideal that each project is able to be implemented eventually, the radial priority matrix takes the highest priority items from the table and shows that each may take a different amount of time.
[Note: only "high" priority classified projects represented below]
DG.01
Establish a street typology guide
DG.02
Adopt architectural design guidelines
DG.03 Adopt a Complete Street policy
EC.01
Continue to ensure that the City of Fayetteville is adequately staffed and fully empowered to act.
CE.02
Strategize how to involve community comment on future projects to be implemented
Z.01
Establish code to align with City's ordinance structure as Sec 202.6, Downtown Mixed-Use Zoning
Z.02
Modify schedule of land uses within UDO to account for each of the DMU subdistricts; remove placeholders within tables throughout UDO dedicated for the DMU districts; change the language under Sec 202.6 to refer to the Downtown Mixed-Use Zoning document
To keep the momentum initiated by the moving Fayetteville Forward implementation matrix, it is critical to consider both the importance and timeframe of the tasks.


The Atlanta metro consists of 29 counties surrounding the city of Atlanta, the economic and cultural hub of the region, and is the 9th largest metro in the country at 6 million people. There are tend central “core” counties that belong to the Atlanta Regional Commission (ARC), the regional planning and intergovernmental coordination agency for the metro, which harbor most of the metro’s population and jobs. The metro’s economy is the 9th largest in the country with a GDP of $397.3 billion and home to 30 Fortune 1000 companies.


The ten-county core (ARC) accounted for 75% of all population growth from 2010-2019, up from 66% the previous decade. More urban counties such as Fulton and DeKalb were the main beneficiaries of this growth as younger & older households have increasingly sought vibrant, walkable communities in both urban & suburban areas w/ proximity to jobs & lifestyle amenities
Despite consisting of 1.9% of the metro population, Fayette County saw its share of growth decrease from 1.6% (2000-2010) to 1.1% since. Overall, the trend in the south metro, including Fayette County and Fayetteville, has been decreasing growth rates and a decreasing share of the metro’s population growth.
Overall, the trend in the south metro, including Fayette County and Fayetteville, has been decreasing growth rates and a decreasing share of the metro’s population growth


Sources: NCG, U.S. Census Bureau
Fulton, Dekalb, & Cobb Counties have seen a disproportionate share of growth among educated people compared to overall population growth. This key demographic attracts office-using employers, retailers, and is often an indicator of households with high income potential.


Overall, Fayette County has a relatively low population density when put into a regional context, with most of the metro population concentrated to the north. Population density plays an important role:

• Many regional retailers seek a central location with regional access and high population counts within 10-20 miles when focusing on site selections.
• Most office users seek proximity to diverse population centers with access to a variety of housing types in order to attract employees.


*Population estimates and projections for 2021 & 2026 are provided by Claritas w/ 2000, 2010, & 2019 U.S. Census Bureau Data
**The Atlanta Metro is defined as the Atlanta-Sandy Springs-Alpharetta, GA Core-Based Statistical Area (CBSA)
Population Density, 2018 (5-Year American Community Survey)
Sources: NCG, U.S. Census Bureau
While all regions in the metro have relatively affluent areas, the northern suburbs of Atlanta tend to have the greatest concentration of affluence with notable concentrations in the eastern and northern portions of the city of Atlanta. Concentrations of affluent households attract employers seeking highly educated workers and retailers seeking proximity to high spending households. Fayette County, particularly in Peachtree City, has the highest concentration of affluent households in the south Atlanta metro.


• Local median incomes have a wide range from $52,000 to $111,500.
• Median income in Fayetteville is $73,526, a 25.8% increase since 2010, and 7.6% higher than metro median incomes.
• Median income in Fayette County tends to be highest in and around Peachtree City due to quality schools and a predominately large single-family product type.
• Median incomes in Fayette County are 32% higher than the metro.
• Fayette County median income growth has significantly lagged behind regional growth.
%Change
Cityof Fayetteville$58,438$73,52625.8%

FayetteCounty$82,216$90,1459.6%
AtlantaMetro$57,550$68,31618.7%
Georgia$49,347$58,70019.0%
UnitedStates$51,914$62,84321.1%
Sources: NCG, U.S. Census Bureau
Median incomes in Fayette County are 32% higher than the metro.
Concentrations of highly educated households are attractive to both office-using employers and retailers. Many office users desire proximity to a highly educated workforce and retailers often use educational attainment levels as a key metric when determining site locations. Additionally, households with high educational attainment levels have high income potential and are strong indicators of neighborhood stability.
The northern & eastern portions of the city of Atlanta and the north metro suburbs have the highest concentrations of high educational attainment households. In the south, Fayette County stands out, but a lack of high concentrations of educated households has limited major office growth and relocation locally and on the south side of Atlanta.


• Fayette County has a higher percentage of population w/ college degrees than the metro as a whole.
• The highest concentrations of people w/ college degrees in Fayette County are found in and around Peachtree City.
• In Fayetteville 28% - 45% of people have college degrees, with the city’s overall percentage of 38.7% in-line w/ the metro.
• Growth among college educated population in Fayetteville has lagged behind the region.
Population 25+ with Bachelor’s Degree or More, 2018 (5-Year American Community Survey)
AtlantaMetro34.4%38.6%12.2%
Georgia27.2%31.3%15.1%
UnitedStates27.9%32.1%15.1%
Sources: NCG, U.S. Census Bureau

Growth among college educated population in Fayetteville has lagged behind the region by 4.7%.20-MILE RADIUS
As a percentage, Fayette County has half as many renter households compared to the region and nation While Fayetteville has nearly 29% renter households, this is still significantly less than the metro, state, and national percentage of 36-37%.
Nearly 50% of rental product in Fayetteville consists of older single-family homes and duplexes / quadplexes. Roughly 20% of rental product is newer Class A product that is most attractive to the younger, affluent, educated population ~500 units of Class A product will deliver in Downtown Fayetteville along w/ ~300 units in Trilith, bringing more desirable product to market that will attract affluent renter audiences.
Most high paying jobs ($40,000+) are in Downtown / Midtown Atlanta, edge cities such as Perimeter & Cumberland, and northern suburbs. Outside of the airport area, most jobs are 30+ miles away. 45% of $40,000+ jobs located within 30-miles. 25% of high-paying jobs within 30-miles are in transportation, manufacturing, and wholesale trade sectors. These industries are concentrated heavily south of the city of Atlanta due to the major interstates which links Atlanta and the airport to Port of Savannah.


Roughly 50% of Fayette County residents work in and around the airport or south. The greatest concentrations of employment are at the airport, in Peachtree City / Fayette County, and then Downtown / Midtown with the rest of employment scattered through out the metro. With the airport and adjacent areas being a significant draw for Fayette County workers, future growth at and around the airport will serve as a significant demand driver for Fayette County and the subject area. Roughly 35% of Fayette County residents commute over 25 miles to work, which is significantly higher than the metro average of 22%. Only 22% commute less than 10 miles, compared to metro average of 35%. These figures indicate county serves primarily as a bedroom community.


Roughly 35% of Fayette County residents commuteover25miles to work.
*Job data provided by U.S. Census Bureau’s Longitudinal Employer-Household Dynamic data and includes private jobs only w/ salaries $40,000


While Metro Atlanta has seen significant job growth, this growth has not been equally spread. Since 2010, growth among $40,000+ jobs has primarily occurred in the Atlanta core and northern suburbs. The lack of job growth in southern metro suburbs is a contributing factor to declining population growth rates. Chicken & egg story. South metro needs more educated workers to attract more high-paying jobs, however these workers want to be located near existing jobs and in high lifestyle areas.








While Metro Atlanta has seen significant job growth, this growth has not been equally spread.
19% of Fayette County residents work in Fayette County


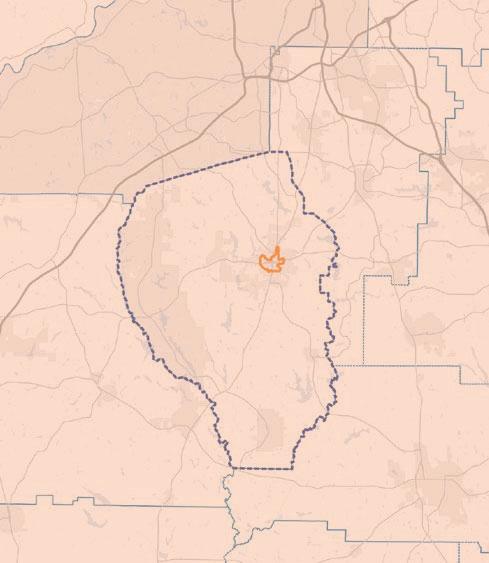
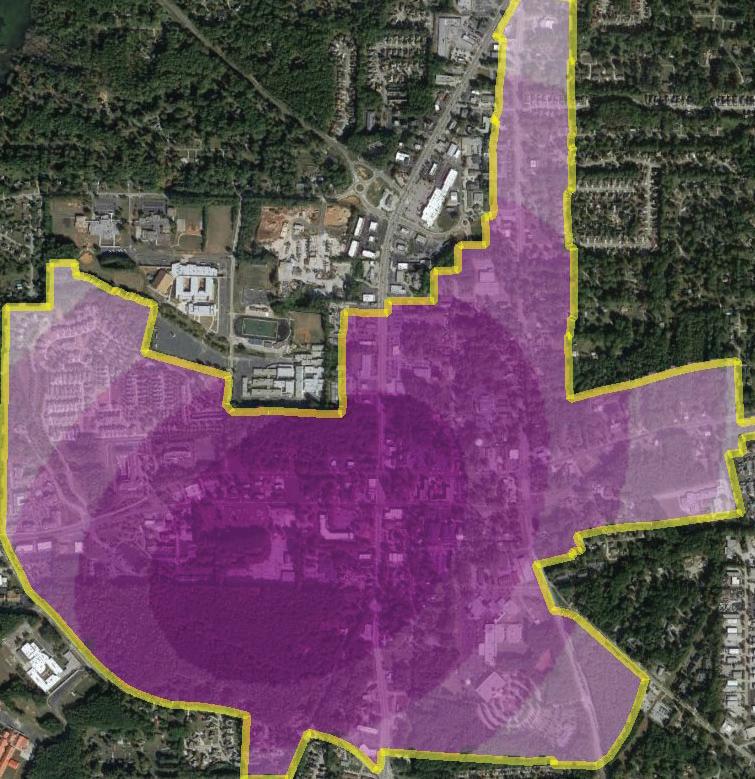
Increasing housing variety and creating / improving unique lifestyle options will increase this percentage.

29.8% of people working in Fayette County who earn over $40,000 live in Fayette County, which is significantly less than other comparable metro counties. This percentage most likely is low due to limited urban typologies offered in Fayette County. 19% of Fayette County residents work in Fayette County, which is in-line with comparable counties. This could be tough to improve without significantly increasing local job offerings which would be a challenge.


2,977
SectorShare
PublicAdministration
EducationalServices
HealthcareandSocialAssistance
AccommodationandFoodServices
RetailTrade
FinanceandInsurance
OtherServices(ExcludingPublicAdministration)
Professional,Scientific,andTechnicalServices
TransportationandWarehousing
AdministrationandSupport
TotalJobsbyAnnualEarnings
AnnualEarningsEmployment
$40,000+
$15,001-$39,999
<$15,000
Please note that this data is based on federal employment data and these jobs are not always located at the addresses reported, for example, teachers are often shown working at the board of education address, not the specific school they’re working at.
Fayette County has one of the best school systems in the metro and is a major asset in attracting residents, particularly those seeking single family housing. Schools near the study area tend to be ranked lower than schools elsewhere in the county which could limit housing premiums as homeowners seek to be located in more desirable districts.
Fayette County Public Schools Ranked #6 Best School District in Georgia by Niche

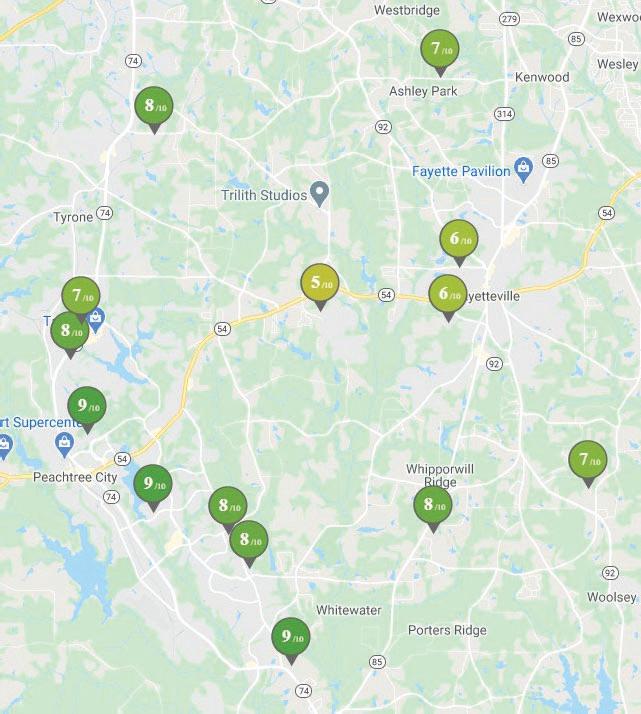
Fayette County Public Schools Ranked #8 Best School District in Georgia by School Digger

HIGHLY RANKED PEACHTREE CITY SCHOOLS
Fayette County GreatSchool.org Elementary School Rankings
Population
2021Estimate1,588
2010Census1,474
Growth2010-20217.73%
Growth2010-2021,Annualized0.70%
AverageAge45.7

Households
2021Estimate544
2010Census481


Growth2010-202113.10%
Growth2010-2021,Annualized1.19%
OwnerOccupied414
RenterOccupied130
PercentRenterOccupied23.9%
2021AverageHouseholdIncome$104,004

2021MedianHouseholdIncome$77,748
Housing
MedianHomeValue$234,761
MedianYearBuilt1990
AverageHouseholdSize2.24
HouseholdsByIncome(2020)Share <$24,9995610%


$25,000-$34,999356%
$35,000-$49,9997414%
$50,000-$74,9999818%
$75,000-$99,9997213%
$100,000-$124,9995811%
$125,000-$149,999458%
$150,000-$199,999509%
$200,000-$249,999275%
$250,00+295%
LCI STUDY AREAThe local area is fairly affluent, with median incomes well above the state and metro average, however, significantly below that of the county. The area has seen limited growth among households / population, primarily due to limited new development in the area. Nearly 24% of the households are renter households, well above the county’s average, however below that of the metro and national averages.


A strong community is one where all people, regardless of age, gender, race or socio-economic status, play a role. In such a community, everyone has something to offer and something to receive from each other. This interdependence is possible by leveraging the unique strengths of different social groups. This map recognizes the mix of generations.


Source: The Citizen


A strong community is one where all people, regardless of age, gender, race or socioeconomic status, play a role.
Leading causes of age-adjusted death:
1. Ischemic Heart and Vascular Disease
2. Cancer
3. Cerebrovascular Disease
4. All Other Mental and Behavioral Disorders
5. Alzheimer’s Disease
Leading causes of premature death:
1. Ischemic Heart and Vascular Disease
2. Motor Vehicle Crashes
3. Suicide
4. Cancer of the Trachea, Broncus, and Lung
5. Accidental Poisoning
Data in Fayette County. Source: Piedmont Fayette Hospital Community Needs Assessment


Fayetteville, GA US
Particulate Matter (PM2.5) level in 2018 was 8.69. This is about average. Closest monitor was 11.7 miles away from the city center. http://pics4.city-data.com/sgraphs/city/air-pollution-pm2-5-Fayetteville-GA.png


Percentage of the population that lives farther than 1 mile (urban) or 10 miles (rural) from the nearest supermarket with healthy food

The subject area is in a moderately affluent, established suburban county with a quality school district and several local employment anchors (primarily government), and an established square with historic courthouse offering a walk-able, urban grid not found locally. There exist numerous underutilized parcels near the downtown square prime for redevelopment or infill.
Trilith (formerly Pinewood Forest) and Peachtree City soak up a significant amount of local demand for residential and new retail with Trilith offering quality housing in an urban, walk-able format with significant park and recreational space. Downtown has limited park space, which should be addressed, and much of the eastern portion of the historic square is occupied by surface parking and churches who limit vibrancy. Overall limited amount of undeveloped land, and many existing uses still economically viable and not yet ripe for redevelopment.


Downtown Fayetteville can leverage the city’s established grid to provide unique to market for-sale and rental product in a walk-able format at a price discount to competing areas such as Trilith. Due to entitlement challenges elsewhere in the county, much of this demand can be captured by Downtown Fayetteville. Smaller lots can be utilized as residential infill in the form of town homes with larger mixed-use developments focused on providing ground floor commercial space for local serving retail and office where appropriate.


Downtown Fayetteville can leverage the city’s established grid to provide unique to market for-sale and rental product in a walk-able format at a price discount to competing areas such as Trilith.AGING RETAIL
In order to assess the opportunity for multifamily rental product within the study area, NCG examined the newest and best performing comps in the local area.
1. The Dylan at Fairburn (formerly Crofthouse)
2. Premiere Lofts at Trilith (formerly Pinewood)
3. The Meridian at Lafayette
4. Camden Peachtree City


In order to assess the opportunity for multifamily rental product within the study area, NCG examined the newest and best performing comps in the local area. Premiere Lofts at Trilith is the newest delivery and located in a mixed-use environment. Product currently commands $1.77 / SF, an ~18% premium to the market. New multifamily product within the study area most likely would command around $1.70 - $1.80 / SF with premiums primarily generated by the walkable environment of Downtown Fayetteville.
Coweta and Fayette County have seen an increase share of Class A multifamily absorption since 2011. Absorption in Fayette County has largely been limited by lack of new supply. Increasing lifestyle environments in Newnan, Trilith, and potential Downtown Fayetteville will increase the market’s capture moving forward. NCG’s forecasted demand of 243 units annually from 2021-2025 allows for absorption of the planned deals in the pipeline and up to an additional 250-300 units within the study area.
AtlantaMetro7,602units9,133units10,228units
Coweta&Fayette CountyShare1.9%2.4%4.1%
Coweta&Fayette County137units222units419units

FayetteCounty Share28.8%32.4%58.1%
FayetteCounty39units72units243units
Sources: CoStar, NCG
County has largely been limited by lack of
Sources: CoStar, NCG

 DetachedProduct
5. Newnan Vines
6. Trilith
7. Villages at Lafayette Park
8. Oakleigh Manor
9. Everton Creekside
AttachedProduct(TownHomes)
1. Trilith
2. Villages at Lafayette Park
3. Lexington Village

*All data is sourced from RedFin & MetroStudy using demonstrated sales except Everton Creekside which uses current listings


NOTE: All data is from homes built 2015+ and sold within last 2 years. Data is provided by RedFin and MetroStudy
*Villages at Lafayette Park stalled halfway during The Great Recession and saw new development & sales begin in earnest in 2017+

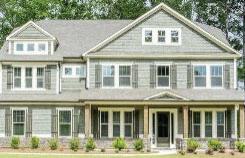


This data shows the historic and future demand potential for single-family detached product for the Primary Market Area (PMA) which consists of the ZIP Codes 30214 & 30215.
Given Downtown Fayetteville’s unique lifestyle offering within the market NCG estimates the LCI study area could potentially capture up to 50% of the PMA demand, although this number may be limited based on the availability of sites and land costs.
AtlantaMetro17,87116,21216,678
FayetteCountyShare (%)1.8%2.2%3.0%
FayetteCounty314361500
PMAShare(%)51.8%45.8%40.5%
PMA163165203
This data shows the historic and future demand potential for single-family attached product for the Primary Market Area (PMA) which consists of the ZIP Codes 30214 & 30215.
Given Downtown Fayetteville’s unique lifestyle offering within the market NCG estimates the study area could potentially capture up to 50% of the PMA demand.

AtlantaMetro3,7333,4494,544
FayetteCountyShare (%)0.1%0.2%0.8%
FayetteCounty4735
PMAShare(%)50.0%90.0%90.0%
PMA2631
Existing office space within the market was primarily built prior to the recession with rents ranging from $18 - $24 Full Service / SF. Vacancy of the buildings profiled averages 18.1% with an average parking ratio of 4.3 spaces per 1,000 SF.
There is limited market activity with a new speculative office building recently delivered in Pinewood Forest with estimated rents around $30 / SF Full-Service. Additional activity includes an in-market employer building and occupying a build-to-suit space.

The above table tracks local market office growth driven by conventional market activity within the local area (ZIP Codes 30214 & 30215). The local market has been stagnant in recent years with 3 years showing negative absorption since 2016. However, there has been limited new product added to attract prospective users to the market. NCG estimates the local area will absorb 13,00014,000 SF of Class A office space annually, Trilith likely to get first 3 years given existing space. This would indicate 25,000 SF - to 30,000 SF of additional unmet demand through 2025. Given annual absorption levels office product should be provided in the 5,000 - 20,000 SF range, ideally in high value areas such as proximity to retail, parks / trails, with high visibility.
Region2002-2011Avg.
AnnualOfficeAbs.
2012-2020Avg. AnnualOfficeAbs.
2021-2025Projected Avg.AnnualOffice Abs.
AtlantaMetro1,997,415SF2,310,388SF1,460,486SF
SouthAtlantaShare16.6%9.5%10.3%
SouthAtlanta Absorption330,915SF218,385SF150,462SF

LocalShare13.9%6.6%9.1%
LocalAbsorption46,086SF14,380SF13,683SF

The local market has been stagnant in recent years with 3 years showing negative absorption since 2016. However, there has been limited new product added to attract prospective users to the market.
4.8 million of retail space exists within 3-miles of the subject area, primarily located along Glynn St N (Route 85) with Fayette Pavilion being a major regional retail center.
Since the recession, the local retail sector has seen significant retail compression due to limited new deliveries and consistent absorption.
Major recent leases include Ashley HomeStore (30,000 SF), DSW (23,370 SF), Shoppers World (30,000 SF), and Burlington (49,000 SF).
For the purpose of retail supply and demand analysis NCG utilized a 9-mil trade area radius. Additionally, competing retail centers / cores were considered (highlighted in red) when determining potential capture rates of current unmet demand.


2008200920102011201220132014201520162017201820192020YTD

DrinkingPlaces(Alcoholic)$16,221,973$3,588,494$12,633,479$6180%$12,977,57850%$6,488,789$40025%4,055 Snack/Non-AlcoholicDrinkPlaces$31,804,912$4,917,507$26,887,405$12080%$25,443,93050%$12,721,965$56025%5,679
TOTAL$2,646,026,029$2,132,003,998$514,022,031$10,00673%$1,928,981,81670%$1,353,988,406$385188,987
Retail demand exists for a building material & supply store. Lowe’s and Home Depot are both located north of the subject area, so a candidate would most likely be an Ace Hardware / neighborhood serving type store. Demand exists within the trade area for a smaller grocery, with most of this demand coming from south and east of the subject area where households are under served. Given the nearby grocers a full-service large-scale national brand grocer is unlikely, but a smaller grocer such as a Lidl.
There are small amounts of demand across various store types. While not enough for a standalone store, these uses could potentially fill stalls or portions of boutique lifestyle brand stores. Food service is the major driver of retail today and there appears to be significant demand for full-service restaurants as well as some demand for limited-service restaurants, a bar, and snack / drink shops such as a smoothie store or coffee shop. While not shown, NCG estimates an additional 10,00015,000 SF of currently under-served population servicing businesses such as hair salon, banks, and child day care facilities.
PropertyNameAddressSFLeasedPrice/SFRentType
125-127PavilionParkwayShoppersWorld30,000$7.00NNN
119-123PavilionParkwayAshleyHomeStore30,000$7.30NNN
125-127PavilionParkwayBurlington49,000$11.00NNN
725ELanierAveFarmersInsurance1,250$14.50FS
1307GlynnStStateFarm1,400$15.00NNN
834GlynnStIonicVR1,820$16.00NNN
1240Highway54WTheSkinSociety1,826$18.50NNN
105-113PavilionParkwayBurgerIM2,397$29.00NNN
100PromenadeParkwayT-Mobile3,000$33.60NNN
270GlynnStNAvailable1,000–7,000$14.50NNN
535GlynnStNAvailable1,200–6,300$20.50NNN


Q2 What are the top places you go to in Downtown? (select three)
The community survey conducted in February 2021 yielded input from over a 1000 participants.
Q1:
#OTHER(PLEASESPECIFY)DATE
Spaces Only time I visit downtown is when the county had the events like neon light night and vaccinate your dog day. It not a lot to do downtown that is kid friendly. I hope with this project there is more to do with families with small kids.
0%10%20%30%40%50%60%70%80%90%100%
3 Traffic Do something with traffic speed and volumn. Can't walk around without danger of being hit be cars.
13 Design More inviting..aesthetically pleasing area, more driving space, less congestion between Stonewall, Lanier and Glynn. When entering the downtown area I would think nice shape lamp poles every so many feet apart. and turned on every night
Q3 Which of the following would encourage you to come to Downtown more often? Select all that apply.
diverse businesses and fewer Confederate-looking eateries. More culture is needed in doento. It's not a museum nor do we need to be reminded of "old town"
so you dont always have to be adjacent to the extremely loud roads. Some pretty quiet areas to have picnics with friends and grab a coffee or sweets. Activities in a quieter place than the courthouse square. Seasonal activities like ice
Q4 Which of the following segments of the Fayetteville community, if any, do you feel could be better supported by additional housing options Downtown?
None of the above
Young professionals (recent high school and college graduates)
Families with children ages 18 and younger
Empty-nesters (families where children have grown up and moved out)
Retirees 75+
Families with live-in elderly family members
People with disabilities
Other (please specify)
#OTHER(PLEASESPECIFY)DATE
8 Low Income The individuals who are less fortunate in Fayetteville. As of now, all the places are hidden away where no one goes. Just a bit of a push of support for them to become more stable.
9We need everyone.,.,.,.,to comment an be heard3/1/2021
46I believe all of the above groups could benefit from appropriate housing and facilities in the downtown district. But young people/families will provide growth for our town and need to be a priority.
47People-oriented housing and walkable neighborhood design should be encouraged in general. All the above groups of people should be accommodated for. Fayette County is losing young people at an alarming rate, so a concentrated focus on them is important.
13 No More Housing Do you believe we need more housing options in Downtown? We wouldn't like to have a nightmare downtown, but a balance between a city and an urban community.
18 Low Income Facilities for people in need, homeless,
19empty lot between DD and Ford would be great location for a smaller housing unit for people without children who would enjoy walking to downtown. I am not sure we should be adding housing on a larger scale than that.
24 Low Income Poor people, like me, who have college degrees and jobs and still can’t afford more than $800/mth
0%10%20%30%40%50%60%70%80%90%100%
Q5 Taking into account your answer to question 4, which of the following housing types and/or programs would you support seeing more of (or being incorporated into) Downtown?
No More Housing Why destroy the town square? We moved to this town for what it was.. Not what you are doing to it.
tiny homes. Single family only with at least 1 acre lots.
More Housing would prefer to see more businesses, not housing downtown. while I understand the need to bring in the work/play/live aspect - I feel like more retail/restaurants, greenspace would benefit this town.
shops on the ground level and apartments above
133 Lofts Apple orchard style, Alexandria VA or Pinewood Forest, possibly single story Loft on top of storefronts - - not cookie cutter mass produced housing or multi-story that will detract from charm of Town Square)
Mixed Use Housing would LOVE to see multi-use buildings on the square/downtown grid (shops on bottom and apartments on top). I also think more of the higher density condos (like the spencer square subdivision by ihop) would thrive in Fayetteville.
135 Single Family Homes It is easy to do one of the extremes of providing high density apartments or large single family homes. Where most people want to be is in the “missing middle” of housing options. support all varieties of housing downtown, but a concentrated effort on ADU’s duplexes, triplexes, quadplexes, and six-plexes should be sought.
Lofts Loft style above businesses; no large apartment or condo
0%10%20%30%40%50%60%70%80%90%100%
Townhomes (attached single family homes) Apartment or condo buildings (2-3 stories) Apartment or condo buildings (4-6 stories) Apartment or condo buildings (6-8 stories) Duplex/triplex/quadplex
Q6 On a scale of 1 to 5 (with 1 being not supportive and 5 being very supportive), how supportive are you of furthering the development of the following housing types downtown.
think more so the luxury/formal items that are usually at the major malls. think that would be a good investment to have to be well rounded. Maybe a few more mid level dining options-enough of the fast food chains!
Q7 Currently, for what types of retail and/or services do you leave Fayetteville for, but would like to be able to do in Downtown in the future? Select all that apply.
Q8 Prioritize ways to improve walkability in Downtown by ordering the below options from 1 to 7, putting the highest priority first and lowest priority last. You can order the options by either using the drop down menu next to each option or by dragging each option into your preferred order using your mouse.
0%10%20%30%40%50%60%70%80%90%100%
Q9 Prioritize ways to support the local biking community in Downtown by ordering the below options from 1 to 6, putting the highest priority first and lowest priority last. You can order the options by either using the drop down menu next to each option or by dragging each option into your preferred order using your mouse.
Q10 On a scale of 1 to 5 (with 1 being not supportive and 5 being very supportive), how would the following solutions improve your experience driving in Downtown?
1-NOT
26 Traffic flow diversion Lowering speed limits would create better walkability, bike-abilty, as well as decreasing volume of traffic noise to afford more enjoyable outdoor dining experiences.
27 Traffic flow diversion Divert through (i.e., transit or not-stopping) traffic away from downtown area, to assist with congestion
28 Other More parking for what? There is nothing to do in Fayette Downtown and no room to grow. Like usual Fayetteville has built everything at street level which doesn't allow for any expansion of bike paths, walking paths, etc.
29
30
Stop wasting money on things which don’t produce value. If you aren’t sure what I mean, feel free to reach out to me. My husband is a developer and I am an executive consultant for Fortune 100 companies across the country.
31 Signage & Lighting The signage downtown looks too urban . The previous signage was more fitting for the historic district Probably too late to give an opinion but moving forward if we could just keep more of a historical feel to downtown and not try to urbanize the signage, street lighting, etc
GA 85. bigger turn lane from 85 south to west
do2/23/2021
AM 42 Parking only support a 2 level parking deck.2/22/2021
43 Traffic flow diversion Develop another way to drive around the square, instead of driving into the square as the only option.
44 Other Edible plants/trees/greenery only There's poverty here2/22/2021
46 Parking Additional parking will only be needed if fayetteville actually implements all the amazing downtown development plans we always hear about. At the moment, additional parking is not needed because there are not enough cool businesses and green spaces to draw in people.
PM
47 Other Decorative Lighting in trees2/22/2021 7:59 PM
48 Parking Parking for larger vehicles with higher height clearances2/22/2021 6:30 PM
49 Other more benches, tables or way to stop and enjoy the outdoors downtown2/21/2021 12:16 AM
50 Other Downtown is currently NOT pedestrian friendly and does NOT encourage me to walk around and patronize local businesses. I go to other city’s downtowns and feel safe walking around their squares. Our downtown sidewalks are small, uneven, and constantly have poles/manholes/objects blocking ADA ramps. The cars are so close to the sidewalks that I feel unsafe walking along the stretch of shops. I thi nk the parallel parking in front of the shops should be turned into wider sidewalk for bistro tables/seating and added buffer from cars. Slowing the cars would be beneficial as well.
51 Parking Off-street parking should not occupy prime street-frontage that could otherwise be the site of new development downtown; a deck, would allow parking to go vertical and occupy less real estate. On-street parking is great, but the priority in streetscape design needs to be on PEOPLE, not cars. I know a major component is getting GDOT to recognize this, but the latest on-street parking improvemen project along Stonewall Avenue was definitely still an auto-centric design. People-oriented design was not the preeminent issue for that project. Pedestrians actually are now forced to share storm water infrastructure as part of the design. . Just food for thought.
2/20/2021 9:45 PM
9:45 PM
Q11Prioritize the activities you would like to see future and existing parks and open space in Downtown used for by ordering the below options from 1 to 6, putting the highest priority first and lowest priority last. You can order the options by either using the drop down menu next to each option or by dragging each option into your preferred order using your mouse.
food booths, or other commercial activities to accommodate visitors
to appreciate nature (via enhanced landscaping, special plantings, benches for nature viewing, etc.)
3
Seating areas Water features
Community gathering spaces with commercial partnerships
2 Outdoor recreation people need a place to excercise outdoors via a pathway loop. We don't need more "memorials"
recreation Child friendly places always include a public bathroom!!!!3/2/2021
4 Outdoor recreation bike paths that bypass the square for through traffic3/2/2021
5 Dog Park We NEED a dog park. People are going to peachtree city for dog parks and they end up spending their money for food and other dog items in peachtree city. We have a Petsmart and Hollywood feed that would benefit from a dog park and put money in our local economy
6 Other Memorials? Whose? How long before some woke movement turn thumbs-down?2/25/2021
Q12
On a scale of 1 to 5 (with 1 being low priority and 5 being high priority), how much would you like to see the following amenities incorporated within Downtown’s greenspace and other public spaces?
9
10 Outdoor recreation Extend sidewalks out just a little further into the community do we can access the paths into downtown. There is little to no parking on the outskirts to provide access to entry into the sidewalk system.
11
Again, besides the old courthouse, where is there greenspace? And to call May Harp Park a "park" is laughable.
14
recreation Parks! Parks parks. We need at least one big nice park. With old growth trees, not trees pulled down and then replanted with dumb little tiny trees.
17
18
19
20
Make it look like savanaha- nice infrastructure, parks, walking, biking - you have to give folks a reason to want to be there - shopping, eating, entertainment
Park No dog parks! Breeding ground for germs; liability for the city/ county. People don't monitor their dogs. This is a BAD idea!
Stop letting churches in and hospice
pad Can we PLEASE GET A POOL . I've been waiting for 20+ years. Global warming is getting here!!
26
27
We need child friendly activities. It's sad that we have to leave our town and support another town to play, swim, watch fireworks and parades
Downtown feels like concrete and cars right now. Landscaping is badly needed to hide the cars from spaces and make downtown more pleasant and beautiful.
28 Dog Park A dog park is a MUST. I also encourage descision making members to actually walk around downtown (not drive) and experience what it is like for a walker/biker in our city.
each option into your preferred order using your mouse.
Q13 Prioritize the features you would like to see more of in Downtown by ordering the below options from 1 to 7, putting the highest priority first and lowest priority last. You can order the options by either using the drop down menu next to each option or by dragging
0%10%20%30%40%50%60%70%80%90%100%
Q14 Prioritize the following actions/investments for Downtown by ordering the below options from 1 to 10, putting the highest priority first and lowest priority last. You can order the options by either using the drop down menu next to each option or by dragging each option into your preferred order using your mouse.
0%10%20%30%40%50%60%70%80%90%100%
Q15 How did you find out about this survey?
ANSWERCHOICESRESPONSES
The Vision for moving Fayetteville Forward is to reimagine the possibilities in Downtown through catalytic equitable placemaking, enhanced legibility of the built environment, and creative guidelines for healthy, sustainable developments that will empower its diverse communities.


This Capital Improvements Element Annual Update has been prepared based on the rules and regulations pertaining to impact fees in Georgia, as specified by the Development Impact Fee Act (DIFA) and the Department of Community Affairs (DCA) documents Development Impact Fee Compliance Requirements and Standards and Procedures for Local Comprehensive Planning. These three documents dictate the essential elements of an Annual Update, specifically the inclusion of a financial report and a schedule of improvements.
According to DCA’s Compliance Requirements, the Annual Update:
“ … must include: 1) the Annual Report on impact fees required under O.C.G.A. 36-71-8; and 2) a new fifth year schedule of improvements, and any changes to or revisions of previously listed CIE projects, including alterations in project costs, proposed changes in funding sources, construction schedules, or project scope.” (Chapter 110-12-2.03(2)(c))
The Annual Update Financial Report covers FY 2021, while the Community Work Program is based on the most recent City of
1 Note that DCA’s Compliance Requirements specify that the work program is to meet the requirements of Chapter 110-12-1-.04(7)(a), which is a reference to the work program requirements in a previous version
Fayetteville Capital Improvements Element, which was adopted July 19, 2018.
The Financial Report included in this document is based on the requirements of DIFA, specifically:
“As part of its annual audit process, a municipality or county shall prepare an annual report describing the amount of any development impact fees collected, encumbered, and used during the preceding year by category of public facility and service area.” (O.C.G.A. 36-718(c))
The required FY 2021 financial information for each public facility category appears in the main financial table (page 2); each of the public facility categories has a single, city-wide service area. The status of all impact fee projects, by public facility category, is shown on the tables on pages 3, 4 and 5.
The City’s fiscal year runs from August 1 to July 31.
of the Standards and Procedures for Local Comprehensive Planning. The correct current description is found at Chapter 110-12-1.04(2)(b)1.
In addition to the financial report, the City has prepared a five-year schedule of improvements a community work program (CWP) as specified in DCA’s Compliance Requirements (Chapter 110-12-2-.03(2)(c)), which states that local governments that have a CIE must “update their entire Short Term [i.e., Community] Work Programs annually.”)1
According to DCA’s requirements,2 the CWP must include:
A brief description of the activity;
Legal authorization, if applicable;
Timeframe for undertaking the activity;
Responsible party for implementing the activity;
Estimated cost (if any) of implementing the activity; and,
Funding source(s), if applicable.
All of this information appears in the Community Work Program portion of this document, beginning on page 6.
2 Chapter 110-12-1-.03(3).
1 The refund was made in FY21 to address a collection error made in FY20 that was described in the Annual Impact Fee Financial Report - Fiscal Year 2020.
2CIE Prep is the cost of creating the original Capital Improvements Element, subsequent Annual Updates, and Amendments.
*Actual figures relatedtoimpact feefundingshownforcompletedprojects. SeeCIE forMaximum Fundingcalculation. All figures areshowninNet Present Value. Whenimpact fees wereinitially calculatedforthecarry-overprojects, theiractual constructioncosts werealready known. Becauseeachproject createdcapacity toservefuturegrowthand development, thepercentageofthecost that is impact feeeligiblewas calculatedbasedontheLevel ofServicestandards intheCapital Improvements Element, whichyieldedtheproportionofthe project that was requiredtomeet theneeds offuturegrowthanddevelopment.
** Thenotedprojects areeligibleforimpact feefundingbut wereinitially financedthroughtheissuanceofGO bonds. TheCity is recoupingtheimpact feeshareoftheportionofthedebt service attributabletotheprojects, totheextent ofthepercentageofthecosts that creatednewcapacity toservenewgrowthanddevelopment, but limitedtotheextent ofimpact feecollections and accumulations onhand. Becausethepaceofimpact feecollections cannot bepredicted, thedateat whichtherecoupment will becompletedcannot bedetermined NOTE: Forprojects that arenot 100% impact feefunded, fundingmay beprovidedfrom theGeneral Fund, theCapital Projects Fund, SPLOSTorotherlocal taxationsources, as determinedeachyear duringtheannual budget adoptionprocess.
Fire Protection
City-wide
*TheQuint andEnginewerepurchasedin2016and2018, respectively, withlease-purchasefinancing, andareincludedintheimpact feecalculations forrecoupment. All dollarfigures areshownin Net Present Value.
NOTE: Forprojects that arenot 100% impact feefunded, fundingmay beprovidedfrom theGeneral Fund, theCapital Projects Fund, SPLOSTorotherlocal taxationsources, as determinedeachyear duringtheannual budget adoptionprocess.
Police Department
*Actual figures relatedtoimpact feefundingshownforcompletedprojects. SeeCIE forMaximum Fundingcalculation. All dollarfigures areshowninNet Present Value.
Whentheimpact feewas initially calculatedforthis project (thePoliceHeadquarters), its actual constructioncost was already known. Becausetheproject createdcapacity toservefuturegrowth anddevelopment, thepercentageofthecost that is impact feeeligiblewas calculatedbasedontheLevel ofServicestandards intheCapital Improvements Element, whichyieldedtheproportionofthe project that was requiredtomeet theneeds offuturegrowthanddevelopment.
** ThePoliceHeadquarters is eligibleforimpact feefundingbut was initially financedandconstructedthroughtheissuanceofaGO bond. TheCity is recoupingtheimpact feeshareoftheportionof thedebt serviceattributabletotheproject, totheextent ofthepercentageofthecost that creatednewcapacity toservenewgrowthanddevelopment, but limitedtotheextent ofimpact feecollections andaccumulations onhand. Becausethepaceofimpact feecollections cannot bepredicted, thedateat whichtherecoupment will becompletedcannot bedetermined
NOTE: TheportionofthePoliceHeadquarters project that is not eligibleforimpact feefundingwas providedfrom taxes leviedandappliedtothebondissuesinkingfund.
NOTE: Forprojects that arenot 100% impact feefunded, fundingmay beprovidedfrom theGeneral Fund, theCapital Projects Fund, SPLOSTorotherlocal taxationsources, as determinedeachyear duringtheannual budget adoptionprocess.
NOTE: All dollarfigures areshowninNet Present Value.
NOTE: Forprojects that arenot 100% impact feefunded, fundingmay beprovidedfrom theGeneral Fund, theCapital Projects Fund, SPLOSTorotherlocal taxationsources, as determinedeachyear duringtheannual budget adoptionprocess.
3 Projects included in the most recently adopted Capital Improvements Element (7/19/18).